alberta teacher work load study · alberta teacher work. load study . ... hours worked by key task,...
TRANSCRIPT

ALBERTA TEACHER WORKLOAD STUDY DECEMBER 2015

i
Alberta Teacher Workload Study R.A. Malatest & Associates Ltd. Alberta Education December 2015
ACKNOWLEDGEMENTS
The research team would like to thank the Research Advisory Committee members: Doug Aitkenhead from Alberta Education; Sharon Vogrinetz and Sandra Johnston from the Alberta Teachers’ Association; and Brian Callaghan, and Scott McCormack from the Alberta School Boards Association. We would also like to thank the teachers, administrators, and central office staff who participated in the study. The study would not have been possible without their commitment and diligence.

ii
Alberta Teacher Workload Study R.A. Malatest & Associates Ltd. Alberta Education December 2015
EXECUTIVE SUMMARY
About the Alberta Teacher Workload Study
The Alberta Teacher Workload Study was commissioned to define and understand teachers’ workload in Alberta. The study was carried out to comply with commitments made under the Assurance for Students’ Act and the ensuing modified Framework Agreement. The Government of Alberta, the Alberta Teachers’ Association, and the Alberta School Boards Association formed a cooperative venture for coordinating and overseeing the project’s execution. The study provides stakeholders with a common, comprehensive assessment of the reality of teachers’ workload in Alberta to help guide future policy discussions and work negotiations amongst these parties. The issues reviewed included:
• The tasks performed by teachers in their role as teachers.• The time spent completing these tasks.• The obstacles faced by teachers in completing their professional duties.• The fluctuations in workload that occur throughout the school year.• The relationships between workload and school characteristics.
Populations of interest for the study included teachers at public, separate, and Francophone schools in Alberta; school administrators; and central office staff who are members of the Association Bargaining Unit. Five research instruments were designed and pilot tested to collect information about their work: two Summer Time Allocation Surveys, a Time Use Diary, a Workplace Experience Survey – teachers/administrators, a Workplace Experience Survey – Central Office Staff and a Central Office Staff Survey. The core data collection activity, the Time Use Diary, required teachers and administrators to complete a daily log of activities once a week for ten months (September to June). Work activities were logged in 30-minute intervals.
In total 3,374 teachers, 357 administrators, and 173 central office staff were recruited to participate in the study. Participants were employed in full-time equivalent positions. All surveys were completed online, following email invitations. Reminder emails were used to encourage registered participants to complete the surveys. Telephone reminder calls were also used to remind teachers and administrators to complete the Time Use Diary. Demonstrated in Table A.1 are the final response rates for each survey.
Table A.1: Response Rates by Respondent Group
Respondent Group Teachers Administrators Central OfficeStaff
Summer Allocation Survey - July 2,778 (82%) 292 (82%) Summer Allocation Survey - August 1,884 (56%) 139 (40%) Workplace Experience Survey 1,583 (50%) 128 (35%) 56 (32%) Central Office Staff Survey 1 139 (80%)
Central Office Staff Survey 2 56 (32%) Time Use Diary (8+ Months of Logs) 1,826 (54%) 143 (40%)
iii
Alberta Teacher Workload Study R.A. Malatest & Associates Ltd. Alberta Education December 2015
To calculate the average work time, the study utilized a diary approach in which respondents recorded hours worked by key task, before, during, and after the school day (8:00 am to 4:30 pm), and on weekends. Respondents were provided with a cohort week each month for which they provided data for a seven-day period. The analysis, therefore, included time worked over forty-four weeks (September to June). Participants were asked to provide data for holiday days, including weeks in which schools were closed. These weeks, which typically included zero or limited hours worked, were included in the computation of the average work week, but were removed as outliers when calculating the typical work week. How and When Teachers and Administrators Work (Time Use Diary Findings) Considering all hours worked, including regular school hours, before and after school hours, and weekend work, both teachers and administrators completed more than 40 hours of work a week (Teachers: 44.2 hours and Administrators: 46.2 hours). Teachers worked 40 or more hours in 74% of the reported weeks, while administrators did so for 78% of the reported weeks. Excluding outlier weeks (Christmas break, Spring Break and Last week of June), the typical work week for a teacher was 48 hours and for an administrator it was 50 hours. Between September and June, teachers worked 1,943.9 hours and administrators worked 2,032.1 hours, on average. These hours include a significant number of early morning, evening and weekend hours (457.5 hours teachers; 515.0 hours administrators). Teachers worked from 8.0 to 8.7 hours per day, Monday through Thursday, and 7.1 hours on Fridays. Administrators generally worked more hours during the week, from 8.5 to 9.1 hours daily, Monday through Thursday, and 7.6 hours on Fridays. On the weekends, teachers and administrators worked similar hours (3.5 hours and 3.3 hours, respectively). The average weekly hours worked by teachers and administrators varied considerably over the year, in alignment with school schedules. Both teachers and administrators had longer hours at the beginning of the school year, in September (49.7 weekly hours teachers; 52.8 weekly hours administrators) and October (49.7 weekly hours teachers; 52.1 weekly hours administrators), and during March (48.2 weekly hours teachers; 49.7 weekly hours administrators). In December, when schools have holidays, teachers and administrators worked fewer hours, on average (35.9 and 37.3 weekly hours, respectively). Teachers and administrators worked more hours per week in September (49.7 hours per week teachers; 52.8 hours per week administrators), October (49.7 hours per week teachers; 52.1 hours per week administrators), and March (48.2 hours per week teachers; 49.7 hours per week administrators). Teachers spent most of school hours instructing students. Thus, much of their assessment/grading and preparatory activities were completed in the evenings and on weekends. During the school hours, teachers spent most of their time instructing students (59% of the day), followed by planning and preparing for instruction (22% of the day). . During the hours after school, teachers spent the most time on planning (40%), and assessment and grading (29%). Similarly, the activities that teachers spent the most time on over the weekends were

iv
Alberta Teacher Workload Study R.A. Malatest & Associates Ltd. Alberta Education December 2015
planning (40%), and assessment and grading (38%). Among administrators, most (60%) reported engaging in both teaching and administration. During school hours, administrators spent most of their time on administration activities (19%) and working with students (15%). During the hours after school, administrators spent time on administration activities (21%), professional development, meetings (17%), and other activities (17%). Similarly, they also spent their weekend work time on administration tasks (27%) and other activities (19%). Teachers who completed the Time Use Diary, and did not have an additional contract, worked an average of 23.1 hours in July and 55.2 hours in August, while administrators who completed the Time Use Diary and did not have an additional contract worked 38.9 hours in July and 93.3 hours in August. How Teachers and Administrators Work Over the Summer (Summer Time Allocation Survey Findings) In addition to their work during the school year (September to June), the majority of teachers and administrators worked in July (71% teachers; 87% administrators) and August (99% teachers; 99% administrators). Teachers who worked in the summer used the summer months to plan (85% July; 99% August) and organize/acquire materials (75% July; 96% August) for the upcoming school year. In August, many teachers had staff and committee meetings (81%), general administration (50%), and professional development (42%) tasks to complete. Similarly, administrators who worked in the summer also spent the summer months preparing for the upcoming school year. This included staffing (51% July; 76% August), planning school schedules (49% July; 92% August) and education programs (40% July; 81% August), and monitoring and maintaining school facilities (45% July; 63% August). Administrators also communicated with parents (44% July; 77% August) and managed budgets and resources (42% July; 77% August) during the summer. The summer of 2014 had a similar workload for the majority of teachers (63% July; 73% August) and administrators (61% July; 69% August) compared to previous years. Among those whose work hours were not comparable in the summer of 2014, approximately one-half of the teachers perceived that they worked a somewhat or significantly higher number of hours. Many teachers (44% July; 42% August) indicated that their position or teaching assignment would be changing in the upcoming school year. How Teachers, Administrators and Central Office Staff Feel About their Work (Workplace Experience Survey Findings) Overall, the majority of teachers (69%) and administrators (81%) were satisfied with their jobs and believed that their work time was well spent (66% teachers; 79% administrators). Teachers and administrators commonly attributed their satisfaction with their jobs to:
• Working relationships (89% teachers; 95% administrators); • Perceived value of work (69% teachers; 75% administrators); • Job security (66% teachers; 48% administrators); and • Professional development opportunities (44% teachers; 59% administrators).

v
Alberta Teacher Workload Study R.A. Malatest & Associates Ltd. Alberta Education December 2015
Both teachers and administrators were, however, less satisfied with the: • Amount of time they spent on work-related activities (34% teachers; 49% administrators); • Amount of time they had to collaborate with colleagues (32% teachers; 35% administrators);
and • Work-life balance (26% teachers; 30% administrators).
The factors to which teachers and administrators attributed their dissatisfaction with their work were:
• Workload (91% teachers; 96% administrators); • Perceived value of the work they do (70% teachers; 59% administrators); • Working hours (48% teachers; 67% administrators); and • Social or family demands (42% teachers; 33% administrators).
Compared to last year, the majority of both teachers and administrators noted that there had been an increase in workload (65% teachers; 62% administrators), multi-tasking (76% teachers; 69% administrators), unfamiliar tasks (66% teachers; 59% administrators), and overall complexity of their work (75% teachers; 77% administrators). Teachers also reported that they were spending a significant part of their day (59.29 minutes cumulatively, on average) completing a large number of microtasks during the teaching day. Microtasks are tasks performed during the progress of other activities which take a small amount of time. Microtasks commonly included sending emails or texts (93%) and interacting with colleagues in-person (90%). Teachers agreed that microtasks interrupted their work-related task performance (76% teachers) and contributed to their work-related stress (81% teachers). Central office staff were generally highly satisfied with their work (78%) and believed that their work time was well spent (80%). Half or more of the central office staff were also satisfied with the:
• Amount of time they spent on work-related activities (67%); • Amount of time they had to collaborate with colleagues (58%); and • Work-life balance (47%).
The factors that most commonly contributed to central office staff satisfaction were working relationships (86%), perceived value of their work (73%), and professional development opportunities (59%). In contrast, workload (92%) and perceived value of the work completed (83%) contributed to dissatisfaction among central office staff. As with teachers, central office staff reported spending a large amount of time on microtasks during their day (84 minutes cumulatively, on average), including sending emails or texts (98%) and interacting with colleagues in-person (93%). Central office staff reported that these microtasks:
• Interrupted their work-related task performance (56%); and • Contributed to work-related stress (53%).
How and When Central Office Staff Work (Central Office Staff Survey Findings) On average, central office staff had an 8.5 hour regularly scheduled work day. As with teachers and administrators, however, many central office staff (93%) reported working outside of the regular schedule.

vi
Alberta Teacher Workload Study R.A. Malatest & Associates Ltd. Alberta Education December 2015
Weekly, central office staff spent an average of 9.4 to 10.5 hours working outside of their regular schedule. Work outside of their regular hours was most commonly completed in the evenings (95% Survey 1; 98% Survey 2) or on the weekends (79% Survey 1; 87% Survey 2). Few of the central office staff had a provision for taking time off in lieu of working outside their regular working day (21% Survey 1; 13% Survey2). However, the majority of those who did have this provision, made use of it (76% Survey 1; 57% Survey2). Central office staff spent their work time working with teachers (87% Survey 1; 88% Survey 2), and developing, assessing, or selecting curriculum materials and professional development workshops (88% Survey 1; 80% Survey 2). Central office staff also often completed administrative tasks such as responding to/writing emails (98% Survey 1; 96% Survey 2), communicating with colleagues (84% Survey 1; 88% Survey 2), and record keeping (80% Survey 1 and 2). Approximately one-half of central office staff felt that their workload overall had increased since last year (56% Survey 1; 48% Survey 2). However, most indicated that the overall complexity of their work (66% Survey 1; 64% Survey 2) and the amount of multi-tasking they were required to complete (65% Survey 1; 63% Survey 2) had increased. Increases in workload and work complexity were attributed to:
• Higher work demands (71% Survey 1; 76% Survey 2); • Increased enrollment of high-needs students (54% Survey 1; 56% Survey 2); and • Requests or pressure from the school district/authority or board management (48% Survey 1;
46% Survey 2). The majority of central office staff worked during the summer months, regardless of whether or not their contract included summer work. In the summer, those that worked commonly completed research for the upcoming year (80%), responding to work related emails (64%), and engaged in professional development activities and conferences (53%).

Alberta Teacher Workload Study R.A. Malatest & Associates Ltd. Alberta Education December 2015
TABLE OF CONTENTS
ACKNOWLEDGEMENTS ................................................................................................................................................... I
EXECUTIVE SUMMARY ................................................................................................................................................... II
SECTION 1. INTRODUCTION ...................................................................................................................................... 1
1.1 BACKGROUND ..................................................................................................................................................... 1 1.2 ALBERTA TEACHER WORKLOAD STUDY OBJECTIVES ..................................................................................................... 1
SECTION 2. METHODOLOGY ..................................................................................................................................... 2
2.1 PHASE ONE: PILOT STUDY ...................................................................................................................................... 2 2.1.1 Instrument Design .................................................................................................................................. 2 2.1.2 Pilot Testing ........................................................................................................................................... 3
2.2 PHASE TWO: TEACHER WORKLOAD STUDY ................................................................................................................ 4 2.2.1 Sampling and Recruiting ........................................................................................................................ 4 2.2.2 Data Collection ....................................................................................................................................... 5 2.2.3 Response Rates ...................................................................................................................................... 7 2.2.4 Data Cleaning ........................................................................................................................................ 8 2.2.5 Time Use Diary Final Sample ................................................................................................................ 11 2.2.6 Data Analysis ....................................................................................................................................... 15 2.2.7 Limitations ........................................................................................................................................... 18
SECTION 3. FINDINGS: TIME USE DIARY ................................................................................................................. 19
3.1 OVERALL HOURS WORKED ............................................................................................................................ 19
3.1.1 Daily (5 am to midnight) ...................................................................................................................... 19 3.1.2 Weekly (Monday to Sunday from 5 am to midnight)........................................................................... 19 3.1.3 Monthly ................................................................................................................................................ 23 3.1.4 School Year........................................................................................................................................... 24
3.2 WORK OUTSIDE OF REGULAR SCHOOL HOURS ............................................................................................. 25
3.2.1 Hours Worked Outside of Regular Hours by Week Day ....................................................................... 25 3.2.2 Hours Worked Outside of Regular Hours by Week .............................................................................. 25 3.2.3 Hours Worked Outside of Regular School Hours by Month ................................................................. 30 3.2.4 Number of Days Teachers and Administrators Worked Outside of Regular School Hours .................. 32
3.3 HOURS WORKED AND SATISFACTION ........................................................................................................... 34
3.4 WORK ACTIVITIES .......................................................................................................................................... 35
3.4.1 WEEKDAY WORK ACTIVITIES ......................................................................................................................... 35
3.4.2 WEEKEND WORK ACTIVITIES ......................................................................................................................... 39
SECTION 4. FINDINGS: SUMMER TIME ALLOCATION SURVEY ................................................................................ 40
4.1 FINDINGS FOR TEACHERS/ADMINISTRATORS THAT WORKED IN THE SUMMER ................................................................ 42
SECTION 5. FINDINGS: WORKPLACE EXPERIENCE SURVEY ..................................................................................... 48

Alberta Teacher Workload Study R.A. Malatest & Associates Ltd. Alberta Education December 2015
5.1 TEACHER AND ADMINISTRATOR FINDINGS ............................................................................................................... 48
5.1.1 HOURS WORKED OUTSIDE OF SCHOOL HOURS ............................................................................................ 48
5.1.2 WORK ENVIRONMENT................................................................................................................................... 49
5.1.3 WORK SATISFACTION .................................................................................................................................... 53
5.2 CENTRAL OFFICE STAFF FINDINGS .......................................................................................................................... 58
5.2.1 WORK ENVIRONMENT................................................................................................................................... 58
5.2.2 WORK SATISFACTION .................................................................................................................................... 59
SECTION 6. FINDINGS: CENTRAL OFFICE STAFF SURVEY ......................................................................................... 62
6.1.1 HOURS WORKED ........................................................................................................................................... 62
6.1.2 WORK IN SUMMER MONTHS ........................................................................................................................ 66
SECTION 7. CONCLUSIONS ...................................................................................................................................... 67

1
Alberta Teacher Workload Study R.A. Malatest & Associates Ltd. Alberta Education December 2015
SECTION 1. INTRODUCTION
1.1 Background
The Alberta Teacher Workload Study was commissioned to define and understand teachers’ workload in Alberta. The study was carried out to comply with commitments made under the Assurance for Students’ Act and the ensuing modified Framework Agreement. The Government of Alberta, the Alberta Teachers’ Association, and the Alberta School Boards Association formed a cooperative venture for coordinating and overseeing the project’s execution. The study provides stakeholders with a common, comprehensive assessment of the reality of teachers’ workload in Alberta to help guide future policy discussions and work negotiations amongst these parties. Populations of interest for the study included teachers at public, separate, and Francophone schools in Alberta; as well as school administrators; and central office staff who are members of the Association Bargaining Unit. The study was conducted in two phases. Phase one consisted of a pilot study used to design and evaluate the research methodology and survey instruments. Phase two collected data from the population of interest across ten months – September 2014 to June 2015 – utilizing Time Use Diary. Both teachers and administrators completed a Diary for one week in each of the ten months such that, for most respondents, 10 weeks of data was provided. In addition to the Time Use Diary, teachers and school administrators completed two rounds of a Summer Time Allocation Survey and a Workplace Experience Survey. Central office staff completed a Workplace Experience Survey, as well as a survey to estimate their work hours.
1.2 Alberta Teacher Workload Study Objectives
The objectives of the study were to account for the variety of different teaching experiences in schools across the province, and to identify the factors that affect workload and the relationships between these factors. The topics reviewed in the study included:
• The tasks performed by teachers in their role as teachers. • The time spent completing these tasks. • The amount of time and resources provided to teachers to complete tasks during the
operational days in the school calendar. • The obstacles faced by teachers in completing their professional duties, and the changes to
workload that teachers identify that could impact their ability to teach. • The fluctuations in workload that occur throughout the school year. • The relationships between workload and school characteristics, including school size, school
type, geographic location, and socio-economic status. Recommendations were not part of the research project. Only the data and a full data analysis were provided to Alberta Education. All work was completed in consultation with the Research Advisory Committee, consisting of representatives from the Government of Alberta, the Alberta Teachers’ Association, and the Alberta School Boards Association.

2
Alberta Teacher Workload Study R.A. Malatest & Associates Ltd. Alberta Education December 2015
SECTION 2. METHODOLOGY
2.1 Phase One: Pilot Study
Phase one included the design of the research methodology and instruments, translation of all instruments into French, as well as the piloting of the Time Use Diary, Registration Page and the Central Office Staff Survey. 2.1.1 Instrument Design Five research instruments were designed for the study.
• Summer Time Allocation Survey was designed to collect information on teachers’ and administrators’ work activities in July and August. The Summer Time Allocation Survey was intended to be completed twice: once in July and once in August. See Technical Appendix for the survey instrument.
• Time Use Diary required that teachers and administrators log daily work activities in 30-minute increments from 5 am to midnight for a full week, running from Monday to Sunday. These logs were completed on a four-week cycle – approximately once per month. Drop down menus provided activities from which teachers and administrators could choose. Activities were grouped into 10 categories for teachers (32 activities) and 11 categories for administrators (30 activities). Respondents could log up to three activities in a 30-minute period. Work activities completed from midnight up to 5 am could be described in a separate section of the Diary. If the respondent did not complete work activities in a day, they could opt out of completing the log for the day by choosing an option of “no work activities” and offering an explanation. Information on participation in extra-curricular activities and professional development was also collected. See Technical Appendix for the Time Use Diary and teacher and administrator activity descriptions.
• Workplace Experience Survey – Teachers/Administrators collected information on teachers’ and administrators’ attitudes and perceptions towards their workload, and how workload had changed over the last year. Characteristics of the classroom, school and work environment were also collected.
• Workplace Experience Survey – Central Office Staff was adapted from the teacher/administrator Workplace Experience Survey. It collected information on central office staff’s attitudes and perceptions towards their workload, and how workload had changed over the last year.
• Central Office Staff Survey was designed for central office staff and measured work time in an average week, as well as changes in workload and summer work. The survey was designed to be completed twice: once in November (Survey 1) and once in May (Survey 2). See Technical Appendix for the survey.

3
Alberta Teacher Workload Study R.A. Malatest & Associates Ltd. Alberta Education December 2015
By respondent group, the four research instruments were designed to be completed by:
Table 2.1: Instruments by Respondent Group
Respondent Group Summer
Allocation Survey
Time Use Diary Workplace Experience
Survey
Central Office Staff Survey
Teachers Administrators
Central Office Staff In addition to the survey instruments, a Registration Form was developed during phase one of the study.
• Registration Form (2 versions) was developed for both teachers and administrators (one form) that collected background information on the participant and his/her workplace. Specifically, information on teacher’s role, years of teaching experience, gender, subjects and grades taught, and highest level of education completed was collected. The form also collected information about the school in which the respondent taught, including school size, school location, grades in the school, school authority and the size of the community in which the school was located. Based on the teacher/administrator registration form a registration form was also developed for the central office staff which collected information on consultant role, groups and communities worked with, years under contract, gender, and level of education.
2.1.2 Pilot Testing The Time Use Diary, Central Office Staff Survey and the Registration Form were pilot tested in phase one, initially using a teacher/administrator focus group. The modified Time Use Diary and the Registration Form were then piloted with a sample of teachers and administrators over a seven day period. Time Use Diary On May 15, 2014 a focus group was held with seven teachers and administrators in Edmonton to test the Registration Form, Time Use Diary, and accompanying website. Minor changes were made to the usability, appearance, and content of the Time Use Diary and the Registration Form in response to focus group participants’ feedback. The Time Use Diary was piloted from May 20, when registration opened, to June 1, 2014, the final activity log day. Respondents completed the registration and a daily activity log for seven days. On the last day, respondents completed a five minute survey to provide feedback on the pilot study. Of the 321 individuals invited to participate, 151 registered and 121 completed all seven daily activity logs. A total of 103 respondents completed the Pilot Study Questionnaire. Minor changes were made to the Diary as a result of the pilot.

4
Alberta Teacher Workload Study R.A. Malatest & Associates Ltd. Alberta Education December 2015
Central Office Staff Survey On October 15, 2014 a focus group was held with six central office staff in Edmonton to test the usability and content of the Registration Form and the Central Office Staff Survey. Minor changes were made to both the Registration Form and the Survey as a result of participants’ feedback.
2.2 Phase Two: Teacher Workload Study
2.2.1 Sampling and Recruiting Teachers and Administrators Recruitment of teachers and administrators occurred between June 10, 2014 and July 1, 2014. A randomly selected group of 7,500 teachers and 744 administrators were invited by email to register. As recruitment occurred at the end of the previous school year, first year teachers were not included in the study. Invitations were followed by email and telephone reminders to teachers and administrators who had neither registered nor opted out of the registration. The sample of 7,500 teachers was randomly selected to be representative of school authority (public, separate, Francophone), region size (rural, small city, medium city, large city), and Education Zone (1, 2, 3, 4, 5, 6). Participants were required to fully complete the Registration Form to be included in the study. Registrations exceeded the registration goal of 1,875 teachers and 188 administrators. Teachers and administrators that requested to be added to the study after the closure of registration process, but before the start of data collection in September, were included.
Table 2.2a: Study Registration: Teachers and Administrators
Teachers Administrators Population 25,150 3,515 Recruitment Target 1,875 188 Final Registered Sample 3,374 357
5
Alberta Teacher Workload Study R.A. Malatest & Associates Ltd. Alberta Education December 2015
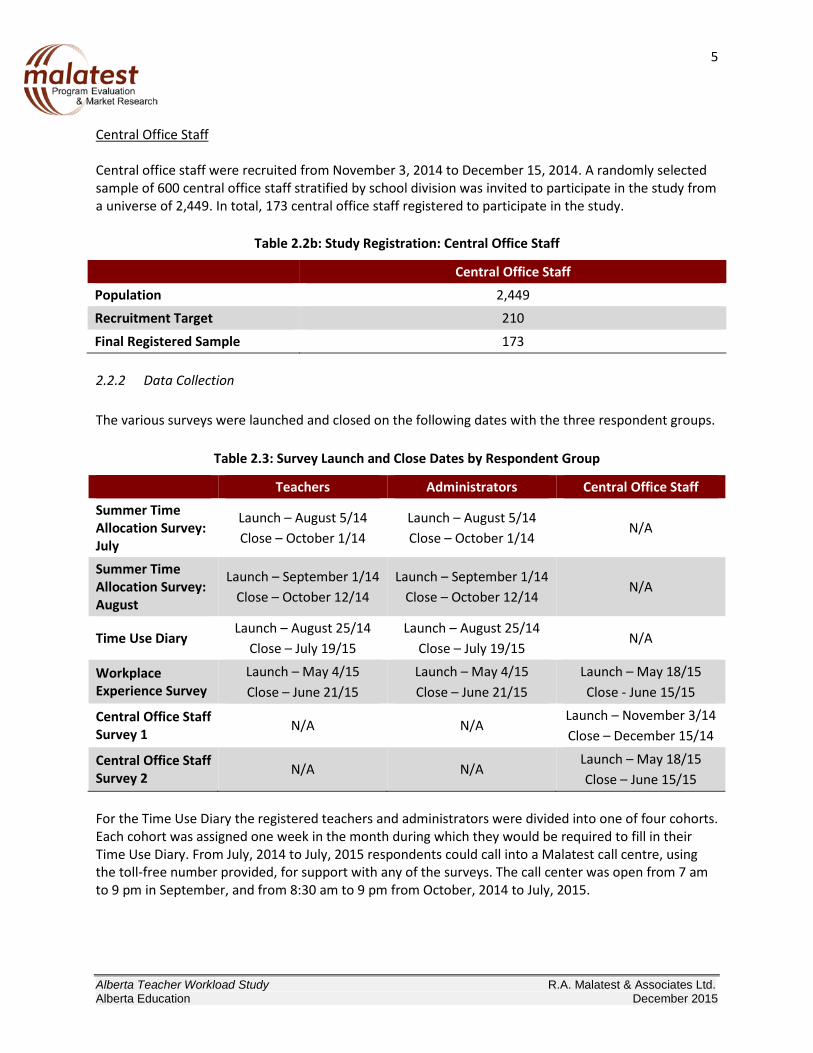
Central Office Staff Central office staff were recruited from November 3, 2014 to December 15, 2014. A randomly selected sample of 600 central office staff stratified by school division was invited to participate in the study from a universe of 2,449. In total, 173 central office staff registered to participate in the study.
Table 2.2b: Study Registration: Central Office Staff
Central Office Staff Population 2,449 Recruitment Target 210
Final Registered Sample 173 2.2.2 Data Collection The various surveys were launched and closed on the following dates with the three respondent groups.
Table 2.3: Survey Launch and Close Dates by Respondent Group
Teachers Administrators Central Office Staff Summer Time Allocation Survey: July
Launch – August 5/14 Close – October 1/14
Launch – August 5/14 Close – October 1/14
N/A
Summer Time Allocation Survey: August
Launch – September 1/14 Close – October 12/14
Launch – September 1/14 Close – October 12/14
N/A
Time Use Diary Launch – August 25/14
Close – July 19/15 Launch – August 25/14
Close – July 19/15 N/A
Workplace Experience Survey
Launch – May 4/15 Close – June 21/15
Launch – May 4/15 Close – June 21/15
Launch – May 18/15 Close - June 15/15
Central Office Staff Survey 1 N/A N/A
Launch – November 3/14 Close – December 15/14
Central Office Staff Survey 2 N/A N/A
Launch – May 18/15 Close – June 15/15
For the Time Use Diary the registered teachers and administrators were divided into one of four cohorts. Each cohort was assigned one week in the month during which they would be required to fill in their Time Use Diary. From July, 2014 to July, 2015 respondents could call into a Malatest call centre, using the toll-free number provided, for support with any of the surveys. The call center was open from 7 am to 9 pm in September, and from 8:30 am to 9 pm from October, 2014 to July, 2015.

6
Alberta Teacher Workload Study R.A. Malatest & Associates Ltd. Alberta Education December 2015
Summer Time Allocation Survey (July, 2014 and August, 2014) The July version of the Summer Time Allocation Survey was sent to both teachers and administrators in August, while the August version was sent to registered participants in September during their cohort week. Registered respondents had between seven (August) and nine (July) weeks to complete the survey. Up to three reminder emails were sent to those who did not complete the survey. Time Use Diary Registered teachers and administrators were required to complete the Time Use Diary once a week for ten months from September 1, 2014 to June 30, 2015. One cohort began the study on August 25, 2014 and one cohort ended the study on July 19, 2015. Whether participants complete the Diary during the first, second, third or fourth week of the month was dependent upon the cohort to which they were assigned. Participants were sent an email invitation to complete the Diary on Friday before their cohort week began. The week ran from Monday to Sunday. If the individual did not complete a Diary log on a specific day, he/she were sent an email reminder the next day. If the individual did not complete all seven days of Diary logs by midnight on Sunday, he/she began receiving email reminders the following Monday. Email reminders were then sent for two weeks on the Monday and Thursday of each week. Participants could choose to opt out of reminder emails by calling or emailing Malatest, or filling out a section in the Time Use Diary. Should a participant not complete a Daily log for two days in a row during their cohort week, he/she received a telephone reminder call on the third day. Workplace Experience Survey The Workplace Experience Survey for teachers and administrators was launched on May 4, 2015 and closed on June 21, 2015. For ease of use the Workplace Experience Survey was attached to the Time Use Diary on the Tuesday of the respondents’ weekly log. Reminders followed the same pattern as the Time Use Diary. The Workplace Experience Survey for central office staff was launched on May 18, 2015 as part of the second iteration of the Central Office Staff Survey. Both the Work Experience Survey for central office staff and the Central Office Staff Survey (second iteration) closed on June 15, 2015. Central Office Staff Survey (November/December, 2014 and May/June, 2015) The Central Office Staff Survey was sent to registered participants on November 3, 2014 and May 18, 2015. Participants had approximately two months to complete each survey and received regular reminders to complete the survey if they had not yet done so.

7
Alberta Teacher Workload Study R.A. Malatest & Associates Ltd. Alberta Education December 2015
2.2.3 Response Rates Response rates for the Summer Time Allocation Survey (July and August), Workplace Experience Survey, and Central Office Staff Survey are provided in Tables 2.4a and 2.4b.
Table 2.4a: Response Rates by Respondent Group and Instrument
Respondent Group Teachers Administrators Central Office Staff
Summer Allocation Survey - July 2,778 (82%) 292 (82%) Summer Allocation Survey - August 1,884 (56%) 139 (40%) Workplace Experience Survey 1,583 (50%) 128 (35%) 56 (32%)
Central Office Staff Survey 1 139 (80%) Central Office Staff Survey 2 56 (32%)
Response rates were calculated based on the number of registered participants The valid sample for the July Summer Allocation Survey (launched in August) was based on the total number of teachers and administrators who registered for the study. As noted in Table 2.5 (below), 2,690 teachers and 224 administrators completed at least one month of logs. The valid sample for the August Summer Allocation Survey (launched in September) is based on the number of teachers and administrators who completed at least one monthly log.
Table 2.4b: Valid Response Rates by Respondent Group and Instrument
Respondent Group Teachers Valid Sample
Teachers Valid Response Rate
Administrators Valid Sample
Administrators Response Rate
Summer Allocation Survey - July 3,374 82% 357 82%
Summer Allocation Survey - August 2,690 70% 224 62%
Workplace Experience Survey 2,690 59% 224 57%

8
Alberta Teacher Workload Study R.A. Malatest & Associates Ltd. Alberta Education December 2015
Table 2.4c demonstrates the valid response rate for each month of the Time Use Diary administration, based on a total valid sample of 2,690 teachers and 224 administrators. Response rates reflect the proportion of the sample that provided a full week (seven days) of data during the month. To avoid double counting respondents during months that had five weeks of data (October, January, April, June), only the first four weeks of data were used to calculate the monthly response rates. In general, response rates decreased gradually as the study progressed.
Table 2.4c: Time Use Diary Valid Response Rate by Month
Month Teachers Completions Teachers Valid Response Rate
Administrators Completions
Administrators Response Rate
1 2,364 88% 206 92%
2 2,243 83% 200 89%
3 2,155 80% 198 88%
4 2,139 80% 185 83%
5 2,083 77% 190 85%
6 1,885 70% 167 75%
7 1,894 70% 166 74%
8 1,833 68% 156 70%
9 1,796 67% 154 69%
10 1,770 66% 151 67%
2.2.4 Data Cleaning Summer Time Allocation, Workplace Experience and Central Office Staff Surveys The data from the Summer Time Allocation Survey, Workplace Experience Survey and Central Office Staff Survey was reviewed for completeness prior to data analysis. Data cleaning included a review for incomplete or missing data and internal record consistency, as well as search for duplicate records. Open-ended responses were coded using code lists, and “other” category codes were re-coded into existing categories as appropriate. For all of the aforementioned surveys, all of the respondents that completed the survey were included in the final analysis found in Sections 4: Summer Time Allocation Survey, Section 5: Workplace Experience Survey, and Section 6: Central Office Staff Survey of this report.

9
Alberta Teacher Workload Study R.A. Malatest & Associates Ltd. Alberta Education December 2015
Time Use Diary The data from the Time Use Diary was cleaned in multiple steps prior to analysis and reporting of the findings presented in Section 3 of the report. In total 3,374 teachers registered to participate in the study, of which 2,690 filled out a weekly log for at least one month. As the goal of the study was to observe teachers’ workload over the course of an entire school year, teachers who provided any partial data (i.e., less than eight months for the year) were not included in the final analysis. The analysis, therefore, included the same teachers each month, rather than the teachers included in the analysis varying each month. A total of 1,524 teachers filled out their weekly logs for eight or more months, while 1,166 filled out their logs for seven or fewer months (see Table 2.5). Among the 357 administrators that registered to participate in the study, 224 filled out a weekly log for at least one month, with 117 that filled it out for eight or more months.
Table 2.5: Total Number of Log Months Completed by Teachers and Administrators
Respondent Group 10 9 8 7 6 5 4 3 2 1 8+ Months
Teachers 373 670 481 256 186 144 126 125 160 169 1,524 Administrators 30 53 34 30 18 13 9 10 12 15 117
Data Cleaning: In order to be included in the final sample, teachers/administrators needed to complete four or more workdays a week for the eight months or more throughout the year. When teachers or administrators did not complete a log entry, they could provide a reason for the skipped day. The reasons provided were used to complete participant log records. If no reason was provided, the individual was coded as having completed no work-related activity for that day and assigned zero hours. Where a reason for a skipped log entry was provided, the participant’s log data was updated. Depending on the reason provided, the record was coded to reflect that there were no work-related activities on the day in question, or work hours were imputed for the day (see Table 2.6). To assist with the resolution of missing data, school holiday calendars were used to assign zero hours (no work-related activity) for day when schools were closed, e.g., spring break, statutory holidays.

10
Alberta Teacher Workload Study R.A. Malatest & Associates Ltd. Alberta Education December 2015
Table 2.6: Treatment of Incomplete Log Days
Type of Day Data Rule
Normal Assign 0 value Snow Assign 0 value Sick Day Assign 0 value Professional Day Impute average
Extracurricular (field trip, track meet, tournament, sports day) Impute average Stat Holiday Assign 0 value Personal Leave Assign 0 value Assessment (proctoring exams, marking, preparing report cards) Impute average
Addressing participants with missing days in their logs increased the number of teachers and administrators with eight months or more of data (see Table 2.7).
Table 2.7: Total Number of Log Months Completed by Teachers and Administrators Prior to Trim
Respondent Group 10 9 8 7 6 5 4 8+ Months
Teachers 1,438 302 162 119 96 82 37 1,902 Administrators 110 22 17 18 8 11 1 149
After the missing data was resolved, the data file was trimmed to exclude outlier entries (data points falling outside of the normal distribution). This was achieved by trimming the top 2% and the bottom 2% of the sample; i.e., removing participants whose total hours were in the top 2% of the sample or the bottom 2% of the sample. To ensure that the data trimming did not disproportionately impact a specific school type (e.g., elementary schools, high schools), the data file was trimmed by school type. Following cleaning and trimming, 1,826 teachers and 143 administrators were included in the final sample. Missing Data: After the data file was cleaned and trimmed, there was a portion of respondents who were missing data for one or more work days (Monday to Friday). A total of 318 teachers (17%) and 27 administrators (19%) did not complete their diary logs on all five work days for the duration of the study. In these situations, the respondent did not complete any portion of the activity log for a specific date, leaving it completely blank. As a result, this missing data was not resolved during the data cleaning stage. To complete the work day data, the decision rules used for cleaning the data were applied to the missing data. School calendars were used to determine dates when schools were closed. If an missing day fell on a date that a school was closed, the respondent was assigned zero hours for work on that day. If the missing day fell on a work day, the respondent was assigned the imputed average for that day. In two instances, two teachers did not provide any work day data for one week, but completed entries for the weekend. In these two instances, it was assumed that the teachers did not work during the week and were assigned zero for work-related hours for Monday to Friday of that week.

11
Alberta Teacher Workload Study R.A. Malatest & Associates Ltd. Alberta Education December 2015
Imputing Averages: For days where work hours were imputed from averages, averages were calculated in three stages. Respondents were first coded as a teacher or administrator, and then by the type of school where they worked; elementary, middle, high, elementary/middle, or comprehensive (see Table 2.8). The average hours worked on the specific day by other respondents working in a similar role at a similar school type was calculated. This average was then used as the imputed value for respondents with missing data. For example, if the decision rules indicated that an elementary school teacher who was missing data for the second Wednesday in October should receive the imputed average, that teacher would get the average hours reported for the second Wednesday in October by other elementary school teachers. 2.2.5 Time Use Diary Final Sample Teachers The teachers included in the final Time Use Diary sample exhibited a wide range of teaching experience. On average, teachers had 15.3 years of teaching experience, although, they spanned from those who had recently completed their first year of teaching to those with 42 years of teaching experience. As demonstrated in Table 2.8, the majority of teacher respondents were female (76%) and taught in the public school system (78%). The sample was divided between those who taught in communities with populations smaller than 30,000 (41%) and in communities larger than 100,000 residents (42%). The remaining 17% of teachers taught in communities with populations between 30,000 and 100,000 (17%). The final sample represented the population of Alberta teachers fairly well in terms of school authority type and community size, though separate school and urban teachers were slightly over-represented. Public and rural teachers were slightly under-represented in the final sample. Given the close approximation of the sample to the universe, data weighting was not required.

12
Alberta Teacher Workload Study R.A. Malatest & Associates Ltd. Alberta Education December 2015
Table 2.8: Teacher Profile
% of Respondents
Number of Respondents
% of Alberta Teacher
Universe** Gender*
Female 76% 1,391 N/A Male 24% 434 N/A
School Authority Type Public 78% 1,429 75%
Separate 20% 372 24% Francophone 1% 25 1%
Community Size Rural/small community (<1,000 to 29,999) 41% 749 38%
Medium community (30,000 to 99,999) 17% 304 17% Urban centre (100,000 +) 42% 773 46%
School Type Elementary (grades 6 and under only) 39% 712 N/A Middle school (between grades 6 to 9 only) & middle/high school (start between grades 6 to 9 and end at grade 9 or higher)
19% 356 N/A
High school (grades 9 and higher only) 13% 243 N/A Elementary/middle (start at grade 5 and under and finish between grades 7 to 9) 21% 378 N/A
Comprehensive (start at grades 6 and under and end at grade 12) 8% 137 N/A
* One respondent chose not to provide their gender. ** Data on the distribution of the teacher universe in Alberta was provided by the Alberta Teachers’ Association. N/A: Data not available. Administrators The administrators included in the final sample of the Time Use Diary generally had more years of educational experience than teachers. On average, administrators had 22.6 years of experience, with a range of 4 to 40 years. Both principals (60%) and vice-principals (40%) were included in the final sample. Administrators were evenly divided between female (51%) and male (49%) respondents. The majority were employed in the public school system (82%), followed by the separate school system (17%). Only one administrator worked at a Francophone school. Additionally, more administrators worked in communities with fewer than 30,000 residents (48%), followed by those who worked in communities with populations of 100,000 or over (38%), and those who worked in communities with populations

13
Alberta Teacher Workload Study R.A. Malatest & Associates Ltd. Alberta Education December 2015
between 30,000 and 100,000 (15%) (see Table 2.9). The final sample of administrators, compared to the population of administrators in Alberta, had a good approximate distribution. Separate and urban administrators were slightly over-represented, while public and rural administrators were under-represented. Given the close approximation of the sample to the universe, data weighting was not required.
Table 2.9: Administrator Profile
% of Respondents
Number of Respondents
% of Alberta Administrator
Universe*
Gender Female 51% 73 N/A Male 49% 70 N/A
School Authority Type
Public 82% 118 75% Separate 17% 24 24% Francophone 1% 1 2%
Community Size
Rural/small community (<1,000 to 29,999) 48% 68 38% Medium community (30,000 to 99,999) 15% 21 15% Urban centre (100,000 +) 38% 54 47%
School Type Elementary (grades 6 and under only) 43% 62 N/A Middle school (between grades 6 to 9 only) & middle/high school (start between grades 6 to 9 and end at grade 9 or higher)
23% 33 N/A
High school (grades 9 and higher only) 7% 10 N/A Elementary/middle (start at grade 5 and under and finish between grades 7 to 9) 18% 26 N/A
Comprehensive (start at grades 6 and under and end at grade 12) 8% 12 N/A
* Data on the distribution of the teacher universe in Alberta was provided by the Alberta Teachers’ Association. N/A: Data not available Due to the small sample size, subgroup analysis was not completed for the administrator sample.

14
Alberta Teacher Workload Study R.A. Malatest & Associates Ltd. Alberta Education December 2015
Central Office Staff On average, the central office staff represented in the final sample had been in their positions for 3.9 years, and ranged from those who were in their first year to those who had 25 years of experience in their role. Additionally, 96% of respondents brought classroom teaching experience to their central office position, with 12.3 years of experience as classroom teachers, on average. The groups that central office staff most commonly worked with directly included:
• Teachers (92%); • Students (74%); • Administrators (69%); • Parents and community members (48%); • Other central office staff (39%); and • Alberta Education/Alberta Learning (16%).
As demonstrated in Table 2.10, the majority of the final sample for central office staff consisted of females (78%), and those who worked in an urban centre with a population of 100,000 or greater (59%).
Table 2.10: Central Office Staff Profile
% of Respondents Number of Respondents Gender
Female 78% 108
Male 22% 31 Community Size
Rural/small community (<1,000 to 29,999) 27% 37
Medium community (30,000 to 99,999) 22% 30
Urban centre (100,000 +) 59% 82 Population-level demographic data not available for central office staff.

15
Alberta Teacher Workload Study R.A. Malatest & Associates Ltd. Alberta Education December 2015
2.2.6 Data Analysis Time Use Diary To determine the hours worked in a day, the number of work-related activities reported by the participant for the day were counted. Each reported activity was weighted by the time spent on the activity. If a participant reported one activity in a 30-minute block, that activity was weighted at 30 minutes. If two activities were reported in a block, then both activities were weighted at 15 minutes each. If three activities were reported in a block, all three activities were weighted at 10 minutes each. This provided a breakdown of how much time participants spent engaged in different work-related activities over the course of the day. The amount of time participants spent on different work-related activities was summed across the day to calculate the total amount of time worked that day. Average hours worked were calculated and reported separately for teachers and administrators. The average hours worked by teachers and administrators are reported over different time periods. The different reporting time periods are as follows:
• Daily hours: the average hours worked from 5 am to midnight on a single day; • Weekly hours: the average hours worked for all seven days of the week (Monday to Sunday)
from 5 am to midnight; • Annual hours: the average hours worked from 5 am to midnight, Monday to Sunday for the
entire school year (September to June); • Work hours: the average hours worked from Monday to Friday, 8 am to 4:30 pm; • Work outside of regular work hours: the average hours worked from Monday to Friday prior to
the start of school day (from 5 am to 8 am), and after the end of school day (4:30 pm to midnight); and
• Weekend hours: the average hours worked on Saturday and Sunday, from 5 am to midnight.
The overall daily average hours participants worked were also analyzed by variables collected in other surveys that participants completed. These surveys included the registration form, the Summer Allocation Survey, and the Workplace Experience Survey. These analyses were conducted to determine the relationship between teachers’ hours and these other variables. Due to the relatively small sample of administrators, these analyses were only conducted for teachers. The variables that average hours were analyzed by were:
• Community size (registration information); • Length of teaching experience (registration information); • School types, as determined by grades (registration information); • School authority (registration information); • Time spent on microtasks (Workplace Experience Survey); • Perceived changes in workload (Workplace Experience Survey); • Satisfaction with time on work-related activities (Workplace Experience Survey); • Workplace challenges composite score (Workplace Experience Survey); • Satisfaction with work-life balance (Workplace Experience Survey); • Perceived changes in professional autonomy (Workplace Experience Survey); • Number of summer months worked (Summer Allocation Survey); and • Expected changes in teaching position or assignment (Summer Allocation Survey).

16
Alberta Teacher Workload Study R.A. Malatest & Associates Ltd. Alberta Education December 2015
Significance testing was conducted to determine if the above variables had an impact on the number of hours participants worked. Only findings that showed a significant difference are reported.
Month Analysis
Time Use Diary data was collected by four cohorts of participants over the school year. Each participant recorded their daily work-related activities for an entire week on a four-week cycle. Data recording cycles began on Monday and ended on Sunday. Due to these two factors, the four-week cycle and the start and stop days, the months reported in the analysis do not align with the calendar months. Table 2.11 below shows the dates for the months reported in the analysis.
Table 2.11: Start and End Dates for Monthly Analysis
Month Start Date End Date
September September 1, 2014 September 28, 2014 October September 29, 2014 November 2, 2014 November November 3, 2014 November 30, 2014 December December 1, 2014 December 28, 2014 January December 29, 2014 February 1, 2015
February February 2, 2015 March 1, 2015 March March 2, 2015 March 29, 2015 April March 30, 2015 May 3, 2015 May May 4, 2015 May 31, 2015
June June 1, 2015 July 5, 2015 Since the Time Use Diary collection period had a four-week cycle, there are some reported months that have five weeks of data: October, January, April, and June. For weeks that crossed over two calendar months, log data was assigned to the month that contained the most work days. Work Activities The analysis of work-related activities performed by teachers and administrators was conducted by taking the average of the average amount of time respondents were engaged in a particular activity. For each teacher and administrator, the average amount of time they spent engaged in each activity was calculated over the entire year. If a respondent did not report engaging in a particular activity during the year, they were given zero minutes for that activity. Data was only imputed for skipped log entries on work days when the reason for the skipped log was related to a work activity (see Data Cleaning and Table 2-6). Hours that were imputed for missing days (see Missing Data, p. 10) were not included in the calculation of an individual respondent’s activity averages (i.e., they were treated as missing data). After the average activity times for all of the respondents were calculated, the results were averaged across all teachers and administrators. This generated the average amount of time respondents spent engaged in different activities during the school year.

17
Alberta Teacher Workload Study R.A. Malatest & Associates Ltd. Alberta Education December 2015
To determine the proportionate amount of time respondents were engaged in different activities, the activity averages were summed. This total was used as the denominator in the calculation of the activity percentages. The averages of the individual activities were divided by this denominator to determine the portion of time teachers/administrators were engaged in them. Summer Time Allocation Survey Participants were invited to complete the Summer Time Allocation Survey at the start of the project. All participants who completed the Summer Time Allocation Survey were included in the analysis, regardless of whether or not they participated in the Time Use Diary Survey. The Survey asked participants to retrospectively assess their work hours during the months of July and August. Frequency analysis was conducted with closed-ended questions, and averages were computed for the amount of time participants reported engaged in different work-related activities over the summer months. Additionally, the percentage of participants who spent time on different activities was calculated. These analyses were conducted separately for teachers and administrators. Some participants were under an additional contract for their work during the summer months. To determine the impact of additional contracts on work hours, average hours spent on activities and the proportion of respondents who engaged in the activities were computed. The computations were completed separately for participates who had an additional contract and those who did not have an additional contract. To compute the overall amount of time participants reported working over the summer, the number of hours spent on different work related activities were totaled for each participant. Participants who indicated that they did not work during a summer month were given zero hours for that month. Separate averages were then computed for teachers and administrators for July and August. The overall average hours are only reported for participants who did not have an additional contract for the month. Workplace Experience Survey Participants engaged in the Time Use Diary were asked to complete the Workplace Experience Survey near the end of the project. The Survey asked participants to provide perceptions of their work environment and workload. Frequency analysis was conducted on the participants responses to the Survey. Analysis was conducted separately for teachers and for administrators. Central Office Staff Survey The Central Office Survey was conducted twice during the project with central office employees of school divisions. The Survey provided central office staff with the opportunity to share information about their working hours and work-related activities. Frequency analysis was conducted on participants' responses to closed-ended questions. Additionally, the averages were calculated for amount of time worked outside of usual hours and the amount of time spent on specific work-related activities. As not all central office staff engaged in all work-related activities, the percentage of staff who were engaged in each activity was calculated.
18
Alberta Teacher Workload Study R.A. Malatest & Associates Ltd. Alberta Education December 2015
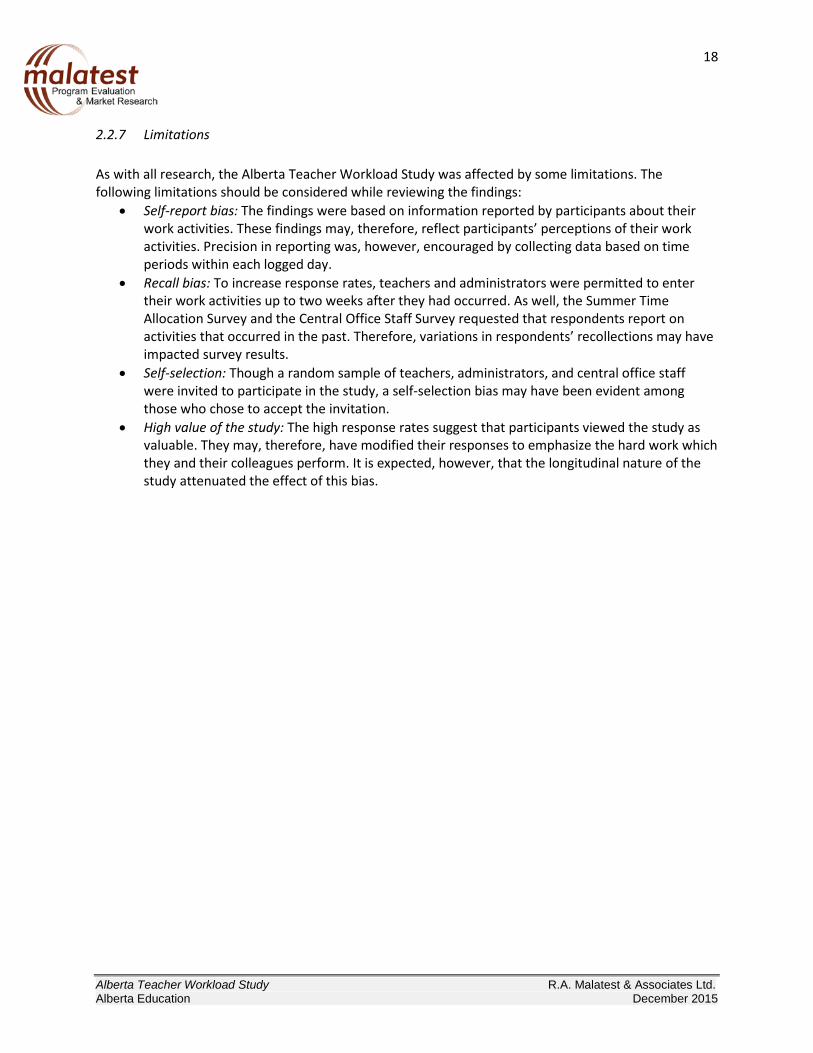
2.2.7 Limitations As with all research, the Alberta Teacher Workload Study was affected by some limitations. The following limitations should be considered while reviewing the findings:
• Self-report bias: The findings were based on information reported by participants about their work activities. These findings may, therefore, reflect participants’ perceptions of their work activities. Precision in reporting was, however, encouraged by collecting data based on time periods within each logged day.
• Recall bias: To increase response rates, teachers and administrators were permitted to enter their work activities up to two weeks after they had occurred. As well, the Summer Time Allocation Survey and the Central Office Staff Survey requested that respondents report on activities that occurred in the past. Therefore, variations in respondents’ recollections may have impacted survey results.
• Self-selection: Though a random sample of teachers, administrators, and central office staff were invited to participate in the study, a self-selection bias may have been evident among those who chose to accept the invitation.
• High value of the study: The high response rates suggest that participants viewed the study as valuable. They may, therefore, have modified their responses to emphasize the hard work which they and their colleagues perform. It is expected, however, that the longitudinal nature of the study attenuated the effect of this bias.

19
Alberta Teacher Workload Study R.A. Malatest & Associates Ltd. Alberta Education December 2015
SECTION 3. FINDINGS: TIME USE DIARY Highlighted in this section are the key findings associated with the Time Use Diary. 3.1 Overall Hours Worked 3.1.1 Daily (5 am to midnight) Teachers worked between 8.0 and 8.7 hours daily, and administrators worked between 8.5 and 9.1 hours daily, from Monday to Thursday. Both groups worked fewer hours, on average, on Friday. With the exception of weekends, administrators generally worked more hours each day than teachers.
Table 3.1: Average Overall Daily Hours Monday to Sunday, 5:00 to midnight
Day Teacher Administrator Monday 8.0 8.5
Tuesday 8.6 9.1 Wednesday 8.7 9.1 Thursday 8.6 9.1 Friday 7.1 7.6
Saturday 1.5 1.5 Sunday 2.0 1.8
3.1.2 Weekly (Monday to Sunday from 5 am to midnight) As demonstrated in Figure 3.1, teachers and administrators frequently worked 40 or more hours per week. For all of the weeks1 reported by all teachers and administrators, teachers worked 40 or more hours in 74% of the reported weeks, while administrators did so for 78% of the reported weeks.
1 Teachers and administrators could report up to 11 weeks each, for total number of weeks of 21,126 weeks.

20
Alberta Teacher Workload Study R.A. Malatest & Associates Ltd. Alberta Education December 2015
Figure 3.1: Percentage of Weeks in the School Year by Hours
As would be expected, fewer weekly hours were reported during school holidays in December, January, and April. Administrators frequently reported higher weekly hours, on average, than teachers (see Table 3.2).
Table 3.2: Average Overall Weekly Hours Monday to Sunday
Week Teacher Administrator
Sept. 1-7, 2014 44.6 46.2
Sept. 8-14, 2014 51.4 52.7
Sept. 15-21, 2014 51.5 55.6
Sept. 22-28, 2014 51.5 56.8
Sept. 29-Oct. 5, 2014 52.4 53.0
Oct. 5-12, 2014 48.9 48.9
Oct. 13-19, 2014 42.9 46.8
Oct. 20-26, 2014 51.9 59.0
Oct. 27-Nov. 2,2014 52.5 53.0
Nov. 3-9, 2014 49.8 48.6
Nov. 10-16, 2014 39.2 38.4
26% 35% 39%
22% 30%
48%
0%
10%
20%
30%
40%
50%
60%
70%
80%
90%
100%
Less than 40 hours Between 40 and 50 hours More than 50 hours
Teacher Administrator

21
Alberta Teacher Workload Study R.A. Malatest & Associates Ltd. Alberta Education December 2015
Week Teacher Administrator
Nov. 17-23, 2014 51.3 56.3
Nov. 24-30, 2014 50.0 50.5
Dec. 1-7, 2014 49.4 47.8
Dec. 8-14, 2014 48.0 50.2
Dec. 15-21, 2014 43.9 49.5
Dec. 22-28, 2014 2.3 1.7
Dec. 29-Jan. 4, 2015 6.6 6.0
Jan. 5-11, 2015 49.3 52.2
Jan. 12-18, 2015 49.0 51.6
Jan. 18-25, 2015 49.4 50.9
Jan. 26-Feb. 1, 2015 47.9 48.0
Feb. 2-8, 2015 47.3 51.4
Feb. 8-15, 2015 45.5 49.1
Feb. 16-22, 2015 39.9 41.3
Feb. 23-Mar. 1, 2015 50.0 47.1
Mar. 2-8, 2015 51.6 53.6
Mar. 9-15, 2015 50.6 54.2
Mar. 16-22, 2015 50.3 52.9
Mar. 23-29, 2015 40.3 38.2
Mar. 30-Apr. 5, 2015 22.9 26.6
Apr. 6-12, 2015 30.1 31.4
Apr. 13-19, 2015 49.0 53.2
Apr. 20-26, 2015 47.2 48.1
Apr. 27-May 3, 2015 48.1 51.9
May 4-10, 2015 47.8 53.3
May 11-17, 2015 44.7 43.2

22
Alberta Teacher Workload Study R.A. Malatest & Associates Ltd. Alberta Education December 2015
Week Teacher Administrator
May 18-24, 2015 40.5 38.0
May 25-31, 2015 49.4 51.6
Jun. 1-7, 2015 50.7 55.1
Jun. 8-14, 2015 52.2 53.0
Jun. 15-21, 2015 49.8 48.0
Jun. 22-28, 2015 42.9 50.8
Jun. 29-Jul. 5, 2015 9.3 16.3
Average weekly hours 44.2 46.2
The average hours worked over the school years is summarized in Figure 3.2.
Figure 3.2: Average Weekly Hours - Monday through Sunday
0.0
10.0
20.0
30.0
40.0
50.0
60.0
70.0
Teacher Administrator

23
Alberta Teacher Workload Study R.A. Malatest & Associates Ltd. Alberta Education December 2015
The school year included some weeks that were different from a typical school week. These weeks could be considered outliers as schools were closed for most of the days during these weeks. This study included the following weeks that could be considered outliers:
• Dec. 22-28, 2014, Dec. 29-Jan. 4, 2015 (Christmas vacation) • Mar. 30-Apr. 5, 2015, Apr. 6-12, 2015 (Spring Break) • Jun. 29-Jul. 5, 2015 (Partial week, as schools usually close by June 30)
For calculating the average hours for a typical work week, the outlier weeks were excluded. The typical work week for a teacher was 48 hours. For an administrator the typical work week was 50 hours.
Table 3.3: Typical Work Week (All Hours—Monday through Sunday)
Teacher Administrator Average hours—Typical Work Week 48.0 50.0 Note: Average hours for the typical work week excludes the following weeks— Dec. 22-28, 2014, Dec. 29-Jan. 4, 2015 (Christmas vacation); Mar. 30-Apr. 5, 2015, Apr. 6-12, 2015 (Spring Break); and Jun. 29-Jul. 5, 2015 (Partial week, as schools usually close by June 30). 3.1.3 Monthly The average hours worked per week in each month of the school year suggested a front-loading of work at the start of the school year. Both teachers and administrators reported working more hours per week, on average, in September and October compared to the rest of the year. A slight increase in March was noted with both groups reporting working slightly fewer than 50 hours per week. As would be expected, lower hours were reported in the months associated with school holidays (December, January, and April).
Table 3.4: Average Weekly Hour by Month: Monday to Friday, 5:00 am to midnight
Month Teacher Administrator September 49.7 52.8 October* 49.7 52.1 November 47.6 48.5 December 35.9 37.3
January* 40.4 41.8 February 45.7 47.2 March 48.2 49.7 April* 39.5 42.2
May 45.6 46.5 June* 41.0 44.6 * These months included 5 weeks of data. Months in this table do not align with calendar months (refer to Table 2.11).

24
Alberta Teacher Workload Study R.A. Malatest & Associates Ltd. Alberta Education December 2015
Figure 3.3: Average Weekly Hour by Month: Monday to Friday, 5:00 am to midnight
3.1.4 School Year Based on the entire sample, teachers worked slightly less than 2,000 hours (1,943.9 hours) over the school year, while administrators worked slightly more than 2,000 hours (2,032.1 hours), on average.
Table 3.5: Average Overall Annual Hours
Participant Type All September to June (5:00 am to midnight) Teachers 1943.9 Administrators 2032.1
* Numbers may not add up due to rounding.
49.7 49.7 47.6
35.9
40.4
45.7 48.2
39.5
45.6
41
52.8 52.1
48.5
37.3
41.8
47.2 49.7
42.2
46.5 44.6
0
10
20
30
40
50
60
Teacher Administrator

25
Alberta Teacher Workload Study R.A. Malatest & Associates Ltd. Alberta Education December 2015
3.2 Work Outside of Regular School Hours
3.2.1 Hours Worked Outside of Regular Hours by Week Day Teachers and administrators worked fewer hours, on average, during regular work hours on Mondays and Fridays. The amount of time worked before and after school, however, was relatively consistent throughout the week prior to Friday. Teachers and administrators generally worked fewer hours after school on Fridays.
Table 3.6: Breakdown of Work Week by Day
Day
Teacher Administrator
Work Hours**
Before School
Hours*** After School Hours****
Work Hours**
Before School
Hours*** After School Hours****
Monday 6.5 0.3 1.2 6.7 0.5 1.2
Tuesday 7.0 0.4 1.2 7.1 0.6 1.3
Wednesday 7.1 0.4 1.2 7.2 0.5 1.4
Thursday 7.0 0.3 1.2 7.2 0.5 1.4
Friday 6.3 0.3 0.5 6.5 0.5 0.6 * Numbers may not add up due to rounding. **8 am to 4:30 pm ***5 am to 8 am ****4:30 pm to midnight
3.2.2 Hours Worked Outside of Regular Hours by Week As demonstrated in Table 3.7, the amount of time teachers devoted to work per week, on average, outside of regular work hours, varied across the school year. Teachers generally spent more time on work-related activities outside of work hours in many weeks in September, October, November, March and June. As would be expected, they spent less time working outside of regular work hours during school holiday periods (the last two weeks of December, first week of January, and first two weeks of April).

26
Alberta Teacher Workload Study R.A. Malatest & Associates Ltd. Alberta Education December 2015
Table 3.7: Average Weekly Hours Outside of School Hours by Teachers
Week
Before School (5:00 am to
8:00 am)
After School (4:30 pm to midnight)
Weekend (5:00 am to
midnight) Total*
Sept. 1-7, 2014 1.9 5.5 3.6 11.1
Sept. 8-14, 2014 2.1 6.9 3.4 12.4
Sept. 15-21, 2014 2.2 6.6 3.6 12.5
Sept. 22-28, 2014 2.2 6.4 4.1 12.7
Sept. 29-Oct. 5, 2014 2.2 6.9 4.1 13.2
Oct. 5-12, 2014 2.1 6.6 2.3 11.0
Oct. 13-19, 2014 1.7 5.8 4.1 11.5
Oct. 20-26, 2014 2.1 6.9 4.2 13.2
Oct. 27-Nov. 2,2014 2.1 6.8 5.3 14.2
Nov. 3-9, 2014 2.0 7.1 3.7 12.8
Nov. 10-16, 2014 1.3 5.6 4.9 11.8
Nov. 17-23, 2014 1.9 7.1 4.0 13.0
Nov. 24-30, 2014 1.9 6.7 3.4 12.0
Dec. 1-7, 2014 1.9 6.2 3.2 11.2
Dec. 8-14, 2014 1.9 5.6 2.7 10.3
Dec. 15-21, 2014 1.8 4.2 0.7 6.7
Dec. 22-28, 2014 0.0 0.2 1.0 1.3
Dec. 29-Jan. 4, 2015 0.1 0.7 3.6 4.4
Jan. 5-11, 2015 1.9 5.3 3.9 11.0
Jan. 12-18, 2015 1.8 5.2 3.9 11.0
Jan. 18-25, 2015 1.9 5.3 4.2 11.3
Jan. 26-Feb. 1, 2015 1.7 5.3 3.3 10.4
Feb. 2-8, 2015 1.7 5.0 3.3 10.0

27
Alberta Teacher Workload Study R.A. Malatest & Associates Ltd. Alberta Education December 2015
Week
Before School (5:00 am to
8:00 am)
After School (4:30 pm to midnight)
Weekend (5:00 am to
midnight) Total*
Feb. 8-15, 2015 1.6 4.8 2.1 8.5
Feb. 16-22, 2015 1.4 4.7 4.3 10.4
Feb. 23-Mar. 1, 2015 1.7 5.9 4.8 12.3
Mar. 2-8, 2015 1.9 6.7 4.9 13.5
Mar. 9-15, 2015 1.8 6.5 4.1 12.4
Mar. 16-22, 2015 1.8 6.9 3.5 12.3
Mar. 23-29, 2015 1.5 5.4 2.4 9.3
Mar. 30-Apr. 5, 2015 0.9 2.9 1.5 5.4
Apr. 6-12, 2015 1.3 3.2 3.0 7.4
Apr. 13-19, 2015 1.9 5.5 3.2 10.7
Apr. 20-26, 2015 1.7 4.8 3.1 9.6
Apr. 27-May 3, 2015 1.9 5.2 3.2 10.3
May 4-10, 2015 1.9 5.0 2.4 9.3
May 11-17, 2015 1.8 4.6 2.4 8.9
May 18-24, 2015 1.5 4.9 3.1 9.4
May 25-31, 2015 2.0 5.8 3.8 11.6
Jun. 1-7, 2015 1.9 6.1 4.4 12.4
Jun. 8-14, 2015 2.0 7.0 5.2 14.1
Jun. 15-21, 2015 1.9 6.6 3.6 12.0
Jun. 22-28, 2015 1.4 4.2 1.6 7.3
Jun. 29-Jul. 5, 2015 0.2 0.6 0.5 1.3
Average weekly hours 1.7 5.3 3.4 10.4 * Numbers may not add up due to rounding.

28
Alberta Teacher Workload Study R.A. Malatest & Associates Ltd. Alberta Education December 2015
The weekly distribution of administrators’ work activities outside of the regular work period generally followed that of the teachers. Administrators, however, spent more time working outside of the regular work hours per week than teachers, on average.
Table 3.8: Average Weekly Hours Outside of School Hours by Administrators
Week
Before School (5:00 am to
8:00 am)
After School (4:30 pm to midnight)
Weekend (5:00 am to
midnight) Total*
Sept. 1-7, 2014 2.7 6.6 3.0 12.3
Sept. 8-14, 2014 3.1 6.9 3.1 13.1
Sept. 15-21, 2014 3.8 8.4 3.9 16.1
Sept. 22-28, 2014 3.7 8.8 4.4 16.9
Sept. 29-Oct. 5, 2014 2.9 7.9 4.4 15.2
Oct. 5-12, 2014 3.0 6.1 1.3 10.4
Oct. 13-19, 2014 2.6 6.6 4.4 13.6
Oct. 20-26, 2014 3.7 9.1 5.4 18.2
Oct. 27-Nov. 2,2014 3.0 7.4 3.4 13.8
Nov. 3-9, 2014 2.6 5.8 2.5 10.9
Nov. 10-16, 2014 2.1 5.1 4.0 11.2
Nov. 17-23, 2014 3.5 8.7 4.3 16.5
Nov. 24-30, 2014 2.9 6.9 2.8 12.6
Dec. 1-7, 2014 2.3 4.9 2.3 9.5
Dec. 8-14, 2014 2.9 6.2 3.3 12.4
Dec. 15-21, 2014 3.3 6.2 1.0 10.5
Dec. 22-28, 2014 0.0 0.1 0.7 0.8
Dec. 29-Jan. 4, 2015 0.1 0.4 2.0 2.5
Jan. 5-11, 2015 3.0 6.0 3.1 12.1
Jan. 12-18, 2015 3.4 6.9 3.9 14.2
Jan. 18-25, 2015 2.7 6.1 3.3 12.1

29
Alberta Teacher Workload Study R.A. Malatest & Associates Ltd. Alberta Education December 2015
Week
Before School (5:00 am to
8:00 am)
After School (4:30 pm to midnight)
Weekend (5:00 am to
midnight) Total*
Jan. 26-Feb. 1, 2015 2.5 4.9 3.2 10.6
Feb. 2-8, 2015 2.9 6.1 3.8 12.8
Feb. 8-15, 2015 2.8 6.1 2.3 11.2
Feb. 16-22, 2015 2.1 5.8 4.0 11.9
Feb. 23-Mar. 1, 2015 1.9 5.2 4.1 11.2
Mar. 2-8, 2015 2.9 7.1 3.7 13.7
Mar. 9-15, 2015 3.4 7.4 4.8 15.6
Mar. 16-22, 2015 3.1 7.4 2.9 13.4
Mar. 23-29, 2015 1.9 4.6 2.2 8.7
Mar. 30-Apr. 5, 2015 1.4 3.3 1.4 6.1
Apr. 6-12, 2015 1.9 4.2 3.2 9.3
Apr. 13-19, 2015 2.8 7.2 3.2 13.2
Apr. 20-26, 2015 2.0 5.1 2.5 9.6
Apr. 27-May 3, 2015 2.9 6.8 4.1 13.8
May 4-10, 2015 3.3 7.6 3.2 14.1
May 11-17, 2015 2.4 4.5 2.1 9.0
May 18-24, 2015 1.6 3.5 1.3 6.4
May 25-31, 2015 2.8 6.7 4.3 13.8
Jun. 1-7, 2015 3.6 7.5 4.2 15.3
Jun. 8-14, 2015 3.1 6.4 4.0 13.5
Jun. 15-21, 2015 2.2 5.0 3.8 11.0
Jun. 22-28, 2015 3.3 6.6 2.4 12.3
Jun. 29-Jul. 5, 2015 0.7 1.7 1.1 3.5
Average weekly hours 2.6 6.0 3.1 11.7 * Numbers may not add up due to rounding.

30
Alberta Teacher Workload Study R.A. Malatest & Associates Ltd. Alberta Education December 2015
3.2.3 Hours Worked Outside of Regular School Hours by Month As follows from the weekly hours worked outside of the regular school day, teachers tended to work more hours before school, after school, and on the weekends in September, October, and November. They worked fewer such hours in December.
Table 3.9: Average Monthly Hours Outside of School Hours by Teachers
Months
Before School (5:00 am to
8:00 am)
After School (4:30 pm to midnight)
Weekend (5:00 am to
midnight) Total*
September 2014 2.1 6.3 3.7 12.2
October 2014 2.0 6.6 4.0 12.6
November 2014 1.8 6.6 4.0 12.4
December 2014 1.4 4.1 1.9 7.4
January 2015 1.5 4.4 3.8 9.6
February 2015 1.6 5.1 3.6 10.3
March 2015 1.8 6.4 3.7 11.9
April 2015 1.5 4.3 2.8 8.7
May 2015 1.8 5.1 2.9 9.8
June 2015 1.5 4.9 3.0 9.4 * Numbers may not add up due to rounding.

31
Alberta Teacher Workload Study R.A. Malatest & Associates Ltd. Alberta Education December 2015
The time administrators spent on work-related activities outside of regular work hours displayed a similar pattern to that reported by teachers. However, on average, administrators reported spending more time working outside of regular school hours than teachers.
Table 3.10: Average Monthly Hours Outside of School Hours by Administrators
Months
Before School (5:00 am to
8:00 am)
After School (4:30 pm to midnight)
Weekend (5:00 am to
midnight) Total*
September 2014 3.3 7.7 3.6 14.6
October 2014 3.0 7.4 3.8 14.2
November 2014 2.8 6.7 3.4 12.9
December 2014 2.1 4.3 1.8 8.2
January 2015 2.3 4.9 3.1 10.3
February 2015 2.4 5.8 3.6 11.8
March 2015 2.8 6.6 3.4 12.8
April 2015 2.2 5.3 2.9 10.4
May 2015 2.6 5.6 2.7 10.9
June 2015 2.6 5.4 3.1 11.1 * Numbers may not add up due to rounding. Table 3.11 shows the breakdown of the overall annual hours worked by teachers and administrators over the year. On average, administrators work more hours on week day, before, during and after school, than teachers. Teachers work more hours on average over the weekend.
Table 3.11: Break down of Average Overall Annual Hours
Participant Type
Before School (5:00 am to 8:00
am)
During School (8:00 am to 4:30
pm)
After School (4:30 pm to midnight)
Weekend (5:00 am to midnight)
All (5:00 am to midnight)*
Teachers 74.6 1486.6 235.2 147.8 1943.9
Administrators 114.9 1517.1 261.9 138.2 2032.1 * Numbers may not add up due to rounding.
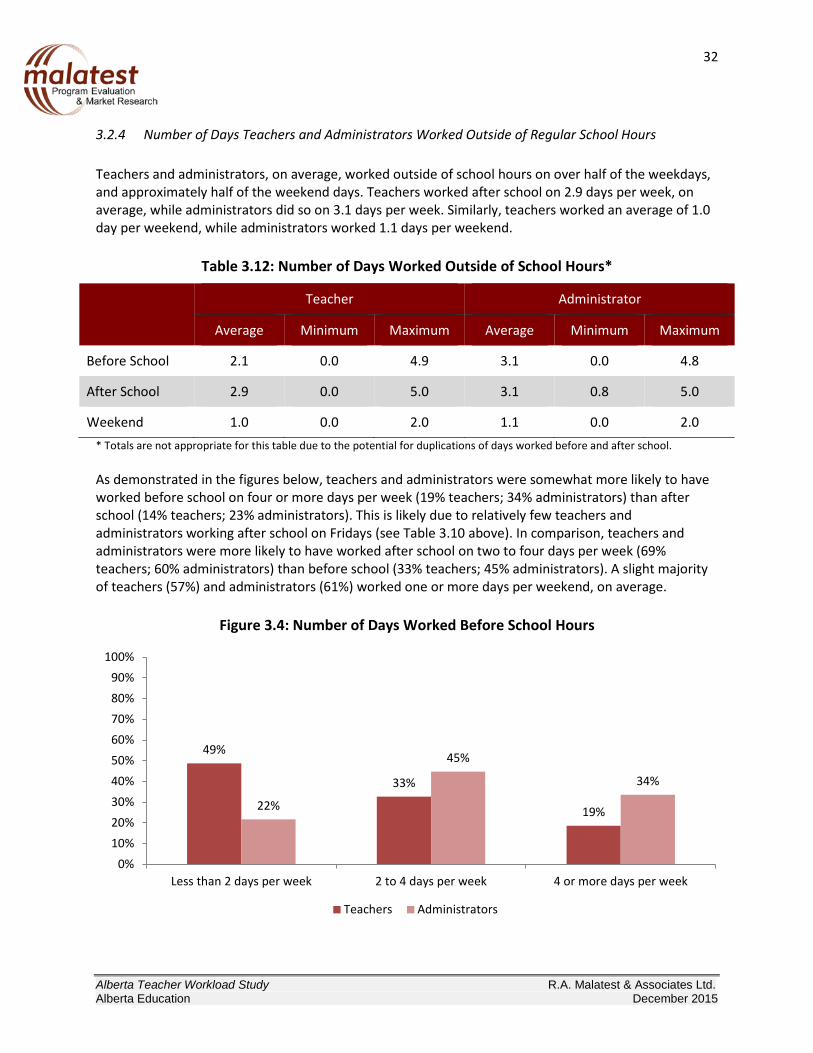
32
Alberta Teacher Workload Study R.A. Malatest & Associates Ltd. Alberta Education December 2015
3.2.4 Number of Days Teachers and Administrators Worked Outside of Regular School Hours Teachers and administrators, on average, worked outside of school hours on over half of the weekdays, and approximately half of the weekend days. Teachers worked after school on 2.9 days per week, on average, while administrators did so on 3.1 days per week. Similarly, teachers worked an average of 1.0 day per weekend, while administrators worked 1.1 days per weekend.
Table 3.12: Number of Days Worked Outside of School Hours*
Teacher Administrator
Average Minimum Maximum Average Minimum Maximum
Before School 2.1 0.0 4.9 3.1 0.0 4.8
After School 2.9 0.0 5.0 3.1 0.8 5.0
Weekend 1.0 0.0 2.0 1.1 0.0 2.0 * Totals are not appropriate for this table due to the potential for duplications of days worked before and after school. As demonstrated in the figures below, teachers and administrators were somewhat more likely to have worked before school on four or more days per week (19% teachers; 34% administrators) than after school (14% teachers; 23% administrators). This is likely due to relatively few teachers and administrators working after school on Fridays (see Table 3.10 above). In comparison, teachers and administrators were more likely to have worked after school on two to four days per week (69% teachers; 60% administrators) than before school (33% teachers; 45% administrators). A slight majority of teachers (57%) and administrators (61%) worked one or more days per weekend, on average.
Figure 3.4: Number of Days Worked Before School Hours
49%
33%
19% 22%
45%
34%
0%10%20%30%40%50%60%70%80%90%
100%
Less than 2 days per week 2 to 4 days per week 4 or more days per week
Teachers Administrators

33
Alberta Teacher Workload Study R.A. Malatest & Associates Ltd. Alberta Education December 2015
Figure 3.5: Number of Days Worked After School Hours
Figure 3.6: Number of Days Worked on Weekends
18%
69%
14% 17%
60%
23%
0%10%20%30%40%50%60%70%80%90%
100%
Less than 2 days per week 2 to 4 days per week 4 or more days per week
Teachers Administrators
43%
57%
39%
61%
0%10%20%30%40%50%60%70%80%90%
100%
Less than 1 day per week 1 or more days per week
Teachers Administrators

34
Alberta Teacher Workload Study R.A. Malatest & Associates Ltd. Alberta Education December 2015
3.3 Hours Worked and Satisfaction Some of the findings in this section combine data from the Time Use Diary and Work Experience and Summer Time Allocation surveys. Teachers who were highly satisfied with their job overall (very satisfied or satisfied) were more likely to have been satisfied with the following aspects of their work environment:
• Professional autonomy: Teachers who were satisfied with their job were more likely to report that their professional autonomy had increased (19%) than those who were dissatisfied (8%);
• Lower Stress levels: Teachers who were satisfied with their job were less likely to report that their workload caused them stress (83%) than those who were dissatisfied (91%); and
• Collaboration with colleagues: Teachers who were satisfied with their job were more likely to also be satisfied with the time they had to collaborate with their colleagues (38%) than those who were dissatisfied (17%).
The number of hours worked per week did not vary significantly based on the overall job satisfaction level of teachers in this study. However, average weekly hours worked varied based on some factors contributing to work satisfaction. Teachers who worked a higher average number of weekly hours were more commonly dissatisfied with their work-life balance and the amount of time spent on work-related activities. Teachers who were very dissatisfied with their work-life balance worked, on average, seven more hours per week than those who were very satisfied. Similarly, those who were very dissatisfied with the time they spent on work worked six hours more than those who were very satisfied, on average.
Table 3.13: Work-Life Balance and Time Spent on Work-Related Activities by Work Hours
Very Dissatisfied Dissatisfied Neutral Satisfied Very
Satisfied Work-life balance 47 hrs 46 hrs 44 hrs 42 hrs 40 hrs Time spent on work-related activities 48 hrs 46 hrs 45 hrs 43 hrs 42 hrs
Teachers who worked more hours were also significantly more likely to have:
• Spent more time on microtasks: Teachers working 46 hours or more spent 60 minutes or more on microtasks, as compared to those working 44 hours and spent only 30 minutes or less on microtasks.
• Worked in a small community: Teachers working in small communities worked 45 hours a week, on average, compared to 44 hours worked by teachers in large communities.
• Worked two months in the summer: Teachers working 46 hours more commonly worked in both July and August as compared to those who worked 44 hours (worked in either July or August) or 40 hours (did not work).
• Had their workload significantly increase: Teachers working 46 hours a week, on average, more commonly indicated their workload increased, as compared to those working 41 (significantly decreased) to 44 hours (somewhat decreased, stayed the same, somewhat increased).
Years of experience did not influence the number of hours teachers worked; nor did the extent to which their classroom was challenging, as measured through the Classroom Anxiety Measure.

35
Alberta Teacher Workload Study R.A. Malatest & Associates Ltd. Alberta Education December 2015
3.4 Work Activities 3.4.1 Weekday Work Activities Teachers spent the most time, on average, conducting in-class instruction and student supervision, with planning and administration being the next most time-intensive workplace activity. Both of these activities also took up the most time for the entire sample, suggesting that these activities are common across all teachers. Within after school and before school hours, teachers spent the most time on planning and administration, while most of their time during school hours was spent on student instruction and supervision. Relatively few minutes were devoted to school-hosted events and extracurricular activities per day, on average, possibly due to the cyclical nature of extracurricular activities during the school year.
Table 3.14: Average Time (minutes) Spent on Activities by Teachers on Weekdays
Activities
Before School (5:00 am to 8:00
pm)
During School (8:00 am to 4:30
pm)
After School (4:30 pm to midnight) All Minutes*
In-class instruction and student supervision 0.9 238.0 2.0 240.9
Planning and administration 13.8 87.8 25.8 127.4
Assessment and grading 1.7 17.8 18.4 38.0
Communication 2.0 18.7 6.9 27.6
Breaks - 21.3 - 21.3
School-hosted events and extracurricular activities 0.5 9.8 5.3 15.5
Other 1.2 8.6 5.6 15.3
Total Minutes* 20.2 401.9 63.9 486.0 * Numbers may not add up due to rounding.

36
Alberta Teacher Workload Study R.A. Malatest & Associates Ltd. Alberta Education December 2015
When comparing the proportion of daily hours spent on each activity, teachers spent one-half of their total day, and over one-half of the school day, in instruction and supervision. Assessment and grading accounted for relatively little of their time during school hours (4%), and almost a third of their after school work hours (29%). Much of the work hours before and after school were spent in planning and administration (69% and 40%, respectively).
Figure 3.7: Average Time (minutes) Spent on Activities by Teachers on Weekdays
3% 6% 2%
9% 3% 3%
2%
8%
4% 5%
6% 10% 5%
11% 8%
9%
4%
29%
26%
69%
22%
40% 50%
5%
59%
3%
0%
10%
20%
30%
40%
50%
60%
70%
80%
90%
100%
All Before School During School After School
In-class instruction and studentsupervision
Planning and administration
Assessment and Grading
Communication
Breaks
School-hosted events andextracurricular activities
Other

37
Alberta Teacher Workload Study R.A. Malatest & Associates Ltd. Alberta Education December 2015
The two most time-intensive work activities for administrators were administration and professional development and meetings. Additionally, administrators spent considerable amount of time working with, and instructing, students per day, on average.
Table 3.15: Average Time (minutes) Spent on Activities by Administrators on Weekdays
Activities
Before School (5:00 am to 8:00
pm)
During School (8:00 am to 4:30
pm)
After School (4:30 pm to midnight) All Minutes*
Administration 10.3 79.3 15.4 104.9
Professional development and meetings 2.5 71.9 12.4 86.8
Work with students 1.3 61.2 1.9 64.3
Planning and administration 4.3 41.0 8.2 53.4
In-class instruction and student supervision 0.1 48.8 0.5 49.4
Other 6.0 24.5 12.0 42.5
Communication 5.4 26.8 8.5 40.8
Personnel 1.0 26.6 2.4 30.1
School-hosted events and extracurricular activities 0.5 13.3 8.5 22.3
Breaks - 13.3 - 13.3
Assessment and Grading 0.3 2.9 2.3 5.5
Total Minutes* 31.6 409.6 72.1 513.3 * Numbers may not add up due to rounding.

38
Alberta Teacher Workload Study R.A. Malatest & Associates Ltd. Alberta Education December 2015
Administrators reported participating in many activities throughout their day. Proportionally, their school hours were approximately evenly divided between administration, professional development and meetings, working with students, planning, and in-class instruction. Administrators also performed varied activities before and after school.
Figure 3.8: Average Time (minutes) Spent on Activities by Administrators on Weekdays
1% 1% 1% 3% 6% 3% 3% 4%
1% 3%
12% 10% 6%
3%
6%
3% 3% 8% 17%
7%
12% 9% 8%
19%
6%
17% 19% 10%
0%
12%
1% 0% 10%
14%
10%
11% 15% 13% 4%
15%
3%
2%
17%
8%
18% 17% 7%
20%
32%
19% 21% 27%
0%
10%
20%
30%
40%
50%
60%
70%
80%
90%
100%
All (M - F) BeforeSchool Hour
DuringSchool Hour
After SchoolHour
Weekend
Administration
Professional development andmeetings
Work with students
Planning and administration
In-class instruction and studentsupervision
Other
Communication
Personnel
School-hosted events andextracurricular activities
Breaks
Assessment and Grading

39
Alberta Teacher Workload Study R.A. Malatest & Associates Ltd. Alberta Education December 2015
3.4.2 Weekend Work Activities On weekends, teachers spent most of their work time on planning and administration, and assessment and grading. Administrators generally spent their time on administration and other work activities during weekends.
Table 3.16: Average Time (minutes) Spent on Activities During Weekend Day
Month Teachers Administrators
Planning and administration 41.5 40% 15.1 15%
Administration - - 26.8 27%
Assessment and grading 39.3 38% 6.1 6%
Other 10.4 10% 19.0 19%
School-hosted events and extracurricular activities 5.8 6% 9.8 10%
Communication 4.6 4% 8.7 9%
In-class instruction and student supervision 2.0 2% 0.2 0%
Professional development and meetings - - 7.2 7%
Work with students - - 1.9 2%
Personnel - - 3.2 3%
Total* 103.6 100% 98.0 100% * Numbers may not add up due to rounding.

40
Alberta Teacher Workload Study R.A. Malatest & Associates Ltd. Alberta Education December 2015
SECTION 4. FINDINGS: SUMMER TIME ALLOCATION SURVEY Highlighted in this section are the key findings obtained from the Summer Allocation Survey, in which teachers and administrators reported the work-related activities they completed in July and August. Teachers and administrators worked throughout the year. The majority of teachers and administrators, regardless of whether they had an additional work contract, worked in July (71% teachers; 87% administrators) and August (99% teachers; 99% administrators).
Figure 4.1: Proportion of Teachers/Administrators Working in the Summer
71%
87% 99% 99%
29%
12% 1%
0%10%20%30%40%50%60%70%80%90%
100%
Teachers - July Administrators - July Teachers - August Administrators -August
Yes No
July Teachers n=2,778; DK/NR n=20 (1%) July Administrators n=292; DK/NR n=2 (1%) August Teachers n=1,884; DK/NR n=9 (1%) August Administrators n=139; DK/NR n=2 (1%)

41
Alberta Teacher Workload Study R.A. Malatest & Associates Ltd. Alberta Education December 2015
Only a minority of teachers and administrators completed work activities in the summer months as a result of an additional contract. Among teachers, 11% worked in July as a result of an additional contract, and 5% worked in August. In both July and August, 9% of administrators completed work activities as a result of an additional contract. Table 4.1 shows the average number of hours worked over the summer by teachers and administrators who did not have an additional contract. During both months, administrators worked more hours on average than teachers. The number of hours worked increased in August for both teachers and administrators.
Table 4.1: Average Monthly Summer Hours
Participant Type July August
Teachers 16.6 55.9
Administrators 32.3 98.3 July Teachers n=2531; additional contract (yes) n=212; additional contract (don’t know/no response) n=7; missing n= 28 July Administrators n=249; additional contract (yes) n=23; additional contract (don’t know/no response) n=2; missing n= 18 August Teachers n=1761; additional contract (yes) n=101; additional contract (don’t know/no response) n=13; missing n= 9 August Administrators n=124; additional contract (yes) n=13; additional contract (don’t know/no response) n=0; missing n= 2 In both months, teachers/administrators were working both on and off school property. In July, however, teachers/administrators were more likely to have worked only off school property, compared to in August.
Figure 4.2: Place of Work Completion in the Summer (among those that worked in the summer)
7% 11% 12% 11%
58%
23%
9% 1%
35%
67%
79%
88%
0%
10%
20%
30%
40%
50%
60%
70%
80%
90%
100%
Teachers - July Administrators - July Teachers - August Administrators -August
On school property Off school property Both on and off school property
July Teachers n=1,964; DK/NR n=4 (0%) July Administrators n=255; DK/NR n=0 August Teachers n=1,865; DK/NR n=6(0%) August Administrators n=137; DK/NR n=0

42
Alberta Teacher Workload Study R.A. Malatest & Associates Ltd. Alberta Education December 2015
4.1 Findings for Teachers/Administrators that Worked in the Summer
Figures 4.3 to 4.6 report the findings for teachers and administrators that worked in the summer. Those that did not work are excluded. The majority of teachers (63% July; 73% August) and administrators (61% July; 69% August) indicated that the amount of work they completed in July or August of 2014 was comparable to the same month in previous years. Among those (n=627 July; 452 August) whose work hours were not comparable in the summer of 2014, approximately one-half of the teachers worked a somewhat or significantly higher number of hours. Most administrators worked somewhat or significantly higher hours in both July (64%) and August (83%).
Figure 4.3: Hours Worked in July and August 2014 Compared to Previous Years (among those that worked in the summer and had a change in work hours)
Reasons teachers and administrators most commonly gave for working more hours in July and August included:
• Changing schools or classrooms (23% July; 46% August); • Changing positions or roles (23% July; 10% August); • Increasing preparatory activities (21% July; 23% August); • Engaging in professional development activities (15% July; 10% August); • Staff turnover and mentoring (6% July; 4% August); and • Conducting school/classroom maintenance (5% July; 7% August).
28% 15% 19%
5%
23%
26% 17%
12%
25% 29% 38%
38%
24% 29% 26% 45%
0%
10%
20%
30%
40%
50%
60%
70%
80%
90%
100%
Teachers - July Teachers - August Administrators - July Administrators -August
Significantly lower Somewhat lower Somewhat higher Significantly higher
July Teachers n=620; DK/NR n=4 (1%) July Administrators n=93; DK/NR n=0 August Teachers n=449; DK/NR n=3 (1%) August Administrators n=42; DK/NR n=0

43
Alberta Teacher Workload Study R.A. Malatest & Associates Ltd. Alberta Education December 2015
Many teachers (44% July; 42% August) and administrators (33% July; 31% August) indicated that their position or teaching assignment would be changing in the upcoming school year. The position or teaching assignment changes most commonly reported in July and August included:
• Teaching a different grade (38% July; 36% August); • Teaching a different course (38% July; 31% August); • Teaching at a new school (13% July; 12% August); • Taking on a new leadership or administrative position (13% July; 13% August); and • Teaching additional courses (4% July; 10% August).
Figure 4.4: Proportion of Teachers/Administrators With Changing Teaching/Work Assignments
(among those that worked in the summer)
44%
33% 42%
31%
0%
10%
20%
30%
40%
50%
60%
70%
80%
90%
100%
Teachers Administrators
July AugustJuly Teachers n=1,964; DK/NR n= (2%) July Administrators n=255; DK/NR n=5 (2%) August Teachers n=1,865; DK/NR n=30 (2%) August Administrators n=137; DK/NR n=2 (1%)

44
Alberta Teacher Workload Study R.A. Malatest & Associates Ltd. Alberta Education December 2015
Tables 4.1 and 4.2 examine the difference in work activities between respondents who did or did not have an additional contract for summer work. During the summer months of July and August, teachers most commonly planned (84% July; 99% August) and/or organized/acquired materials (75% July; 96% August) for the upcoming school year. This was true of both teachers with and without an additional contract for summer work.2 Also common was the completion of general administration tasks, attendance of staff and committee meetings, and individual or group professional development, although all of these tasks occurred more frequently in August. Across the summer months of July (18%) and August (27%), approximately one in five teachers spent time moving to a new school or moving their classroom within a school. In July, almost half of the teachers with an additional contract also instructed students (48%) and communicated with parents (45%). See Table 4.1 for a complete listing of the activities completed by teachers in the months of July and August.
Table 4.2: Teacher Activities and Hours Spent on Activities in July and August (among those that worked in the summer)
Activity
Had Additional Contract (July n=210;
August n=99)
No Additional Contract (July n=1,750;
August n=1,754)
Percentage Average Hours Percentage Average
Hours
Planning for the upcoming school year July - 71% Aug - 94%
12.0 hours 20.9 hours
85% 99%
10.6 hours 21.1 hours
Organizing/acquiring materials for the upcoming school year (e.g., classroom setup)
July - 59% Aug - 93%
6.5 hours 11.2 hours
75% 96%
7.7 hours 14.1 hours
General administration (including paperwork, organizing, assessing transcripts, school duties, and other administrative tasks)
July - 46% Aug -57%
10.9 hours 12.3 hours
25% 50%
5.3 hours 6.6 hours
Staff and committee meetings, as well as other communication with colleagues
July - 43% Aug - 79%
2.8 hours 9.3 hours
27% 81%
3.7 hours 8.0 hours
Professional development group activities (e.g., conferences)
July - 17% Aug - 63%
21.2 hours 17.0 hours
9% 42%
26.7 hours 10.3 hours
Personal professional development activities (e.g., reflection and Teacher Professional Growth Plan)
July - 30% Aug - 37%
7.2 hours 4.8 hours
32% 36%
8.4 hours 4.8 hours
Communicating with parents/guardians July - 45% Aug - 31%
3.1 hours 5.0 hours
21% 29%
1.9 hours 2.5 hours
Moving schools or classrooms July - 18% Aug - 25%
5.8 hours 9.0 hours
18% 27%
7.9 hours 11.1 hours
School-related communications with other July - 13% 2.2 hours 9% 2.6 hours
2 Percentages based on teachers without contracts for summer work.

45
Alberta Teacher Workload Study R.A. Malatest & Associates Ltd. Alberta Education December 2015
Activity
Had Additional Contract (July n=210;
August n=99)
No Additional Contract (July n=1,750;
August n=1,754)
Percentage Average Hours Percentage Average
Hours community members (e.g., fundraising) Aug - 20% 6.9 hours 9% 2.9 hours
Instructing students in summer school July - 48% Aug - 11%
79.7 hours 45.3 hours
<1.0% 1%
47.1 hours 43.2 hours
Non-school related professional meetings (Alberta Teachers’ Association, district, and/or Alberta Education sponsored meetings)
July - 13% Aug - 13%
34.8 hours 14.4 hours
2% 6%
11.2 hours 11.7 hours
Tutoring students outside of summer school July - 10% Aug - 1%
9.8 hours 2.0 hours
2% 1%
10.3 hours 13.3 hours
School-sponsored trips (including fundraising and supervising students on field trips)
July - 4% Aug - 2%
11.3 hours 60.0 hours
1% 1%
35.0 hours 21.2 hours
Supervising students in school-sponsored extra-curricular activities
July - 3% Aug - 8%
8.3 hours 14.3 hours
1% 2%
23.5 hours 13.9 hours
Other July - 25% Aug - 19%
42.3 hours 17.1 hours
13% 9%
13.4 hours 16.9 hours

46
Alberta Teacher Workload Study R.A. Malatest & Associates Ltd. Alberta Education December 2015
Administrators worked more in August than July; however, administrators with an additional contract in place worked more in July than those without one. In the summer months, administrators spent time staffing, planning school schedules and education programs, monitoring and maintaining school facilities and/or managing/evaluating school infrastructure, communicating with parents, dealing with budgets and resources, and record keeping (see Table 4.2).
Table 4.3: Administrator Activities and Hours Spent on Activities in July and August (among those that worked in the summer)
Activity
Had Additional Contract (July n=23;
August n=12)
No Additional Contract (July n=230;
August n=125)
Percentage Average Hours Percentage Average
Hours
Staffing July - 78% Aug - 92%
4.4 hours 3.5 hours
51% 76%
5.7 hours 7.4 hours
Planning school schedules July - 61% Aug - 77%
9.3 hours 6.4 hours
49% 92%
8.3 hours 10.9 hours
Monitoring and maintaining school facilities July - 57% Aug - 85%
4.2 hours 2.9 hours
45% 63%
3.6 hours 3.6 hours
Parents/guardian meetings and communication July - 78% Aug - 77%
4.3 hours 3.3 hours
44% 77%
3.8 hours 4.5 hours
Budgets and resources July - 43% Aug - 69%
3.8 hours 3.9hours
42% 71%
5.3 hours 5.1 hours
Record keeping July - 48% Aug - 69%
3.7 hours 2.9 hours
25% 51%
2.9 hours 5.9 hours
Planning education programs for school July - 61% Aug - 85%
6.5 hours 9.0 hours
40% 81%
5.7 hours 9.1 hours
Managing and evaluating school infrastructure July- 48% Aug - 54%
5.5 hours 4.7 hours
34% 57%
2.8 hours 3.4 hours
Personal professional development July - 39% Aug - 54%
26.9 hours 31.0 hours
33% 44%
15.1 hours 7.6 hours
Reporting July- 35% Aug - 23%
4.1 hours 3.0 hours
19% 33%
2.9 hours 4.0 hours
Marketing and publicity July - 26% Aug - 54%
3.8 hours 4.6 hours
14% 34%
3.2 hours 2.4 hours
Professional development group activities (e.g., conferences)
July - 4% Aug - 46%
3.0 hours 22.2 hours
14% 52%
20.2 hours 9.0 hours
Assessment July- 39% Aug - 31%
8.7 hours 2.3 hours
10% 21%
5.7 hours 4.7 hours

47
Alberta Teacher Workload Study R.A. Malatest & Associates Ltd. Alberta Education December 2015
Activity
Had Additional Contract (July n=23;
August n=12)
No Additional Contract (July n=230;
August n=125)
Percentage Average Hours Percentage Average
Hours
Staff and committee meetings July - 30% Aug - 69%
2.4 hours 8.3 hours
7% 91%
7.4 hours 7.6 hours
Non-school related professional meetings (Alberta Teachers’ Association, district, and/or Alberta Education sponsored meetings)
July - 4% Aug - 8%
2.0 hours 6.0 hours
5% 13%
10.4 hours 13.5 hours
Supervising students in school-sponsored extra-curricular activities
July - 0% Aug - 0%
0.0 hours 0.0 hours
3% 5%
42.5 hours 6.5 hours
Managing summer school activities July - 48% Aug - 31%
41.9 hours 19.3 hours
2% 4%
3.6 hours 6.6 hours
Other July - 9% Aug - 8%
25.0 hours 12.0 hours
12% 12%
7.3 hours 7.9 hours

48
Alberta Teacher Workload Study R.A. Malatest & Associates Ltd. Alberta Education December 2015
SECTION 5. FINDINGS: WORKPLACE EXPERIENCE SURVEY This section describes the key findings associated with the Workplace Experience Survey in which teachers, administrators, and central office staff described their opinions regarding their work, their perceptions of changes in their workload, and the factors that contributed to satisfaction and dissatisfaction with their work.
5.1 Teacher and Administrator Findings
5.1.1 Hours Worked Outside of School Hours Approximately one-half of the administrators (54%) and slightly less than one-half of the teachers (45%) indicated that the amount of time they performed school work outside of regular hours in 2014/15 was comparable to previous years. Most of the remaining teachers and administrators indicated that hours outside of school hours increased.
Figure 5.1: Comparability of Time Worked Outside of School Hours
45% 49%
6%
54%
44%
2% 0%
10%
20%
30%
40%
50%
60%
70%
80%
90%
100%
Yes, similar to previous years No, it has increased No, it has decreased
Teachers (n=1,583) Administrators (n=128)
Teachers DK/NR n=9 (1%) Administrators DK/NR n=2 (1%)

49
Alberta Teacher Workload Study R.A. Malatest & Associates Ltd. Alberta Education December 2015
5.1.2 Work Environment Teachers reported that they were completing a large number of microtasks (tasks performed during the progress of other activities which take a small amount of time) during the teaching day. Microtasks commonly included sending emails or texts, and interacting with colleagues in-person (see Table 5.1a). Cumulatively in a day, study participants estimated that work-related microtasks took up an average of 59.29 minutes for teachers and 136.38 minutes for administrators (see Table 5.1b).
Table 5.1a: Work-Related Microtasks Completed Within a Workday
Teachers Administrators Sending emails/texts 93% 99% Interacting with colleagues in-person 90% 96% Addressing teaching materials or equipment issues 83% 77%
Answering telephone calls 59% 84% Making telephone calls 58% 90% Interacting with students/parents in person 16% 20% Collecting fees/fundraising 2% 0% Completing forms 1% 0%
Other <1% 0% None <1% 0%
Teachers n=1,583; DK/NR n=7 (<1%) Administrators n=128; DK/NR n=0
Both teachers and administrators agreed (agreed and strongly agreed) that these microtasks:
• Interrupted their work-related performance (76% teachers; 71% administrators); and • Contributed to work-related stress (81% teachers; 64% administrators).
Table 5.1b: Time Spent on Work Related Microtasks
Teachers Administrators Average time spent (Mean) 59.29 min 136.38 min
Range of time spent 5 – 360 min 20 – 400 min Teachers n=1,583 Administrators n=128

50
Alberta Teacher Workload Study R.A. Malatest & Associates Ltd. Alberta Education December 2015
Compared to last year, the majority of both teachers and administrators felt that there had been an increase in workload (65% teachers; 62% administrators), multi-tasking (76% teachers; 69% administrators), unfamiliar tasks (66% teachers; 59% administrators), and an increase in the overall complexity of their work (75% teachers; 77% administrators) (see Figures 5.2a and 5.2b).
Figure 5.2a: Teachers - Year Over Change in...
1%
1%
1%
1%
2%
4%
2%
4%
22%
29%
21%
29%
48%
49%
39%
41%
27%
17%
37%
24%
0% 20% 40% 60% 80% 100%
Overall complexity of work(DK/NR n=5 (4%))
Unfamiliar tasks(DK/NR n=13 (1%))
Amount of multi-tasking(DK/NR n=10 (1%))
Workload(DK/NR n=6 (4%))
Significantly decreased Somewhat decreased Stayed the same
Somewhat increased Significantly increased
Teachers n=1,583 Did not teach n=8 (1%)

51
Alberta Teacher Workload Study R.A. Malatest & Associates Ltd. Alberta Education December 2015
Figure 5.2b: Administrators - Year Over Change in...
0%
2%
0%
0%
2%
6%
4%
3%
22%
33%
27%
34%
43%
46%
30%
35%
34%
13%
39%
27%
0% 20% 40% 60% 80% 100%
Overall complexity of work(DK/NR n=0)
Unfamiliar task(DK/NR n=1 (1%))
Amount of multi-tasking(DK/NR n=0)
Workload(DK/NR n=1 (1%))
Significantly decreased Somewhat decreased Stayed the same
Somewhat increased Significantly increased
Administrators n=128

52
Alberta Teacher Workload Study R.A. Malatest & Associates Ltd. Alberta Education December 2015
Factors contributing to the increase in workload and work complexity most commonly cited by both teachers and administrators included increased enrollment of high-needs students and changes in the scope of their work. Approximately one-third of teachers (37%) and administrators (29%) noted that a decrease in the number of support staff had increased their workload. Student or teaching support staff, such as teaching assistants, were most commonly selected as the category of support staff no longer available by both teachers and administrators. Administrators also indicated that fewer administrative staff were available. Administrators more commonly felt that an increase in student or parent/family expectations also contributed to the increased workload. Only those teachers (n=1,296) and administrators (n=102) who said their workload had increased were asked to indicate what led to the increase.
Table 5.2: Factors Contributing to Increased Workload and Work Complexity
Teachers Administrators
Increased enrollment of high-needs students 68% 67% Changes in scope of work 61% 64% Increased student/parent/family expectations 44% 61% Technology or software not working as designed or outdated 40% 30% Loss of support staff Student or teaching support staff – teaching assistants (92% teachers; 80% administrators) Administrative staff (11% teachers; 27% administrators) Technical staff (18% teachers; 17% administrators) Other staff (0% teachers; 3% administrators)
37% 29%
Loss of teaching staff 17% 24% New technology 4% 2% Increased administrative responsibilities 4% 1% Increased expectations from administration/board 4% 4%
Increased class sizes 3% 3% Training/mentoring responsibilities 1% 1% Increased professional development activities 1% 0% Other 1% 2%
Teachers n=1,296; DK/NR n=4 (<1%) Administrators n=145; DK/NR n=0
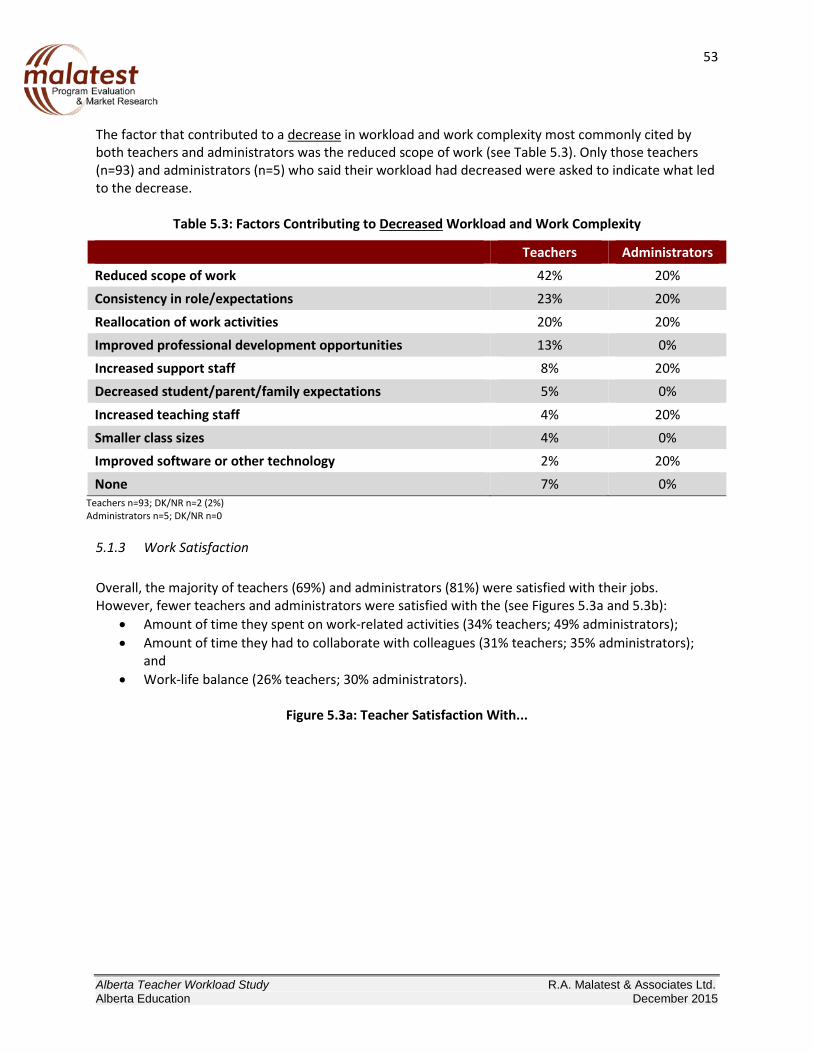
53
Alberta Teacher Workload Study R.A. Malatest & Associates Ltd. Alberta Education December 2015
The factor that contributed to a decrease in workload and work complexity most commonly cited by both teachers and administrators was the reduced scope of work (see Table 5.3). Only those teachers (n=93) and administrators (n=5) who said their workload had decreased were asked to indicate what led to the decrease.
Table 5.3: Factors Contributing to Decreased Workload and Work Complexity
Teachers Administrators Reduced scope of work 42% 20% Consistency in role/expectations 23% 20%
Reallocation of work activities 20% 20% Improved professional development opportunities 13% 0% Increased support staff 8% 20% Decreased student/parent/family expectations 5% 0%
Increased teaching staff 4% 20% Smaller class sizes 4% 0% Improved software or other technology 2% 20% None 7% 0%
Teachers n=93; DK/NR n=2 (2%) Administrators n=5; DK/NR n=0
5.1.3 Work Satisfaction Overall, the majority of teachers (69%) and administrators (81%) were satisfied with their jobs. However, fewer teachers and administrators were satisfied with the (see Figures 5.3a and 5.3b):
• Amount of time they spent on work-related activities (34% teachers; 49% administrators); • Amount of time they had to collaborate with colleagues (31% teachers; 35% administrators);
and • Work-life balance (26% teachers; 30% administrators).
Figure 5.3a: Teacher Satisfaction With...

54
Alberta Teacher Workload Study R.A. Malatest & Associates Ltd. Alberta Education December 2015
Figure 5.3b: Administrator Satisfaction With...
2%
12%
19%
7%
13%
42%
43%
37%
16%
14%
12%
20%
47%
27%
24%
30%
22%
4%
2%
4%
0% 20% 40% 60% 80% 100%
Job overall(DK/NR n=14 (1%))
Amount of time available tocollaborate with colleagues
(DK/NR n=7 (<1%))
Work-life balance(DK/NR n=4 (<1%))
Amount of time spent inwork-related activities
(DK/NR n=24 (2%))
Very dissatisfied Dissatisfied Neither satisfied nor dissatisfied Satisfied Very satisfied
2%
10%
12%
5%
8%
40%
45%
20%
9%
15%
13%
27%
47%
26%
27%
42%
34%
9%
3%
7%
0% 10% 20% 30% 40% 50% 60% 70% 80% 90% 100%
Job overall (DK/NR n=0)
Amount of time available to collaborate withcolleagues (DK/NR n=0)
Work-life balance (DK/NR n=0)
Amount of time spent in work-related activities(DK/NR n=0)
Very dissatisfied Dissatisfied Neither satisfied nor dissatisfied Satisfied Very satisfied
n=1,583
n=128
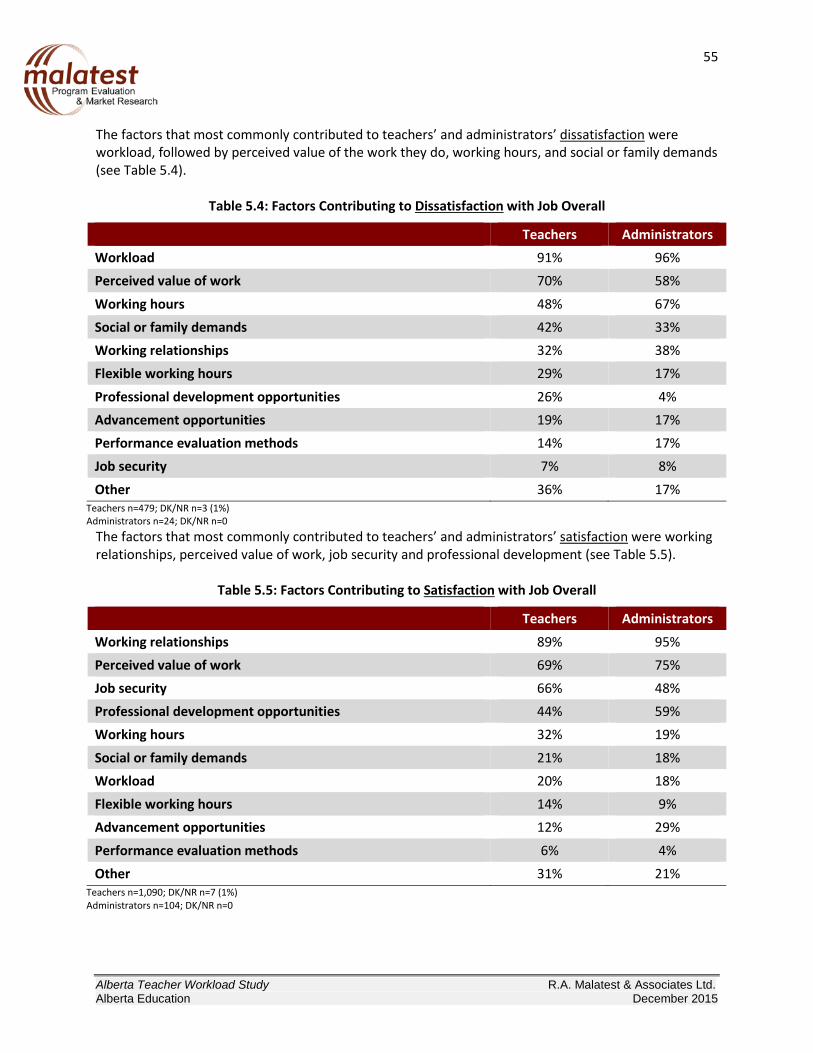
55
Alberta Teacher Workload Study R.A. Malatest & Associates Ltd. Alberta Education December 2015
The factors that most commonly contributed to teachers’ and administrators’ dissatisfaction were workload, followed by perceived value of the work they do, working hours, and social or family demands (see Table 5.4).
Table 5.4: Factors Contributing to Dissatisfaction with Job Overall
Teachers Administrators Workload 91% 96% Perceived value of work 70% 58%
Working hours 48% 67% Social or family demands 42% 33% Working relationships 32% 38% Flexible working hours 29% 17%
Professional development opportunities 26% 4% Advancement opportunities 19% 17% Performance evaluation methods 14% 17% Job security 7% 8%
Other 36% 17% Teachers n=479; DK/NR n=3 (1%) Administrators n=24; DK/NR n=0
The factors that most commonly contributed to teachers’ and administrators’ satisfaction were working relationships, perceived value of work, job security and professional development (see Table 5.5).
Table 5.5: Factors Contributing to Satisfaction with Job Overall
Teachers Administrators
Working relationships 89% 95% Perceived value of work 69% 75% Job security 66% 48% Professional development opportunities 44% 59% Working hours 32% 19%
Social or family demands 21% 18% Workload 20% 18% Flexible working hours 14% 9% Advancement opportunities 12% 29%
Performance evaluation methods 6% 4% Other 31% 21%
Teachers n=1,090; DK/NR n=7 (1%) Administrators n=104; DK/NR n=0

56
Alberta Teacher Workload Study R.A. Malatest & Associates Ltd. Alberta Education December 2015
Generally, teachers (84%) and administrators (74%) agreed that workload caused them stress. However, they also noted that their work time was well spent (66% teachers; 79% administrators)(see Figure 5.4).
Figure 5.4: Work Stress and Time Well Spent
1%
1%
4%
2%
6%
14%
7%
4%
13%
17%
16%
10%
63%
48%
45%
49%
16%
18%
29%
35%
0% 20% 40% 60% 80% 100%
Work time is well spent -Adminstrators
(DK/NR n=1 (1%))
Work time is well spent -Teachers
(DK/NR n=41 (3%))
Workload causes stress -Administrators
(DK/NR n=0)
Workload causes stress -Teachers
(DK/NR n=9(1%))
Strongly disagree Disagree Neither agree nor disagree Agree Strongly agree
Teachers n=1,583 Administrators n=128

57
Alberta Teacher Workload Study R.A. Malatest & Associates Ltd. Alberta Education December 2015
Both teachers (87%) and administrators (93%) felt that the rate of change was somewhat or significantly increasing. Accompanying this change in expectations was a change in autonomy. Almost one-half (43%) of the teachers surveyed felt that their professional autonomy was decreasing. Administrators were less likely to have agreed that their professional autonomy had decreased (see Figure 5.5).
Figure 5.5: Change in Teaching Expectations and Professional Autonomy
0%
1%
6%
12%
1%
1%
18%
31%
4%
7%
31%
35%
37%
32%
21%
11%
56%
55%
15%
6%
0% 20% 40% 60% 80% 100%
Rate of change inteaching expectations -
Administrators(NTchg/DK/NR n=4 (3%))
Rate of change inteaching expectations -
Teachers(NTchg/DK/NR n=85…
Professional autonomy -Administrators
(NTchg/DK/NR n=12(9%))
Professional autonomy -Teachers
(NTchg/DK/NR n=76(5%))
Significantly decreased Somewhat decreased Stayed the same
Somewhat increased Significantly increasedTeachers n=1,583 Administrators n=128

58
Alberta Teacher Workload Study R.A. Malatest & Associates Ltd. Alberta Education December 2015
5.2 Central Office Staff Findings
5.2.1 Work Environment As with teachers and administrators, central office staff reported completing a large number of micro-tasks during their day, including sending emails or texts (98%) and interacting with colleagues in-person (93%)(see Table 5.6). Central office staff estimated that work-related microtasks took up an average of 84 minutes in a day (see Table 5.7). Central office staff reported (agreed and strongly agreed) that these microtasks:
• Interrupted their work-related performance (56%); and • Contributed to work-related stress (53%).
Table 5.6: Work Related Microtasks Completed Within a Workday
Central Office Staff
Sending emails/texts 98% Interacting with colleagues in-person 93% Addressing equipment issues 52% Answering telephone calls 73% Making telephone calls 70% n=56; None n=1 (2%)
Table 5.7: Time Spent on Work-Related Microtasks
Central Office Staff Average time spent (Mean) 84 minutes
Median 60 minutes Range of time spent 15 - 180 minutes n=56; DK n=26 (47%)

59
Alberta Teacher Workload Study R.A. Malatest & Associates Ltd. Alberta Education December 2015
5.2.2 Work Satisfaction Central office staff reported high work satisfaction, as 78% indicated they were very satisfied or satisfied with their jobs. Half or more of the central office staff were also satisfied with the:
• Amount of time they spent on work-related activities (67%); • Amount of time they had to collaborate with colleagues (58%); and • Work-life balance (47%).
Figure 5.6: Central Office Staff Satisfaction With...
0%
5%
9%
2%
5%
27%
21%
13%
16%
11%
23%
20%
46%
45%
38%
54%
32%
13%
9%
13%
0% 20% 40% 60% 80% 100%
Job overall
Amount of time available tocollaborate with colleagues
Work-life balance
Amount of time spent inwork-related activities
Very dissatisfied Dissatisfied Neither satisfied nor dissatisfied Satisfied Very satisfied
n=56

60
Alberta Teacher Workload Study R.A. Malatest & Associates Ltd. Alberta Education December 2015
The two key factors that influenced work dissatisfaction among central office staff were the workload (92%) and perceived value of the work completed (83%).
Table 5.8: Factors Contributing to Dissatisfaction with Job Overall
Central Office Staff Workload 92%
Perceived value of work 83% Working hours 50% Professional development opportunities 42% Advancement opportunities 42% Working relationships 33%
Flexible working hours 33% Job security 25% Social or family demands 17% Performance evaluation methods 16% n=56 The factors that most commonly contributed to central office staff satisfaction were working relationships (86%), perceived value of the work completed (73%), and professional development opportunities (59%).
Table 5.9: Factors Contributing to Satisfaction with Job Overall
Central Office Staff Working relationships 86% Perceived value of work 73% Professional development opportunities 59% Job security 48%
Working hours 41% Workload 25% Flexible working hours 18% Advancement opportunities 18%
Social or family demands 16% Performance evaluation methods 9% Other 11% n=56; DK/NR n=2

61
Alberta Teacher Workload Study R.A. Malatest & Associates Ltd. Alberta Education December 2015
Most (65%) central office staff felt that their workload caused them stress. Despite the stress, central office staff (80%) believed that their work time was well spent.
Figure 5.7: Factors Impacting Work Stress and Satisfaction
Thinking about the past five years, central office staff indicated that the rate of change in their professional expectations has generally increased (66%). Central office staff were split between those that believed that their professional autonomy had decreased (34%), stayed the same (27%), and had increased (33%).
Figure 5.8: Change in Professional Expectations and Professional Autonomy
2%
0%
5%
18%
11%
16%
55%
45%
25%
20%
0% 20% 40% 60% 80% 100%
Work time is well spent
Workload causes stress
Strongly disagree Disagree Neither agree nor disagree Agree Strongly agree
0%
5%
5%
29%
21%
27%
25%
20%
41%
13%
0% 20% 40% 60% 80% 100%
Professionalexpectations
Professional autonomy
Significantly decreased Somewhat decreased Stayed the same
Somewhat increased Significantly increased
n=56; DK/NR n=1
n=56; Not working 5 years n=1; DK/NR n=3 (5%)
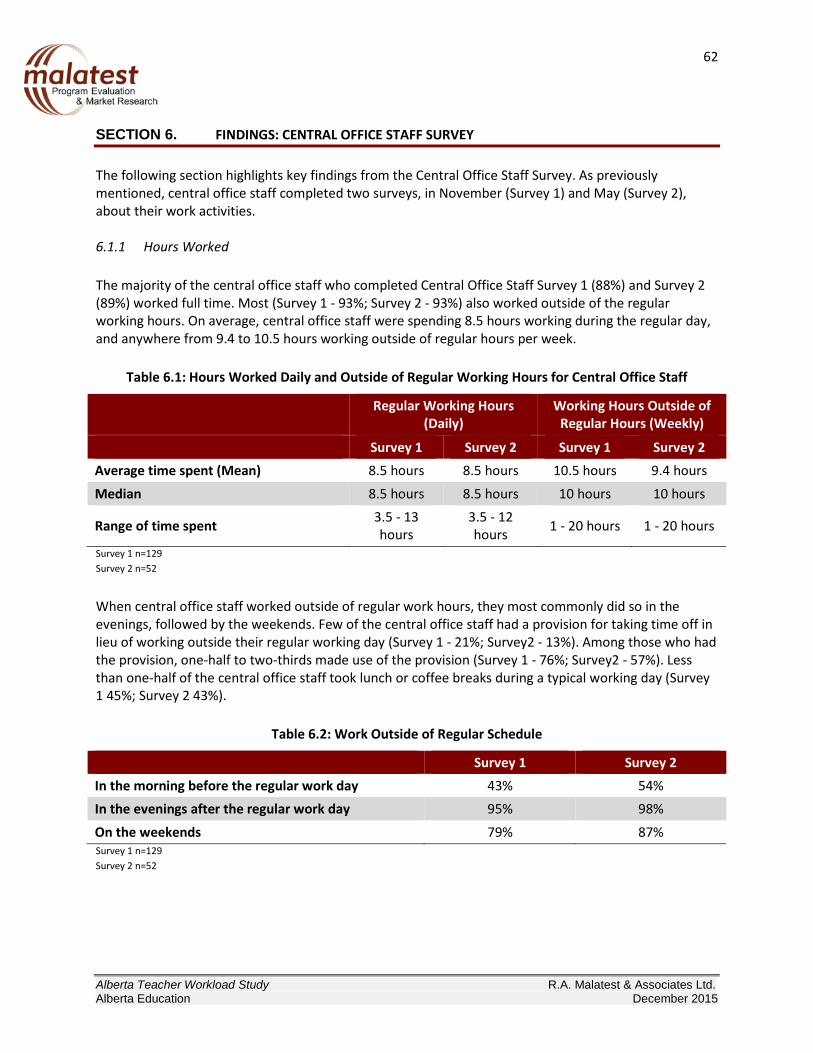
62
Alberta Teacher Workload Study R.A. Malatest & Associates Ltd. Alberta Education December 2015
SECTION 6. FINDINGS: CENTRAL OFFICE STAFF SURVEY The following section highlights key findings from the Central Office Staff Survey. As previously mentioned, central office staff completed two surveys, in November (Survey 1) and May (Survey 2), about their work activities. 6.1.1 Hours Worked The majority of the central office staff who completed Central Office Staff Survey 1 (88%) and Survey 2 (89%) worked full time. Most (Survey 1 - 93%; Survey 2 - 93%) also worked outside of the regular working hours. On average, central office staff were spending 8.5 hours working during the regular day, and anywhere from 9.4 to 10.5 hours working outside of regular hours per week.
Table 6.1: Hours Worked Daily and Outside of Regular Working Hours for Central Office Staff
Regular Working Hours (Daily)
Working Hours Outside of Regular Hours (Weekly)
Survey 1 Survey 2 Survey 1 Survey 2 Average time spent (Mean) 8.5 hours 8.5 hours 10.5 hours 9.4 hours
Median 8.5 hours 8.5 hours 10 hours 10 hours
Range of time spent 3.5 - 13 hours
3.5 - 12 hours 1 - 20 hours 1 - 20 hours
Survey 1 n=129 Survey 2 n=52
When central office staff worked outside of regular work hours, they most commonly did so in the evenings, followed by the weekends. Few of the central office staff had a provision for taking time off in lieu of working outside their regular working day (Survey 1 - 21%; Survey2 - 13%). Among those who had the provision, one-half to two-thirds made use of the provision (Survey 1 - 76%; Survey2 - 57%). Less than one-half of the central office staff took lunch or coffee breaks during a typical working day (Survey 1 45%; Survey 2 43%).
Table 6.2: Work Outside of Regular Schedule
Survey 1 Survey 2 In the morning before the regular work day 43% 54% In the evenings after the regular work day 95% 98%
On the weekends 79% 87% Survey 1 n=129 Survey 2 n=52

63
Alberta Teacher Workload Study R.A. Malatest & Associates Ltd. Alberta Education December 2015
A high proportion of central office staff were spending their work days working with teachers, and developing and assessing or selecting curriculum materials/PD workshops or delivering workshops. Administrative tasks also took up much of central office staff’s time during a week, with a high proportion indicating they were spending time responding to/writing emails, communicating with colleagues, and administration/record keeping. Staff were engaged in similar activities across the two phases of the survey and at the same intensity level (see Table 6.3).
Table 6.3: Central Office Staff Activities and Hours Spent During One Week
Activity
Survey 1 Survey 2
Percentage of Staff Working on
Task
Average Hours Spent
Percentage of Staff
Working on Task
Average Hours Spent
Responding to and writing emails 98% 4.8 hours 96% 5.9 hours
Developing, assessing, selecting curriculum materials and PD workshops and delivering workshops, and planning
88% 7.2 hours 80% 6.3 hours
Working with teachers (coaching, evaluating, supervision, staffing) 87% 8.7 hours 88% 6.7 hours
Communication with colleagues/coworkers and/or online information distribution 84% 4.0 hours 88% 3.9 hours
Lunch and breaks 83% 2.4 hours 80% 2.0 hours General administration and record keeping 80% 3.1 hours 80% 2.5 hours Meetings with committees, board, parents, teachers, etc. 79% 3.3 hours 68% 3.6 hours
Personal professional development (reading, attending conferences and courses) 78% 2.3 hours 71% 2.0 hours
Student support (assessment, evaluation, placements, etc.) 74% 7.5 hours 66% 9.9 hours
Communicating with clients in-person or by telephone 66% 3.1 hours 79% 3.8 hours
Travelling during work hours 54% 3.9 hours 61% 4.6 hours In-school events and extracurricular activities 53% 3.2 hours 50% 4.8 hours
Technical support and maintenance 45% 2.2 hours 39% 1.6 hours
Finances, planning and reporting 41% 2.7 hours 41% 3.0 hours Budgeting and resource management 39% 2.2 hours 55% 2.6 hours Instruction 20% 27.4 hours 16% 31.2 hours Other 4% 9.2 hours 2% 21.2 hours
Survey 1 n=129 Survey 2 n=52

64
Alberta Teacher Workload Study R.A. Malatest & Associates Ltd. Alberta Education December 2015
Most central office staff indicated that, compared to last year, the overall complexity of their work and the amount of multi-tasking they were required to complete has increased. Approximately half of the respondents also felt that the number of unfamiliar tasks and their overall workload had increased (see Figure 6.1). Findings were similar when central office staff were surveyed in November and May.
Figure 6.1: Central Office Staff – Year Over Change in…
1%
2% 6%
9%
2%
2%
3% 4%
31%
34%
37%
34%
30%
36%
33%
46%
66%
64%
55%
54%
65%
63%
56%
48%
0% 20% 40% 60% 80% 100%
Overall complexity of work…
Overall complexity of work…
Unfamiliar task - S1
Unfamiliar task - S2
Amount of multi-tasking - S1
Amount of multi-tasking - S2
Workload - S1
Workload - S2
Decreased Stayed the same Increased
Workload S2 DK/NR n=1 (2%); S1 n=11 (8%) Multi-tasking S2 DK/NR n=0; S1 n=4 (3%) Unfamiliar tasks S2 DK/NR n=2 (4%); S1 n=3 (2%) Complexity S2 DK/NR n=0; S1 n=3 (2%)
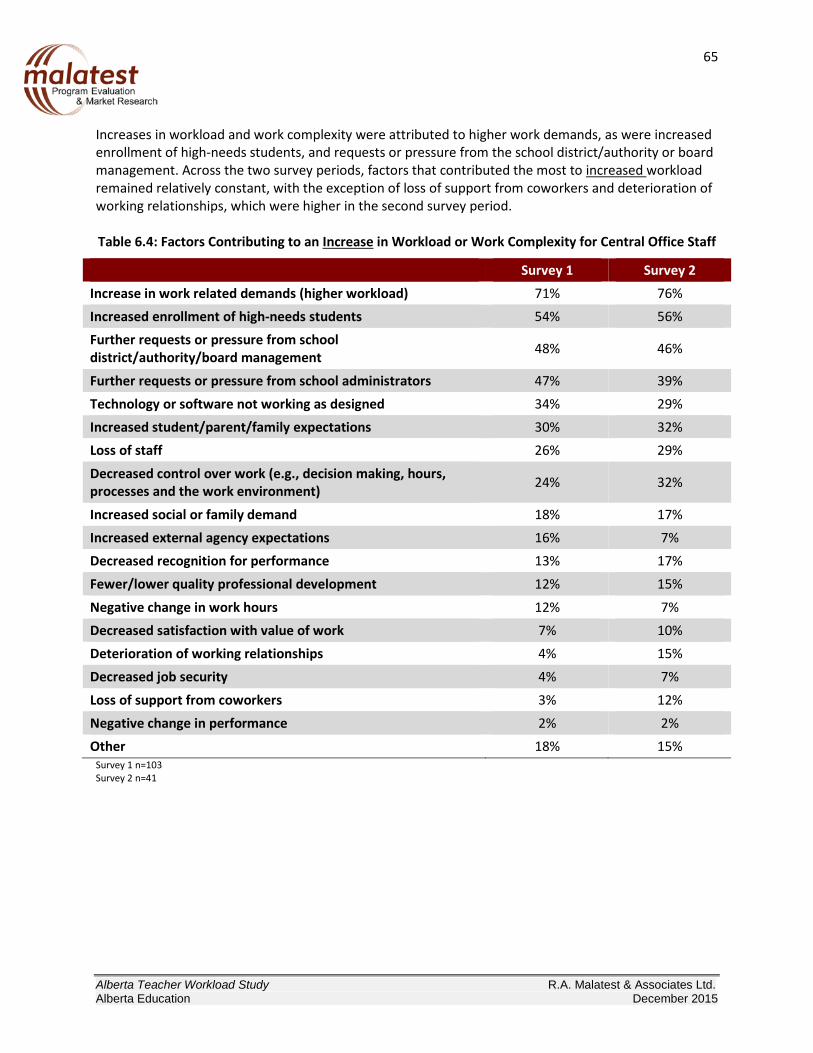
65
Alberta Teacher Workload Study R.A. Malatest & Associates Ltd. Alberta Education December 2015
Increases in workload and work complexity were attributed to higher work demands, as were increased enrollment of high-needs students, and requests or pressure from the school district/authority or board management. Across the two survey periods, factors that contributed the most to increased workload remained relatively constant, with the exception of loss of support from coworkers and deterioration of working relationships, which were higher in the second survey period. Table 6.4: Factors Contributing to an Increase in Workload or Work Complexity for Central Office Staff
Survey 1 Survey 2 Increase in work related demands (higher workload) 71% 76% Increased enrollment of high-needs students 54% 56% Further requests or pressure from school district/authority/board management 48% 46%
Further requests or pressure from school administrators 47% 39% Technology or software not working as designed 34% 29% Increased student/parent/family expectations 30% 32% Loss of staff 26% 29%
Decreased control over work (e.g., decision making, hours, processes and the work environment) 24% 32%
Increased social or family demand 18% 17% Increased external agency expectations 16% 7% Decreased recognition for performance 13% 17% Fewer/lower quality professional development 12% 15%
Negative change in work hours 12% 7% Decreased satisfaction with value of work 7% 10% Deterioration of working relationships 4% 15% Decreased job security 4% 7%
Loss of support from coworkers 3% 12% Negative change in performance 2% 2% Other 18% 15%
Survey 1 n=103 Survey 2 n=41

66
Alberta Teacher Workload Study R.A. Malatest & Associates Ltd. Alberta Education December 2015
Few central office staff reported a decrease in workload or work complexity compared to the previous year, across either Survey 1 (n=5) or Survey 2 (n=3). Workload most commonly decreased as a result of a reallocation of work activities or flexibility in working hours. Table 6.5: Factors Contributing to a Decrease in Workload or Work Complexity for Central Office Staff
Survey 1 Survey 2 Reallocation of work activities 20% 0% Increased staff/support 20% 33%
Improved working relationships 20% 0% Increased job security 20% 33% Improved software or other technology 0% 33% Increased recognition of performance 0% 33%
Increased flexibility in working hours 0% 67% Increased control over work 0% 33% Increased satisfaction with value of work 0% 33% Other 80% 0%
None 0% 33% Survey 1 n=5; Survey 2 n=3 6.1.2 Work in Summer Months Only 19% (n=26) of central office staff worked under a contract that included summer months. Of those without a contract (81%), the majority (81%) worked in the summer. The remaining 19% did not work in the summer. Those that worked commonly:
• Completed research for the upcoming year (80%); • Responded to work-related emails (64%); • Completed professional development activities and conferences (53%); and • Attended meetings with colleagues and/or clients (25%).
Compared to the rest of the year, central office staff’s workload either stayed the same (45%) or decreased (36%) in the summer. Few (9%) indicated their workload increased, and 9% could not answer the question.

67
Alberta Teacher Workload Study R.A. Malatest & Associates Ltd. Alberta Education December 2015
SECTION 7. CONCLUSIONS The Alberta Teacher Workload Study was ambitious in scope and magnitude. It was the first Canadian study to measure teacher and administrator work activities in real time, rather than through recollections, and to do so for an entire year with a sample of teachers and administrators across a province. The completion of the study was possible only through the time and energy invested by the Research Advisory Committee, and the considerable number of teacher, administrator, and central office staff participants. In the summer months, teachers and administrators generally spent their time planning and preparing for the upcoming school year. The amount of time that teachers worked in the summer increased in August as the school year approached. During the school year teachers and administrators were working over 40 hours per week, even when accounting for teachers/administrators who did not work due to sick days or holidays; with administrators tending to work longer hours than teachers. Thus, teachers worked on average 44.2 hours a week and administrators 46.2 hours a week. Between September and June, teachers and administrators worked approximately 2,000 hours (teachers: 1,943.9 hours; administrators: 2,032.1 hours These hours include a considerable number of hours (457.56 hours teachers; 515.0 hours administrators) outside regular school hours (mornings, evenings and weekends). The number of hours worked varied across the months with teachers and administrators generally working longer hours in September, October and March. During the week, they worked longer hours on Tuesday through Thursday. During school hours (8:00 am and 4:30 pm weekdays) teachers are spend majority (59%) of their time in the classroom instructing and supervising students. This means that other responsibilities associated with teaching, such as grading/assessment and planning/preparing for classes, form the majority of activities completed outside of the regular school hours. Administrators were engaged in a variety of tasks, including administration and professional development and meetings, during and outside of regular school hours. They also spent a considerable proportion of the school day working with students. Teachers frequently reported increasingly complex workloads. Teachers attributed increases in workload and complexity to changes in their scope of work, increased enrolment of high-needs students, and increased family expectations. Meanwhile, the number of support staff has decreased in the schools, particularly teaching support staff. Compared to last year, many teachers and administrators also reported they had higher workloads and more difficult work. The higher workload was accompanied by complexity and unfamiliar tasks and multi-tasking. Teachers (59 minutes) and administrators (136 minutes) spent up to an hour and half on microtasks, such as answering emails, daily. These micro-tasks were completed concurrently with other core work activities. Overall, teacher and administrator workload was causing stress and low satisfaction with their work-life
68
Alberta Teacher Workload Study R.A. Malatest & Associates Ltd. Alberta Education December 2015
balance. As well, microtasks were disruptive and contributed to workplace stress. Despite these challenges, there was a high level of job satisfaction among teachers (69%) and administrators (81%). Central Office Staff Retrospectively, central office staff reported that they spent their work time supporting teachers and in communication activities. Central office staff worked an average of 9.4 to 10.5 hours working outside of their regular schedule per week. This work was primarily completed on the evenings and weekends. As with teachers and administrators, central office staff reported that their workloads were becoming larger and more complex. They also attributed this to increased enrolment of high-needs students and higher expectations or demands. Although central office staff also contributed much of their work day to microtasks (84 minutes on average), such as sending emails and interacting with colleagues, fewer found them interruptive or stressful.