reflections on teaching - teachers on teaching: teacher efficacy and the professional capital of...
TRANSCRIPT
An
ATA
Researc
h U
pd
ate
: A
pri
l 2
01
4Reflections on Teaching:
Teacher Efficacy and the Professional Capital of Alberta Teachers

© Copyright 2014
Unauthorized use or duplication without prior approval is strictly prohibited.
ISBN 978-1-927074-21-3
The Alberta Teachers’ Association
11010 142 Street NW, Edmonton, AB T5N 2R1
Telephone 780-447-9400 or 1-800-232-7208
www.teachers.ab.ca

Reflections on Teaching: Teacher Efficacy and the Professional Capital of Alberta Teachers • i
Table of ContentsForeword ............................................................................................................................................................ iii
Preface .................................................................................................................................................................. v
Overview: Critical Influences Shaping Alberta Teachers’ Conditions of Practice ....................................................................................................................................... 1
Background and Methodology ........................................................................................................................ 3Initial Survey Analysis .................................................................................................................................... 3
Activity I and II Line Charts ........................................................................................................................... 3Activity I and II Written Responses ............................................................................................................... 4Activity III Written Responses ....................................................................................................................... 4
The Two Study Cohorts .................................................................................................................................. 5Facilitated Activities ........................................................................................................................................ 5
Activity I: My Effectiveness and Impact as a Teacher .................................................................................... 5Activity II: My Work–Life Balance and Well-Being ....................................................................................... 6Activity III: My Effectiveness and Work–Life Balance ................................................................................... 6
Methodological Limitations ........................................................................................................................... 6
Literature Review ............................................................................................................................................... 9The Alberta Context ........................................................................................................................................ 9Canadian Workload Studies ........................................................................................................................... 9Elements That Affect Work–Life Balance ................................................................................................... 12
Working Conditions ...................................................................................................................................... 12Teacher–Student Interactions ........................................................................................................................ 13Teacher Attributes ......................................................................................................................................... 13Stressors ........................................................................................................................................................ 13Systemic Elements ......................................................................................................................................... 14Acknowledging “Invisible” Work ................................................................................................................. 16
Summary of Literature Review .................................................................................................................... 17
Reflections on the School Year: Case Study Findings ............................................................................... 19Overall Patterns in Effectiveness and Well-Being ..................................................................................... 19Correlations with the Day and Gu Model .................................................................................................. 23Top Factors Influencing Teachers’ Efficacy and Well-Being .................................................................... 23Sub-Factors Associated with Practice, Personal, Students and Policy ................................................... 27Factors Influencing High Points .................................................................................................................. 28
Sub-Factors Associated with Practice ........................................................................................................... 28Sub-Factors Associated with Personal .......................................................................................................... 32Sub-Factors Associated with Students .......................................................................................................... 34Sub-Factors Associated with Policy .............................................................................................................. 36

ii • Reflections on Teaching: Teacher Efficacy and the Professional Capital of Alberta Teachers
Factors Influencing Low Points ................................................................................................................... 36Sub-Factors Associated with Practice ........................................................................................................... 36Sub-Factors Associated with Personal .......................................................................................................... 39Sub-Factors Associated with Students .......................................................................................................... 41Sub-Factors Associated with Policy .............................................................................................................. 44
Factors Identified in Activity III................................................................................................................... 46Sub-Factors Related to Practice .................................................................................................................... 46Sub-Factors Related to Personal ................................................................................................................... 46Sub-Factors Related to Students ................................................................................................................... 47Sub-Factors Related to Policy ....................................................................................................................... 47
Developing Efficacy and Well-Being by Building Professional Capital ............................................... 49Typical High and Low Points in the Year ................................................................................................... 50
High Points ................................................................................................................................................... 50Low Points ..................................................................................................................................................... 51
Achieving a Work–Life Balance ................................................................................................................... 52Healthful Coping Strategies .......................................................................................................................... 53Unhealthful Coping Strategies ...................................................................................................................... 53
Building the Professional Capital of Alberta Teachers ............................................................................. 54
Implications and Next Steps .......................................................................................................................... 59
References .......................................................................................................................................................... 63
Appendix A—School Year Reflection: My Work Life and Effectiveness as a Teacher ....................... 65
Appendix B—Facilitator’s Guide .................................................................................................................. 69
Reflections on Teaching: Teacher Efficacy and the Professional Capital of Alberta Teachers • iii
ForewordI have been a teacher my entire life. I am proud to be a teacher and have often written about the fundamental nobility of the profession. That teachers engage children in loco parentis—acting with agency in the classroom to protect and help children build futures—suggests the power that society has granted teachers. Society believes that teachers are crucial. I agree. But, more important, teachers agree. Most teachers take up their work as a calling.
My experience has shown me, over and over, that teaching is not an easy profession. Rewarding? Yes! Easy? Well, not so much. Sometimes teachers feel overwhelmed by the work and the pressures of the job. These pressures force almost daily choices: Work or rest? Students or family? Self or others? Making these choices would be easy if teachers didn’t care, but, fortunately for everyone, they do care. Teachers are acting parents of the children they teach. Most teachers believe that they make a difference and are willing to do whatever it takes to make that difference. Some days teachers feel that they are living through the 1998 Robin Williams movie What Dreams May Come in which the main character travels through hell to find and save his wife. It is probably not too over-the-top to suggest that teachers are willing to travel that same road with children. The research that follows makes that case clearly.
Yes, teaching can be that stressful. Children’s lives are at stake.
I am not making this up. Psychotherapist Carl Jung might well have had teachers in mind when he proposed the archetype of the wounded healer. Jung believed that, in relating to patients, an analyst can take on their pain, a phenomenon that can be both positive and negative. I know that this experience is part of the psyche of teachers. Teachers take on students’ wounds to gain the blessing: student learning. In his book The Wounded Healer, Catholic priest Henri Nouwen counselled men and women interested in serving their communities to begin by realizing that being wounded is a common human experience. Nouwen’s analysis—a suffering world, a suffering child and a suffering teacher—opens those who serve to being caring professionals.
The research that follows offers a clear picture of how difficult teaching is and how radically the choices that teachers make can weigh on their bodies, minds and hearts. The following report is the collective story of almost 140 teachers: more than 90 from a large urban high school and just under 50 from all over Alberta. All volunteered to participate in this study, which asked them to identify high and low points in the year with respect to both their professional practice and their personal lives. Ultimately, data are the stories the research participants tell.
Participants’ responses are stories about the work lives of teachers. These personal and professional stories highlight the collective difficulties and joys of their work—the highs and lows. They also help us understand the immensely difficult choices that teachers must make as they carry out their work. They are at once teaching their students and trying to survive. The data outline the shortcomings of their work, their own inabilities and their feelings about their successes and failures.
Teachers live in an environment that is constantly shifting: Will they have a job next year? Will the curriculum be redesigned or will their class size change just when they are becoming comfortable with the way things are? Will their colleagues be transferred? Will their school culture change? Knowing that they are not superheroes, will their energy wane? Will they receive support for their work? What might this support look like?
What follows is a report by teachers about what makes their job both difficult and rewarding. The findings from this study about the support that Alberta teachers need mirrors what researchers in other places are reporting. Specifically, teachers in this study find great support in their colleagues and wish that they had more opportunities for collaboration. My own recent research on this topic
iv • Reflections on Teaching: Teacher Efficacy and the Professional Capital of Alberta Teachers
(Exploring the Development of Teacher Efficacy Through Professional Learning Experiences, carried out with the assistance of Larry Beauchamp, Rob Klassen, Tracy Durksen and Leah Taylor) pointed to the same conclusion: teachers attain the highest level of professional growth by collaborating with colleagues.
Finally, this study offers a methodology for capturing teachers’ stories and insights. Any research study is more than data and findings; it is also about engaging with participants. In this study, teachers discuss their highs and lows and their ability to achieve a work–life balance. In this regard, the methodology is quite ingenious, for it encourages teachers to talk together about their own and their colleagues’ work lives. The study itself, in other words, is an instance of the kind of collaboration and community reflection that teachers find so powerful.
I have no doubt that the teachers and the school leaders who participated in this study know far more about themselves and their colleagues than they did when they began. I also believe that they have a clearer idea of what they might do to meet their own needs so that they have a better chance of fulfilling the needs of their students. I suggest that people interested in teachers’ work lives and in building the professional capital of teachers use the methodology described here as a year-end reflection activity.
Jim ParsonsUniversity of Alberta
Reflections on Teaching: Teacher Efficacy and the Professional Capital of Alberta Teachers • v
PrefaceIn focusing on high-quality teaching, policy-makers often ignore the importance of creating optimal conditions of practice for teachers. Conditions of practice affect the psychological lives of teachers, colouring their relationships with their students and school communities, touching their personal lives and influencing the broader educational environment in which they work.
This research study explores the following question: What key factors affect teachers’ sense of efficacy and their ability to achieve a work–life balance during the school year? In attempting to answer this question, the study examined the effectiveness of a tool that school leaders can use to engage teachers in a collaborative inquiry about the critical influences that shape their working lives on a daily basis. This tool (see Appendix A) and the accompanying facilitation process (see Appendix B) were modelled on those developed by Christopher Day and Qing Gu (2010) in their comprehensive study of teachers’ work in the United Kingdom. Principals are encouraged to use this tool to help teachers explore the factors that affect their efficacy and their ability to achieve a work–life balance.
The current study also builds on two recent Alberta-based studies on teachers’ work lives: (1) The 2011/12 National Study on Balancing Work, Life and Care Giving: The Situation for Alberta Teachers (Duxbury and Higgins 2013) and (2) The New Work of Teaching: A Case Study of the Worklife of Calgary Public Teachers (ATA 2012c). These studies identified several factors that affect teachers’ perceived capacity to carry out their professional roles and responsibilities and their ability to achieve a work–life balance.
The study is timely: teachers and policy-makers across Canada are currently grappling with the growing intensification of teachers’ work. Following highly contested labour negotiations in 2013, the governments of Ontario and Alberta agreed to undertake comprehensive studies of the workload of their teachers. Many academics, including a research team from the University of Alberta, are also studying the factors that sustain teacher efficacy.
This study and the final report is a collaborative effort. J-C Couture, associate coordinator of research with the Alberta Teachers’ Association (ATA), designed the study and oversaw the analysis of the data. Leah Taylor, an education writer and researcher, took the lead in writing this report. Michelle Tyslau, a graduate student and teacher from southern Alberta, carried out the extensive literature review and helped analyze the data. Helping shape the research design and guide the final report were Jim Parsons, a professor at the University of Alberta; Jean Stiles, principal of Jasper Place High School in Edmonton; and Laura Tisdale, a teacher in Wolf Creek. Jason Daniels and his team at Evaluation and Research Services, Faculty of Extension, University of Alberta, developed the statistical models used in the study. Harlan James, administrative officer with the ATA, shepherded the study through the publication process.
I trust that this study will assist the education partners in working together to create the conditions of teaching practice that will ensure a great school for all students in Alberta.
Gordon ThomasExecutive Secretary

Reflections on Teaching: Teacher Efficacy and the Professional Capital of Alberta Teachers • 1
Overview: Critical Influences Shaping Alberta Teachers’ Conditions of Practice
Many stakeholders are studying the increasing complexity and intensification of the work of Canadian teachers and their sense of efficacy and well-being in an environment of continuous reform. The study reported here contributes to this research by exploring the following question: What factors influence teachers’ sense of efficacy and their ability to achieve a work–life balance during the course of the school year?
This study also explores the applicability to Alberta teachers of the mixed-methods approach developed by Christopher Day and Qing Gu (2010) in their study of factors affecting the sense of well-being and efficacy of teachers in the United Kingdom. Day and Gu were especially interested in identifying the experiences of teachers that might affect the ability of their students to learn. In addition to summarizing the results of the survey, the report provides a sample of teachers’ responses to the survey questions.
Researchers piloted the survey instrument (see Appendix A) in June of 2013 in 90-minute focus groups that took place in three secondary schools in Alberta. A total of 117 teachers participated in these groups. At the ATA’s Summer Conference in August 2013, an additional 44 teachers completed the response booklets. For the purposes of the study, 94 responses received from one of the high schools surveyed in June (referred to hereafter as the school cohort) and the 44 surveys completed at Summer Conference (referred to hereafter as the conference cohort) were analyzed. This report summarizes an analysis of the 1,600 handwritten answers collected from these 138 teachers.
The survey asked respondents to reflect on their previous school year and to draw two line charts: one representing the highs and lows that they experienced with respect to their sense of professional efficacy during the 2012/13 school
year (September to June), and the second depicting the peaks and troughs that they experienced with respect to their personal well-being during the same period. The survey then asked teachers to identify the factors that most influenced the highs and lows in each line chart and that were generally most influential in their personal and professional lives.
In their study, Day and Gu (2010, 52) sorted the influences reported by teachers into four categories: Personal, Pupil, Practice Setting and Policy. Using the work of Day and Gu as a model, researchers in the current study sorted the factors identified by participants into three groups:
1. Top factors influencing high points in the school year
2. Top factors influencing low points in the school year
3. Top factors influencing efficacy and work–life balance in the school year
An analysis of the relationship between participants’ comments and their reported sense of efficacy and well-being form the basis of much of this report. Overall, the findings echo those of Day and Gu. The study, for example, supports Day and Gu’s finding that Practice Setting is the most significant factor in determining the highs and lows that a teacher experiences during the year. (Because teachers’ comments suggest that relationships are more critical than the setting per se, this factor will be referred to hereafter simply as Practice.) The next section, Background and Methodology, further analyzes participants’ descriptions of their highs and lows to determine the kind of experiences that fall into each of the four categories: Personal, Pupil, Practice and Policy.
A literature review follows, which examines studies on teacher work–life balance that have
2 • Reflections on Teaching: Teacher Efficacy and the Professional Capital of Alberta Teachers
been conducted across Canada and identifies similarities and differences between the findings of those studies and the results of the current study.
The survey results and analysis provide insight into significant cultural and social issues affecting teachers in Alberta. The findings generally align with those of Day and Gu (2010), as well as with those of several other studies cited in the literature review. The study also
confirms that the reflective survey instrument (contained in Appendix A) can, in a facilitated setting, be used as a staff-development activity.
The study demonstrates that the factors shaping teachers’ sense of efficacy and well-being in today’s complex classrooms can be understood. Although the line of inquiry parsed in this study offers important insights, more work is needed. School leaders, in particular, are urged to engage their staff members in open conversations about the factors that sustain high-quality teaching.
Reflections on Teaching: Teacher Efficacy and the Professional Capital of Alberta Teachers • 3
Drawing on the mixed-methods approach developed by Day and Gu (2010), this study examines the key factors that influence the everyday lives of teachers and the ways in which they negotiate the complex array of roles and responsibilities that they encounter throughout the school year. In their initial study, Day and Gu invited teachers in the United Kingdom to reflect on up to 15 years of their teaching experience. The current study, by contrast, asked teachers to reflect only on their most recent year of work.
In June 2013, the researchers invited 117 teachers in three schools to look back over the 2012/13 school year and to draw a line chart depicting the high and low points of their sense of effectiveness and impact on student learning. Participants were then asked to draw a second line chart depicting the highs and lows of their overall sense of well-being throughout the same year. To facilitate these activities, researchers used a reflective tool (School Year Reflection: My Work Life and Effectiveness as a Teacher, shown in Appendix A), which was adapted from one that Day and Gu had used in the study reported in The New Lives of Teachers. Although three schools participated, the researchers selected the 94 responses completed by teachers in one high school as the primary school site sample. For purposes of comparison, the researchers invited a second cohort of teachers (all participants at the ATA’s 2013 Summer Conference, in Banff) to reflect on their 2012/13 year using the same workbook. A total of 44 teachers, drawn from a range of jurisdictions and schools throughout the province, participated in this second cohort.
The reflection instrument invited participants to identify the factors that contributed most significantly to their highs and lows throughout the year. The researchers parsed, sorted and mapped these responses using the same four categories that Day and Gu (2010, 52) had employed in their study of teachers in the United Kingdom.
1. Personal: related to their lives outside school, such as family support, personal relationships and health-related issues
2. Pupil: related to factors associated with pupils, such as pupil-intake characteristics, pupil attitudes and motivations, pupil behaviour, and teacher–pupil relationships
3. Practice: related to factors embedded in teachers’ workplaces, support from management and staff, teachers’ additional roles and responsibilities, promotion, workload and the quality of professional development opportunities
4. Policy: related to external policy agendas, such as educational policies, and government initiatives and changes
The researchers further analyzed the comments that participants had written about the peaks and troughs that they had charted—referred to hereafter as high points and low points—to determine the nature, timing and relative intensity of each. Analyzing these written reflections yielded insights into the relationship between teachers’ sense of efficacy and work–life balance, on the one hand, and the current conditions of practice in Alberta’s schools, on the other.
To identify the factors that influence teachers’ daily work and personal lives and their sense of efficacy and well-being, the researchers parsed, analyzed and sorted more than 1,600 handwritten answers, comprising 2,200 individual comments.
Initial Survey Analysis
Activity I and II Line ChartsIn analyzing the line charts from Activities I and II, the researchers began by noting the months most frequently associated with high and low points in participants’ perceived sense of
Background and Methodology

4 • Reflections on Teaching: Teacher Efficacy and the Professional Capital of Alberta Teachers
professional effectiveness and personal well-being. They also identified recurring patterns in the line charts, which they loosely categorized as “double bump,” “triple bump,” “flat line,” “steady climb” and “climb and crash.” Although informative, this initial analysis proved so time-consuming that researchers asked staff from the Faculty of Extension at the University of Alberta to identify patterns in the line charts. The results of this analysis appear in the section of the report entitled Reflections on the School Year: Case Study Findings.
Activity I and II Written ResponsesAll 138 response booklets were numbered and reviewed in their entirety. In addition, the written comments for each set of questions were read, parsed, analyzed and sorted by key words, key themes or patterns. Recurring comments, patterns and themes were then categorized using such descriptors as “health challenges,” “student success” and “collegial support.” In some cases, responses were further categorized using subheadings. These descriptors were then listed on a vertical axis. The horizontal axis was numbered 1 to 94 to enable researchers to capture each survey from the 94 responses submitted by the school cohort and to return easily to the source document to locate specific comments, if necessary. The same process was repeated in analyzing the 44 responses from the conference cohort.
In undertaking the analysis, researchers added and sometimes combined descriptors. All the health-related responses, for example, were ultimately assigned to the main category of health, although subcategories such as injury/illness and staying active/time for fitness were retained. Once all 138 surveys had been analyzed, the researchers calculated the number of responses that fell into each category. Many responses fit easily into more than one category. A comment about a low point, for example, might relate to such categories as time factors, health, workload and extracurricular expectations.
The top 10 factors cited as influencing teachers’ high and low points with respect to their
professional efficacy (as reported in Activity I) and with respect to their personal work–life balance and well-being (as reported in Activity II) were entered on two spreadsheets: one spreadsheet listed the factors affecting participants’ professional and personal high points; the second listed the factors affecting participants’ professional and personal low points.
The researchers found that 77 per cent of the time, the factors that negatively or positively affected participants’ work lives also negatively or positively affected their personal lives and vice versa. That the same factors influence the highs and lows in teachers’ professional and personal lives—although no surprise—constituted the first major finding of the study.
Activity III Written ResponsesActivity III invited participants to review the line charts that they had drawn in conjunction with Activities I and II and to identify and comment on correlations between highs and lows experienced in their work life and highs and lows experienced in their personal well-being. Seventy-seven per cent of the 138 respondents identified a strong correlation between their professional and personal line charts, 21 per cent reported both similarities and differences, and 2 per cent did not draw a second chart or make comments.
At the end of Activity III, participants were asked to identify the three factors that had the greatest impact on their overall effectiveness and on their work–life balance during the past year. Researchers sorted these responses into one or more of the following categories: Personal, Students, Practice and Policy.
Responses from all 138 surveys were then parsed, analyzed and entered into three spreadsheets, one devoted to each of the following topics:
1. Top reported factors influencing teachers’ high points with respect to both their professional efficacy and their personal well-being

Reflections on Teaching: Teacher Efficacy and the Professional Capital of Alberta Teachers • 5
2. Top reported factors influencing teachers’ low points with respect to both their professional efficacy and their personal well-being
3. Top reported factors enhancing teachers’ effectiveness and work–life balance (Activity III), sorted into four categories: Personal, Students, Practice and Policy
The Two Study CohortsResearchers collected data from 117 teachers in three high schools, as well as from 44 teachers attending the ATA 2013 Summer Conference. One of the high schools set aside two hours to enable participants to discuss and complete the response booklet during a facilitated session. This session produced 94 fairly detailed responses. Data collected from the facilitated session at Summer Conference were also highly detailed. The other two high schools, by contrast, were unable to dedicate a set time to facilitate the survey and, as a result, the responses collected from these schools (18 from one and 5 from the other) were generally lacking in detail.1
Researchers reviewed the comments and line graphs contained in the samples of 18 and 5 and compared them with those produced by the sample of 94. Because the responses from the smaller samples contained no new themes or anomalies, researchers did not include them in the analysis summarized in this report. Teachers in the school cohort of 94 and the conference cohort of 44 ranged in age from 24 to 65 and had anywhere between 0 and 40+ years of teaching experience. Some respondents were single, some were young parents with children, some were taking care of aging parents and some were taking care of both children and aging parents.
Facilitated ActivitiesActivity I: My Effectiveness and Impact as a TeacherIn this activity, participants were invited to draw a line graph depicting the highs and lows that they had experienced with respect to their work life during the 2012/13 school year. The vertical axis represented perceived effectiveness: 0 indicating least effective and 10 indicating most effective. Number 5 was defined as representing the level of effectiveness at which teachers typically function in their teaching practice. Numbers 6 to 10 were to be used to record occasions when participants felt that they were highly effective and were teaching the way they aspired to teach. Numbers 0 to 4 were to be used to record occasions when participants experienced difficulty or felt unable to meet their own expectations. The horizontal axis represented time (from September to June). Participants were to use the horizontal axis to identify the months during which the various highs and lows had occurred.
After completing their line graph, teachers were asked two questions:
1. In considering your line graph, identify two specific high points in your teaching in the past year. For each point, identify the critical factor(s) that influenced the incident or period of time (eg, student or colleague interactions, friends, personal or family developments, working conditions, district or government decisions or influences).
2. In considering your line graph from this school year, identify two specific low points in your teaching in the past year. For each point, identify the critical factor(s) that influenced the incident or period of time (eg, student or
1 Although the line charts produced by participants in the sample of 18 resembled those drawn by the cohort of 94, the written responses tended to be less detailed and to focus on identifying months that were especially positive or negative. Responses from the sample of 5 (some of which were incomplete) were even briefer and also focused on the months in which events occurred. Participants from the cohort of 94, by contrast, went into detail about especially significant events and did not focus on the month in which they occurred. The following responses illustrate the difference in detail between the groups: A participant from the sample of 5 reported that in “November students settled.” A participant from the sample of 94 wrote, “High points—watching some kids with extenuating circumstances in their personal lives being able to com-plete a diploma course.”

6 • Reflections on Teaching: Teacher Efficacy and the Professional Capital of Alberta Teachers
colleague interactions, friends, personal or family developments, working conditions, district or government decisions or influences).
In the case of each question, respondents typically recorded between one and three answers.
Activity II: My Work–Life Balance and Well-BeingIn this activity, participants were asked to draw another line graph, based on a similar vertical and horizontal axis, but, this time, depicting the highs and lows that they had experienced in their overall well-being during the course of the year. After completing the line graph, participants were again asked two questions:
1. Considering your chart, choose two of the high points in terms of your well-being this past year and briefly describe why you saw them that way. For each point, identify the critical factor(s) that influenced the incident or period of time (eg, student or colleague interactions, friends, personal or family developments, working conditions, district or government decisions or influences).
2. Considering your chart, choose two of the low points in terms of your well-being this past year and briefly describe why you saw them that way. For each point, identify the critical factor(s) that influenced the incident or period of time (eg, student or colleague interactions, friends, personal or family developments, working conditions, district or government decisions or influences).
In the case of each question, respondents typically recorded between zero and three answers.
Activity III: My Effectiveness and Work–Life BalanceIn Activity III, participants were invited to compare the line graph depicting work that they had drawn in Activity I with the line graph depicting work–life balance that they had drawn
in Activity II and then to answer the following questions:
1. Identify similarities and differences between the two graphs. What might explain these? Responses to this question ranged from nothing to a quick summary such as “same” to a slightly more expansive answer such as “there are points in the year when workload increases stress” to a detailed story or personal insights. At least 20 of the 138 respondents mentioned “weather” as a key influencing factor. (In 2012/13, Calgary received an above-average amount of snow in the winter and heavy precipitation in the spring that resulted in severe flooding in June in some areas.)
2. Based on your reflections about your overall effectiveness this past year and your work–life balance, what were the three most important influences? For example, consider students and colleague interactions, friends, personal or family factors, working conditions, and district or government decisions or influences. Respondents typically provided between zero and four answers.
Methodological LimitationsThe comments gathered in the two cohorts were sufficiently detailed to enable the data to be categorized in many ways. Initially, however, researchers decided to confine their analysis to the data collected in the school cohort of 94. This data was sorted into three categories:
• Top factors that participants identified as influencing their reported high points
• Top factors that participants identified as influencing their reported low points
• Top factors that participants identified (in Activity III) as having the biggest impact on their professional effectiveness and their ability to achieve a work–life balance; these factors were sorted into four categories: Personal, Students, Practice and Policy
At this point, the researchers began to question whether the results of 94 surveys originating from the same high school could possibly be

Reflections on Teaching: Teacher Efficacy and the Professional Capital of Alberta Teachers • 7
considered representative of the views of teachers in general on factors influencing efficacy and well-being. Concerned that the results might not be representative, the researchers decided to collect a second sample. It was at this point that they administered the survey to 44 teachers attending the 2013 ATA Summer Conference. These teachers came from various schools and school boards across the province.
Researchers analyzed the 44 surveys from the conference cohort using the same approach as they had used with the school cohort of 94: they parsed, analyzed and sorted the surveys and created three new spreadsheets, one for each of the following data sets:
1. Top factors reported as influencing teachers’ high points with respect to both their professional efficacy and their personal well-being
2. Top factors reported as influencing teachers’ low points with respect to both their professional efficacy and their personal well-being
3. Top factors that teachers identified (in Activity III) as having the biggest impact on their professional effectiveness and their ability to achieve a work–life balance; these factors were sorted into four categories: Personal, Students, Practice and Policy
Researchers parsed and sorted all written responses generated in Activity III through the lens of Day and Gu’s (2010) study. Using a different model would undoubtedly have uncovered other patterns, such as the ebb and flow of workload and personal well-being throughout the seasons.
This pilot study tested the effectiveness of the reflection tool on two cohorts: one made up of teachers from the same high school, and the second comprising teachers from across the province attending the same conference. To confirm that the findings are indeed representative of teachers’ perceptions in general, the study should be repeated in several other schools using a facilitated process in which participants are given ample time to reflect on their experiences. It would also be useful, in a future study, to collect and analyze demographic information about the respondents.
The timeline for the pilot study was tight: surveys were administered in late June, data was analyzed in July and a preliminary report was produced for presentation to Summer Conference in August. More time for analysis would have allowed researchers to explore many other questions, such as these:
• Why is the start of the school year a high point for some teachers and a low point for others? What can be done to assist teachers who experience September as a low point?
• Why do most teachers experience a crash in late November and early December and then again in March, May and June? What can be done to help these teachers?
• Why were the factors reported in Activity III incongruent with those reported in Activities I and II? Could this divergence have resulted from the language used in the survey questions?
• To what extent are the highs and lows that teachers experience a result of time pressures?

8 • Reflections on Teaching: Teacher Efficacy and the Professional Capital of Alberta Teachers

Reflections on Teaching: Teacher Efficacy and the Professional Capital of Alberta Teachers • 9
Literature Review
The Alberta ContextFor more than 40 years, education researchers have been studying the ability (or inability) of teachers to attain a work–life balance.
The first in-depth review of Alberta’s education system in 30 years occurred in 2002 (Alberta’s Commission on Learning 2003). Prompted by the provincewide teachers’ strike in 2001, the Government of Alberta created Alberta’s Commission on Learning. The Commission’s task was to examine the system and consider not just issues of immediate concern but also the best way of providing high-quality education to all children. The Commission’s final report, Every Child Learns, Every Child Succeeds, contained 95 recommendations covering 8 broad topics. Since the release of that report in 2003, many other studies have been undertaken, among them Setting the Direction for Special Education (Alberta Education 2009), Real Learning First (ATA 2009b), Success for All (ATA 2009c) and Inspiring Education: A Dialogue with Albertans (Alberta Education 2010).
Although the recommendations contained in these and other studies have generally been accepted as reasonable, the workload of teachers has continued to intensify.
Canadian Workload StudiesStudies from across Canada suggest that the workload of many teachers is excessive. An exhausting workload diminishes the quality of a teacher’s work life and also negatively affects the learning environment of his or her students. Studies of teachers’ workload from across Canada come to remarkably similar conclusions.
Dibbon (2004), in a study of the workload of 681 teachers in Newfoundland and Labrador, identified four major issues: lack of time
(52 per cent), class size and composition (53 per cent), new programs and curricula (30 per cent), and inappropriate assignments and scheduling (26 per cent). Dibbon also studied four other issues: the intensification of teachers’ work, preparation time, supervision and time spent in meetings. Dibbon points out that much of a teacher’s work is invisible because it is performed outside of school hours. Though not necessarily part of teaching, this work is necessary to keep the system functioning well. Dibbon makes nine recommendations:
1. Reduce the amount of invisible work and increase public recognition of teachers’ work.
2. Increase preparation time for teachers to a minimum of 180 minutes per week.
3. Ensure that schools provide teachers with discretionary leave days to be used during the school year and the flexibility to use them during reporting periods.
4. Assign supervision to paraprofessionals or make supervision a voluntary activity for which teachers are compensated.
5. Monitor class composition and reduce class size accordingly.
6. Provide ongoing training before and during the implementation of a new program.
7. Ensure, when placing teachers, that there is a good fit between qualifications, training and teaching assignment.
8. Allot time for teachers to reflect, plan and collaborate with colleagues during the regular school day.
9. Redesign teacher workloads, as well as the manner in which schools are organized and managed, so that teachers have time for personal growth.
MacDonald et al (2010) studied the work lives of a sample of teachers in Prince Edward Island. Participants were asked to fill out a survey, keep a time log of their daily activities, participate in one of two focus groups and write

10 • Reflections on Teaching: Teacher Efficacy and the Professional Capital of Alberta Teachers
a narrative of their day-to-day experiences. Researchers were interested in not only what teachers did during the formal school day but also before and after school, on weekends and during the summer. MacDonald et al concluded that teachers’ workload is the product of six factors: teaching stress, the availability of technology resources, the availability of other resources, supervisory support, collegial support and job satisfaction.
MacDonald et al also examined their data to determine whether workload is related to such variables as school type, class size and full-time versus part-time assignment. They found no relationship between these variables and workload. At the same time, they found that the technology score was significantly lower in elementary schools (Grades 1–6); that collegial support was higher in secondary schools (Grades 9–12) and for permanent teachers; that resource teachers scored higher with respect to supervisory support; that young teachers and those in the classroom scored lower with respect to job satisfaction; that older teachers (age 60+), those with continuing contracts and those with more experience were less stressed; and that females experienced more stress and less collegial support than their male colleagues. Although teachers’ working hours in Prince Edward Island have not changed from those that were in place in an earlier study, teachers in this study reported that they were spending more time on administrative tasks and were experiencing strained relationships, decreased support, reduced autonomy and diminished collegiality.
James Matsui Research (2006) interviewed 1,767 elementary teachers affiliated with the Ontario English Catholic Teachers Association (OECTA). This study revealed that full-time teachers work an average of 55.7 hours per week, 88 per cent work more than 40 hours per week and 66 per cent work more than 50 hours per week. Forty-three per cent of participants reported feeling overworked all or most of the time, and an additional 51 per cent felt overworked at least some of the time. Eighty-nine per cent of participants also reported that excessive workload had affected their personal, family
and social lives. Of these, 49 per cent reported that workload had affected their lives a great deal. Eighty per cent of participants also reported that work demands had affected their health.
Participants in the OECTA study identified the following factors as contributing to their excessive workload: an increase in the number of special needs students (70 per cent), teaching split grades (59 per cent), curriculum expectations (54 per cent), student assessment (48 per cent), number of subjects/lessons (48 per cent), teaching initiatives (47 per cent), public/parent expectations (46 per cent), report cards (43 per cent), class size (42 per cent) and curriculum changes (40 per cent). Asked what could be done to reduce their workload, 31 per cent suggested smaller classes, 29 per cent said fewer special needs students, 23 per cent said reduced curriculum expectations, 19 per cent said changes to report cards, 13 per cent said eliminating split grades, 12 per cent said more classroom resources and 11 per cent said curriculum changes.
In 2006/07, the Manitoba Teachers’ Society conducted a workload study of 3,300 of its members (MTS 2007). In this study, nearly 50 per cent of participants reported that their workload had increased, 33 per cent said that large class size was preventing them from meeting their performance standards, nearly 55 per cent reported working more than 51 hours per week (25 per cent worked an average of 58 hours per week), 92 per cent felt overworked and 68 per cent reported that stress was affecting their job performance. In another Manitoba-based study in 2010 (Dyck-Hacault and Alarie 2010, 24), one of the participants, a teacher from Brandon, summed up the situation this way: “Teaching is not your standard 9 to 5 job. There’s lots of work outside normal working hours. The workload seems to be increasing. The treadmill keeps going faster, making it impossible to catch up.” Taken together, the Manitoba studies suggest that what has changed with respect to workload is not the tasks themselves but the intensification of tasks: increased reporting or administrative requirements, more behaviourally challenged

Reflections on Teaching: Teacher Efficacy and the Professional Capital of Alberta Teachers • 11
students, more special needs students, curriculum changes, changes in teaching assignments and more meetings. The top stressors for teachers are lack of time, too many expectations and disruptive students. Dyck-Hacault and Alarie make the following recommendations:
1. Lobby the government to approve and fund appropriate educational programming regulations.
2. Reduce class size and composition.3. Develop a formula for determining class size
based on class composition.4. Determine an appropriate caseload limit for
clinicians.5. Embed guidelines on class size and
composition into collective agreements.6. Hire teachers to support Level 2 students.7. Free up resource teachers and clinicians to
work with students.8. Negotiate 300 minutes of preparation time
into collective agreement clauses.9. Reduce the pace at which new initiatives
and curriculum are implemented and ensure adequate funding.
10. Negotiate a clause declaring participation in extracurricular activities to be voluntary.
11. Enhance the public image of teachers.12. Ensure that teachers have equitable access to
professional development.13. Ensure that teachers have time during the
day to prepare report cards.
In their study of the working conditions of teachers in British Columbia, Naylor and White (2010) found that full-time teachers work an average of 47.8 hours per week—well beyond the standard workweek—and that 10 per cent of teachers work 60+ hours per week. The study also examined how teachers spend their summer vacations. Naylor and White found that the least-experienced teachers take the shortest break (from zero to three weeks), while more experienced teachers take seven or more weeks. On average, teachers in British Columbia take 5.7 weeks of vacation. The first few weeks are generally spent “recuperating from the hectic
demands of the school year, attending to personal responsibilities put on hold during the school year and caring for dependent or ill family members” (Naylor and White 2010, iii). Teachers reported that factors contributing to their job satisfaction were teacher–student relationships, positive interactions with parents and autonomy. Factors contributing to high levels of stress were multiple demands and limited time, classroom composition and size, and lack of support, especially for dealing with behaviourally challenged students. Participants in the study commented that these stressors, combined with an excessive amount of time spent preparing lessons and assessing and reporting on students, cut into their family time and/or reduced the energy that they had to carry out household tasks. Naylor and White suggest that teachers’ inability to attain a work–life balance, because it affects individuals, families, the health-care system and taxpayers, should be a concern not just for unions but for society as a whole.
The ATA, together with its locals, has conducted a number of studies on work–life balance: The 2011/12 National Study on Balancing Work, Life and Care Giving: The Situation for Alberta Teachers (Duxbury and Higgins 2013); Leading Our Future Together: Necessary Conditions for Shared Leadership in Calgary Public Schools (Calgary Public Teachers 2010); and The New Work of Teaching: A Case Study of the Worklife of Calgary Public Teachers (ATA 2012c). In The New Work of Teaching, researchers invited 20 Calgary teachers to keep an hourly diary of their activities, both at home and at work, for one week. Although the sample was small, the study revealed that the issues facing teachers in Calgary were similar to those facing teachers in other jurisdictions throughout Canada and Alberta. On average, teachers in the Calgary study reported working 55 hours per week, 80 per cent of which were devoted to teaching, planning, assessing and reporting. Many teachers in the study reported feeling overwhelmed and exhausted, so much so that “some even remarked that they felt guilty because they were unable to do any one facet of their work to the best of their ability” and that “competing
12 • Reflections on Teaching: Teacher Efficacy and the Professional Capital of Alberta Teachers
demands left them feeling that they had short-changed their students” (ATA 2012c, 12).
Among the strategies that the ATA has suggested to help relieve the workload of teachers are (1) negotiating limits on what constitutes assignable time (which includes extracurricular or noninstructional tasks that a teacher may be assigned) and (2) encouraging principals to give teachers some autonomy in deciding what duties they can take on in addition to their regular workloads (ATA 2012c; Calgary Public Teachers 2010).
Elements That Affect Work–Life BalanceAccording to the literature, the factors affecting work–life balance can be divided into two broad categories: personal (what Leithwood [2006] calls “internal states”) and systemic. Factors from both groups combine to affect teachers’ work life and, indirectly, the learning environment for students. Education is, at least in part, a product of what teachers do in their classrooms, and what teachers do in their classrooms is shaped by who they are, what they believe and how vital and alive they are when they stand before their students (Freiler et al 2012, 23). How “vital and alive” teachers feel when they enter the classroom can be influenced by such systemic factors as workload, access to good resources, public perception, government policies and initiatives, legislation, and the policies and initiatives of the school board.
Working ConditionsLeithwood (2006, 88–99) argues that personal factors (or internal states) have a significant impact on teachers’ working conditions:
There is good evidence to show that teachers’ working conditions matter because they have a direct effect on teachers’ thoughts and feelings—their sense of individual professional efficacy, of collective professional efficacy, of job satisfaction; their organizational commitment, levels of stress and burnout, morale, engagement in the school or profession; and their pedagogical content knowledge. These internal states are an important factor in what teachers do and have a direct effect on what happens in the classroom, how well students achieve, and their experiences of school. Teachers’ working conditions are students’ learning conditions. Working conditions matter!
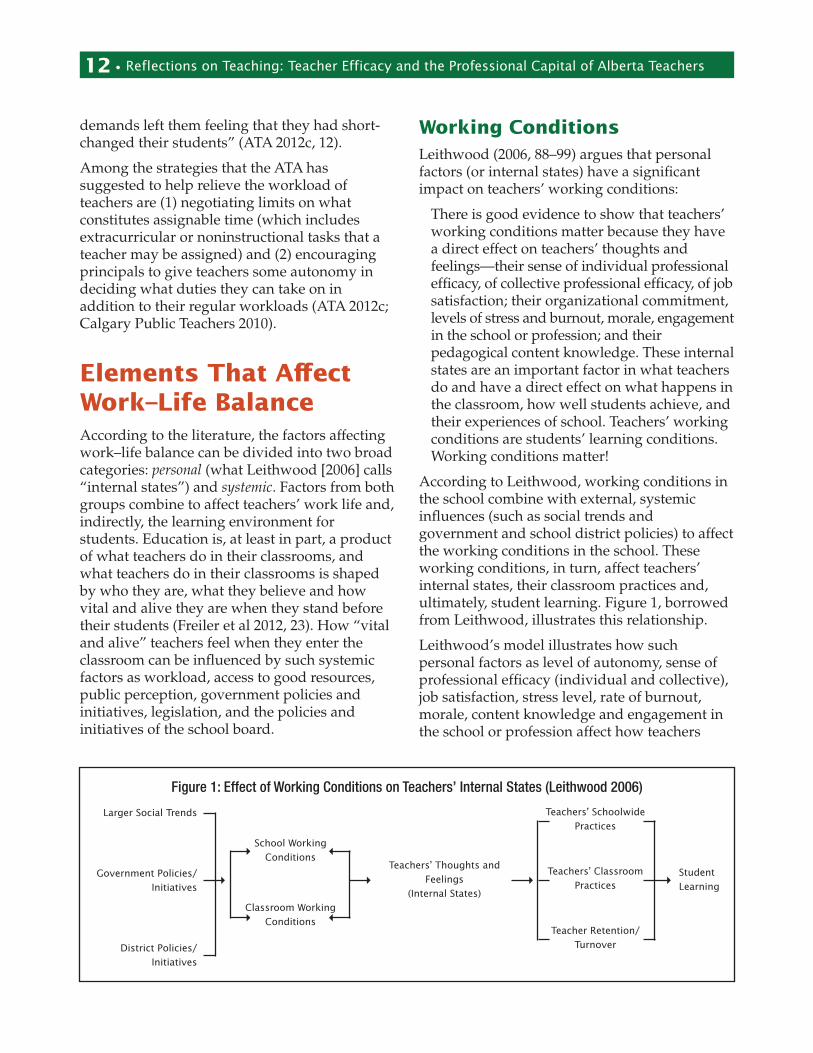
According to Leithwood, working conditions in the school combine with external, systemic influences (such as social trends and government and school district policies) to affect the working conditions in the school. These working conditions, in turn, affect teachers’ internal states, their classroom practices and, ultimately, student learning. Figure 1, borrowed from Leithwood, illustrates this relationship.
Leithwood’s model illustrates how such personal factors as level of autonomy, sense of professional efficacy (individual and collective), job satisfaction, stress level, rate of burnout, morale, content knowledge and engagement in the school or profession affect how teachers
Figure 1: Effect of Working Conditions on Teachers’ Internal States (Leithwood 2006)
Student Learning
Larger Social Trends
Government Policies/Initiatives
District Policies/Initiatives
School Working Conditions
Classroom Working Conditions
Teachers’ Thoughts and Feelings
(Internal States)
Teachers’ Schoolwide Practices
Teachers’ Classroom Practices
Teacher Retention/Turnover

Reflections on Teaching: Teacher Efficacy and the Professional Capital of Alberta Teachers • 13
think or feel, how they perform their duties and how students learn.
Provincial and district decisions and policies can have an enormous impact on teachers’ working conditions and, ultimately, on students’ learning conditions (ATA 2011; Kamanzi, Riopel and Lessard 2007). At the very time that governments across Canada are becoming more frugal, teachers are facing increased pressure to provide children with a better education and to be more accountable. As a result, many teachers operate in survival mode. In their 2007 survey of 4,569 teachers from across Canada, Kamanzi, Riopel and Lessard documented the struggle that teachers face in terms of their professionalism, social relations, job satisfaction and the way in which their profession is perceived by others. They also found that most teachers in Canada receive no support or mentoring upon entering the profession and that only 40 per cent are formally welcomed into the profession at induction ceremonies.
Teacher–Student InteractionsAnother factor affecting teachers’ work–life balance is the opportunity to build relationships with students. Kamanzi, Riopel and Lessard (2007) found that teachers in British Columbia, the prairies and Ontario were more confident than teachers in other parts of the country in their ability to motivate students easily, felt less overwhelmed when students behaved poorly, and were more sure of themselves and that they were making a difference in their students’ lives. Not surprisingly, job satisfaction was also higher among participants from Ontario and the prairies. The work of Leithwood (2006) and Kamanzi, Riopel and Lessard confirms what many teachers already know: job satisfaction is directly related to their ability to build and maintain positive relationships with students.
Teacher AttributesTeachers’ attributes, ideals and aspirations also affect teachers’ ability to attain a work–life balance. In their cross-Canada study of teachers, Freiler et al (2012) concluded that who teachers are, what they hope to accomplish and how they
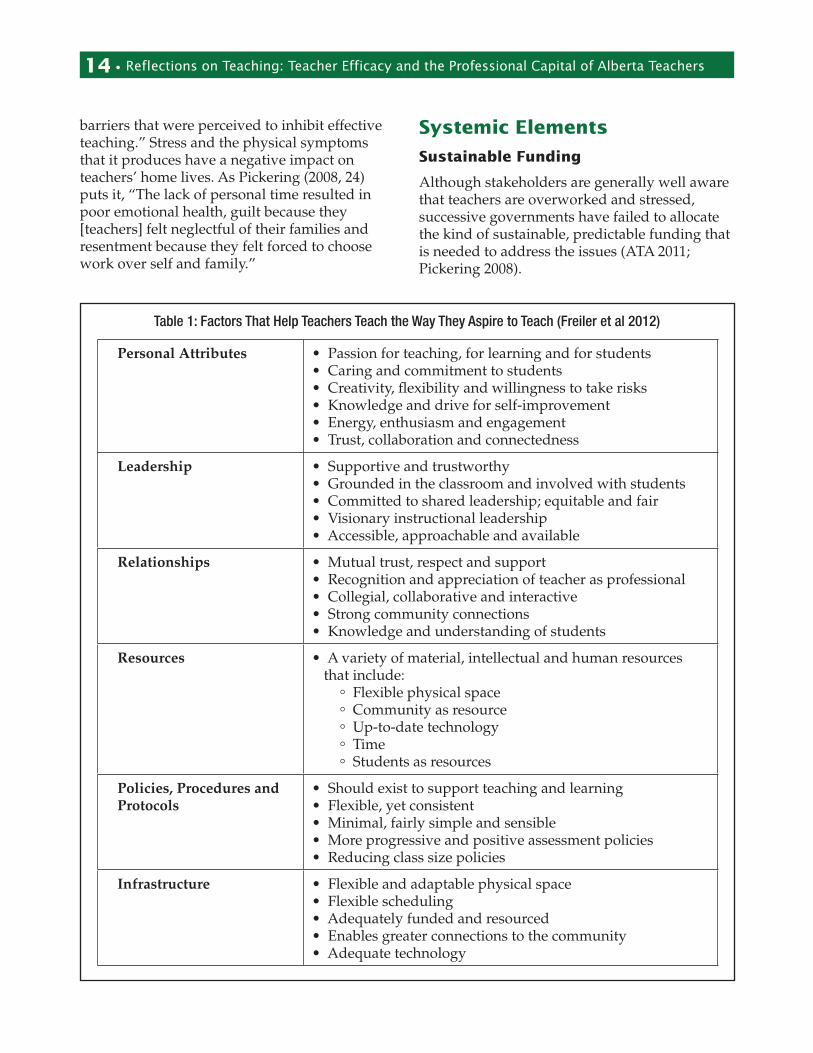
perceive the world around them directly affect how they teach. Freiler et al found that 90 per cent of teachers join the profession because they “enjoy working with children” and that 80 per cent believe that “making a difference in children’s lives,” “helping develop and motivate children” and “having a love of learning” are important. Nearly all teachers surveyed indicated that they benefited by developing caring and committed relationships with students. Freiler et al identified six personal and systemic factors (see Table 1) that helped teachers teach in the way that they aspired to teach: personal attributes; leadership; relationships; resources; policies, procedures and protocols; and infrastructure. Freiler et al found that 94 per cent of teachers had, at least on occasion, been able to teach the way that they aspired to teach.
StressorsYounghusband (2005) and Pickering (2008) studied the various stressors that affect teachers, among them lack of time, inappropriate class size, inclusive classrooms, family problems, workplace change, lack of administrative support, inadequate collegial support, lack of resources, disruptive students and the overall struggle to facilitate learning in less-than-ideal conditions. Younghusband and Naylor and White (2010) both found that female teachers tend to experience a greater amount and intensity of stress than do their male counterparts.
Younghusband focused on the struggle that teachers experience in trying to balance multiple demands and the importance of having a supportive work environment. Other Canadian studies that have explored the effect of stress on teachers’ lives include Dibbon (2004), Dyck-Hacault and Alarie (2010), Naylor and White (2010), ATA (2012c), Calgary Public Teachers (2010), James Matsui Research (2006), MTS (2007) and MacDonald et al (2010). Pickering (2008, 23) concluded that many teachers experience stress as the sense of having been “disabled by demands and responsibilities while at the same time struggling to overcome the
14 • Reflections on Teaching: Teacher Efficacy and the Professional Capital of Alberta Teachers
barriers that were perceived to inhibit effective teaching.” Stress and the physical symptoms that it produces have a negative impact on teachers’ home lives. As Pickering (2008, 24) puts it, “The lack of personal time resulted in poor emotional health, guilt because they [teachers] felt neglectful of their families and resentment because they felt forced to choose work over self and family.”
Systemic Elements
Sustainable Funding
Although stakeholders are generally well aware that teachers are overworked and stressed, successive governments have failed to allocate the kind of sustainable, predictable funding that is needed to address the issues (ATA 2011; Pickering 2008).
Personal Attributes • Passion for teaching, for learning and for students• Caring and commitment to students• Creativity, flexibility and willingness to take risks• Knowledge and drive for self-improvement• Energy, enthusiasm and engagement• Trust, collaboration and connectedness
Leadership • Supportive and trustworthy• Grounded in the classroom and involved with students• Committed to shared leadership; equitable and fair• Visionary instructional leadership• Accessible, approachable and available
Relationships • Mutual trust, respect and support• Recognition and appreciation of teacher as professional• Collegial, collaborative and interactive• Strong community connections• Knowledge and understanding of students
Resources • A variety of material, intellectual and human resources that include:
° Flexible physical space° Community as resource° Up-to-date technology° Time° Students as resources
Policies, Procedures and Protocols
• Should exist to support teaching and learning• Flexible, yet consistent• Minimal, fairly simple and sensible• More progressive and positive assessment policies• Reducing class size policies
Infrastructure • Flexible and adaptable physical space• Flexible scheduling• Adequately funded and resourced• Enables greater connections to the community• Adequate technology
Table 1: Factors That Help Teachers Teach the Way They Aspire to Teach (Freiler et al 2012)
Reflections on Teaching: Teacher Efficacy and the Professional Capital of Alberta Teachers • 15
Education funding in Alberta remains directly dependent upon primary resources and commodities, especially oil. The Redford government invented the term bitumen bubble to describe the difference in price between conventional oil and Alberta’s so-called dirty oil (Government of Alberta, nd). In 2013, the bitumen bubble cost the Government of Alberta approximately $6 billion in lost revenue. The government used this loss of revenue as the rationale for cutting education funding by $6.2 billion, a clear demonstration of how closely Alberta’s economy is tied to resource revenues (ATA 2011, 2012a). The ATA (2011) describes the government’s tendency to cut funding to education when revenues are low and to boost funding when revenues are high as the “poverty-of-plenty paradox.”
Performance Testing
Alberta’s economic downturn has not reduced government or school board expectations with respect to provincial achievement tests, student assessment and reporting, and individual program plans. In fact, Alberta is experiencing an unprecedented push for greater accountability, more privatization of education and more emphasis on an outcomes-based curriculum (ATA 2011, 2012a; Smaller et al 2005). The Government of Alberta’s approach to educational transformation is distressingly consistent with a pattern that Leithwood (2006, 6–7) has observed in other jurisdictions:
The currently popular teaching-standards movement assumes that teacher performance will improve if only teacher capacity or ability changes. High-stakes accountability policies, especially those with a market orientation, assume performance will change if only teacher motivation changes. Both of these reform efforts often have been pursued within a less-is-more financial framework, the consequences of which have had substantial negative effects on teachers’ working conditions.
The emphasis on teacher and school performance, as measured by provincial achievement tests and other standardized assessments, can hinder teachers in their efforts
to meet the needs of individual students. The Netherlands, one of the world’s educational leaders, has demonstrated that the best way of increasing students’ knowledge and achievement is by helping them to acquire languages, appreciate diversity, relate what they learn to the local community and become lifelong learners (ATA 2011). In a similar vein, Hargreaves and Shirley (2009) have argued that, in implementing reforms, jurisdictions need to avoid the “three paths of distraction”: (1) the path of autocracy (governance through forced compliance), (2) the path of technocracy (excessive surveillance through growing bureaucracies and standardization) and (3) the path of effervescence (an obsession with achieving narrow, short-term and unsustainable targets).
In A Great School for All, the ATA (2012a) points out that truly high-performing educational systems have (1) a culture of responsibility and trust that encourages the local community to become involved and (2) an environment in which teachers and principals are encouraged to use their professional judgment to foster student learning and to report on their progress. Describing the much-admired Finnish model of education, Sahlberg (2011) makes much the same point by suggesting that great schools exhibit four paradoxes: (1) teach less, learn more; (2) test less, learn better; (3) support equity to capitalize on diversity as a community asset; and (4) system reform and transformation as sustained from the inside out.
Time
The way in which school boards and provincial governments can best help teachers to teach in the way that they aspire to teach is illustrated in Figure 2, which has been borrowed from Freiler et al (2012).
As Hargreaves (1994, 95) observes, underlying all these factors is one even more basic factor—time:
Time is a fundamental dimension through which teachers’ work is constructed and interpreted by themselves, their colleagues and those who administer and supervise

16 • Reflections on Teaching: Teacher Efficacy and the Professional Capital of Alberta Teachers
them. Time for the teacher is not just an objective, oppressive constraint but also a subjectively defined horizon of possibility and limitation. Teachers can take time and make time, just as much as they are likely to see time schedules and time commitments as fixed and immutable. Through the prism of time, we can therefore begin to see ways in which teachers construct the nature of their work at the same time as they are constrained by it. Time, that is, is a major element in the structuration of teachers’ work. Time structures the work of teaching and is, in turn, structured through it. Time is therefore more than a minor organization contingency, inhibiting or facilitating management’s attempts to bring about change. Its definition and imposition form part of the very core of teachers’ work and of the policies and perceptions of those who administer it.
One of the results of the growing bureaucratic intervention into education has been a reduction
in the amount of time that teachers have available for preparation and collaboration and an increase in the amount of time they spend on “invisible” work such as supervision, meetings, planning, assessment, reporting and extracurricular activities (ATA 2002b, 2009b). At the same time, resources and funding have been declining.
Acknowledging “Invisible” WorkReducing the amount of time that teachers spend on “invisible” work and embedding more time in the school day to enable them to accomplish professional work will help teachers achieve a better work–life balance. Although teachers want to offer students their best and address students’ individual needs, they often find themselves making concessions for the sake of time, sanity and their own well-being (ATA 2002a, 2002b, 2012c; Dibbon 2004; Younghusband 2005; Freiler et al 2012).
Figure 2: Factors That Help Teachers to Teach the Way They Aspire to Teach (Freiler et al 2012)
Very Important Somewhat Important
0% 20% 40% 60% 80% 100%
85.1%
76.9%
70.0%
62.7%
61.2%
59.4%
35.3%
13.8%
20.0%
27.6%
33.9%
36.7%
35.4%
49.9%
Support and value teachers as professionals
Reduce class size
Provide more resources (human and material)
Enable more collaboration among teachers
Allow greater flexibility in the classroom
Provide more relevant and engaging professional learning
opportunities
Make research on classroom practice available
Reflections on Teaching: Teacher Efficacy and the Professional Capital of Alberta Teachers • 17
Workload studies from Newfoundland and Labrador, Prince Edward Island, Ontario, Manitoba, British Columbia and Alberta paint a similar picture: teachers are expected to do more work and be more accountable even as the resources available to them are diminishing. The people setting these policies are often removed from the daily realities of the classroom and, as a result, are unaware of the impact that their decisions are having on teachers’ working conditions and, by extension, on students’ learning conditions.
In 2002, the ATA published two documents: (1) Falling Through the Cracks: A Summary of What We Heard About Teaching and Learning Conditions in Alberta Schools (ATA 2002b) and (2) Cracks in the Foundation: Why We Heard What We Heard (ATA 2002a). The first of these documents summarizes the concerns about teaching and learning conditions that teachers, administrators, school councils, students, parents and specialist councils raised at 40 hearings held throughout the province. From these responses, the ATA identified six “clusters” of concern: class size and composition; curriculum change, teaching resources and professional development; funding issues, urban/rural inequities and the physical environment; social contexts of teaching and learning; teachers and teaching; and provincial achievement testing (ATA 2002b).
Summary of Literature ReviewAccording to the ATA (2009a), although 81.4 per cent of Alberta teachers still find teaching satisfying, 40.4 per cent are unable to balance their personal and work lives and nearly 15 per cent have experienced frequent episodes of depression. Increased workload, the
intensification of work and stress have contributed to the inability of teachers to find a work–life balance. Linda Duxbury has observed that “high levels of role overload and work interfering with family [leads] to increased absenteeism, greater use of the health-care system, increased levels of stress and depression, lower levels of commitment and job satisfaction, and recruitment and retention problems” (ATA 2009c, 17). Hargreaves (1994) observes that the excessive workload experienced by Alberta teachers has repercussions that extend beyond the classroom. Teacher stress ultimately leads to a reduction in services, which greatly affects the learning environment of students. The ATA (2011) suggests that teachers can respond to such challenges by “advocating for and determining optimal standards and conditions of professional practice.”
Overall, the research suggests that, to provide students with an optimal learning experience, teachers must have appropriate class sizes, appropriate and accessible resources and learning supports, more professional autonomy, more self-directed time within the school day to prepare for instruction, and effective and ongoing professional development to help them maintain and expand upon the knowledge, skills and attitudes specified in the Teaching Quality Standard (ATA 2012a, 2012b, 2012c, 2011; Alberta’s Commission on Learning 2003; Freiler et al 2012).
Leithwood (2006, 86) observes that “stress and burnout are the greatest direct threat to teacher performance and indirect threat to student learning.” The factors that cause teachers to feel overburdened—excessive demands, unreasonable constraints and a lack of support—also contribute to stress. These are the factors that need to be addressed if teachers are to attain a better work–life balance.

18 • Reflections on Teaching: Teacher Efficacy and the Professional Capital of Alberta Teachers
Reflections on Teaching: Teacher Efficacy and the Professional Capital of Alberta Teachers • 19
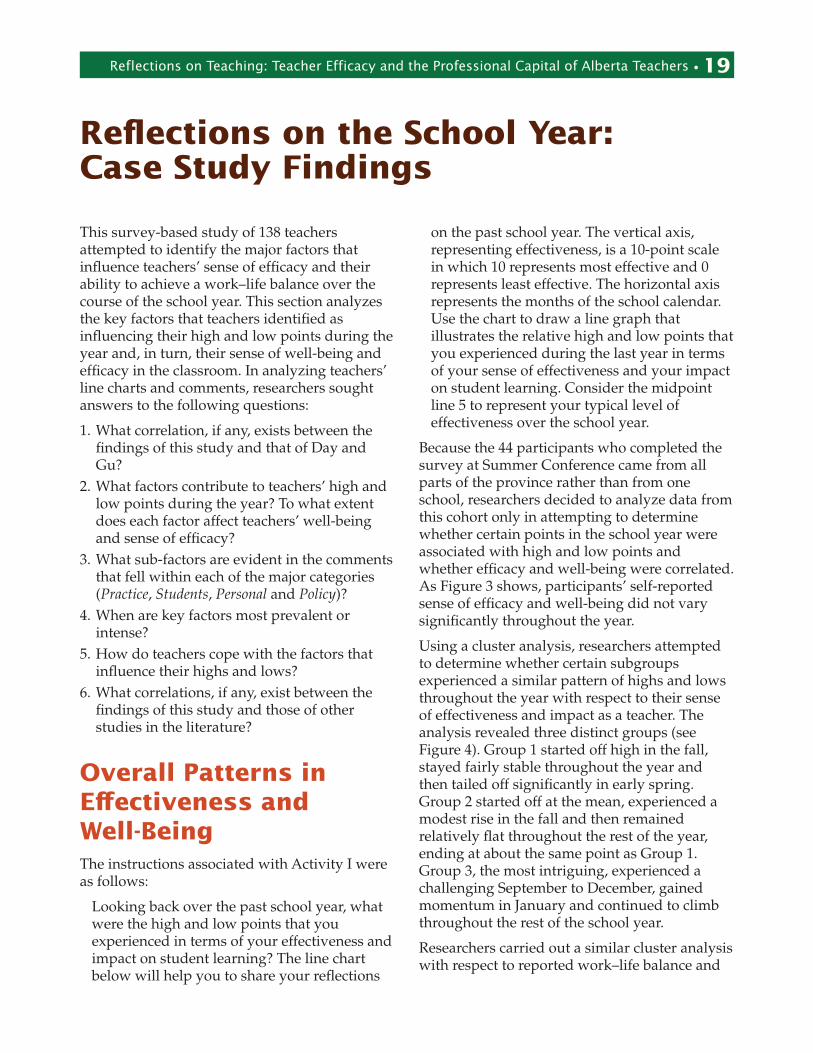
This survey-based study of 138 teachers attempted to identify the major factors that influence teachers’ sense of efficacy and their ability to achieve a work–life balance over the course of the school year. This section analyzes the key factors that teachers identified as influencing their high and low points during the year and, in turn, their sense of well-being and efficacy in the classroom. In analyzing teachers’ line charts and comments, researchers sought answers to the following questions:
1. What correlation, if any, exists between the findings of this study and that of Day and Gu?
2. What factors contribute to teachers’ high and low points during the year? To what extent does each factor affect teachers’ well-being and sense of efficacy?
3. What sub-factors are evident in the comments that fell within each of the major categories (Practice, Students, Personal and Policy)?
4. When are key factors most prevalent or intense?
5. How do teachers cope with the factors that influence their highs and lows?
6. What correlations, if any, exist between the findings of this study and those of other studies in the literature?
Overall Patterns in Effectiveness and Well-BeingThe instructions associated with Activity I were as follows:
Looking back over the past school year, what were the high and low points that you experienced in terms of your effectiveness and impact on student learning? The line chart below will help you to share your reflections
on the past school year. The vertical axis, representing effectiveness, is a 10-point scale in which 10 represents most effective and 0 represents least effective. The horizontal axis represents the months of the school calendar. Use the chart to draw a line graph that illustrates the relative high and low points that you experienced during the last year in terms of your sense of effectiveness and your impact on student learning. Consider the midpoint line 5 to represent your typical level of effectiveness over the school year.
Because the 44 participants who completed the survey at Summer Conference came from all parts of the province rather than from one school, researchers decided to analyze data from this cohort only in attempting to determine whether certain points in the school year were associated with high and low points and whether efficacy and well-being were correlated. As Figure 3 shows, participants’ self-reported sense of efficacy and well-being did not vary significantly throughout the year.
Using a cluster analysis, researchers attempted to determine whether certain subgroups experienced a similar pattern of highs and lows throughout the year with respect to their sense of effectiveness and impact as a teacher. The analysis revealed three distinct groups (see Figure 4). Group 1 started off high in the fall, stayed fairly stable throughout the year and then tailed off significantly in early spring. Group 2 started off at the mean, experienced a modest rise in the fall and then remained relatively flat throughout the rest of the year, ending at about the same point as Group 1. Group 3, the most intriguing, experienced a challenging September to December, gained momentum in January and continued to climb throughout the rest of the school year.
Researchers carried out a similar cluster analysis with respect to reported work–life balance and
Reflections on the School Year: Case Study Findings

20 • Reflections on Teaching: Teacher Efficacy and the Professional Capital of Alberta Teachers
Effectiveness and Impact as a Teacher My Work–Life Balance and Well-Being
10.0
9.0
8.0
7.0
6.0
5.0
4.0
3.0
2.0
1.0
0.0
Septem
ber
Octobe
r
Novem
ber
Decem
ber
Febru
aryMarc
hApri
lMay
Janu
ary June
Figure 4: Cluster Analysis of Reported Effectiveness and Impact as a Teacher
Figure 3: Reported Level of Effectiveness and Well-Being During the Year (N=44)
10.0
9.0
8.0
7.0
6.0
5.0
4.0
3.0
2.0
1.0
0.0
Septem
ber
Octobe
r
Novem
ber
Decem
ber
Febru
aryMarc
hApri
lMay
Janu
ary June
Group 1 Group 2 Group 3
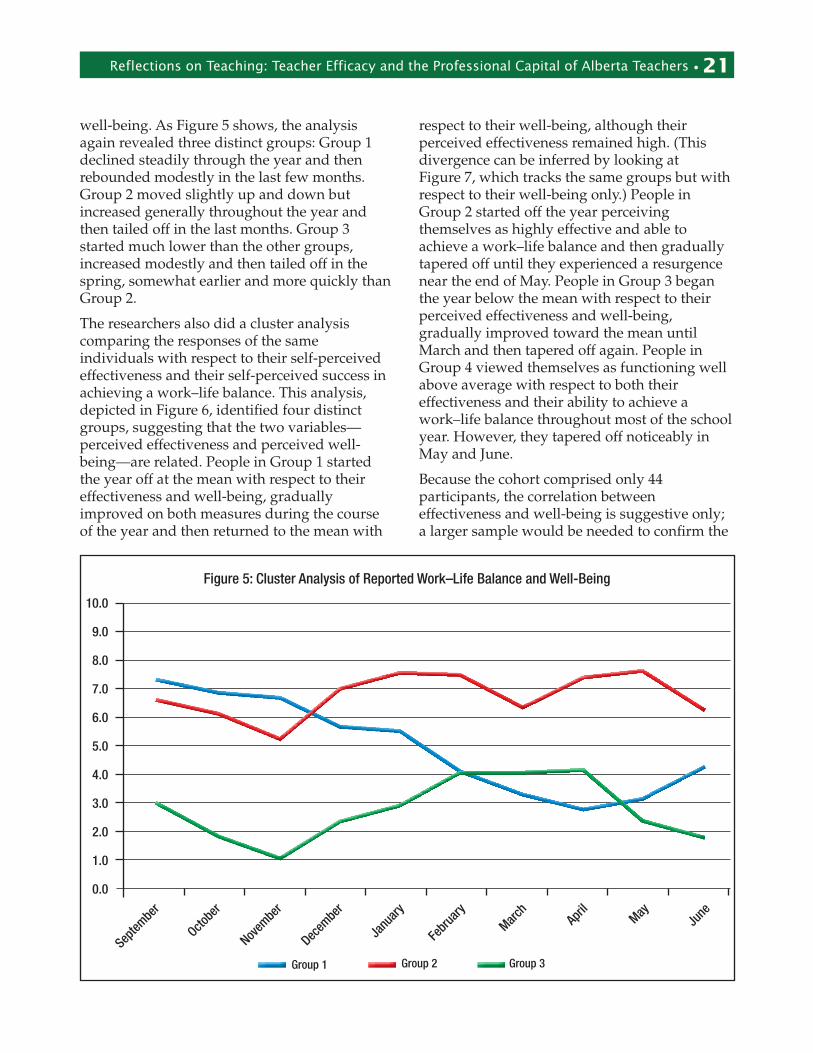
Reflections on Teaching: Teacher Efficacy and the Professional Capital of Alberta Teachers • 21
well-being. As Figure 5 shows, the analysis again revealed three distinct groups: Group 1 declined steadily through the year and then rebounded modestly in the last few months. Group 2 moved slightly up and down but increased generally throughout the year and then tailed off in the last months. Group 3 started much lower than the other groups, increased modestly and then tailed off in the spring, somewhat earlier and more quickly than Group 2.
The researchers also did a cluster analysis comparing the responses of the same individuals with respect to their self-perceived effectiveness and their self-perceived success in achieving a work–life balance. This analysis, depicted in Figure 6, identified four distinct groups, suggesting that the two variables—perceived effectiveness and perceived well-being—are related. People in Group 1 started the year off at the mean with respect to their effectiveness and well-being, gradually improved on both measures during the course of the year and then returned to the mean with
respect to their well-being, although their perceived effectiveness remained high. (This divergence can be inferred by looking at Figure 7, which tracks the same groups but with respect to their well-being only.) People in Group 2 started off the year perceiving themselves as highly effective and able to achieve a work–life balance and then gradually tapered off until they experienced a resurgence near the end of May. People in Group 3 began the year below the mean with respect to their perceived effectiveness and well-being, gradually improved toward the mean until March and then tapered off again. People in Group 4 viewed themselves as functioning well above average with respect to both their effectiveness and their ability to achieve a work–life balance throughout most of the school year. However, they tapered off noticeably in May and June.
Because the cohort comprised only 44 participants, the correlation between effectiveness and well-being is suggestive only; a larger sample would be needed to confirm the
Figure 5: Cluster Analysis of Reported Work–Life Balance and Well-Being
10.0
9.0
8.0
7.0
6.0
5.0
4.0
3.0
2.0
1.0
0.0
Septem
ber
Octobe
r
Novem
ber
Decem
ber
Febru
aryMarc
hApri
lMay
Janu
ary June
Group 1 Group 2 Group 3

22 • Reflections on Teaching: Teacher Efficacy and the Professional Capital of Alberta Teachers
Figure 6: Effectiveness and Work–Life Balance: Comparing the Same Individuals
Figure 7: Work–Life Balance and Well-Being: Comparing the Same Individuals
10.0
9.0
8.0
7.0
6.0
5.0
4.0
3.0
2.0
1.0
0.0
Septem
ber
Octobe
r
Novem
ber
Decem
ber
Febru
aryMarc
hApri
lMay
Janu
ary June
Group 1 Group 2 Group 3 Group 4
10.0
9.0
8.0
7.0
6.0
5.0
4.0
3.0
2.0
1.0
0.0
Septem
ber
Octobe
r
Novem
ber
Decem
ber
Febru
aryMarc
hApri
lMay
Janu
ary June
Group 1 Group 2 Group 3 Group 4
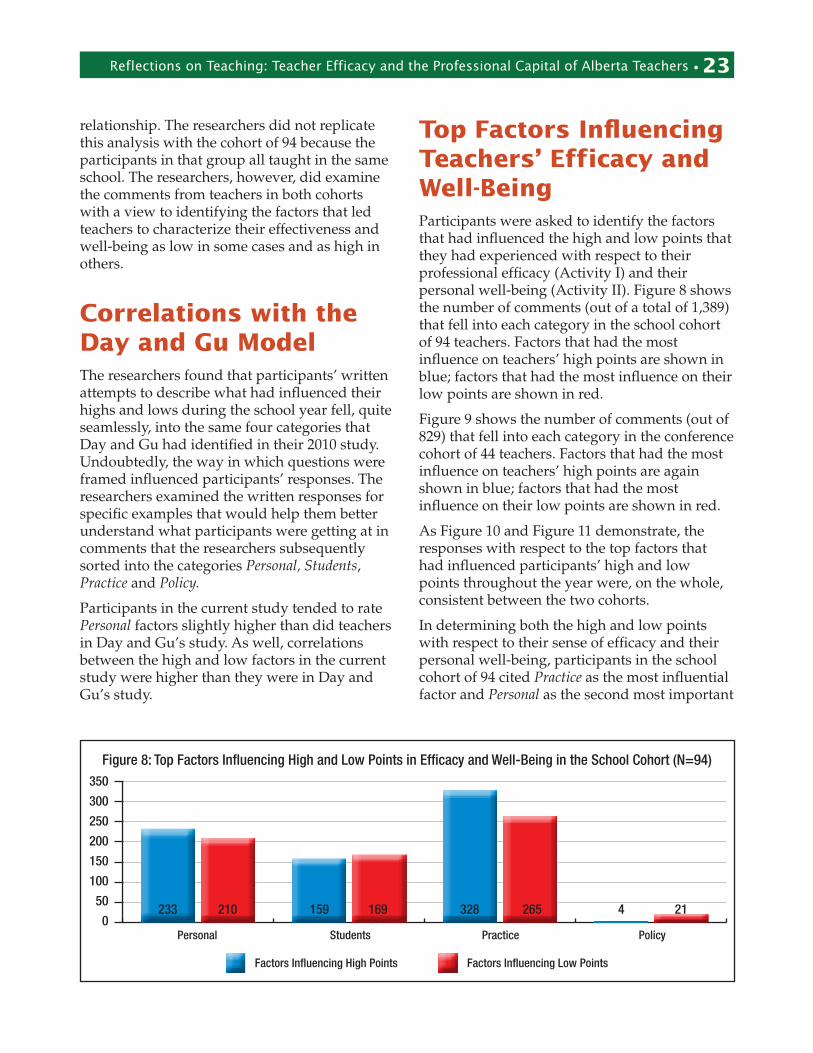
Reflections on Teaching: Teacher Efficacy and the Professional Capital of Alberta Teachers • 23
relationship. The researchers did not replicate this analysis with the cohort of 94 because the participants in that group all taught in the same school. The researchers, however, did examine the comments from teachers in both cohorts with a view to identifying the factors that led teachers to characterize their effectiveness and well-being as low in some cases and as high in others.
Correlations with the Day and Gu ModelThe researchers found that participants’ written attempts to describe what had influenced their highs and lows during the school year fell, quite seamlessly, into the same four categories that Day and Gu had identified in their 2010 study. Undoubtedly, the way in which questions were framed influenced participants’ responses. The researchers examined the written responses for specific examples that would help them better understand what participants were getting at in comments that the researchers subsequently sorted into the categories Personal, Students, Practice and Policy.
Participants in the current study tended to rate Personal factors slightly higher than did teachers in Day and Gu’s study. As well, correlations between the high and low factors in the current study were higher than they were in Day and Gu’s study.
Top Factors Influencing Teachers’ Efficacy and Well-BeingParticipants were asked to identify the factors that had influenced the high and low points that they had experienced with respect to their professional efficacy (Activity I) and their personal well-being (Activity II). Figure 8 shows the number of comments (out of a total of 1,389) that fell into each category in the school cohort of 94 teachers. Factors that had the most influence on teachers’ high points are shown in blue; factors that had the most influence on their low points are shown in red.
Figure 9 shows the number of comments (out of 829) that fell into each category in the conference cohort of 44 teachers. Factors that had the most influence on teachers’ high points are again shown in blue; factors that had the most influence on their low points are shown in red.
As Figure 10 and Figure 11 demonstrate, the responses with respect to the top factors that had influenced participants’ high and low points throughout the year were, on the whole, consistent between the two cohorts.
In determining both the high and low points with respect to their sense of efficacy and their personal well-being, participants in the school cohort of 94 cited Practice as the most influential factor and Personal as the second most important
Figure 8: Top Factors Influencing High and Low Points in Efficacy and Well-Being in the School Cohort (N=94)
Factors Influencing High Points Factors Influencing Low Points
350
300
250
200
150
100
50
0 Personal Students Practice Policy
233 210 159 169 328 265 4 21

24 • Reflections on Teaching: Teacher Efficacy and the Professional Capital of Alberta Teachers
factor and Students as the third most important factor. Policy was deemed the least important factor in influencing both high and low points, garnering only 4 mentions in reference to high points and 21 mentions in reference to low points.
Like the school cohort, the conference cohort of 44 identified Practice as the most influential factor affecting high and low points with respect to both their sense of efficacy and personal well-being. Once again, the factor Personal ranked second and Students ranked third in influencing both high and low points. Policy was again deemed least important in influencing
both high and low points, garnering only 10 mentions with respect to high points and 30 mentions with respect to low points.
Researchers then combined the comments that participants in the two cohorts had made in response to Activities I and II. The results of this analysis are shown in Figure 12 and Figure 13.
Activity III began by asking participants to (1) compare the line charts that they had drawn in Activity I (in relation to their sense of efficacy) and in Activity II (in relation to their sense of well-being), (2) identify similarities and differences between the two charts and (3) offer possible explanations for these similarities and
Figure 9: Top Factors Influencing High and Low Points in Efficacy and Well-Being in the Conference Cohort (N=44)
350
300
250
200
150
100
50
0 Personal Students Practice Policy
Factors Influencing High Points Factors Influencing Low Points
129 121 90 114 151 184 10 30
Figure 10: Portion of Comments Attributed to Each Factor with Respect to High Points
School Cohort (N=94) Conference Cohort (N=44)
Policy 0.55%
Practice 45.30%
Students 21.96%
Personal 32.18%
Policy 2.63%
Practice 39.74%
Students 23.68%
Personal 33.95%
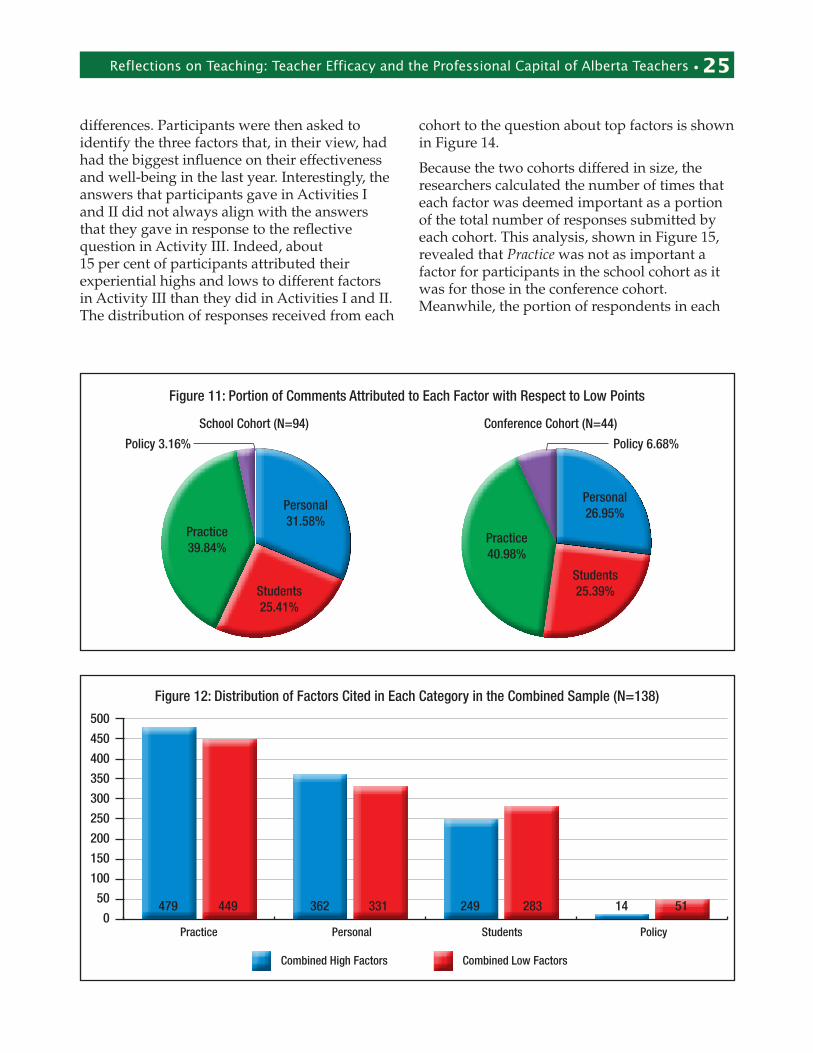
Reflections on Teaching: Teacher Efficacy and the Professional Capital of Alberta Teachers • 25
differences. Participants were then asked to identify the three factors that, in their view, had had the biggest influence on their effectiveness and well-being in the last year. Interestingly, the answers that participants gave in Activities I and II did not always align with the answers that they gave in response to the reflective question in Activity III. Indeed, about 15 per cent of participants attributed their experiential highs and lows to different factors in Activity III than they did in Activities I and II. The distribution of responses received from each
cohort to the question about top factors is shown in Figure 14.
Because the two cohorts differed in size, the researchers calculated the number of times that each factor was deemed important as a portion of the total number of responses submitted by each cohort. This analysis, shown in Figure 15, revealed that Practice was not as important a factor for participants in the school cohort as it was for those in the conference cohort. Meanwhile, the portion of respondents in each
Figure 12: Distribution of Factors Cited in Each Category in the Combined Sample (N=138)
500
450
400
350
300
250
200
150
100
50
0 Practice Personal Students Policy
Combined High Factors Combined Low Factors
479 449 362 331 249 283 14 51
Figure 11: Portion of Comments Attributed to Each Factor with Respect to Low Points
School Cohort (N=94) Conference Cohort (N=44)
Policy 3.16%
Practice 39.84%
Students 25.41%
Personal 31.58%
Policy 6.68%
Practice 40.98%
Students 25.39%
Personal 26.95%
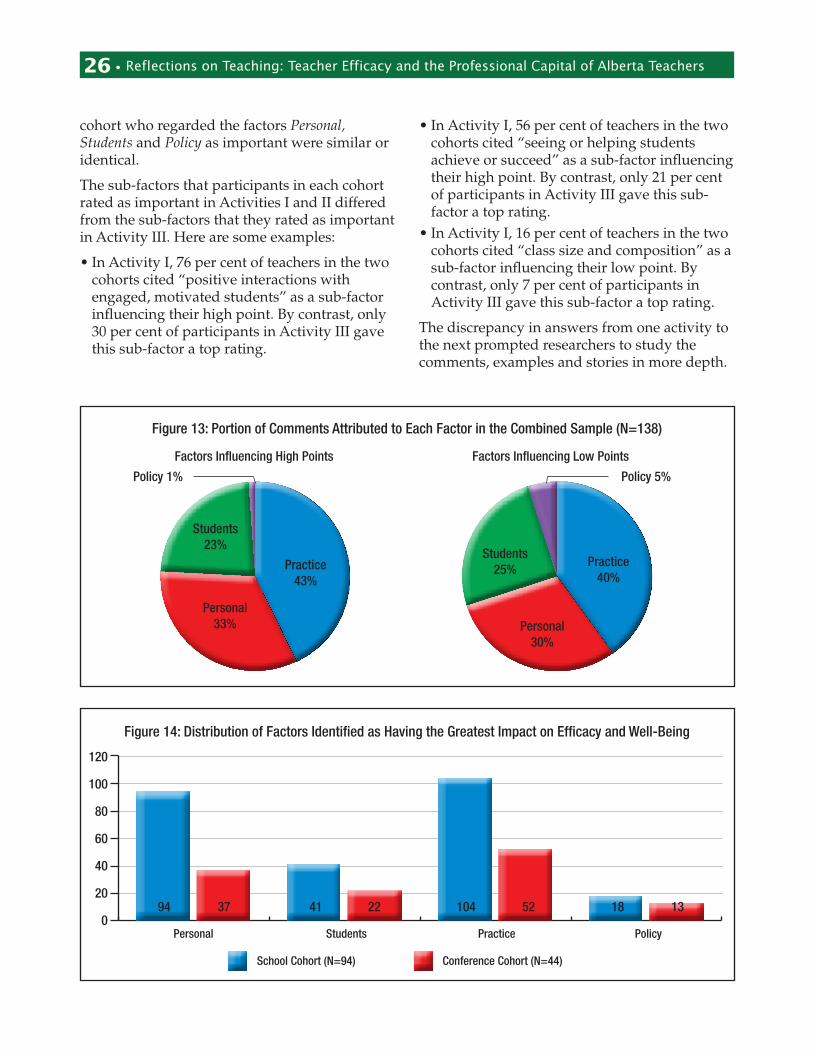
26 • Reflections on Teaching: Teacher Efficacy and the Professional Capital of Alberta Teachers
cohort who regarded the factors Personal, Students and Policy as important were similar or identical.
The sub-factors that participants in each cohort rated as important in Activities I and II differed from the sub-factors that they rated as important in Activity III. Here are some examples:
• In Activity I, 76 per cent of teachers in the two cohorts cited “positive interactions with engaged, motivated students” as a sub-factor influencing their high point. By contrast, only 30 per cent of participants in Activity III gave this sub-factor a top rating.
• In Activity I, 56 per cent of teachers in the two cohorts cited “seeing or helping students achieve or succeed” as a sub-factor influencing their high point. By contrast, only 21 per cent of participants in Activity III gave this sub-factor a top rating.
• In Activity I, 16 per cent of teachers in the two cohorts cited “class size and composition” as a sub-factor influencing their low point. By contrast, only 7 per cent of participants in Activity III gave this sub-factor a top rating.
The discrepancy in answers from one activity to the next prompted researchers to study the comments, examples and stories in more depth.
Figure 14: Distribution of Factors Identified as Having the Greatest Impact on Efficacy and Well-Being
Personal Students Practice Policy
School Cohort (N=94) Conference Cohort (N=44)
120
100
80
60
40
20
0 94 37 41 22 104 52 18 13
Figure 13: Portion of Comments Attributed to Each Factor in the Combined Sample (N=138)
Factors Influencing High Points Factors Influencing Low Points
Policy 1%
Students 23%
Personal 33%
Practice 43%
Policy 5%
Students 25%
Personal 30%
Practice 40%

Reflections on Teaching: Teacher Efficacy and the Professional Capital of Alberta Teachers • 27
Sub-Factors Associated with Practice, Personal, Students and PolicyTo better understand the issues associated with each of the four factors—Practice, Personal, Students and Policy—the researchers looked to see whether each factor could be broken down into sub-factors. They also tracked the frequency with which each sub-factor was identified. The researchers examined the sub-factors in this order: (1) those influencing high points, (2) those influencing low points and (3) those identified in Activity III.
An analysis of the comments and sub-factors revealed that the key factors influencing teachers’ sense of efficacy and well-being were often the positive and negative manifestations of the same factor. With respect to Practice, for example, the sub-factors most frequently associated with high points were “time for teamwork and collaboration” and “time for collegial interactions.” The sub-factors most frequently associated with low points in this same category were “lack of time” and “having too much to do on one’s own.” Participants in Day and Gu’s (2010) study also identified Practice as the most influential factor with respect to both high and low points. In addition, Day and Gu found that collegial interactions
and time were key sub-factors that influenced both high and low points.
With reference to the Personal category, “health” was one of the most frequently cited factors. Again, this sub-factor had two sides. On the positive side, participants reported that having time to go to the gym, sleep and maintain a regular fitness routine helped them remain energetic and capable of handling workload challenges. On the negative side, being exhausted or burned out, neglecting health routines and staying up late to catch up on work resulted in a loss of energy, difficulty in managing workloads and meeting students’ needs effectively, and an inability to meet obligations at home. Even participants who were ill or injured due to factors unrelated to workload felt pressured to carry out their responsibilities at school and, as a result, cited these health concerns (especially if they prevented participants from meeting students’ needs or contributing to school initiatives) as influencing their low points.
With reference to the Students category, participants cited student achievement, student engagement and positive interactions with students as the sub-factors most apt to influence their high points. Conversely, participants reported that their low points were most frequently influenced by such sub-factors as lack of student achievement, student disengagement, student misbehaviour, poor student attendance
Figure 15: Portion of Participants in Each Cohort Who Rated Each Factor as Important
School Cohort (N=94) Conference Cohort (N=44)
Policy 10%
Students 22%
Practice 37%
Personal 31%
Policy 10%
Practice 42%
Students 18%
Personal 30%

28 • Reflections on Teaching: Teacher Efficacy and the Professional Capital of Alberta Teachers
and negative teacher–student interactions. Interestingly, most of the student-related concerns were raised by participants teaching Grade 10 students. The study confirms what the literature has pointed to for years: teachers derive their greatest sense of job satisfaction, efficacy and well-being from their ability to build and maintain positive relationships with students (Leithwood 2006). Here is what some participants had to say about the importance of maintaining positive relationships with their students:
As a supervisor for the ski/snowboard club and the theatre club, I had great rapport with students. It is wonderful to make relationships outside of the classroom.
I had a wonderful group of students that I connected with while implementing technology in the classroom. Lots of laughter! Was the best year in my six years of teaching!
I worked hard with students for the Remembrance Day poetry contest. Lots of formative work and relationship building. I think the students began to recognize that I cared about their work and about them as people. I could feel a shift in attitude, and student efficacy improved.
Two-sided factors were also evident in the Policy category. For example, teachers were excited and engaged when funding became available to hire new teachers or implement new programs. Conversely, when funding was threatened or cut, teacher morale deteriorated, collegial interactions turned negative and teachers had more difficulty finishing the year. Not surprisingly, the line graphs that teachers drew depicting their high points tended to rise throughout the year and then drop off precipitously if, near the end of the year, they learned that they were not assured of a contract in the fall or that a successful program was being eliminated.
Factors Influencing High PointsRespondents were asked to choose two of their high points and to identify the factors that
influenced these points. This activity engendered 1,104 comments from the two groups. The comments were parsed and identified as Personal, Students, Practice or Policy. The frequency of responses in each category is depicted in Figure 16.
To gain more insight into the context that prompted participants to choose the factors that they did, the researchers combed through participants’ comments looking for stories and examples. This exercise revealed that each of the four main factors comprised several sub-factors, which are described below in descending order of the frequency with which they were cited.
Sub-Factors Associated with PracticeAn analysis of the comments associated with high points in Practice reveals five sub-factors: (1) teamwork and collaboration, (2) preparation time, (3) technology and resources, (4) course development and innovation and (5) positive teaching experiences. The frequency with which these sub-factors were referenced in each cohort is shown in Figure 17. The relative importance of the five sub-factors in each of the two cohorts is shown in Figure 18.
Teamwork and Collaboration
Taken together, participants in the two cohorts made 217 comments related to the sub-factor teamwork and collaboration. Their comments (some of which follow) suggest that, by teamwork and collaboration, participants meant (1) having positive relationships with and receiving support from colleagues, (2) working as a team with the administration, other teachers and educational assistants, (3) feeling welcomed into the school and (4) having the opportunity to share knowledge with colleagues by participating in collaborative professional development.
Working as a team with administration really felt good this year!
I had a new opportunity in a new school. I was reunited with former colleagues and had the opportunity to collaborate with new teachers. I worked with the swim team. The assistant principal
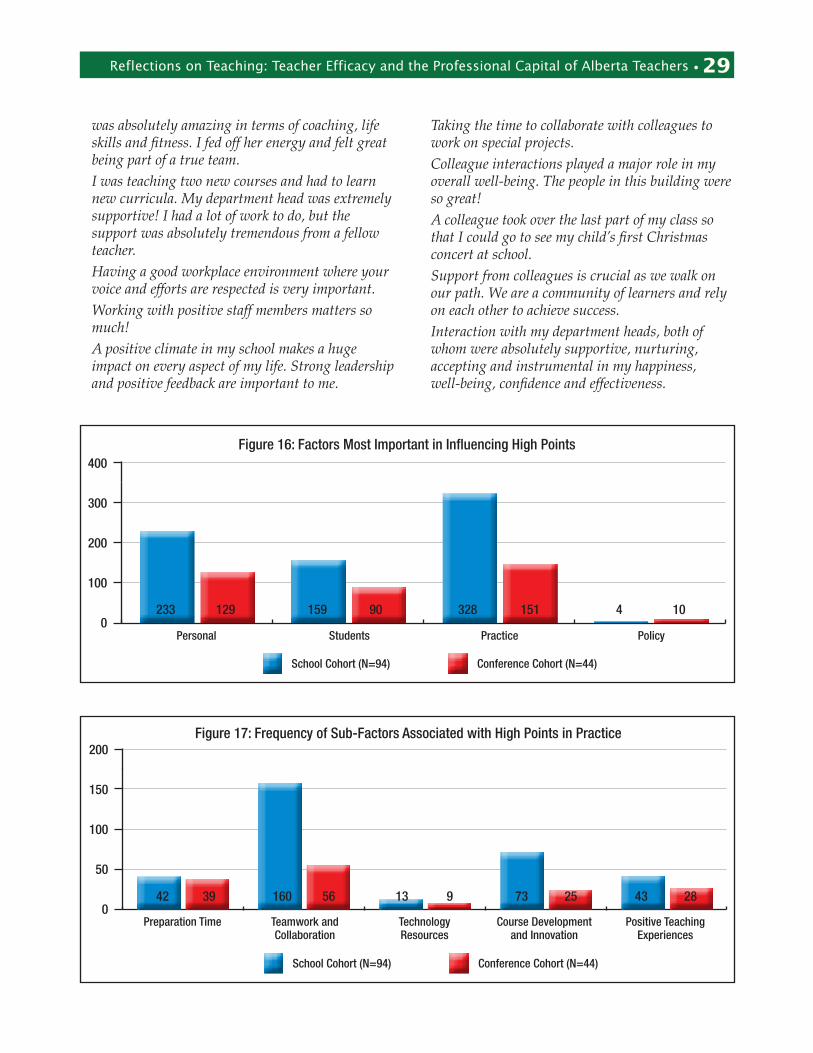
Reflections on Teaching: Teacher Efficacy and the Professional Capital of Alberta Teachers • 29
was absolutely amazing in terms of coaching, life skills and fitness. I fed off her energy and felt great being part of a true team.
I was teaching two new courses and had to learn new curricula. My department head was extremely supportive! I had a lot of work to do, but the support was absolutely tremendous from a fellow teacher.
Having a good workplace environment where your voice and efforts are respected is very important.
Working with positive staff members matters so much!
A positive climate in my school makes a huge impact on every aspect of my life. Strong leadership and positive feedback are important to me.
Taking the time to collaborate with colleagues to work on special projects.
Colleague interactions played a major role in my overall well-being. The people in this building were so great!
A colleague took over the last part of my class so that I could go to see my child’s first Christmas concert at school.
Support from colleagues is crucial as we walk on our path. We are a community of learners and rely on each other to achieve success.
Interaction with my department heads, both of whom were absolutely supportive, nurturing, accepting and instrumental in my happiness, well-being, confidence and effectiveness.
Figure 16: Factors Most Important in Influencing High Points
Figure 17: Frequency of Sub-Factors Associated with High Points in Practice
400
300
200
100
0 Personal Students Practice Policy
School Cohort (N=94) Conference Cohort (N=44)
233 129 159 90 328 151 4 10
200
150
100
50
0
School Cohort (N=94) Conference Cohort (N=44)
Preparation Time Teamwork and Technology Course Development Positive Teaching Collaboration Resources and Innovation Experiences
42 39 160 56 13 9 73 25 43 28

30 • Reflections on Teaching: Teacher Efficacy and the Professional Capital of Alberta Teachers
Time spent collaborating with other, more experienced teachers in the math diploma level. By March, I was better acquainted with the new curriculum and able to tweak the previous semester’s plans so lessons and interactions with students could improve. I spent much less time on planning.
Course Development and Innovation
Participants in the two groups made 96 comments related to the sub-factor course development and innovation. This sub-factor had to do with (1) receiving support from colleagues in trying new approaches to teaching and assessment and (2) having time to revise or develop new course materials, either in collaboration with a colleague or alone (while someone else—a colleague, a student teacher or an educational assistant—looked after the teacher’s class). Following are some of the comments associated with the sub-factor course development and innovation:
Having the support to try new things. Trying something new, experimenting and
pushing. I had trust from administration and an ability to be creative. Partnering with inspirational teachers to deliver the curriculum. Learning from
others and sharing experiences, time and a common vision.
When colleagues and administration trust each other, innovation becomes a lot easier! I had time to explore new methods and learning models.
A high point was revamping course materials to cover new curriculum.
I worked really hard from September to December and put in many hours after school developing resources and preparing lessons and material. During this time, I had a high level of professional satisfaction because I was more than adequately prepared and the students were learning. However, I wasn’t working out, spending time with my family or engaging in hobbies.
Positive Teaching and Learning Experiences
Participants in the two groups made 73 comments related to the sub-factor positive teaching and learning experiences. Comments assigned to this sub-factor had to do with (1) teaching a course or program that the teacher enjoyed or (2) participating in a positive professional development experience. Here are some typical comments associated with the
Figure 18: Relative Importance in Each Cohort of Sub-Factors Associated with High Points in Practice
School Cohort (N=94) Conference Cohort (N=44)
14%
49%
22%
12%19%
16%
3%3%
38%
24%
Technology Resources
Course Development and Innovation
Preparation Time Teamwork and Collaboration
Positive Teaching Experiences
Reflections on Teaching: Teacher Efficacy and the Professional Capital of Alberta Teachers • 31
sub-factor positive teaching and learning experiences:
Travelling to Atlanta to participate in International Baccalaureate training!
In February, I attended a professional development conference in California!
I received course-specific professional development that helped me get practical, ready-to-use material that reduced my preparation time.
Attending course-specific professional development throughout the semester gave me a chance to exchange ideas, experiences and resources. I always felt a little boost in effectiveness after these sessions.
Everything came together in planning my Physics 20 course. I had great interactions with students and colleagues that maximized my success in the classroom!
I received professional development related to my physics course. It was a great day to enjoy colleagues’ company and take part in relevant professional development. I had great conversations with teachers from other districts.
In the second semester, as part of the induction program for new teachers, I received professional development on technology and using an iPad. This opportunity really sparked my teaching!
Preparation Time
Seventy-eight participants in the two cohorts commented on the importance of having sufficient preparation time to plan lessons, mark student assignments and collaborate with colleagues. Several participants noted that a lack of preparation time upsets their ability to achieve a work–life balance. Following are some typical comments associated with preparation time:
Having time to prepare at school rather than before and after is important.
January is good because I can take some time over Christmas break to plan lessons. When I have time, my lessons are so much better and students are more engaged.
I had a greater balance between my subject areas once I felt more comfortable with my new courses. I had more confidence by the second semester.
A second high point occurred in January because I was refreshed from the break and had prepared for the last three weeks of the semester. I was exercising more and focused on attaining a work–home balance.
Having a spare during the day to get some work done was huge. It allowed me to spend time on relationships with students, colleagues, family and friends. It made a huge impact.
Having time made it possible for me to mark and prepare lessons.
Working in the fall in a half-time position meant a much more productive workday and a less exhausting and harried home life.
I spent much of the previous year preparing the first half of my resources and preparing the direction of my classes. I had the time to really prepare all the material from September to December, so I was just riding high until the winter break!
Technology and Resources
Fifteen participants in the two cohorts commented on the importance of having the technology, tools and resources they needed to teach in the way that they aspired to teach. Among the specific resources cited were iPads, Smart Boards and computers. Here is a sample of the comments associated with the sub-factor technology and resources:
Having my Smart Board working so that I could create more effective lessons and engage students more readily really helped.
At the beginning of the year, colleagues helped me to get my courses on Smart Board and to develop strategies to help at-risk students succeed.
I love my classroom with its access to computers, large windows and lots of space.
Discovering iPad technology and getting others interested was a big boost.
I appreciated getting a part-time educational assistant to help in my class in late April and May.
Working space and technology are important. Where you work can be so good if it’s up to date and in order and such a drain if that is not the case. I purged my whole classroom with the help of colleagues!
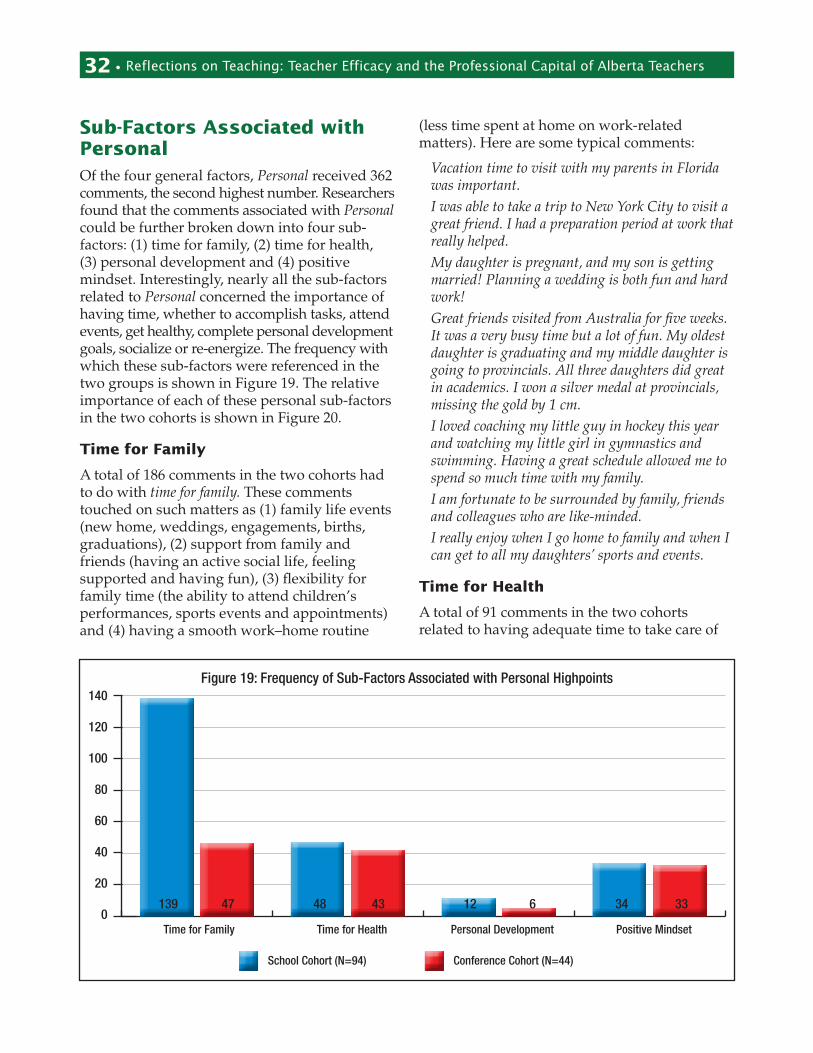
32 • Reflections on Teaching: Teacher Efficacy and the Professional Capital of Alberta Teachers
Sub-Factors Associated with PersonalOf the four general factors, Personal received 362 comments, the second highest number. Researchers found that the comments associated with Personal could be further broken down into four sub-factors: (1) time for family, (2) time for health, (3) personal development and (4) positive mindset. Interestingly, nearly all the sub-factors related to Personal concerned the importance of having time, whether to accomplish tasks, attend events, get healthy, complete personal development goals, socialize or re-energize. The frequency with which these sub-factors were referenced in the two groups is shown in Figure 19. The relative importance of each of these personal sub-factors in the two cohorts is shown in Figure 20.
Time for Family
A total of 186 comments in the two cohorts had to do with time for family. These comments touched on such matters as (1) family life events (new home, weddings, engagements, births, graduations), (2) support from family and friends (having an active social life, feeling supported and having fun), (3) flexibility for family time (the ability to attend children’s performances, sports events and appointments) and (4) having a smooth work–home routine
(less time spent at home on work-related matters). Here are some typical comments:
Vacation time to visit with my parents in Florida was important.
I was able to take a trip to New York City to visit a great friend. I had a preparation period at work that really helped.
My daughter is pregnant, and my son is getting married! Planning a wedding is both fun and hard work!
Great friends visited from Australia for five weeks. It was a very busy time but a lot of fun. My oldest daughter is graduating and my middle daughter is going to provincials. All three daughters did great in academics. I won a silver medal at provincials, missing the gold by 1 cm.
I loved coaching my little guy in hockey this year and watching my little girl in gymnastics and swimming. Having a great schedule allowed me to spend so much time with my family.
I am fortunate to be surrounded by family, friends and colleagues who are like-minded.
I really enjoy when I go home to family and when I can get to all my daughters’ sports and events.
Time for Health
A total of 91 comments in the two cohorts related to having adequate time to take care of
Figure 19: Frequency of Sub-Factors Associated with Personal Highpoints140
120
100
80
60
40
20
0 Time for Family Time for Health Personal Development Positive Mindset
School Cohort (N=94) Conference Cohort (N=44)
139 47 48 43 12 6 34 33

Reflections on Teaching: Teacher Efficacy and the Professional Capital of Alberta Teachers • 33
one’s (1) physical health (fitness, exercise, weight loss, good nutrition, smoking cessation) and (2) mental health (time for travel, vacation, breaks, fresh starts and taking care of “me”). Here are some representative comments:
My fitness level increased, and I lost weight. Supportive people around me helped me achieve my goals.
I appreciated the opportunity to have yoga for half the year at work. Yoga helped me to achieve balance and is a powerful tool toward well-being. Hope this can continue despite our financial crunch.
Finding time to take care of myself. I hired a personal trainer and made a point of
leaving the school at 5 o’clock every day! My fitness increased, I was sleeping better and I felt rejuvenated and re-energized. I felt good about myself. However, my professional satisfaction decreased because I wasn’t as prepared for my lessons, and much of the extra stuff didn’t get done. I said no, but felt guilty. To my astonishment, no one seemed to notice, which made me wonder, “Why do I do such-and-such a task in the first place? And is it the best use of my time?” Perhaps I just got more efficient.
I really enjoy my one night a week to play my own sport in the winter, spring and summer. It helps to have a night out to yourself.
When I am healthy, I can handle anything! There was a point very early in the year at which I
decided that my health and fitness needed to be priority one. It still is. For the first time in my career, I set work boundaries and stuck to them. This has been my most balanced year so far.
Positive Mindset
Sixty-seven of the comments related to having a positive mindset. These comments touched on two topics: (1) having a sense of excitement and enthusiasm for life and for work and (2) feeling confident, ready and optimistic about teaching. Here are some typical comments:
Being able to see the simple joys in my life. Stress levels diminished and I was able to focus on the positives.
Positive attitude toward situations that one faces in all aspects of life. Willingness to work hard and to accept the challenges we inevitably face.
I love projects, I love growing and learning, and I love new roles. I love coaching and supporting my team.
New start to the year—fresh, ready and resilient! I can take on anything and roll with it. I spend a lot of time at school, but it does not wear me out in September and October.
Figure 20: Relative Importance in Each Cohort of Sub-Factors Associated with Personal High Points
School Cohort (N=94) Conference Cohort (N=44)
14%
60%21%
26%
5%
5%
33%
36%
Personal Development Positive MindsetTime for Family Time for Health

34 • Reflections on Teaching: Teacher Efficacy and the Professional Capital of Alberta Teachers
Personal Development
Eighteen of the comments touched on the topic of personal development. Comments on this sub-factor had to do with (1) achieving a personal goal (such as finishing a degree) and (2) contributing to the community by engaging in socially responsible activities. Here are some representative comments:
Completing my degree was part of a five-year plan I made for myself after my divorce. I finished it in four years while working. It helped boost my confidence.
My wife and I decided to go on a fitness journey together. She inspired me to run my first marathon and to train for Ironman. When I take care of myself, I do a better job in the classroom.
I graduated with my MEd and enjoyed the full support of my colleagues and students while doing so.
Sub-Factors Associated with StudentsOf the four general factors, Students received 249 comments, the third highest number. An analysis of the comments in this category, which concerned all aspects of student engagement and achievement both in the classroom and during extracurricular events, revealed four sub-factors: (1) motivated and engaged students, (2) student achievement and success, (3) success in extracurricular events and (4) teaching a new course/class. The frequency with which each sub-factor was cited in the two cohorts is shown in Figure 21. The relative importance of each sub- factor in the two cohorts is shown in Figure 22.
Motivated and Engaged Students
One hundred and five of the comments focused on student motivation and engagement. Comments assigned to this sub-factor touched on such topics as (1) students being focused, engaged and ready to learn after breaks, (2) students asking great questions and working well together and (3) teachers enjoying positive relationships with students. Here are some representative comments:
My students were exceptional, one of the highlights of my career! We accomplished so much together, and I felt as though we were a family of learners.
By mid-semester, I was getting to know students much better and things started moving smoothly.
I developed good relationships with the majority of my students. My classroom arrangement had improved as well as my understanding of curriculum and student needs, levels and abilities. I was able to better serve their needs. Quality of work and engagement had definitely improved.
The high points are always student successes outside the classroom, which are shaped by the growth of student relationships in the classroom.
Students were motivated to participate in an international exam. As a result, I taught more content and concepts to students than I have ever done. This was exciting!
I love the kids here. They are down to earth, sweet, dedicated, hardworking and hilarious!
Student Achievement and Success
Seventy-seven of the comments had to do with student achievement and success. Comments assigned to this sub-factor touched on such topics as students (1) graduating, succeeding and completing their work, (2) overcoming the odds to pass a course and (3) winning awards or achieving athletic excellence. Here are some representative comments:
Student achievement is my high. When students do well, my morale goes up. I got good results in a tough class with even tougher kids.
My high was having a former student come back to tell me how I positively influenced his life.
Students working hard, succeeding at a higher level, justifying all solutions and loving to find the right answers! More independence.
Three weeks into the second semester, I finally got through to the majority of students who were struggling. Assignments were being completed on time, skipping had pretty much stopped and marks were going up on exams. I saw pride in those kids, some of whom said they had never done so well on a core course.
Knowledge and confidence, looking at the successes, both big and small, of my students.
Positive interactions with students who were not gifted writers. They worked hard and became successful on the diploma!
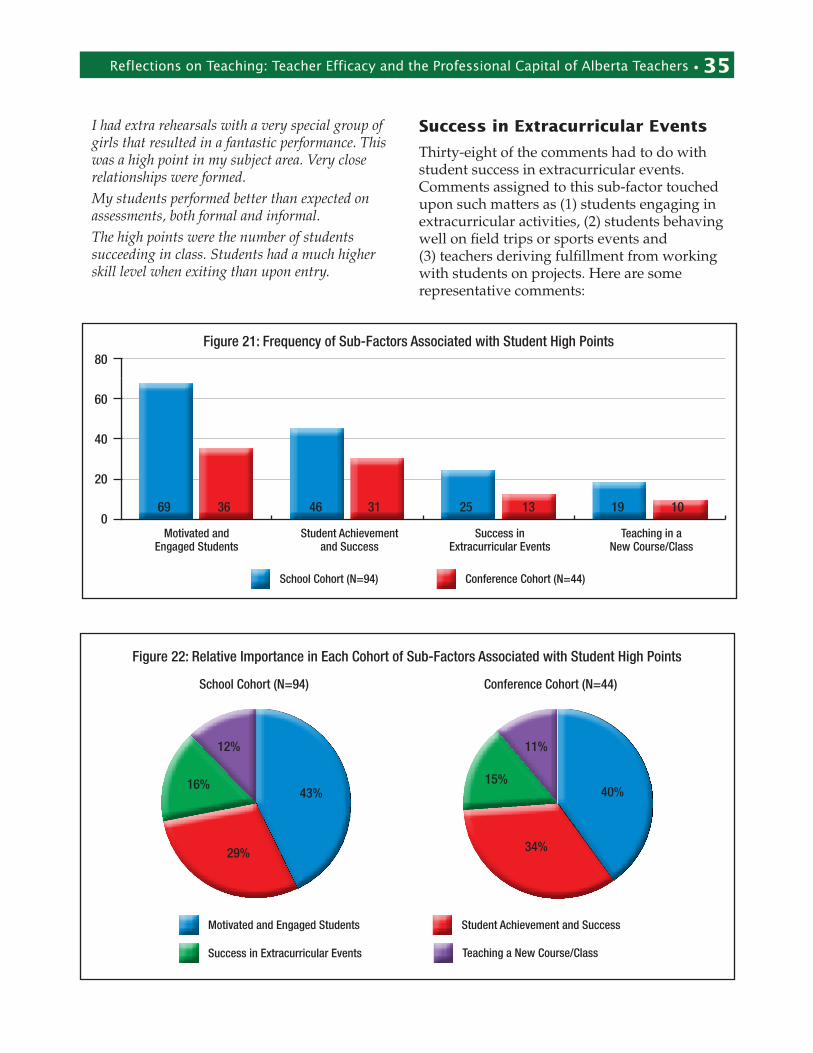
Reflections on Teaching: Teacher Efficacy and the Professional Capital of Alberta Teachers • 35
I had extra rehearsals with a very special group of girls that resulted in a fantastic performance. This was a high point in my subject area. Very close relationships were formed.
My students performed better than expected on assessments, both formal and informal.
The high points were the number of students succeeding in class. Students had a much higher skill level when exiting than upon entry.
Success in Extracurricular Events
Thirty-eight of the comments had to do with student success in extracurricular events. Comments assigned to this sub-factor touched upon such matters as (1) students engaging in extracurricular activities, (2) students behaving well on field trips or sports events and (3) teachers deriving fulfillment from working with students on projects. Here are some representative comments:
Figure 21: Frequency of Sub-Factors Associated with Student High Points
Motivated and Student Achievement Success in Teaching in a Engaged Students and Success Extracurricular Events New Course/Class
School Cohort (N=94) Conference Cohort (N=44)
69 36 46 31 25 13 19 10
80
60
40
20
0
Figure 22: Relative Importance in Each Cohort of Sub-Factors Associated with Student High Points
School Cohort (N=94) Conference Cohort (N=44)
12%
43%
29%
11%
15%16%
34%
40%
Success in Extracurricular Events Teaching a New Course/Class
Motivated and Engaged Students Student Achievement and Success
36 • Reflections on Teaching: Teacher Efficacy and the Professional Capital of Alberta Teachers
A high point was the May skills competitions. I enjoyed connecting with other chefs and teachers and being able to have time to teach serious skills to committed students and reconnect with an industry that I love. I want to stay current!
I had the chance to take my students on a field trip that greatly enhanced their learning. Curriculum was delivered hands-on so that it came alive for them.
I organized a tribute for a student going to the World Special Olympics and, in so doing, built positive relationships with all staff members.
A highlight was a successful trip to Band Camp for which I received good feedback from students. Students were interested in music beyond the classroom. I also had a good year-end concert.
I love the beginning of winter and the excitement of coaching a new basketball season. April was a high point not only because it is the end of winter but also because it is the time of year that I take my Grade 7 and 8 students to Jasper for a ski trip. It’s a highlight for students as well as for the supervisors who go along.
Teaching a New Course/Class
Twenty-nine of the comments had to do with the satisfaction of teaching a new course or class. Comments associated with this sub-factor had to do with (1) the excitement of getting to know students in a new class and (2) the sense of engagement in delivering a new course to students. Here are some representative comments:
The freedom and support to chart an interesting, creative path for my Grade 10 students allowed me to feel the satisfaction of stretching my students and myself!
February was a high point for me this year because it was the start of a robotics program at our school that I taught! I was very excited to start up this program and very excited to see how students responded to it.
Sub-Factors Associated with PolicyThe literature suggests that the factor Policy plays an important role in teachers’ efficacy and ability to achieve a work–life balance. Contrary
to expectations, however, only four participants explicitly mentioned policy in commenting on the factors that had influenced their high points. Two of these comments had to do with a “smooth registration process” and two focused on “getting a new contract.” Not enough data was available to construct a chart for this category. Here are three of the comments related to Policy:
For me, a high point was being awarded a permanent contract!
I received my permanent contract! A high point was a successful year of teaching and
then receiving an adequate teaching assignment!
Factors Influencing Low PointsRespondents were asked to choose two of their low points and to identify the factors that influenced these points. This activity engendered 1,114 comments from the two groups. The comments were parsed and identified as Personal, Students, Practice or Policy. The frequency of responses in each category is depicted in Figure 23.
In their study, Day and Gu (2010) found that the same sub-factors that applied to participants’ high points with respect to the four main factors also applied to their low points. Researchers in the current study found that the sub-factors identified in relation to participants’ high points did not always apply to their low points. As a result, the researchers came up with different sub-factors based on participants’ comments.
Sub-Factors Associated with PracticeOf the 1,114 comments that participants made about their low points, the largest number (449) related to Practice. Not surprisingly, several of the practice-related sub-factors associated with participants’ low points turned out to be the flip side of the sub-factors associated with their high points. For example, whereas many participants identified “positive interactions with colleagues”

Reflections on Teaching: Teacher Efficacy and the Professional Capital of Alberta Teachers • 37
as a sub-factor influencing their high points, a corresponding number of participants identified “negative interactions with colleagues” as a sub-factor influencing their low points.
An analysis of the comments related to Practice revealed four sub-factors (see Figure 24): (1) time pressures, (2) negative relations with colleagues, (3) extracurricular expectations and (4) lack of resources. These sub-factors generally correspond to what the literature has to say about influences on teachers’ sense of efficacy and ability to achieve a work–life balance. These influences can, in turn, affect student learning. The relative importance of each sub-factor in the two cohorts is shown in Figure 25.
Figure 25 suggests that negative interactions with colleagues were less of a problem for the school cohort (N=94) than they were for the conference cohort (N=44).
Time Pressures
A total of 298 comments from the two groups had to do with time pressures. The comments touched on such matters as (1) lack of time for organizing and planning (much of which had to be done outside of school hours); (2) the assignment of too many courses; (3) lack of time to prepare for the start of a semester; (4) lack of time to undertake end-of-semester activities such as marking, reporting and meeting with parents and students; (5) inadequate time and support to prepare for new courses, programs or subjects; and (6) the assignment to a new school and no time to figure out how things work. Representative comments include:
Not feeling I had enough time during the week to prepare and mark. With child care in the evenings, I did not have time for physical activity.
I was overwhelmed and had a lot of things coming up at the same time, including an extracurricular activity, a project and tons of tests to mark. My spouse had a nasty cold at the same time.
Workload issues and trying to effectively fulfill all my duties as a teacher, including marking, planning and assessment. The middle months of a semester are the most challenging with respect to attaining a work–life balance.
Time constraints, including teaching a variety of new courses! Trying to stay on top of things while relearning material means less focus on actual students. Educational add-ons (the tiny things) add up. Feeling constrained and limited and a general sense that I could be doing more.
Too many factors: teaching, working with school clubs and teams, keeping up with family and dealing with an older family member needing to change living space. Not having the amount of student involvement that I thought I could.
I experienced even more stress in the second semester because of lack of time!
I need time to prepare; time to sift through mountains of information and lesson plans; time to read, digest and reflect; and time to work out, walk and take photographs. I don’t need more district initiatives and paperwork.
I crashed and burned after the holiday season. I hadn’t had time to effectively prepare my resources and material. Class dynamics—specifically two boys—were driving me loco. We started a new
Figure 23: Factors Most Important in Influencing Low Points300
200
100
0 Personal Students Practice Policy
School Cohort (N=94) Conference Cohort (N=44)
210 121 169 114 265 184 19 17

38 • Reflections on Teaching: Teacher Efficacy and the Professional Capital of Alberta Teachers
outcomes-based report card, and it was just too much. The long winter meant lots of indoor recesses. Then my home was affected by the floods.
My working conditions meant that I was swamped. I was exhausted teaching three courses. I spent much of my time at school and in the evenings and on weekends preparing and very little time with family. It was very difficult trying to pull the lower-end kids through the diploma. There were misplaced kids.
Time to parent and build a loving relationship with my spouse, to have external interests, to prepare for classes and to be innovative. I need to move my personal well-being up from the bottom of the list and to feel less guilty over wanting things for myself.
Extracurricular Expectations
Forty-one comments had to do with expectations concerning extracurricular activities such as coaching, helping colleagues, mentoring student/beginning teachers and helping to plan graduation ceremonies. Here are some representative comments:
One team I was part of had some low points. Dealing with dramatic students, coaches and parents was very time-consuming and draining. I was lucky to have had at least some amazing support from the leader.
Having too many student teachers in the department was a bit of a low for me. Even my own teacher gave me a lot of extra work!
Figure 25: Relative Importance in Each Cohort of Sub-Factors Associated with Low Points in Practice
School Cohort (N=94) Conference Cohort (N=44)
8%6%
75%
11%
30%
11%
54%
5%
Extracurricular Expectations Lack of ResourcesTime Pressures Negative Relations with Colleagues
Figure 24: Frequency of Sub-Factors Related to Low Points in Practice300
200
100
0 Time Pressures Negative Relations Extracurricular Lack of Resources with Colleagues Expectations
School Cohort (N=94) Conference Cohort (N=44)
199 99 29 55 20 21 17 9

Reflections on Teaching: Teacher Efficacy and the Professional Capital of Alberta Teachers • 39
I lost balance as I began spending 12- to 14-hour days coaching basketball and baseball. I missed out on time with my family. We had a new baby. Family and health should come first, but they don’t—and there is no tangible way for them to. If we hope to do a good job at work and be involved in extracurricular activities, we need more time.
Basketball season this year was just crazy busy. Because of the June flood, our only field trip was
cancelled and we had to provide in-house events every single day for 10 days!
It was stressful planning big concerts with little or no support from staff, students and parents.
During November and December, I was overwhelmed with extracurricular activities, which were interfering with my personal life. The public and the school culture place crazy expectations on teachers to coach, organize clubs and pilot new initiatives.
Lack of Resources
Twenty-six of the comments related to a lack of resources. Comments in this category focused on such matters as inadequate access to labs and to technology, lack of tools and the need to develop teaching resources and units for new curriculum. Here are some typical comments:
My first month using an overhead projector to teach a new curriculum was very difficult. I did not know how things worked or the protocol for everyday things.
I felt really stressed over the loss of my printers. Teaching two new courses I never taught was
stressful. I developed a lot of resources for one course from scratch. Developing one’s own course resources does present a lot of satisfaction, but it required a lot of extra time (mostly weekends).
Negative Relations with Colleagues
Eighty-four of the comments had to do with negative relations with colleagues. These comments addressed such matters as (1) feeling left out or having to fend for one’s self, (2) feeling inferior to colleagues, (3) engaging in negative interactions with colleagues and (4) dealing with the loss of staff members or with new staff. Interestingly, participants in the
school cohort mentioned negative relations with colleagues more frequently than did participants in the conference cohort. Here are some representative comments:
I feel ineffective at times in the presence of department supervisors and coaches.
A fellow teacher complained about my teaching to a colleague. I did not address the issue at all, probably because I lacked mental energy and time, and because I was tired of the conflict.
Seeing staff apathy when it comes to supporting various projects.
During my low point in October and November, I was feeling overwhelmed, incompetent and isolated. I had students who were questioning my ability and I had far too much work to accomplish.
Professional evaluations in March just added stress to an already stressful situation.
Again, the factor of time is hard to separate from other sub-factors. A close analysis of the comments related to extracurricular expectations, for example, suggests that the real issue is the time (especially at certain points in the school year) required to attend extracurricular events, not the events themselves. Indeed, some respondents cited participation in extracurricular activities as among their most rewarding moments.
Sub-Factors Associated with PersonalThe second highest number of comments (331) associated with low points fell into the Personal category. Comments in this category concerned issues that affect teachers’ sense of professional efficacy and personal well-being. Three sub-factors were apparent in these comments (see Figure 26): (1) family and relationships, (2) health and (3) finances. Many of the comments in this category touched on such societal issues as dealing with difficult teens or aging parents and wanting to attend extracurricular events of one’s own family. Some participants who had recently had their first child reported struggling to achieve a work–life balance in the context of their new family dynamics. The relative importance of each sub-factor in the two cohorts is shown in Figure 27.

40 • Reflections on Teaching: Teacher Efficacy and the Professional Capital of Alberta Teachers
Family and Relationships
One hundred and thirty-one of the comments related to family and relationships. Among the issues addressed were child care, elder care, other family issues, relationships with friends and difficult life decisions. Here are some representative comments:
Adjusting to my wife’s return to work and getting the kids back into daycare. Also my daughter’s struggle to readjust.
My son started daycare because my wife went back to work. I was busy at work and had less time at home.
My grandmother, to whom I was very close, died in the fall. Her death affected every area of my life. I didn’t feel that my school supported me at this time, likely because I was new and most staff didn’t know me.
I had to make a hard decision in the spring that affected my whole life as well as my career. It was
Figure 26: Frequency of Sub-Factors Related to Personal120
100
80
60
40
20
0 Family and Relationships Health Finances
School Cohort (N=94) Conference Cohort (N=44)
93 38 106 79 11 11
Figure 27: Relative Importance in Each Cohort of Sub-Factors Associated with Personal
School Cohort (N=94) Conference Cohort (N=44)
51%
5%
44%
62%
30%
8%
FinancesFamily and Relationships Health

Reflections on Teaching: Teacher Efficacy and the Professional Capital of Alberta Teachers • 41
very stressful and I know it affected my energy and my teaching.
Family busyness and my own children in transition created a near breaking point in my career. There were crises at home having to do with the life choices of my own children. The situation resulted in late nights, long discussions and fatigue, and I fell behind in my marking. The job was good in the classroom. I had enough energy to teach to my self-imposed standards, but at home there was a total collapse.
Two members of my family were injured and I had to leave work before getting everything done that I wanted to.
My spouse was very ill in hospital. I was isolated and had many added responsibilities at home. I had no family support.
Divorce and school issues resulted in one of the most stressful periods in my life.
Personal factors are huge. Parenting is key in my life, and I’m on a learning curve with respect to how to get through the next phase of responsibility.
Health
One hundred and eighty-five of the comments related to health. Among the topics mentioned were lack of time for exercise, weight gain, injuries, illnesses, surgical procedures, car accidents, exhaustion, anxiety, low energy and weather-related stress. Here are some representative comments:
After a car accident, I found working painful. I was groggy while teaching and then got sick. I missed tournaments and games, which left me frustrated and in tears off and on for weeks. I had no time to heal and felt that I should be studying, preparing and working.
I was not exercising and taking care of my physical health.
At the end of the semester, I had a lot of work. I was too tired to make supper, so I was not eating the best.
My low points are the end of the year, which is when burnout sets in. I become tired, and marking assignments takes longer. I did not swim nearly enough and was tired all the time.
When I get low it is usually because of health. I couldn’t exercise for eight weeks due to an injury.
I need to keep fit so that I have the energy needed to teach.
I was not sleeping well because I was worried about job stability.
My lowest points are times when my obligations at work do not allow me to maintain my training regimen. I start to sacrifice sleep to work and the next day is a little more difficult. Breaking out of this cycle is hard. Once it begins, something has to give.
Teaching 3+ almost killed me. I was stressed to the max! I couldn’t work out because I was prepping, marking and communicating with parents. I spent very little time with family members who often texted to ask when I was coming home.
I experienced a decline from March to June when I started to gain a lot of weight. I did not take time to exercise and I felt my stress level rising.
Finances
Twenty-two of the comments related to financial issues, including buying or selling a home, paying for children’s education, paying for weddings, moving, having a partner lose a job and facing job insecurity due to government cutbacks. Here are some sample comments:
I bought a new house and then was declared “surplus.” Stress of not knowing where I would be teaching along with the stress of buying a new house.
Stress of pension and other increases coupled with the purchase of a new home.
Sub-Factors Associated with StudentsWhile having engaged and successful students can constitute the high point of a teacher’s life, contending with disengaged and disruptive students can result in the darkest hours. The data contained 290 comments about the impact that negative interactions with students have on a teacher’s sense of efficacy and well-being. Even students who, though engaged, are unprepared or struggling can negatively affect a teacher’s well-being and sense of efficacy.

42 • Reflections on Teaching: Teacher Efficacy and the Professional Capital of Alberta Teachers
Teachers clearly place great value on making a difference in their students’ lives. Negative interactions with students can affect other aspects of teachers’ lives, such as their health, their relations with colleagues and the level of support that they get from administrators.
Because it affects student engagement, the issue of classroom size and composition can be construed as pertaining either to the factor Student or to the factor Policy. Because most of the comments about class size and composition in the current study focused on workload, student engagement or the difficulty of dealing with a few challenging students, the researchers chose to assign the comments to Students. This categorization mirrors that of Day and Gu (2010, 52), who assigned classroom size and composition to the category “pupil intake characteristics.” Five sub-factors were apparent in the comments concerning students (see Figure 28): (1) disruptive behaviours, (2) lack of achievement, (3) negative interactions with parents, (4) unfamiliarity with students and (5) class size and composition. The relative
importance of each sub-factor in the two cohorts is shown in Figure 29.
Disruptive Behaviours
One hundred and thirty comments concerned students who were disruptive, whether as a result of being disengaged, unmotivated, aggressive, rude, disrespectful, or chronically late or absent. Other comments focused on the difficulty of trying to accommodate students who were frequently absent so that they could go on field trips or participate in sporting activities.
The second semester was opposite to the first. Student interaction was much more negative. I felt that I was spending far too much time dealing with misbehaviour.
At the start of semester two, I had two biology classes filled with unmotivated students who had poor work habits and were frequently absent. I spent a lot of time phoning or e-mailing parents and supervising lunchtime detentions for students who had skipped classes or failed to complete their
Figure 28: Frequency of Sub-Factors Related to Students
90
80
70
60
50
40
30
20
10
0 Disruptive Lack of Negative Interactions Unfamiliarity with Class Size and Behaviour Achievement with Parents Students Composition
School Cohort (N=94) Conference Cohort (N=44)
82 48 52 38 12 13 10 10 13 12

Reflections on Teaching: Teacher Efficacy and the Professional Capital of Alberta Teachers • 43
Figure 29: Relative Importance in Each Cohort of Sub-Factors Associated with Students
School Cohort (N=94) Conference Cohort (N=44)
6%
48%
7%
8% 10%8%
11%
31%31%
40%
Technology Resources
Course Development and Innovation
Preparation Time Teamwork and Collaboration
Positive Teaching Experiences
work. The first three weeks were exhausting, but they paid off! Although some students questioned my methods, parents were appreciative.
I encountered very challenging behaviours in a class made up of 20 students on individualized program plans and 3 to 6 severely behaviourally challenged students. I felt a bit hopeless in terms of effective instructional delivery.
I had a very severely behaviourally challenged student whom my administration refused to acknowledge until mid-October.
I was so exhausted I spent my weekends in bed. I often worked until 7pm calling parents about absences.
I experienced a low point at the beginning of the term, when I had a number of students who were frequently absent. Administration stepped in and removed a few that were defiant and did not want to be there.
I had several math students who were constantly away on field trips. I would arrange for a test, and students would announce that they were going to be away. In February, students were continually away because their International Baccalaureate projects were due. Almost half my math class consisted of Grade 11 students who figured they would do poorly and planned to take the course again.
I had a new student who required an incredible amount of my time and energy. I experienced a slow wellness drain that affected both my home and work life. At the end of November, the student was removed to a facility that could provide more help. He returned in May, and there was no one to provide support.
March was especially difficult this year. Although I worked harder than in September, students were less motivated. This continued to the end of the term. When students do not respond as I feel they should, I feel that my work is not done well, and I often use personal time to create interesting, innovative lessons.
Lack of Achievement
Ninety comments had to do with students not achieving or succeeding as expected. Among the issues addressed were (1) students entering a class unprepared for the subject level and (2) feelings of inadequacy on the part of teachers when students fell behind. Here are some representative comments:
Students came into class lacking basic skills. My classes contained many students at risk.
Not connecting with Grade 10 students and failing to build relationships. We had one fewer staff member and I couldn’t do it all.

44 • Reflections on Teaching: Teacher Efficacy and the Professional Capital of Alberta Teachers
Negative Interactions with Parents
Twenty-five comments related to the stress engendered by negative interactions with parents concerning student progress, behaviour or absenteeism. Here are some typical comments:
I had a phone call from a negative parent. The mom challenged some of her child’s test results. I offered to retest the student and the mother declined.
I experienced conflict from parents over assessments. I got little support from administration.
Unfamiliarity with Students
Twenty comments had to do with the stress teachers new to a school or subject experience while getting to know students. Here are some typical comments:
I was teaching a new curriculum and had to develop new resources, new lesson plans and new assessments. I was ahead of students by a week only and, as a result, focused on the basic materials rather than the extras.
The start of each semester involves a lot of uncertainty with respect to getting to know the students, adapting to new timetables and trying new things.
A student new to my classroom became overwhelmed with the environment he found himself in. I did not know how to read him effectively. He left the room angry, went to the washroom and destroyed some school property.
September is stressful dealing with incoming students. Establishing routines and procedures is important. I find it taxing to teach children whom I don’t know very well.
Class Size and Composition
Twenty-five comments had to do either with class size (too many students, especially if the teacher is assigned multiple subjects) or class composition (many high-needs students and no educational assistant or other resources). Here are some typical comments:
I had large classes with several behaviourally disordered and at-risk students. I did not have enough time or energy to deal with all of them. I
was told that I had to buy my own class sets for special projects.
Exhaustion reduces my effectiveness as a teacher, but it’s my home life and health that suffers most from huge class sizes and tracking large numbers of students. I don’t care what the statistics say: class sizes and special-needs students in regular classrooms are not even coded anymore. Just thinking about increased work pressures causes my blood pressure to rise. I am under a doctor’s care now.
I had a large, tough Culinary 10 class in which the boys had this weird game in which they punched each other in the genitals. The school is short staffed, and I was taking university classes. I felt that I had very little to look forward to. It was a lonely time.
When dealing with large classes, it is hard to get to know the students.
Large class size due to government cutbacks. The workload is overwhelming in terms of preparing and marking. That is why I decided years ago to work .8 FTE.
I get annoyed when I hear that some teachers have only 12 students whereas others have 35 or that some full-time staff teach 2 classes while I teach 3 or 4 per semester.
In May, a medically fragile student had seizures every two weeks. I needed to call an ambulance several times. My main focus was making sure that the student was OK and feeling good while teaching the rest of the class.
In September I was overwhelmed by the size of my class and the feeling that I was inadequate. I focused exclusively on teaching and coaching volleyball. No fun! November was the same. I experienced a gradual improvement once my class was reduced.
Sub-Factors Associated with PolicyEven though Policy affects such matters as class size and composition, participants seldom identified Policy as a critical influence in determining their high and low points. If Policy was mentioned at all, it was usually in connection with low points. A possible explanation for the relative paucity of references

Reflections on Teaching: Teacher Efficacy and the Professional Capital of Alberta Teachers • 45
to Policy may be that teachers tend to focus on the immediate realities of the classroom rather than on the factors bringing about those realities. This explanation is supported by the results of a 2013 ATA survey2 in which teachers identified, as the top 10 sources of work-related stress in the past year, the following: (1) keeping up with the demands of teaching generally, (2) lack of preparation time, (3) job pressures interfering with family or personal life, (4) the composition of classes, (5) the unmet needs of students in classes, (6) students with disruptive behaviours, (7) preparing report cards, (8) government attitude toward teachers, (9) tracking and reporting student progress and (10) the size of classes.
Comments in the current study with respect to low points contained 34 references to policy or government decisions. Although three or four participants mentioned excess paperwork or cited district initiatives, the researchers concluded that the number of references to these matters was insufficient for them to be considered sub-factors. However, two sub-factors, which sometimes overlap, did emerge (see Figure 30): (1) the impact of funding cuts on staff and (2) the impact of funding cuts on programs and resources.
The Impact of Funding Cuts on Staff
Twenty comments had to do with the impact of funding cuts on staff. Most comments focused
on the anxiety that results from not knowing whether one will have a job next year.
Being laid off for the umpteenth time! Being made “surplus.” June, because it is the end of the term and I am
ready for a break, is usually a low point, but this year it was particularly discouraging. Our new agreement put young teachers like me in a bad situation. I think it put a shelf life on my career in northern Alberta.
Government decisions mean that schools will have a very difficult time in the next two or three years.
The Impact of Funding Cuts on Resources
Fourteen comments had to do with the elimination of valuable programs because of a lack of funding. Here are some typical comments:
District cutbacks are low points. Decisions about money affect staffing and programming.
After a positive year, we were told that the program would probably not continue. Administration did not inform me until we all were told at a general meeting. Administration was making decisions without allowing me to voice my concerns.
There are too many district initiatives. I’m an expert in my field, so let me do my job. So much busywork makes me feel as though my job is insignificant.
2The ATA’s annual member survey is conducted February to April and typically elicits responses from about 1,000 teach-ers across the province.
Figure 30: Frequency of Sub-Factors Related to Policy15
10
5
0 Impact of Funding Cuts on Staff Impact of Funding Cuts on Programs and Resources
School Cohort (N=94) Conference Cohort (N=44)
10 10 7 7
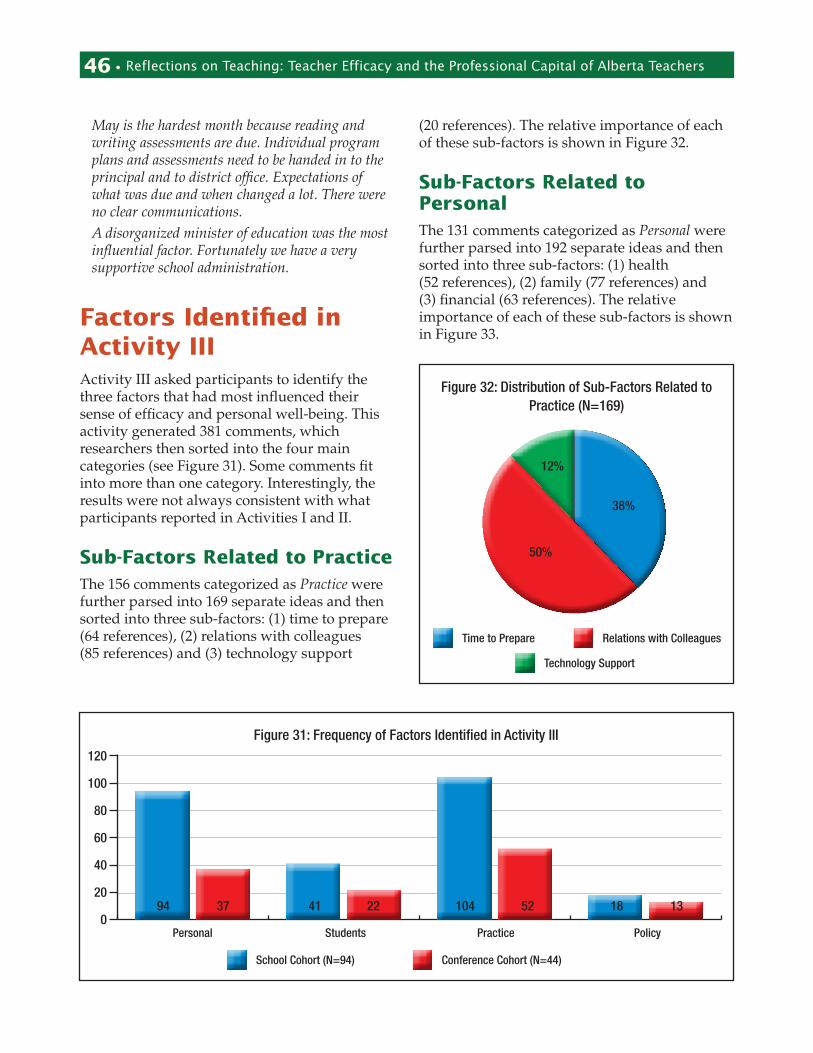
46 • Reflections on Teaching: Teacher Efficacy and the Professional Capital of Alberta Teachers
May is the hardest month because reading and writing assessments are due. Individual program plans and assessments need to be handed in to the principal and to district office. Expectations of what was due and when changed a lot. There were no clear communications.
A disorganized minister of education was the most influential factor. Fortunately we have a very supportive school administration.
Factors Identified in Activity IIIActivity III asked participants to identify the three factors that had most influenced their sense of efficacy and personal well-being. This activity generated 381 comments, which researchers then sorted into the four main categories (see Figure 31). Some comments fit into more than one category. Interestingly, the results were not always consistent with what participants reported in Activities I and II.
Sub-Factors Related to PracticeThe 156 comments categorized as Practice were further parsed into 169 separate ideas and then sorted into three sub-factors: (1) time to prepare (64 references), (2) relations with colleagues (85 references) and (3) technology support
(20 references). The relative importance of each of these sub-factors is shown in Figure 32.
Sub-Factors Related to PersonalThe 131 comments categorized as Personal were further parsed into 192 separate ideas and then sorted into three sub-factors: (1) health (52 references), (2) family (77 references) and (3) financial (63 references). The relative importance of each of these sub-factors is shown in Figure 33.
Figure 31: Frequency of Factors Identified in Activity III
Personal Students Practice Policy
School Cohort (N=94) Conference Cohort (N=44)
120
100
80
60
40
20
0 94 37 41 22 104 52 18 13
Figure 32: Distribution of Sub-Factors Related to Practice (N=169)
12%
38%
50%
Technology Support
Time to Prepare Relations with Colleagues
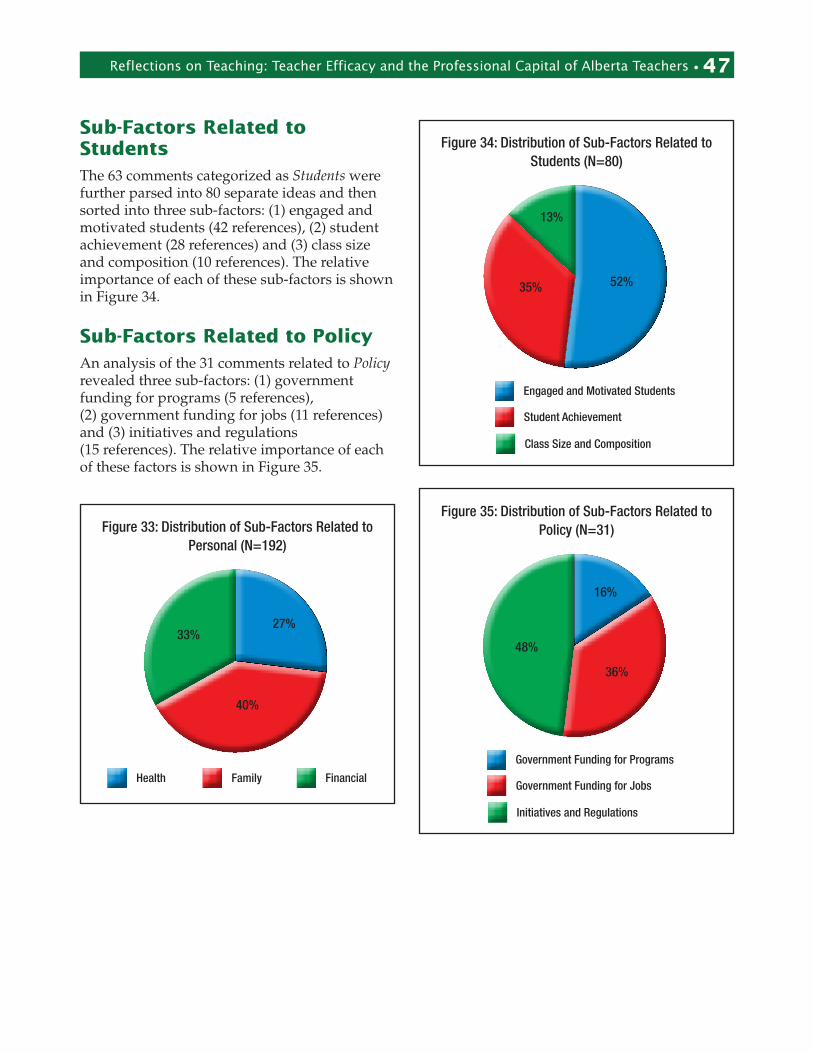
Reflections on Teaching: Teacher Efficacy and the Professional Capital of Alberta Teachers • 47
Sub-Factors Related to StudentsThe 63 comments categorized as Students were further parsed into 80 separate ideas and then sorted into three sub-factors: (1) engaged and motivated students (42 references), (2) student achievement (28 references) and (3) class size and composition (10 references). The relative importance of each of these sub-factors is shown in Figure 34.
Sub-Factors Related to PolicyAn analysis of the 31 comments related to Policy revealed three sub-factors: (1) government funding for programs (5 references), (2) government funding for jobs (11 references) and (3) initiatives and regulations (15 references). The relative importance of each of these factors is shown in Figure 35.
Figure 33: Distribution of Sub-Factors Related to Personal (N=192)
33%27%
40%
FinancialHealth Family
Figure 34: Distribution of Sub-Factors Related to Students (N=80)
13%
52%35%
Class Size and Composition
Engaged and Motivated Students
Student Achievement
Figure 35: Distribution of Sub-Factors Related to Policy (N=31)
16%
36%
48%
Initiatives and Regulations
Government Funding for Programs
Government Funding for Jobs

48 • Reflections on Teaching: Teacher Efficacy and the Professional Capital of Alberta Teachers

Reflections on Teaching: Teacher Efficacy and the Professional Capital of Alberta Teachers • 49
This study suggests that teachers’ sense of efficacy and their personal well-being are affected by factors that relate to their Personal lives outside the school, their relationships with Students, the conditions of Practice in which they find themselves and Policy decisions emanating from their school board and the provincial government.
The comments gathered suggest that participants do everything within their power to manage their family responsibilities, health and workload while, at the same time, giving their students the best learning experiences possible. Nevertheless, the majority of participants revealed that, at certain times of the year, they simply cannot remain on top of things. This situation ultimately affects the learning of their students.
Researchers noted that the pattern of ups and downs in the graphs that participants had drawn during Activities I and II were remarkably similar, suggesting that teachers’ sense of efficacy and personal well-being are related. Responses to Question 1 of Activity III (which asked participants to identify similarities and differences between their two line charts) further confirmed the visual analysis. Based on their comments, most participants believe that their sense of efficacy at work is directly related to their well-being and that when one aspect of their life is out of balance, all aspects of their life are out of balance.
Many respondents did not answer Question 1 of Activity III. Others simply stated that the two line graphs were similar. Still others stated that the graphs were similar and went on to offer, as an explanation, the fact that workload inevitably increases at certain points in the term every year. A number of other participants included detailed stories or offered personal insights. For example, some participants observed that their lows all occurred during the winter and wondered if they might have seasonal affective
disorder. Others attributed their highs or lows to a specific incident, such as a broken foot or being assigned a particularly receptive group of students.
The factors that participants cited most frequently as influencing their highs and lows were time, family issues, workload, health, and interactions with students and colleagues. Although aware of the factors affecting their high and low points, many participants commented that their ability to control or change these factors was minimal.
• Seventy-seven per cent of participants observed that their professional and personal line charts were closely related. Many of these participants commented that what happens at work affects their home life and vice versa. Teachers who feel supported, whether at home or at work, are better able to handle seasonal fluctuations in workload, challenging students, family issues and health concerns.
• Twenty-one per cent observed that their two charts, while somewhat similar, also contained differences. The explanation most commonly advanced to explain the differences was that stressful things were occurring in one setting (say, at home) while positive things were occurring in the other setting (school). For example, a participant may have simultaneously experienced something negative at home (an illness, death or divorce) and something positive at work (student success or support from caring colleagues).
• Two per cent of participants did not draw a second chart or failed to comment.
According to participants, the factor that had the biggest influence on their line charts was the inability to achieve a work–life balance. As a result, their two charts were sometimes polar opposites: when teachers dedicated more time to their work, their family life and health suffered. Conversely, when teachers decided to
Developing Efficacy and Well-Being by Building Professional Capital

50 • Reflections on Teaching: Teacher Efficacy and the Professional Capital of Alberta Teachers
dedicate more time to themselves and their families, they were less prepared at school and less able to provide high-quality student learning. Here are some representative comments:
When my home life is good, work falls into place and vice versa.
When my family is going through chaos, I am less able to take on more at work. Highs occurred when I was able to balance my work and home life. I didn’t realize how much government decisions affected my family life.
Typical High and Low Points in the YearAn analysis of the line charts revealed that many participants experienced the same pattern of high and low points throughout the year with respect to both their professional efficacy and their personal well-being.
High PointsHigh points for participants typically occurred at the beginning of terms, after they had had a long break. Many participants, for example, pointed to September as an exciting time of anticipation and anxiety. At these times, participants felt organized, excited, effective and engaged in teaching and in life. Their energy and enthusiasm for participating in extracurricular events and meeting students’ needs were high. Here are some typical comments:
It’s the beginning of the new semester and I’m excited to bring formative assessment to the forefront and to try new approaches.
At the beginning of the semester my work–life balance is most in line because I have had some time to prepare for the first month.
In September, I was well rested from summer and excited about the new year.
I’m always good to go in September! I felt in control of my life and had enough time to be good in all my roles: mother, wife, teacher and friend.
A high point is September when everything is new and I’m still relaxed from the holidays.
September is a high point. I’m starting fresh with energy and ideas!
I felt creative in class and excited about my new position. I was pumped about being at work and felt excited to be with family and friends. I had lots of energy!
Many participants reported that they felt most positive and effective when they were enjoying healthy relationships, whether with family, colleagues, administrators or students. Many participants reported experiencing a “cruising period” in mid-semester during which they felt connected with students and colleagues and able to achieve a sense of work–life balance. Here are some representative comments:
By November, I felt confident that I was helping students and giving them correct information. I felt at ease with the transition. I loved my environment. Key influences were colleagues and working conditions.
High points for me are when I feel support from family, colleagues, administrators and students. At such times, I know that what I’m doing is worth it.
According to many participants, collaborative work with colleagues peaks in late September and October, falls off in December and is virtually nonexistent by the end of the school year. Many participants identify May and June as high points because they are happy to be finishing the year, know where they are going to be teaching next year and are involved in graduation.
The first month or so of each semester is when I feel the freshest. It is also when the most collaboration with colleagues seems to happen. Attending course-specific professional development throughout the semester to exchange ideas, experiences and resources always boosts my sense of effectiveness.
The beginning of the year is a high point for me because I am personally well rested and have fresh ideas and resources and students are open-minded and hopeful. May is also a positive time: winter is over, courses are finishing and I’m looking forward to what will happen after June 30 both for me and

Reflections on Teaching: Teacher Efficacy and the Professional Capital of Alberta Teachers • 51
my students. Students in May are more focused because most sports teams are done.
Many participants also experienced January and April as high points, likely because they had just enjoyed a significant break that enabled them to plan, catch up with family and home life, travel, take tropical vacations or exercise. At such times, participants reported feeling rested, energized and ready to engage in fresh approaches. Students also seemed more engaged in learning during these periods, likely because they were not distracted by upcoming holidays, sports events or the end of the school year.
In January, I seem to have less paperwork, so I can focus on my students’ needs and my family’s needs.
In January, due to many lunch hours of remedial work, my very large Grade 9 class achieved very well.
The study suggests that breaks in August, December and the spring enable teachers to recharge their batteries and (if they know what courses they will be teaching) to plan, prepare learning resources and reflect on strategies.
Low PointsThe research literature and data from this study suggest that most teachers feel overwhelmed at several points during the year. In particular, teachers who did not know what they would be teaching, who were completely new to a school or subject, or who had no mentor or support person tended to identify September and January as low points. For beginning teachers or teachers new to their subject, September can be especially challenging. Most inexperienced teachers start the year in a deficit position and struggle to gain a sense of efficacy and well-being.
Most participants who have a full or nearly full course load and who have prepared during the summer or before year-end still often experience a state of decline from September onward. For these teachers, the same pattern tends to recur at the beginning of the second term. The comments suggest that teachers who exhibit these peaks and valleys in their professional lives tend to
experience the same pattern in their personal lives. Furthermore, teachers who are unprepared for their teaching assignments or who do not receive adequate support may feel ineffective in all aspects of their lives, a situation that can deteriorate into a self-perpetuating downward spiral.
Many teachers also crash and burn in late November and early December, a period when exams and reporting take precedence over interactions with students and colleagues. Familial and seasonal demands may also compete for teachers’ time during this period; the weather is difficult, energy is low and seasonal illnesses abound. Students may have difficulty focusing, and attendance tends to drop off. The study suggests that, when the focus is on exams and reports, things may go off the rails and supports may disappear. Ironically, periods of high stress are precisely the times at which teachers of all ages and at all stages need the most support from colleagues, administrators and family. Interestingly, the two line charts that participants drew tend to either mirror each other (77 per cent) in November and December or suddenly split into opposite directions (21 per cent). During these periods, teachers are especially apt to experience competing demands from their work and their family.
Other low points include March, May and June, months that are especially difficult for teachers teaching several courses, beginning teachers and teachers whose jobs or programs are threatened due to cutbacks. The emotions that teachers experienced during these low points ranged from mild dissatisfaction, to frustration, to guilt, to near debilitating burnout and stress. The higher the workload, the more courses being taught and the higher the levels of personal stress (due to family, relational or health issues), the more severe the low point was perceived to be. The biggest factor in creating low points was lack of time to prepare for courses.
Midway through the semester, I started to feel bogged down, spending a lot of time preparing, making notes and gathering resources for the new courses I was teaching.

52 • Reflections on Teaching: Teacher Efficacy and the Professional Capital of Alberta Teachers
For half of each semester, I spend two to four hours each Saturday and Sunday marking and preparing for a new course. I didn’t have enough time during the week to prepare, mark and take care of my children in the evening so that I could engage in physical activity.
I was overwhelmed. Many things came up at the same time: extracurricular activities, a project and tons of tests to mark. My spouse had a nasty cold and flu. By May I was not sleeping well. I was stressed and worried about job stability.
Another factor that created low points was a breakdown in relationships: lack of support from an administrator, negative interactions with colleagues or having to do everything at home.
During November, I had lots of paperwork: preparing report cards, marking late assignments and correcting missed tests. Students suddenly began caring about incomplete assignments. I was tired from driving my kids to activities, helping with their homework and still finding time to prepare. Meanwhile, my spouse was very ill, so I had many added responsibilities at home and no family support.
Students in December were unmotivated and unenthusiastic about participating in class activities that had always worked well in the past. They were a disparate group of students and it took a long time to help them cohere as a group.
In March, I felt a lack of engagement with my peers because I was unable to attend many staff meetings. I felt somewhat isolated.
Participants made explicit connections between being overloaded at work and experiencing exhaustion and burnout, stress at home and an inability to keep up with fitness routines. During these times, teachers were less enthusiastic about participating in extracurricular events, helping struggling students or dealing with student misbehaviour. They often felt guilty about being unable to help students achieve, even if the reason was their own ill health, large classes, lack of support or being assigned to too many classes. One teacher who was recovering from major surgery at home reported feeling personally responsible when she learned that one of her students did not pass. She recorded
this realization as a low point on her work–life chart.
Student skills and literacies are often lacking. Larger classes mean that a teacher cannot always do enough to help kids achieve everything. Sometimes I had to forgive myself for my failures.
I had my first child and was struggling with where I belonged most: at home or at school. No matter where I spent my time, I felt that wherever I wasn’t would be negatively affected. This struggle continued into February. I felt guilty about not being at home when I was at school and vice versa!
I experienced fatigue in November and May. The amount of work seemed to escalate and there was not enough time to do everything. I had to choose what I could and could not do. Sometimes this leads to mistakes.
From October to December, I felt overwhelmed, defeated, exhausted and guilty about not spending time with family and friends.
I felt ineffective in dealing with some of my science and science honours students. I felt that I had not done enough to guide some students.
Although few participants stated explicitly that their workload affected student learning, several of them implied that the two matters were related.
Achieving a Work–Life BalanceDuring periods of intense workload and stress, participants tended to sacrifice their health first, their family second, the time spent on paperwork and preparation third, and student learning fourth. Several participants observed that putting work ahead of their health and family life was a state of affairs that could not continue. One participant put it this way: “This has to change! I tend to focus on work over life! I must find a balance!”
Positive ways that participants coped during challenging times included building strong relationships with colleagues, sharing materials and resources, and co-developing learning and assessment tools. Collaborating with colleagues

Reflections on Teaching: Teacher Efficacy and the Professional Capital of Alberta Teachers • 53
becomes essential to the survival of such teachers and to the quality of the learning experiences that they are able to offer students. Sadly, some teachers never fully recover from their low points because they do not receive adequate collegial and administrative support.
An interesting follow-up study would be to track the few teachers whose line graphs (and comments) indicate that they are on top of things and are able to remain positive. The purpose of such a study would be to see whether these teachers have a strategy for avoiding low points or whether they simply enjoy better working conditions than their colleagues. Comments from such participants in the current study suggest that they are teachers who have managed to achieve a work–life balance. They have the time to take care of their health and to fulfill family obligations; they have time embedded in the school day to plan, prepare and mark; and they enjoy positive relations with their colleagues. As a result, they are more equipped to undertake innovative practices, participate in extracurricular activities and field trips, and work with students and colleagues on special projects.
Whether things were positive or negative at home or at work, participants tended to identify time when their students were succeeding, engaged in learning and behaving well as high points during the year. Although teachers love to see their students doing well, their ability to help students depends on how well they themselves are feeling and how able they are to cope with demands.
When I feel rejuvenated, I feel my students are getting my best.
I took time off without pay for the first time ever! I put my family and myself first and took mini-vacations in February and May. I try to balance my work and home life. When I am healthy, I can handle anything.
Healthful Coping StrategiesAmong the healthful coping strategies that participants identified were these:
• Using vacation periods and seasonal breaks to prepare. (This strategy, of course, applies only when teachers know in advance what they will be teaching!)
• Collaborating with colleagues to save time, get support and share workloads.
• Asking for help and participating in orientation and induction activities for new teachers.
• Taking seasonal breaks to recharge and refresh by going on vacation, exercising and reconnecting with family and friends.
• Committing to a fitness routine by joining a group or taking a fitness class—even if doing so means getting behind on marking or preparation.
• Maintaining a positive attitude and approach, being excited about teaching and focusing on the positives in each day or year.
Unhealthful Coping StrategiesHere are some of the unhealthful strategies that participants employed to cope with demands:
• Working evenings, nights and weekends to set up, catch up and keep up.
• Withdrawing from health and fitness programs to set up, catch up and keep up.
• Withdrawing from social events and friendships to set up, catch up and keep up.
• Withdrawing from family obligations to set up, catch up and keep up.
• Withdrawing from extracurricular duties such as coaching and mentoring other teachers.
• Withdrawing from work due to illness.
In short, this study confirms (1) that teachers’ sense of professional efficacy and ability to achieve a work–life balance are inexplicably linked and (2) that teachers who feel ineffective or whose personal well-being is compromised are less able to help their students learn.

54 • Reflections on Teaching: Teacher Efficacy and the Professional Capital of Alberta Teachers
Building the Professional Capital of Alberta TeachersResearchers briefly compared the factors identified in this study as affecting teachers efficacy and well-being with those noted in the literature. The first study considered for purpose of comparison was that undertaken in Newfoundland and Labrador by Dibbon (2004), who collected qualitative and quantitative data from 681 teachers. Dibbon identified four major factors affecting teacher workload: lack of time (52 per cent), class size and composition (53 per cent), new programs and curriculum (30 per cent), and inappropriate assignments or schedules (26 per cent). Dibbon’s finding that lack of time was a crucial factor for teachers corresponds to the results of the current study, in which 48 per cent of teachers identified lack of time as a concern.
In the current study, 2.2 per cent of participants specifically identified class size and composition as a concern, significantly fewer than the 53 per cent reported by Dibbon. However, several participants commented on new programs and curriculum, inappropriate assignments and scheduling difficulties, concerns that could be construed as relating to class size and composition.
Although many participants remarked that they enjoyed exploring innovative assessment methods and tackling fresh assignments, others pointed out that developing resources from scratch adds to workload and stress. Without exception, participants having full course loads noted that they experienced exhaustion and near burnout at certain times of the year, particularly during exam periods and at year-end. Dibbon would likely have assigned these difficult situations to the category “inappropriate assignments or schedules.”
In their study of teachers in Prince Edward Island, MacDonald et al (2010) concluded that a teacher’s workload comprises six elements: teaching stress, technology resources, other resources, supervisory support, collegial
support and job satisfaction. The current study confirms the finding of MacDonald et al that the level and quality of support that teachers receive from their supervisors and colleagues affect not only their stress levels but also their sense of efficacy, their well-being and the impact that they have on student learning. MacDonald et al also found that collegiality matters more to permanent teachers than to new and temporary teachers. The current study, however, suggests that new and temporary teachers also rely on and benefit from establishing positive relationships with colleagues. Indeed, some participants described receiving support from colleagues as crucial and identified a lack of collegial interactions as a factor influencing their low points. Only 7 per cent of teachers identified technology resources as a factor influencing their efficacy and well-being.
MacDonald et al used a survey, time logs of daily activities and two focus groups to collect data. Given the opportunity to provide narrative, chronological and biographical evidence about their day-to-day lives, teachers emphasized the importance of relationships. The current study supports the findings of MacDonald et al that collegial support is especially significant to teachers in secondary schools (Grades 9 to 12). One explanation for this finding is that collaborative time is harder to arrange in high schools.
In their study, MacDonald et al also explored the impact of such variables as school type, class size and full-time equivalency on the job satisfaction of teachers. The authors concluded that class size and full-time equivalency had no impact on job satisfaction. By contrast, the current study found that nearly 100 per cent of full-time teachers were overwhelmed at several points during the year. Teachers who had fewer or smaller classes, on the other hand, appeared more able to achieve a work–life balance.
James Matsui Research (2006), in a study undertaken for the Ontario English Catholic Teachers Association, found that many teachers spend a great deal of time at home preparing lessons and marking assignments. Forty-three per cent of teachers in that study reported feeling overworked all or most of the time, and

Reflections on Teaching: Teacher Efficacy and the Professional Capital of Alberta Teachers • 55
an additional 51 per cent felt overworked at least part of the time. Although permanent teachers in the current study did not report being overwhelmed all of the time—indeed, many of them experienced high points during the year—most felt overwhelmed at certain times of the year, especially in December, early spring and June. Teachers who were returning to the same school, who had taught the subject matter previously or who had had a chance to prepare were, not surprisingly, less overwhelmed. By contrast, teachers who were underprepared at the start of the year or who were new to the school or to the subject matter often experienced difficulty gaining ground. Lack of support and limited resources exacerbated their situation, and many were afraid to ask for help from equally busy colleagues.
James Matsui Research (2006) concluded that excessive workload had had at least some impact on the personal, family and social lives of 89 per cent of participants and a significantly negative impact on 49 per cent of participants. This finding is consistent with the current study, in which 95 per cent of participants indicated that workload had affected their personal, family and social lives and, in many cases, their health. Eighty per cent of participants in the James Matsui Research study indicated that work demands had affected their health. Among the factors identified as contributing to their workload were more special needs students, split-grade assignments, curriculum expectations, student assessments, the number of subjects and classes assigned, parental expectations, report cards, class size and curriculum changes. Although the current study did not focus on those issues, many participants alluded to them in their comments. Approximately 25 participants in the current study commented on class size, 13 commented on parental expectations and 10 commented on class composition (especially in the context of insufficient support for handling special needs students). Even more participants commented either directly or indirectly on report cards and on the number of subjects and/or classes to which they were assigned, a finding that is consistent with that of James Matsui Research.
Although participants with a full course load in the current study tried to manage by maintaining a positive attitude, getting organized, developing support networks of family and peers, and staying fit and healthy, they all struggled and lost ground by the end of the term, at which point they described themselves variously as burnt out, overwhelmed or exhausted. As one participant about to embark on a year of such workload put it, “Excited about the opportunity, but, oh my God, how will I ever manage?”
The findings of the current study also align with those of the Manitoba Teachers’ Society 2006/07 Teacher Workload Study (Dyck-Hacault and Alarie 2010), which concluded that the top stressors for teachers are lack of time and too many expectations, especially for teachers involved in extracurricular activities such as coaching. The current study revealed, however, that participation in extracurricular activities, while a source of stress, can also constitute a high point in the working lives of teachers. Like the study in Manitoba, the current study confirmed that dealing with misbehaving, unengaged or unmotivated students can be among the worst moments for teachers.
The current study also confirms the following findings from a study that Naylor and White (2010) conducted on the working and learning conditions of teachers in British Columbia:
• Teachers work well beyond the standard workweek, and full-time teachers work the most.
• Teachers spend their vacations and breaks recuperating from the hectic demands of the school year, attending to personal responsibilities deferred during the school year and caring for dependent or ill family members.
• Among the factors that most influence teacher efficacy and well-being are relationships with students and having autonomy in the classroom.
• Stress is the result of a combination of factors, including multiple demands, limited time, classroom size and composition, and lack of support for behaviourally disabled students.

56 • Reflections on Teaching: Teacher Efficacy and the Professional Capital of Alberta Teachers
Younghusband (2005) and Pickering (2008) both concluded that the following factors create stress for teachers: time pressures, problems associated with class size, inclusive classrooms, family considerations, workplace change, lack of administrative support, inadequate collegial support, lack of resources and disruptive students. The current study confirmed these findings, especially with respect to time pressures, family considerations, lack of administrative and collegial support, and disruptive students. Indeed, many participants alluded to all four stressors when identifying their low points during the school year.
The challenge of trying to attain a work–life balance is exacerbated when teachers find themselves using family time to prepare lessons, mark assignments and write reports. Teachers who struggle to fulfill the demands of their job have little energy left to cope with their roles at home. Teachers face many stresses at home, including health issues (injuries, surgeries and illnesses), child care issues (finding appropriate child care, attending children’s sports events and performances, and planning grown children’s weddings) and elder care issues (tending to elderly parents and dealing with the loss of a parent). Such family-related events, whether positive or negative, affect a teacher’s ability to manage work-related stressors. Work and home are inseparable.
Leithwood (2006) argues that leaders and stakeholders must attend to the internal states of teachers. Naylor and White (2010) go further, arguing that the difficulties that teachers experience in attempting to find a work–life balance should concern not only unions but society at large. Duxbury and Higgins (2013) concur, noting that, left unaddressed, these issues have human and economic costs that affect not only students and teachers but also families, employers, health-care systems and taxpayers in general.
Sahlberg (2011), who has studied schools around the world (including Alberta), concludes that high-performing jurisdictions share three characteristics:
1. They have internal conditions of practice that respect the professional intuition of teachers, allowing them to build the knowledge and skills they need to craft the best learning environments for their students.
2. They exist in communities that have the social capital necessary to provide encouraging and supportive conditions for students.
3. They encourage teachers to engage in reflective practice and to undertake research to improve student learning.
Hargreaves and Fullan (2012, 7) observe that, to foster cultures of creativity and ingenuity, jurisdictions need to build the professional capital of their teachers. The authors argue that educational transformation cannot happen unless teachers have the support to undertake ongoing school-based research that pushes the limits of sound teaching practice, curriculum design and school development.
This study suggests that the last few years in Alberta have been a time of great promise for teachers but, as one participant put it, also “a roller-coaster ride of frustration and anticipation.” Despite the stability offered by the 2007 five-year labour agreement with the Government of Alberta, teachers in Alberta face growing demands, increasingly complex classroom settings, declining resources and eroding professional autonomy. In 2013, 92 per cent of Alberta teachers reported being very committed to teaching as a profession, and 89 per cent said they felt proud to be teachers. At the same time, only 60 per cent reported feeling able to teach in the way that they aspired to teach. Why is this? Over half of Alberta teachers do not have access to professional development during the school day, and almost one-third do not control their own professional development. In terms of teaching and learning conditions, 57 per cent of teachers indicate that support for students with specials needs has declined compared with what was available one year earlier, while only 10 per cent say support has increased. Although technology is often marketed as a support for teachers, teachers report that the single greatest source of increased workload is the time they spend collecting and reporting student progress, often

Reflections on Teaching: Teacher Efficacy and the Professional Capital of Alberta Teachers • 57
using digital reporting software that is cumbersome and adds little value.3
These working realities are symptomatic of what Hargreaves and Fullan (2012) call the “attenuated business capital approach to school reform,” an approach that focuses on immediate gains or profitability, market-based solutions and an emphasis on using technology to achieve quick fixes. An alternative approach to school reform, according to the authors, is to focus on developing the professional capital of teachers in three domains: human, social and decisional. Human capital has to do with building the individual talents and qualities that teachers possess as they embark on their teaching careers. Social capital concerns the conditions of practice that teachers encounter, including the opportunity to work with colleagues in communities of practice. Decisional capital is the capacity to make informed professional
judgments that focus on improving student learning. All three forms of capital contribute to professional capital, which, in turn, helps teachers to cope with the ambiguity, uncertainty and complexity that they encounter in the course of a school year. In a forthcoming book entitled Schools Performing Beyond Expectations, Hargreaves and Harris (2014) examine the ways in which 18 high-performing organizations and systems (including schools) in five countries achieved and sustained excellence. They conclude that the key to success is to build optimal conditions of practice that build professional capital. The study emphasizes that, rather than focusing on short-term gains, schools must sustain the complex ecosystems that characterize high-performing organizations. The authors go on to identify five common fallacies concerning leadership and change practices: speed, substitution, numbers, standardization and competition.
3The statistics reported in this paragraph are from the 2013 ATA Member Opinion Survey.

58 • Reflections on Teaching: Teacher Efficacy and the Professional Capital of Alberta Teachers

Reflections on Teaching: Teacher Efficacy and the Professional Capital of Alberta Teachers • 59
Life can only be understood backwards; but it must be lived forwards.—Soren Kierkegaard
In the closing chapter of Professional Capital, Hargreaves and Fullan (2012, 147) point out that, if they want to become what they aspire to be, teachers themselves must enact the changes needed. One way that teachers can assess the changes they need to make is by engaging in the year-end reflection activity described in this study. The ATA plans to produce a toolkit to help teachers undertake this activity.
This study builds upon other studies that explore the highs and lows that teachers experience in both their professional and personal lives. Most of these studies focus on the external aspects of teachers’ work and on the classroom environment. One exception is Leithwood (2006), who explored the internal states that teachers experience in their professional lives. Some people may argue that school systems, associations, unions and governments play a small role in shaping the internal factors that teachers experience. Does a school principal, for example, really influence how a teacher copes with such family responsibilities as child care and elder care? Yet Hargreaves and Harris (2014) argue that, to perform beyond expectations for their students, themselves and their colleagues, teachers need ongoing support from school leaders. This study suggests that teachers who receive support during challenging personal times often soar to new heights that they never thought possible. The support may be as simple as giving teachers access to exercise facilities, time for reflection, work-free breaks in which to recharge and time embedded in the school day to prepare and to collaborate with colleagues (Hargreaves and Fullan 2012, 127–36).
The current study supports Dibbon’s (2004) conclusion that teachers spend a great deal of time after hours preparing lessons and marking student assignments, time that the general
public and even some administrators may be unaware of. The current study also supports Dibbon’s recommendations for improving this situation:
• Increase preparation time to a minimum of 180 minutes per week. Lack of preparation time was a concern to more than 50 per cent of teachers in the current study.
• Ensure that schools provide teachers with discretionary leave days to be used during the school year and the flexibility to use them during reporting periods. Leave days would help teachers better manage their personal and family responsibilities. The current study, however, suggests that many teachers would not take this option because they would feel guilty about leaving their students.
• Monitor class composition and reduce class size accordingly. Although only a few teachers in the current study mentioned class size and composition, those who did consider it a significant issue.
• Allot time for teachers to reflect, plan and collaborate with colleagues during the regular school day and pay attention to key pinch-points during the school calendar. Teachers in the current study indicated that the opportunity to collaborate with colleagues boosted their sense of efficacy and well-being during even the most challenging times of the year (September, December, February, March and June).
• Experiment with and redesign teacher workloads and the manner in which schools are organized and managed so that teachers have time for personal growth. The current study found that full-time teachers struggle the most with workload and, ironically, have the least time for collaboration.
The current study also supports a number of recommendations made by the taskforce studying the working conditions of teachers in Manitoba (MTS 2007):
• Negotiate minutes of preparation time into collective agreements. Teachers in Alberta
Implications and Next Steps
60 • Reflections on Teaching: Teacher Efficacy and the Professional Capital of Alberta Teachers
currently work the equivalent of two 8-hour days outside the regular 40-hour workweek.
• Negotiate into collective agreements a clause to the effect that participation in extracurricular activities is voluntary. Many participants in the current study indicated that they were pressured by their peers and supervisors to take on extracurricular activities despite having children and elders to look after at home.
• Ensure adequate embedded time for reporting student progress. Reporting on student progress should be viewed not so much as an event (issuing a report card or holding an interview with parents) as an ongoing relationship that teachers nurture with students and parents.
During periods of education reform, teachers often end up trying to implement innovations that other people have suggested while, at the same time, continuing to do their best for their students and for their own families. This study suggests that teachers, though innovative and willing to alter their professional practices, are ultimately constrained by a system that continues to operate according to outdated approaches with respect to such matters as testing, scheduling, reporting and budgeting.
The study also suggests that, while certain points in the year—report card time, the period leading up to Christmas concerts and end of term—are particularly stressful, most teachers run from one smouldering brush fire to another all year long.
The stressors identified in this study affect the physical, emotional and psychological well-being of teachers. They include such devastating life events as teen suicide, the death of a family member, car accidents, divorces and natural disasters. Teachers counsel students through personal crises and support others who are being placed into protective custody or correctional facilities. Many teachers experience job insecurity as the result of government cutbacks. Like other members of society, teachers live in a world that is becoming increasingly volatile, ambiguous, complex and uncertain (ATA 2014).
Despite these daily challenges, teachers try to stay organized, positive and healthy for their students. How long will it be before teachers can no longer manage those roles? Duxbury and Higgins (2013, 17) found that teachers in Alberta are experiencing a high level of role overload that interferes with their ability to meet their family obligations. Unable to achieve a work–life balance, many teachers burn out, go on leave or abandon the profession altogether.
The current study suggests that the teachers most at risk are those relatively new to the profession. That beginning teachers seldom receive the kind of support they need was confirmed by a study that the ATA undertook in 2008. Researchers in this study (ATA 2013) followed a cohort of beginning teachers over a five-year period to determine the factors that cause some of them to leave the profession and to identify induction practices that might help new teachers become long-term professional educators. The study revealed that the enthusiasm and excitement that most new teachers bring to the job quickly turns, because of a lack of support from colleagues and administrators, to self-doubt, distress and exhaustion.
Teachers face a range of challenges—finite time, personal health, fluctuating support from colleagues, increasingly diverse classrooms, funding cutbacks and technical change—that diminish the passion and commitment that they are able to bring to the job. Based on the results of this study, here are some measures that administrators and school boards can take to help teachers become the best that they can be for themselves and their students:
• Reschedule assignments to ensure that teachers have a more manageable workload. Possibilities include reworking the school calendar to include more breaks and developing schedules that allow teachers to work as a team in delivering courses.
• Provide teachers with time for self-reflection so that they can gain a deeper understanding of the factors that affect their professional efficacy and personal well-being.
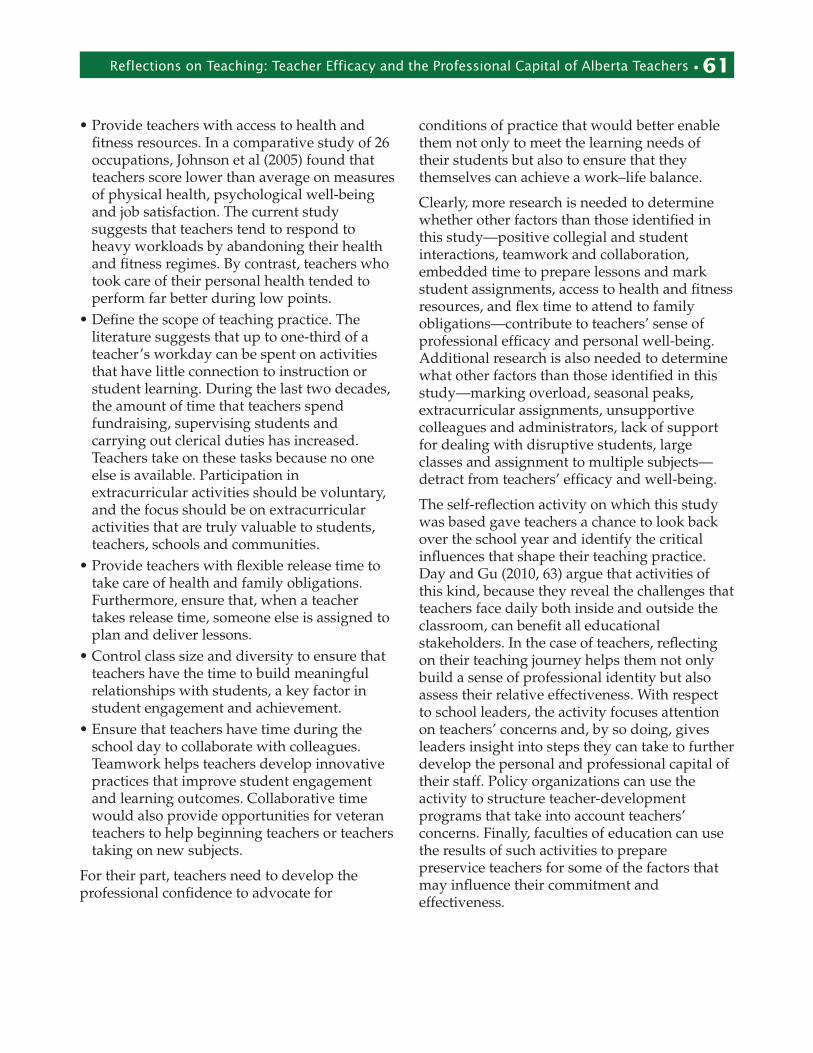
Reflections on Teaching: Teacher Efficacy and the Professional Capital of Alberta Teachers • 61
• Provide teachers with access to health and fitness resources. In a comparative study of 26 occupations, Johnson et al (2005) found that teachers score lower than average on measures of physical health, psychological well-being and job satisfaction. The current study suggests that teachers tend to respond to heavy workloads by abandoning their health and fitness regimes. By contrast, teachers who took care of their personal health tended to perform far better during low points.
• Define the scope of teaching practice. The literature suggests that up to one-third of a teacher’s workday can be spent on activities that have little connection to instruction or student learning. During the last two decades, the amount of time that teachers spend fundraising, supervising students and carrying out clerical duties has increased. Teachers take on these tasks because no one else is available. Participation in extracurricular activities should be voluntary, and the focus should be on extracurricular activities that are truly valuable to students, teachers, schools and communities.
• Provide teachers with flexible release time to take care of health and family obligations. Furthermore, ensure that, when a teacher takes release time, someone else is assigned to plan and deliver lessons.
• Control class size and diversity to ensure that teachers have the time to build meaningful relationships with students, a key factor in student engagement and achievement.
• Ensure that teachers have time during the school day to collaborate with colleagues. Teamwork helps teachers develop innovative practices that improve student engagement and learning outcomes. Collaborative time would also provide opportunities for veteran teachers to help beginning teachers or teachers taking on new subjects.
For their part, teachers need to develop the professional confidence to advocate for
conditions of practice that would better enable them not only to meet the learning needs of their students but also to ensure that they themselves can achieve a work–life balance.
Clearly, more research is needed to determine whether other factors than those identified in this study—positive collegial and student interactions, teamwork and collaboration, embedded time to prepare lessons and mark student assignments, access to health and fitness resources, and flex time to attend to family obligations—contribute to teachers’ sense of professional efficacy and personal well-being. Additional research is also needed to determine what other factors than those identified in this study—marking overload, seasonal peaks, extracurricular assignments, unsupportive colleagues and administrators, lack of support for dealing with disruptive students, large classes and assignment to multiple subjects—detract from teachers’ efficacy and well-being.
The self-reflection activity on which this study was based gave teachers a chance to look back over the school year and identify the critical influences that shape their teaching practice. Day and Gu (2010, 63) argue that activities of this kind, because they reveal the challenges that teachers face daily both inside and outside the classroom, can benefit all educational stakeholders. In the case of teachers, reflecting on their teaching journey helps them not only build a sense of professional identity but also assess their relative effectiveness. With respect to school leaders, the activity focuses attention on teachers’ concerns and, by so doing, gives leaders insight into steps they can take to further develop the personal and professional capital of their staff. Policy organizations can use the activity to structure teacher-development programs that take into account teachers’ concerns. Finally, faculties of education can use the results of such activities to prepare preservice teachers for some of the factors that may influence their commitment and effectiveness.

62 • Reflections on Teaching: Teacher Efficacy and the Professional Capital of Alberta Teachers

Reflections on Teaching: Teacher Efficacy and the Professional Capital of Alberta Teachers • 63
Alberta Education. 2009. Setting the Direction for Special Education. Edmonton, Alta: Alberta Education. http://education.alberta.ca/teachers/resources/connection/archive/january-2010/specialed/set.aspx (accessed April 3, 2014).
——. 2010. Inspiring Education: A Dialogue with Albertans. Edmonton, Alta: Alberta Education. www.inspiringeducation.alberta.ca (accessed April 3, 2014).
Alberta’s Commission on Learning. 2003. Every Child Learns, Every Child Succeeds. Edmonton, Alta: Alberta Education.
Alberta Teachers’ Association (ATA). 2002a. Cracks in the Foundation: Why We Heard What We Heard. Edmonton, Alta: ATA.
——. 2002b. Falling Through the Cracks: A Summary of What We Heard About Teaching and Learning Conditions in Alberta Schools. Edmonton, Alta: ATA.
——. 2009a. Looking Forward: Emerging Trends and Strategic Possibilities for Enhancing Teaching and Learning in Alberta Schools 2009–2012. Edmonton, Alta: ATA.
——. 2009b. Real Learning First. Edmonton, Alta: ATA.
——. 2009c. Success for All. Edmonton, Alta: ATA.
——. 2011. The Future of Teaching in Alberta. Edmonton, Alta: ATA.
——. 2012a. A Great School for All: Transforming Education in Alberta. Edmonton, Alta: ATA.
——. 2012b. At Our Best for Students. Edmonton, Alta: ATA.
——. 2012c. The New Work of Teaching: A Case Study of the Worklife of Calgary Public Teachers. Edmonton, Alta: ATA.
——. 2013. Teaching in the Early Years of Practice: A Five-Year Longitudinal Study. Edmonton, Alta: ATA.
——. 2014. Changing Landscapes: Alberta 2015–2035. Edmonton, Alta: ATA.
Calgary Public Teachers. 2010. Leading Our Future Together: Necessary Conditions for Shared Leadership in Calgary Public Schools. Calgary, Alta: Calgary Public Teachers.
Day, C, and Q Gu. 2010. The New Lives of Teachers. New York: Routledge.
Dibbon, D. 2004. It’s About Time! A Report on the Impact of Workload on Teachers and Students. St John’s, Nfld: Memorial University of Newfoundland.
Duxbury, L, and C Higgins. 2013. The 2011/12 National Study on Balancing Work, Life and Care Giving: The Situation for Alberta Teachers. Edmonton, Alta: ATA. Available at http://tinyurl.com/ky4vgyj (accessed April 2, 2014).
Dyck-Hacault, G, and R Alarie. 2010. Teacher Workload: Manitoba Teachers’ Society Task Force on Teacher Workload Final Report. Winnipeg, Man: Manitoba Teachers’ Society.
Freiler, C, S Hurley, R Canuel, B McGahey, B Froese-Germain and R Riel. 2012. Teaching the Way We Aspire to Teach: Now and in the Future. Toronto: The Canadian Education Association and the Canadian Teachers’ Federation.
Government of Alberta. nd. Alberta’s Fiscal Challenge. Available at http://alberta.ca/fiscal-challenge.cfm (accessed April 2, 2014).
Hargreaves, A. 1994. Changing Teachers, Changing Times: Teachers’ Work and Culture in the Postmodern Age. New York: Teachers College Press.
Hargreaves, A, and M Fullan. 2012. Professional Capital: Transforming Teaching in Every School. New York: Teachers College Press.
Hargreaves, A, and A Harris. 2014 (in press). Schools Performing Beyond Expectations. New York: Routledge.
References

64 • Reflections on Teaching: Teacher Efficacy and the Professional Capital of Alberta Teachers
Hargreaves, A, and D Shirley. 2009. The Fourth Way: The Inspiring Future for Educational Change. Thousand Oaks, Calif: Corwin.
James Matsui Research. 2006. OECTA Workload Study: Executive Summary. Toronto: Ontario English Catholic Teachers’ Association.
Johnson, S, C Cooper, S Cartwright, I Donald, P Taylor and C Millet. 2005. “The Experience of Work-Related Stress Across Occupations.” Journal of Managerial Psychology 20, no 2: 178–87.
Kamanzi, P C, M-C Riopel and C Lessard. 2007. School Teachers in Canada: Context, Profile and Work. Highlights of a Pan-Canadian Survey. University of Montreal.
Leithwood, K. 2006. Teacher Working Conditions That Matter: Evidence for Change. Toronto: Elementary Teachers’ Federation of Ontario.
MacDonald, R J, S Wiebe, K Goslin, R Doiron and C MacDonald. 2010. The Workload and Worklife of Prince Edward Island Teachers. Charlottetown, PEI: Prince Edward Island Teachers’ Federation.
Manitoba Teachers’ Society (MTS). 2007. “Average Teacher Works More Hours Than
Other Public Servants.” Teacher Online. Winnipeg, Man: MTS.
Naylor, C, and M White. 2010. The Worklife of BC Teachers in 2009: A BCTF Study of Working and Learning Conditions. Vancouver: British Columbia Teachers’ Federation.
Pickering, C. 2008. “Challenges in the Classroom and Teacher Stress.” Health and Learning Magazine 6: 22–27.
Sahlberg, P. 2011. Finnish Lessons: What Can the World Learn from Educational Change in Finland? New York: Teachers College Press.
Smaller, H, P Tarc, F Antonelli, R Clark, D Hart and D Livingstone. 2005. Canadian Teachers’ Learning Practices and Workload Issues: Results from a National Teacher Survey and Follow-Up Focus Groups. New Approaches to Life-Long Learning Research Network and the Canadian Teachers’ Federation. www.wallnetwork.ca/resources/Smaller_Clark_Teachers_Survey_Jun2005.pdf (accessed April 3, 2014).
Younghusband, L J. 2005. “High School Teachers’ Perceptions of Their Working Environment in Newfoundland: A Grounded Theory Study.” PhD diss, Memorial University of Newfoundland and Labrador.

Reflections on Teaching: Teacher Efficacy and the Professional Capital of Alberta Teachers • 65
Many factors influence your sense of effectiveness as a teacher and your ability to achieve a work–life balance. This activity invites you to look back over the last school year and assess the key influences on your work. Be assured that all responses will be kept confidential.
The line chart is a tool designed to help you reflect on the influences that shape your work as a teacher. This tool was developed by Christopher Day and Qing Gu in The New Lives of Teachers, a comprehensive study of the varied demands that teachers face in their daily work. Day and Gu explored the complex ways that teachers negotiate the opportunities and challenges of their professional and personal lives.
Activity I: My Effectiveness and Impact as a Teacher
Looking back over the past school year, what were the high and low points that you experienced in terms of your effectiveness and impact on student learning? The line chart below will help you to share your reflections on the past school year. The vertical axis, representing effectiveness, is a 10-point scale in which 10 represents most effective and 0 represents least effective. The horizontal axis represents the months of the school calendar. Use the chart to draw a line graph that illustrates the relative high and low points that you experienced during the last year in terms of your sense of effectiveness and your impact on student learning. Consider the midpoint line 5 to represent your typical level of effectiveness over the school year.
Appendix A—School Year Reflection: My Work Life and Effectiveness as a Teacher
M
y E
ffec
tive
nes
s as
a T
each
er
10
9
8
7
6
5This line marks the level at which you typically find your teaching practice. The area above represents occasions when you were highly effective and taught the way you aspired to teach. The area below represents occasions when you experienced difficulty or were unable to meet your own expectations.
4
3
2
1
0
September—October—November—December—January—February—March—April—May—June
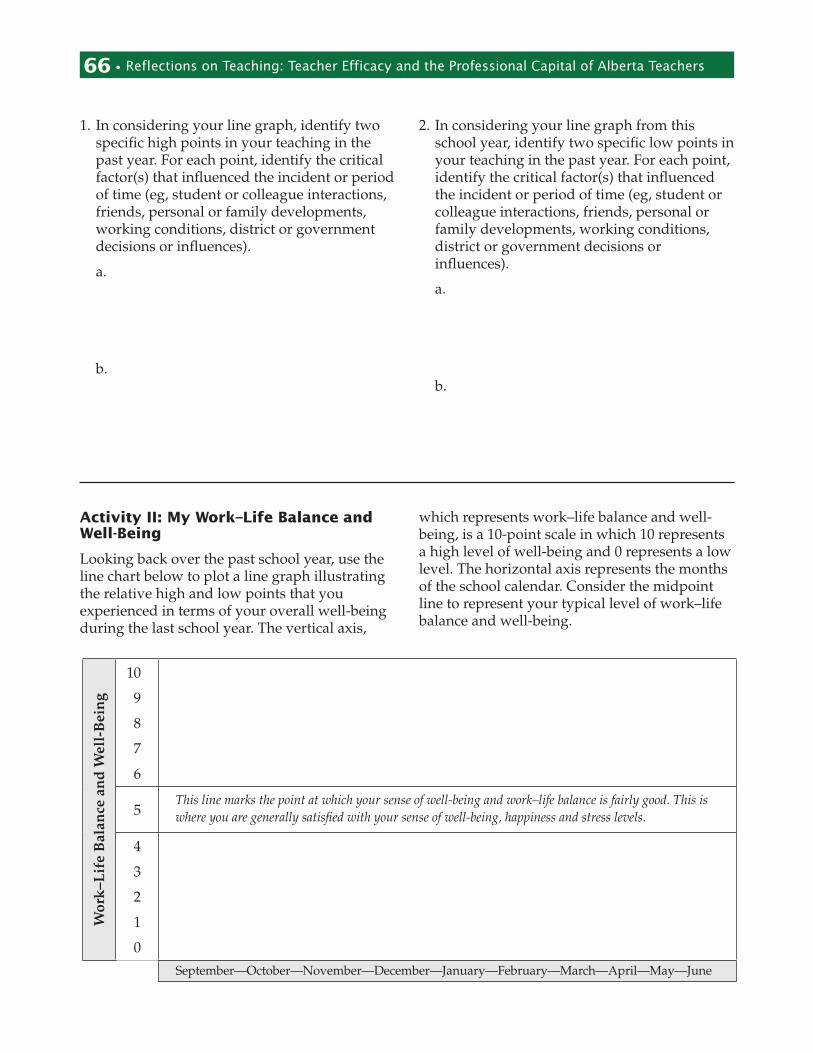
66 • Reflections on Teaching: Teacher Efficacy and the Professional Capital of Alberta Teachers
1. In considering your line graph, identify two specific high points in your teaching in the past year. For each point, identify the critical factor(s) that influenced the incident or period of time (eg, student or colleague interactions, friends, personal or family developments, working conditions, district or government decisions or influences).
a.
b.
2. In considering your line graph from this school year, identify two specific low points in your teaching in the past year. For each point, identify the critical factor(s) that influenced the incident or period of time (eg, student or colleague interactions, friends, personal or family developments, working conditions, district or government decisions or influences).
a.
b.
Activity II: My Work–Life Balance and Well-Being
Looking back over the past school year, use the line chart below to plot a line graph illustrating the relative high and low points that you experienced in terms of your overall well-being during the last school year. The vertical axis,
which represents work–life balance and well-being, is a 10-point scale in which 10 represents a high level of well-being and 0 represents a low level. The horizontal axis represents the months of the school calendar. Consider the midpoint line to represent your typical level of work–life balance and well-being.
W
ork
–Lif
e B
alan
ce a
nd
Wel
l-B
ein
g
10
9
8
7
6
5This line marks the point at which your sense of well-being and work–life balance is fairly good. This is where you are generally satisfied with your sense of well-being, happiness and stress levels.
4
3
2
1
0
September—October—November—December—January—February—March—April—May—June

Reflections on Teaching: Teacher Efficacy and the Professional Capital of Alberta Teachers • 67
1. Considering your chart, choose two of the high points in terms of your well-being this past year and briefly describe why you saw them that way. For each point, identify the critical factor(s) that influenced the incident or period of time (eg, student or colleague interactions, friends, personal or family developments, working conditions, district or government decisions or influences).
a.
b.
2. Considering your chart, choose two of the low points in terms of your well-being this past year and briefly describe why you saw them that way. For each point, identify the critical factor(s) that influenced the incident or period of time (eg, student or colleague interactions, friends, personal or family developments, working conditions, district or government decisions or influences).
a.
b.
Activity III: My Effectiveness and Work–Life Balance
Compare the line graph depicting your effectiveness that you drew in Activity I with the line graph depicting your work–life balance that you drew in Activity II.
1. Identify similarities and differences between the two graphs. What might explain these?
2. Based on your reflections about your overall effectiveness this past year and your work–life balance, what were the three most important influences? For example, consider students and colleague interactions, friends,
personal or family factors, working conditions, and district or government decisions or influences.
a.
b.
c.
Thank you. Please return your booklet to the session facilitator. All responses will be kept confidential.

68 • Reflections on Teaching: Teacher Efficacy and the Professional Capital of Alberta Teachers
Reflections on Teaching: Teacher Efficacy and the Professional Capital of Alberta Teachers • 69
Appendix B—Facilitator’s Guide
This process plan is designed for school staffs of any size. Ideally, teachers should be seated at tables of five or six. The session will take approximately 1.5 hours.
Introduction (10 minutes)
The principal or facilitator for the session will do the following:
• Welcome participants and thank them for taking part in the activity, which will give them a chance to reflect on their school year.
• Reassure participants that all responses will be kept confidential.
• Explain that, in addition to encouraging reflection, the tool may help them plan for future years and activities.
• Note that the tool being used was adapted from one that Christopher Day and Qing Gu developed in conjunction with their study The New Lives of Teachers.
• Explain that the session has three goals: 1. To identify the various demands that
teachers face each day and to help them determine whether these demands follow a pattern.
2. To explore the ways that teachers negotiate the challenges and opportunities posed by their professional and personal lives.
3. To explore how the decisions made by teachers, schools, school districts and the government affect the identity, well-being and effectiveness of teachers.
• Provide a three- to five-minute overview of the session, noting that the activity invites participants to look back over their school year and assess the key influences on their work.
• Note that handouts for each participant are available at the tables.
• Explain that the process involves three rounds of reflection, recording and follow-up discussion with partners at the tables.
• To ensure that participants know one another, ask each participant to share an interesting moment in his or her semester.
• Ask if there are any preliminary questions or concerns about the agenda or the plan for the session.
Activity I: My Effectiveness and Impact as a Teacher (20 to 30 minutes)
Ask participants to take a handout and to turn to the first page. Explain that the vertical axis on the chart is a scale that participants can use to assess their effectiveness. The scale ranges from 0 (least effective) to 10 (most effective). Ask participants to consider the midpoint line 5 as the level of effectiveness at which they typically work. The horizontal axis represents the months of the school year.
• Ask participants to think about high points when they felt that they had been highly effective and had a positive impact on student learning.
• Ask participants to think about low points when they felt they had not been effective.
• Ask the participants to chart their high and low points on the line chart provided. Remind them again to treat 5 as the level of efficacy at which they normally operate.
• Ask each participant to choose a partner at the table and to share their charts. Encourage them to discuss their high and low points.
• Invite participants to turn to the page following the chart.
• Explain that the questions on this page are intended to help participants identify the factors that influenced both their high and low points throughout the year.
• Explain that, in Question 1, participants will be asked to choose two high points from their line charts and to identify the critical influence(s) associated with each high point.

70 • Reflections on Teaching: Teacher Efficacy and the Professional Capital of Alberta Teachers
• Explain that, in Question 2, participants will be asked to choose two low points from their charts and to identify the critical influence(s) associated with each low point.
• If necessary, provide some broad suggestions concerning factors (eg, student or colleague interactions, working conditions, schedules) but avoid influencing how participants analyze factors.
• Explain that the answers that participants give in response to Questions 1 and 2 are not intended to be shared.
Activity II: My Work–Life Balance and Well-Being (20 minutes)
The principal or facilitator will do the following:
• Call the group back together and thank them for the work they have completed so far.
• Explain that participants will now complete an identical process but that, this time, they will chart the highs and lows that they experienced with respect to their overall sense of personal well-being. Remind participants to treat the midpoint line 5 as representing what they consider their normal level of overall wellness, work–life balance and happiness.
• Ask participants, once they have drawn the charts depicting their high and low points, to work in groups of three to share their high points. (Depending on the group, the facilitator may also invite participants to share their lows, an activity that may be too sensitive for some participants.)
• Invite participants to turn to the next page and, working alone, to answer Question 1, which invites them to select two high points from the line chart depicting their work–life balance and well-being and then to identify the critical influence(s) associated with each high point.
• Ask participants to answer Question 2, which invites them to select two low points and to identify the critical influence(s) associated with each low point.
Activity III: My Effectiveness and Work–Life Balance (15 minutes)
The principal or facilitator will do the following:
• Invite two or three groups to share highlights from their discussion or to identify common themes that emerged.
• Explain that participants will now be asked to reflect on their overall effectiveness as a teacher and on their ability to achieve a work–life balance.
• Invite two or three participants to share similarities and/or differences that they noted between their two graphs.
• Ask participants, working alone, to identify similarities and differences between the charts that they drew in Activities I and II and to offer an explanation for these similarities and differences.
• Ask participants to record what they consider the three factors that had the most influence on their professional effectiveness and personal well-being.
Closing (5 to 10 minutes)
The principal or facilitator will do the following:
• Provide a timeline for when the analysis will be completed and when the findings will be shared with staff in the school.
• Collect the handouts.• Invite participants to make any closing
observations.• Thank participants and adjourn the session.


ISBN 978-1-927074-21-3
PD-86-27 2014 04
This publication is part of an ongoing series of research updates published by the Alberta Teachers’ Association. Further background information about the research studies cited in this publication is available from J-C Couture at the Alberta Teachers’ Association, 11010 142 Street, Edmonton, AB T5N 2R1; phone 780-447-9400 (in Edmonton) or 1-800-232-7208 (toll free in Alberta); e-mail [email protected].