airasia berhad analyst presentation -4q2011 and fye 2011 · 4q11 results 4q11 results...
TRANSCRIPT

AirAsia Berhad Analyst Presentation
- 4Q2011 and FYE 2011 -

Disclaimer
Information contained in our presentation is intended solely for your reference.Such information is subject to change without notice, its accuracy is notguaranteed and it may not contain all material information concerning theCompany. Neither we nor our advisors make any representation regarding, andassumes no responsibility or liability for, the accuracy or completeness of, or anyerrors or omissions in, any information contained herein.
In addition, the information may contain projections and forward-lookingstatements that reflect the company’s current views with respect to futurestatements that reflect the company’s current views with respect to futureevents and financial performance. These views are based on currentassumptions which are subject to various risks factors and which may changeover time. No assurance can be given that future events will occur, thatprojections will be achieved, or that the company’s assumptions are correct.Actual results may differ materially from those projected.
This presentation can be distributed without any consent of the Company asthis is a publicly available announcement.

2011 HighlightsHighlights

2011 Results 2011 Results 2011 Results 2011 Results –––– Key SnapshotKey SnapshotKey SnapshotKey Snapshot� Disciplined Cost Management excluding fuelDisciplined Cost Management excluding fuelDisciplined Cost Management excluding fuelDisciplined Cost Management excluding fuel
� Malaysia - CASK, ex-fuel (sen) down 13% from 6.86 to 5.99 y-o-y
� Thailand - CASK, ex-fuel (THB) up 1% from 0.81 to 0.82 y-o-y
� Indonesia - CASK, ex-fuel (IDR) up 1% from 211.59 to 212.52
� Revenue growth in all three operationsRevenue growth in all three operationsRevenue growth in all three operationsRevenue growth in all three operations
� Malaysia - RM 4.47 billion up 13% y-o-y
� Thailand - THB 15.87 billion up 33% y-o-y
� Indonesia - IDR 3,705 billion up 34% y-o-y
� Core net income Core net income Core net income Core net income performance for performance for performance for performance for the groupthe groupthe groupthe group
� Malaysia - RM 880.78 million up 18% y-o-y
� Thailand - THB 1,908.69 milion up 14% y-o-y
4
� Thailand - THB 1,908.69 milion up 14% y-o-y
� Indonesia - IDR 94,905 million down 61% y-o-y
� Strong Operating Profit performanceStrong Operating Profit performanceStrong Operating Profit performanceStrong Operating Profit performance
� Malaysia - RM 1,199 million up 12% y-o-y
� Thailand - THB 1,943 million up 5% y-o-y
� Indonesia - IDR 149.654 million down 52% y-o-y
� Healthy cash balanceHealthy cash balanceHealthy cash balanceHealthy cash balance
� Malaysia - RM 2,020 million (up 34% y-oy)
� Thailand - THB 1,211 million (up 105% y-o-y)� Indonesia - IDR 136,191 million (down 20% y-o-y)
� Ancillary income per Ancillary income per Ancillary income per Ancillary income per paxpaxpaxpax in all three operations upin all three operations upin all three operations upin all three operations up
� Malaysia - RM 45 up 2% y-o-y
� Thailand - THB 383 up 29% y-o-y
� Indonesia - IDR 136,650 up 11% y-o-y
4

4Q11 Results 4Q11 Results 4Q11 Results 4Q11 Results –––– Key SnapshotKey SnapshotKey SnapshotKey Snapshot
� Disciplined Cost Management excluding fuelDisciplined Cost Management excluding fuelDisciplined Cost Management excluding fuelDisciplined Cost Management excluding fuel
� Malaysia - CASK, ex-fuel (sen) down 34% from 6.82 to 4.53 y-o-y
� Thailand - CASK, ex-fuel (THB) up 5% from 0.77 to 0.81 y-o-y
� Indonesia - CASK, ex-fuel (IDR) down 19% from 262.30 to 211.97
� Revenue growth in all three operationsRevenue growth in all three operationsRevenue growth in all three operationsRevenue growth in all three operations
� Malaysia - RM 1.27 billion up 9% y-o-y
� Thailand - THB 4.31 billion up 23% y-o-y
� Indonesia - IDR 966 billion up 28% y-o-y
� Strong Operating Profit performanceStrong Operating Profit performanceStrong Operating Profit performanceStrong Operating Profit performance
5
� Strong Operating Profit performanceStrong Operating Profit performanceStrong Operating Profit performanceStrong Operating Profit performance
� Malaysia - RM 491 million up 13% y-o-y
� Thailand - THB 587 million down 34% y-o-y
� Indonesia - IDR 78,650 million up 218% y-o-y
� Core net income performanceCore net income performanceCore net income performanceCore net income performance
� Malaysia - RM 410 million up 18% y-o-y
� Thailand - THB 589 million down 30% y-o-y
� Indonesia - IDR 59,606 million up 188% y-o-y
� Ancillary income per Ancillary income per Ancillary income per Ancillary income per paxpaxpaxpax in all three operations upin all three operations upin all three operations upin all three operations up
� Malaysia - RM 40 down 19% y-o-y
� Thailand - THB 376 up 38% y-o-y
� Indonesia - IDR 134,978 down 10% y-o-y
5

Key points Key points Key points Key points –––– Setting the stage for 2012Setting the stage for 2012Setting the stage for 2012Setting the stage for 2012
� Associates turned around and recording profit plus strong growthAssociates turned around and recording profit plus strong growthAssociates turned around and recording profit plus strong growthAssociates turned around and recording profit plus strong growth
---- Amount due from associate reduced to RM 230 million
� Proposed IPO Proposed IPO Proposed IPO Proposed IPO
- Future aircraft on balance sheet
- Own balance for future growth
� 2 sources of ancillary income2 sources of ancillary income2 sources of ancillary income2 sources of ancillary income
- Core ancillary income (i.e. Baggage, Cargo, In-flight meals, duty free)
- Non-core ancillary via joint venture (i.e. AirAsia Expedia, AirAsia BIG Loyalty, AirAsia CAE, i-Ventures (monetising database))
� Fleet for the next 30 yearsFleet for the next 30 yearsFleet for the next 30 yearsFleet for the next 30 years
66
� Fleet for the next 30 yearsFleet for the next 30 yearsFleet for the next 30 yearsFleet for the next 30 years
- New Airbus orders of 200 A320 Neo on top of existing order of 175 A320 Classics
- Indonesia returned the remaining B737s and now operating fully Airbus fleet
� Strong balance sheetStrong balance sheetStrong balance sheetStrong balance sheet
- Cash balance growing to RM2.02 billion despite tough economic environment
- Net gearing reducing to 1.43 times from 1.74 times y-o-y
� Maintaining marginsMaintaining marginsMaintaining marginsMaintaining margins
- AirAsia’s robust model via ancillary and higher load factor able to maintain margins
� New joint ventures come to lifeNew joint ventures come to lifeNew joint ventures come to lifeNew joint ventures come to life
- AirAsia Japan and AirAsia Philippines received the AOCs to begin operations
� AirAsiaAirAsiaAirAsiaAirAsia AseanAseanAseanAsean officeofficeofficeoffice
- Regionalisation of the AirAsia Group to maximise sales

Joint Ventures Update and growth upsideJoint Ventures Update and growth upsideJoint Ventures Update and growth upsideJoint Ventures Update and growth upside
Joint venturesJoint venturesJoint venturesJoint ventures DetailsDetailsDetailsDetails
AirAsia Philippines � Received AOC early February 2012� Target launch in March 2012� To operate out of Clark � Focusing on the regional travel and riding on AirAsia Group extensive network
AirAsia Japan � Received AOC early February 2012� Target launch earliest August 2012� To operate out of Narita� To operate the underpenetrated LCC market in Japan
7
� To operate the underpenetrated LCC market in Japan
AirAsia Go/Expedia � Launched in July 2011� Currently operating is Expedia Japan, India, Singapore, Korea, Malaysia
� To merge inventories of hotel of AirAsiaGo and Expedia� To reinvest profits for expansion
BIG (Loyalty programme) � Launched in October 2011� 110,000 members signed up� Indonesia launched and Thailand will be launched in Feb 2012
AirAsia/CAE � Fully operational� All pilots training has been moved under the joint venture� Plans to acquire three more flight simulators
7

Fleet StrategyFleet StrategyFleet StrategyFleet Strategy
� Fleet rollout next 15 yearsFleet rollout next 15 yearsFleet rollout next 15 yearsFleet rollout next 15 years
20
1315
19 19
14
18 19 20 2123 24 24 24
9
0
5
10
15
20
25
302012
2013
2014
2015
2016
2017
2018
2019
2020
2021
2022
2023
2024
2025
2026
No of aircraft
No of aircraft
No of aircraft
No of aircraft
� Aircraft delivered in 4Q11 Aircraft delivered in 4Q11 Aircraft delivered in 4Q11 Aircraft delivered in 4Q11
- 2 aircraft on Sale and Leaseback - 1 for IAA & 1 for TAA
- 2 aircraft on Commercial financing – 2 for MAA
- 1 aircraft on Operating Lease for MAA
� Expected aircraft in 1Q12Expected aircraft in 1Q12Expected aircraft in 1Q12Expected aircraft in 1Q12
- 1 aircraft on Sale and Leaseback for TAA
- 1 aircraft on Commercial financing for PAA
- 1 aircraft on Operating Lease for TAA
� Aircraft delivery in 2012 Aircraft delivery in 2012 Aircraft delivery in 2012 Aircraft delivery in 2012 ---- 17 firm orders from Airbus orders & 3 from third party 17 firm orders from Airbus orders & 3 from third party 17 firm orders from Airbus orders & 3 from third party 17 firm orders from Airbus orders & 3 from third party lessorlessorlessorlessor
� To bring forward more aircraft to 2013 and 2014To bring forward more aircraft to 2013 and 2014To bring forward more aircraft to 2013 and 2014To bring forward more aircraft to 2013 and 2014
� Financing secured up to 2013Financing secured up to 2013Financing secured up to 2013Financing secured up to 2013 8
2012
2013
2014
2015
2016
2017
2018
2019
2020
2021
2022
2023
2024
2025
2026

Key success story Key success story Key success story Key success story –––– Efficient fleet managementEfficient fleet managementEfficient fleet managementEfficient fleet management
3.00
4.00
5.00
80
100
120
Net G
earin
gNet G
earin
gNet G
earin
gNet G
earin
g
Airbus Delivery
Airbus Delivery
Airbus Delivery
Airbus Delivery
Airbus Delivery Net gearing
New Capacity/New Capacity/New Capacity/New Capacity/CapexCapexCapexCapex vsvsvsvs Net Net Net Net GearingGearingGearingGearing
� AirAsia has seen aggressive capexrequirements for aircraft acquisitionto support high growth for the Group.
� Despite high capex, gearing levels
99
-1.00
0.00
1.00
2.00
0
20
40
60
2005* 2006* 2007* 2008 2009 2010 2011
Net G
earin
gNet G
earin
gNet G
earin
gNet G
earin
g
Airbus Delivery
Airbus Delivery
Airbus Delivery
Airbus Delivery � Despite high capex, gearing levels
has been reducing due to efficientfleet management exercise

4Q11 4Q11 4Q11 4Q11 –––– Net Gearing Net Gearing Net Gearing Net Gearing
5,800
6,000
6,200
6,400
6,600
6,800
7,000 Net Debt3.50
2.60 2.62 2.25 2.27
2.02 1.75
1.57 1.48 1.50 1.43
Net Gearing & Net DebtNet Gearing
� Gearing down to 1.43 times from 1.50 q-o-q
� Achieved free Cash flow positive in 2011 compared to 2010
� Cash up to RM2.4 billion including aircraft deposits
� Gearing to reduce in the future as associates look to finance own aircraft after the
respective IPO10
5,200
5,400
5,600
5,800
2Q2009 3Q2009 4Q2009 1Q2010 2Q2010 3Q2010 4Q2010 1Q2011 2Q2011 3Q2011 4Q2011

Hedging updatesHedging updatesHedging updatesHedging updates
� Fuel hedged up to 27% for 1H12 :Fuel hedged up to 27% for 1H12 :Fuel hedged up to 27% for 1H12 :Fuel hedged up to 27% for 1H12 :----
� Jet Kero @US$119.6/bbl
� Brent @US104.95/bbl
� Foreign currency hedged up to 67% with a weighted average of USD/RM3.2299 Foreign currency hedged up to 67% with a weighted average of USD/RM3.2299 Foreign currency hedged up to 67% with a weighted average of USD/RM3.2299 Foreign currency hedged up to 67% with a weighted average of USD/RM3.2299 (based on loans pertaining to aircraft being deployed to Malaysia)(based on loans pertaining to aircraft being deployed to Malaysia)(based on loans pertaining to aircraft being deployed to Malaysia)(based on loans pertaining to aircraft being deployed to Malaysia)
11
(based on loans pertaining to aircraft being deployed to Malaysia)(based on loans pertaining to aircraft being deployed to Malaysia)(based on loans pertaining to aircraft being deployed to Malaysia)(based on loans pertaining to aircraft being deployed to Malaysia)
� Interest rate expense fully hedged (12 years tenure) for 2012 ranging from 2.05% to Interest rate expense fully hedged (12 years tenure) for 2012 ranging from 2.05% to Interest rate expense fully hedged (12 years tenure) for 2012 ranging from 2.05% to Interest rate expense fully hedged (12 years tenure) for 2012 ranging from 2.05% to 2.40% and some hedged at 2.00% for 20132.40% and some hedged at 2.00% for 20132.40% and some hedged at 2.00% for 20132.40% and some hedged at 2.00% for 2013

Key success story Key success story Key success story Key success story –––– Robust modelRobust modelRobust modelRobust model
100
200
300
400
500
600
(RM'mil)
(RM'mil)
(RM'mil)
(RM'mil)
� Ability to absorb hike in fuel prices via:
o Ticket fares
o Ancillary revenues
o Fuel surcharge, which was imposed since May 2011
o Reduction in operating cost (ex-fuel) such as user charges & maintenance
� Operating profit up 12% YoY
� Sensitivity: Increase in US$1/barrel in fuel prices can be offsetted by ancillary income per pax increase by approximately RM0.77 and load factor increase by 0.4%
12
-
Increase in fuel expense
Increase in ticket sales
Increase in ancillary income
Fuel surcharge Reduction in cost (ex-fuel)

Key success story Key success story Key success story Key success story –––– Strong financials despite high fuel pricesStrong financials despite high fuel pricesStrong financials despite high fuel pricesStrong financials despite high fuel prices
-
200
400
600
800
1,000
1,200
1,400
-
20
40
60
80
100
120
140
Operatin
g Profit (R
M'mil)
Operatin
g Profit (R
M'mil)
Operatin
g Profit (R
M'mil)
Operatin
g Profit (R
M'mil)
Average fuel price (US$ /
Average fuel price (US$ /
Average fuel price (US$ /
Average fuel price (US$ /
Barrel)
Barrel)
Barrel)
Barrel)
Average fuel price (US$ / Barrel) Operating Profit (RM'mil)
Average fuel price Average fuel price Average fuel price Average fuel price vsvsvsvs Operating Operating Operating Operating profitprofitprofitprofit� Despite rise in average fuel
price, operating profit has postedgrowth to show the strong AirAsiamodel
� EBIT margins sustained last threeyears:-
- 2011 – 27%
- 2010 – 27%
CAGR: 15%
CAGR: 36%
1313
--
2009 2010 2011
- 2010 – 27%
- 2009 – 29%
Average fuel price Average fuel price Average fuel price Average fuel price vsvsvsvs CashCashCashCash� Ability to generate cash in a high fuel
environment illustrates prudent cashmanagement
� Strong operational health comparedto other carriers in the region
HistoricalHistoricalHistoricalHistorical CashCashCashCash balancebalancebalancebalance::::----
- 2011 – RM 2.02 billion
- 2010 – RM 1.50 billion
- 2009 – RM 746 million-
500
1,000
1,500
2,000
2,500
-
20
40
60
80
100
120
140
2009 2010 2011
Cash Balance (R
M'mil)
Cash Balance (R
M'mil)
Cash Balance (R
M'mil)
Cash Balance (R
M'mil)
Average fuel price (US$ /
Average fuel price (US$ /
Average fuel price (US$ /
Average fuel price (US$ /
Barrel)
Barrel)
Barrel)
Barrel)
Average fuel price (US$ / Barrel) Cash Balance (RM'mil)
CAGR: 65%
CAGR: 36%
2.00
2.50
3.00
80
100
120
140
Net g
earin
gNet g
earin
gNet g
earin
gNet g
earin
g
Average fuel price (US$ / Barrel)
Average fuel price (US$ / Barrel)
Average fuel price (US$ / Barrel)
Average fuel price (US$ / Barrel)
Average fuel price (US$ / Barrel) Net gearing
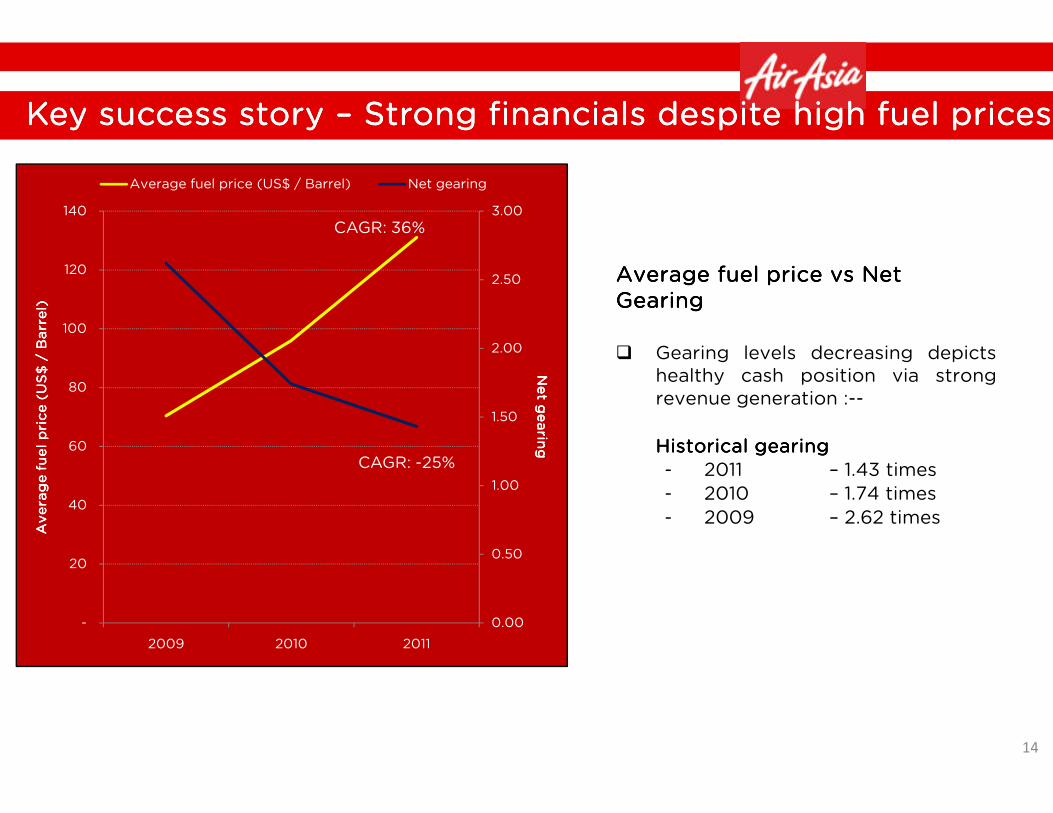
Average fuel price Average fuel price Average fuel price Average fuel price vsvsvsvs Net Net Net Net GearingGearingGearingGearing
� Gearing levels decreasing depictshealthy cash position via strongrevenue generation :--
Key success story Key success story Key success story Key success story –––– Strong financials despite high fuel pricesStrong financials despite high fuel pricesStrong financials despite high fuel pricesStrong financials despite high fuel prices
CAGR: 36%
1414
0.00
0.50
1.00
1.50
-
20
40
60
2009 2010 2011
Net g
earin
gNet g
earin
gNet g
earin
gNet g
earin
g
Average fuel price (US$ / Barrel)
Average fuel price (US$ / Barrel)
Average fuel price (US$ / Barrel)
Average fuel price (US$ / Barrel)
revenue generation :--
HistoricalHistoricalHistoricalHistorical gearinggearinggearinggearing
- 2011 – 1.43 times
- 2010 – 1.74 times
- 2009 – 2.62 times
CAGR: -25%

Ancillary Income Ancillary Income Ancillary Income Ancillary Income –––– Strong upsideStrong upsideStrong upsideStrong upside
4Q11 Ancillary Income4Q11 Ancillary Income4Q11 Ancillary Income4Q11 Ancillary Income
� In MAA, ancillary income per pax reduce by 19% to RM40 per pax y-o-y due to reclassification of AirAsiaGo & Cargo commissions
� Stripping out Stripping out Stripping out Stripping out AirAsiaAirAsiaAirAsiaAirAsia Go & Cargo commission Go & Cargo commission Go & Cargo commission Go & Cargo commission from 2010, below is like to like comparison:from 2010, below is like to like comparison:from 2010, below is like to like comparison:from 2010, below is like to like comparison:----
� 2011 ancillary income per pax = RM42.7
� 2010 ancillary income per pax = RM35.5
4038
4749
27
52
0
10
20
30
40
50
60
MAA TAA IAA
4Q11 v 4Q10
15
� 2010 ancillary income per pax = RM35.5
YTD Ancillary incomeYTD Ancillary incomeYTD Ancillary incomeYTD Ancillary income
� All three operations still ahead y-o-y on based on ancillary income per pax
� Existing items posted strong revenue growth YTD for each entity includes:-
� Assigned seats - up on avg 81%
� Baggage Supersize - up on avg 52%
� In-flight meals - up on avg 33%
15
Q4 2011 Q4 2010
45
38
4844
29
44
0
10
20
30
40
50
60
MAA TAA IAA
2011 v 2010
2011 2010In $RMIn $RMIn $RMIn $RM
In $RMIn $RMIn $RMIn $RM


2011 2011 2011 2011 –––– Financial Results Financial Results Financial Results Financial Results ---- MalaysiaMalaysiaMalaysiaMalaysiaRM’000RM’000RM’000RM’000 FinancialFinancialFinancialFinancial performanceperformanceperformanceperformance
2011201120112011 2010201020102010 ChangeChangeChangeChange
RevenueRevenueRevenueRevenue 4,473,818 3,948,095 13%
EBITDAREBITDAREBITDAREBITDAR 1,849,396 1,652,637 12%
Operating ProfitOperating ProfitOperating ProfitOperating Profit 1,198,696 1,066,961 12%
Core netCore netCore netCore net incomeincomeincomeincome 880,784 749,319 18%
Profit after taxProfit after taxProfit after taxProfit after tax 564,147 1,061,411 -47%
EBITDAR marginEBITDAR marginEBITDAR marginEBITDAR margin 41% 42% -1 ppt
Operating profit margin (EBIT)Operating profit margin (EBIT)Operating profit margin (EBIT)Operating profit margin (EBIT) 27% 27% --
1717
Operating profit margin (EBIT)Operating profit margin (EBIT)Operating profit margin (EBIT)Operating profit margin (EBIT) 27% 27% --
OperationalOperationalOperationalOperational performance performance performance performance
2011201120112011 2010 2010 2010 2010 ChangeChangeChangeChange
Passengers Carried Passengers Carried Passengers Carried Passengers Carried 17,986,558 16,054,738 12%
Capacity Capacity Capacity Capacity 22,474,620 20,616,120 9%
Load Load Load Load Factor Factor Factor Factor 80% 78% 2 ppt
RPK (million) RPK (million) RPK (million) RPK (million) 21,037 18,499 14%
ASK (million) ASK (million) ASK (million) ASK (million) 26,074 24,362 7%
Average Average Average Average Fare (RM)Fare (RM)Fare (RM)Fare (RM) 176 177 -
RASK (RASK (RASK (RASK (sensensensen)))) 17.16 16.21 6%
CASK (CASK (CASK (CASK (sensensensen)))) 12.56 11.83 6%
CASK exCASK exCASK exCASK ex----fuel (fuel (fuel (fuel (sensensensen)))) 5.99 6.86 - 13%

2011 2011 2011 2011 –––– CASK CASK CASK CASK ---- MalaysiaMalaysiaMalaysiaMalaysia
Cost / ASK (US centsCost / ASK (US centsCost / ASK (US centsCost / ASK (US cents 2011 2011 2011 2011 2010 2010 2010 2010
Staff Costs (0.60) (0.48)
Depreciation (0.72) (0.70)
Aircraft Fuel Expense (2.15) (1.62)
Aircraft Operating lease expense (0.10) (0.09)
1818
Maintenance, Overhaul (0.11) (0.12)
User Charges and other related expense (0.46) (0.51)
Travel and tour operations expenses (0.05) (0.09)
Others Operating Expenses (0.23) (0.26)
Other losses / (gains )-net (0.07) (0.03)
Other Income 0.38 0.05
Total Cost / ASK Total Cost / ASK Total Cost / ASK Total Cost / ASK 4.114.114.114.11 3.873.873.873.87

THB’000THB’000THB’000THB’000 FinancialFinancialFinancialFinancial performanceperformanceperformanceperformance
2011201120112011 2010201020102010 ChangeChangeChangeChange
RevenueRevenueRevenueRevenue 15,873,810 11,979,571 33%
EBITDAREBITDAREBITDAREBITDAR 4,742,569 4,170,597 14%
Operating ProfitOperating ProfitOperating ProfitOperating Profit 1,943,328 1,857,019 5%
Profit after taxProfit after taxProfit after taxProfit after tax 2,032,755 2,011,037 1%
EBITDAR marginEBITDAR marginEBITDAR marginEBITDAR margin 30% 35% -5 ppt
Operating profit margin (EBIT)Operating profit margin (EBIT)Operating profit margin (EBIT)Operating profit margin (EBIT) 12% 16% -4 ppt
2011 2011 2011 2011 –––– Financial Results Financial Results Financial Results Financial Results ---- ThailandThailandThailandThailand
1919
OperationalOperationalOperationalOperational performance performance performance performance
2011201120112011 2010201020102010 ChangeChangeChangeChange
Passengers Carried Passengers Carried Passengers Carried Passengers Carried 6,863,467 5,704,832 20%
Capacity Capacity Capacity Capacity 8,564,220 7,303,692 17%
Load Factor Load Factor Load Factor Load Factor 80% 78% 2 ppt
RPK (million) RPK (million) RPK (million) RPK (million) 7,389 5,923 25%
ASK (million) ASK (million) ASK (million) ASK (million) 9,199 7,605 21%
Average Average Average Average Fare (THB)Fare (THB)Fare (THB)Fare (THB) 1,930 1,804 7%
RASK (THB)RASK (THB)RASK (THB)RASK (THB) 1.73 1.58 10%
CASK (THB)CASK (THB)CASK (THB)CASK (THB) 1.51 1.33 14%
CASK exCASK exCASK exCASK ex----fuel (THB)fuel (THB)fuel (THB)fuel (THB) 0.82 0.81 1%

2011 2011 2011 2011 –––– CASKCASKCASKCASK---- ThailandThailandThailandThailand
Cost / ASK (US cents)Cost / ASK (US cents)Cost / ASK (US cents)Cost / ASK (US cents) 2011 2011 2011 2011 2010 2010 2010 2010
Staff Costs (0.52) (0.49)
Depreciation (0.03) (0.05)
Aircraft Fuel Expense (2.27) (1.71)
Aircraft Operating lease expense (0.97) (0.95)
Maintenance, Overhaul (0.39) (0.37)
2020
User Charges and other related expense (0.71) (0.73)
Travel and tour operations expenses - -
Others Operating Expenses (0.20) (0.20)
Other Income 0.14 0.13
Total Cost / ASK Total Cost / ASK Total Cost / ASK Total Cost / ASK 4.954.954.954.95 4.354.354.354.35

IDR’IDR’IDR’IDR’ millionmillionmillionmillion FinancialFinancialFinancialFinancial performanceperformanceperformanceperformance
2011201120112011 2010201020102010 ChangeChangeChangeChange
RevenueRevenueRevenueRevenue 3,705,295 2,756,219 34%
EBITDAREBITDAREBITDAREBITDAR 812,147 821,408 -1%
Operating ProfitOperating ProfitOperating ProfitOperating Profit 149,654 312,616 -52%
Profit after taxProfit after taxProfit after taxProfit after tax 62,089 474,409 -87%
EBITDAR marginEBITDAR marginEBITDAR marginEBITDAR margin 22% 30% -8 ppt
Operating profit margin (EBIT)Operating profit margin (EBIT)Operating profit margin (EBIT)Operating profit margin (EBIT) 4% 11% -7 ppt
2011 2011 2011 2011 –––– Financial Results Financial Results Financial Results Financial Results ----IndonesiaIndonesiaIndonesiaIndonesia
2121
OperationalOperationalOperationalOperational performance performance performance performance
2011201120112011 2010 2010 2010 2010 ChangeChangeChangeChange
Passengers Carried Passengers Carried Passengers Carried Passengers Carried 5,009,924 3,921,039 28%
Capacity Capacity Capacity Capacity 6,466,852 5,124,508 26%
Load Factor Load Factor Load Factor Load Factor 77% 77% -
RPK (million) RPK (million) RPK (million) RPK (million) 6,664 5,190 28%
ASK (million) ASK (million) ASK (million) ASK (million) 8,667 6,737 29%
Average Average Average Average Fare (IDR)Fare (IDR)Fare (IDR)Fare (IDR) 602,941 579,623 4%
RASK (THB)RASK (THB)RASK (THB)RASK (THB) 427.52 409.09 5%
CASK (THB)CASK (THB)CASK (THB)CASK (THB) 410.25 363.43 13%
CASK exCASK exCASK exCASK ex----fuel (THB)fuel (THB)fuel (THB)fuel (THB) 212.84 211.59 1%

2011 2011 2011 2011 –––– CASK CASK CASK CASK ---- IndonesiaIndonesiaIndonesiaIndonesia
Cost / ASK (US cents)Cost / ASK (US cents)Cost / ASK (US cents)Cost / ASK (US cents) 2011 2011 2011 2011 2010 2010 2010 2010
Staff Costs (0.51) (0.49)
Depreciation (0.05) (0.03)
Aircraft Fuel Expense (2.25) (1.73)
Aircraft Operating lease expense (0.83) (0.83)
Maintenance, Overhaul (0.43) (0.46)
2222
User Charges and other related expense (0.47) (0.51)
Travel and tour operations expenses - -
Provision of early return of aircraft (0.07) -
Others Operating Expenses (0.14) (0.11)
Other Income 0.06 0.02
Total Cost / ASK Total Cost / ASK Total Cost / ASK Total Cost / ASK 4.684.684.684.68 4.144.144.144.14

4Q11Financials and Operational Financials and Operational
Statistics

4Q11 4Q11 4Q11 4Q11 –––– Financial Results Financial Results Financial Results Financial Results ---- MalaysiaMalaysiaMalaysiaMalaysiaRM’000RM’000RM’000RM’000 FinancialFinancialFinancialFinancial performanceperformanceperformanceperformance
4444Q11Q11Q11Q11 4444Q10Q10Q10Q10 ChangeChangeChangeChange
RevenueRevenueRevenueRevenue 1,272,722 1,164,358 9%
EBITDAREBITDAREBITDAREBITDAR 662,561 590,691 12%
Operating ProfitOperating ProfitOperating ProfitOperating Profit 490,781 432,607 13%
Core netCore netCore netCore net incomeincomeincomeincome 410,266 346,821 18%
Profit after taxProfit after taxProfit after taxProfit after tax 135,662 311,082 -56%
EBITDAR marginEBITDAR marginEBITDAR marginEBITDAR margin 52% 51% -2 ppt
Operating profit margin (EBIT)Operating profit margin (EBIT)Operating profit margin (EBIT)Operating profit margin (EBIT) 39% 37% 2 ppt
2424
Operating profit margin (EBIT)Operating profit margin (EBIT)Operating profit margin (EBIT)Operating profit margin (EBIT) 39% 37% 2 ppt
OperationalOperationalOperationalOperational performance performance performance performance
4Q114Q114Q114Q11 4Q11 4Q11 4Q11 4Q11 ChangeChangeChangeChange
Passengers Carried Passengers Carried Passengers Carried Passengers Carried 4,854,674 4,440,327 9%
Capacity Capacity Capacity Capacity 5,946,120 5,393,880 10%
Load Factor Load Factor Load Factor Load Factor 82% 82% -
RPK (million) RPK (million) RPK (million) RPK (million) 5,620 5,319 6%
ASK (million) ASK (million) ASK (million) ASK (million) 6,775 6,434 5%
Average Average Average Average Fare (RM)Fare (RM)Fare (RM)Fare (RM) 196 188 4%
RASK (RASK (RASK (RASK (sensensensen)))) 18.79 18.10 4%
CASK (CASK (CASK (CASK (sensensensen)))) 11.54 11.36 2%
CASK exCASK exCASK exCASK ex----fuel (fuel (fuel (fuel (sensensensen)))) 4.53 6.82 - 34%

4Q11 4Q11 4Q11 4Q11 –––– CASK CASK CASK CASK ---- MalaysiaMalaysiaMalaysiaMalaysia
Cost / ASK (US centsCost / ASK (US centsCost / ASK (US centsCost / ASK (US cents 4444Q11 Q11 Q11 Q11 4444Q10 Q10 Q10 Q10
Staff Costs (0.60) (0.47)
Depreciation (0.67) (0.76)
Aircraft Fuel Expense (2.23) (1.45)
Aircraft Operating lease expense (0.14) (0.06)
Maintenance, Overhaul (0.13) (0.20)
2525
User Charges and other related expense (0.41) (0.57)
Travel and tour operations expenses - (0.10)
Others Operating Expenses (0.40) (0.44)
Other losses / (gains )-net 0.11 0.36
Other Income 0.78 0.07
Total Cost / ASK Total Cost / ASK Total Cost / ASK Total Cost / ASK 3.683.683.683.68 3.623.623.623.62

THB’000THB’000THB’000THB’000 FinancialFinancialFinancialFinancial performanceperformanceperformanceperformance
4444Q11Q11Q11Q11 4444Q10Q10Q10Q10 ChangeChangeChangeChange
RevenueRevenueRevenueRevenue 4,308,642 3,504,720 23%
EBITDAREBITDAREBITDAREBITDAR 1,327,149 1,509,696 -12%
Operating ProfitOperating ProfitOperating ProfitOperating Profit 587,265 885,228 -34%
Profit after taxProfit after taxProfit after taxProfit after tax 619,435 944,519 -34%
EBITDAR marginEBITDAR marginEBITDAR marginEBITDAR margin 31% 43% -12 ppt
Operating profit margin (EBIT)Operating profit margin (EBIT)Operating profit margin (EBIT)Operating profit margin (EBIT) 14% 25% -11 ppt
4Q11 4Q11 4Q11 4Q11 –––– Financial Results Financial Results Financial Results Financial Results ---- ThailandThailandThailandThailand
26
Operating profit margin (EBIT)Operating profit margin (EBIT)Operating profit margin (EBIT)Operating profit margin (EBIT) 14% 25% -11 ppt
26
OperationalOperationalOperationalOperational performance performance performance performance
4Q114Q114Q114Q11 4Q11 4Q11 4Q11 4Q11 ChangeChangeChangeChange
Passengers Carried Passengers Carried Passengers Carried Passengers Carried 1,820,827 1,621,771 12%
Capacity Capacity Capacity Capacity 2,325,240 2,035,260 14%
Load Factor Load Factor Load Factor Load Factor 78% 80% -2 ppt
RPK (million) RPK (million) RPK (million) RPK (million) 1,895 1,638 16%
ASK (million) ASK (million) ASK (million) ASK (million) 2,433 2,043 19%
Average Average Average Average Fare (THB)Fare (THB)Fare (THB)Fare (THB) 1,990 1,889 5%
RASK (THB)RASK (THB)RASK (THB)RASK (THB) 1.77 1.72 3%
CASK (THB)CASK (THB)CASK (THB)CASK (THB) 1.53 1.28 19%
CASK exCASK exCASK exCASK ex----fuel (THB)fuel (THB)fuel (THB)fuel (THB) 0.81 0.77 5%

4Q11 4Q11 4Q11 4Q11 –––– CASK CASK CASK CASK ---- ThailandThailandThailandThailand
Cost / ASK (US cents)Cost / ASK (US cents)Cost / ASK (US cents)Cost / ASK (US cents) 4444Q11 Q11 Q11 Q11 4444Q10 Q10 Q10 Q10
Staff Costs (0.52) (0.53)
Depreciation (0.02) (0.03)
Aircraft Fuel Expense (2.30) (1.63)
Aircraft Operating lease expense (0.95) (0.95)
Maintenance, Overhaul (0.37) (0.30)
2727
User Charges and other related expense (0.68) (0.62)
Travel and tour operations expenses - -
Others Operating Expenses (0.21) (0.26)
Other Income 0.15 0.22
Total Cost / ASK Total Cost / ASK Total Cost / ASK Total Cost / ASK 4.904.904.904.90 4.114.114.114.11

IDR’IDR’IDR’IDR’ millionmillionmillionmillion FinancialFinancialFinancialFinancial performanceperformanceperformanceperformance
4444Q11Q11Q11Q11 4444Q10Q10Q10Q10 ChangeChangeChangeChange
RevenueRevenueRevenueRevenue 965,631 757,068 28%
EBITDAREBITDAREBITDAREBITDAR 245,141 171,095 43%
Operating ProfitOperating ProfitOperating ProfitOperating Profit 78,650 24,711 218%
Profit after taxProfit after taxProfit after taxProfit after tax 15,787 166,934 -91%
EBITDAR marginEBITDAR marginEBITDAR marginEBITDAR margin 25% 23% 2 ppt
Operating profit margin (EBIT)Operating profit margin (EBIT)Operating profit margin (EBIT)Operating profit margin (EBIT) 8% 3% 5 ppt
4Q11 4Q11 4Q11 4Q11 –––– Financial Results Financial Results Financial Results Financial Results ---- IndonesiaIndonesiaIndonesiaIndonesia
2828
OperationalOperationalOperationalOperational performance performance performance performance
4Q114Q114Q114Q11 4Q11 4Q11 4Q11 4Q11 ChangeChangeChangeChange
Passengers Carried Passengers Carried Passengers Carried Passengers Carried 1,255,019 1,000,864 25%
Capacity Capacity Capacity Capacity 1,629,304 1,286,648 27%
Load Factor Load Factor Load Factor Load Factor 77% 78% - 1 ppt
RPK (million) RPK (million) RPK (million) RPK (million) 1,650 1,380 20%
ASK (million) ASK (million) ASK (million) ASK (million) 2,134 1,771 21%
Average Average Average Average Fare (IDR)Fare (IDR)Fare (IDR)Fare (IDR) 634,438 606,142 5%
RASK (THB)RASK (THB)RASK (THB)RASK (THB) 452.54 427.56 6%
CASK (THB)CASK (THB)CASK (THB)CASK (THB) 415.68 413.60 1%
CASK exCASK exCASK exCASK ex----fuel (THB)fuel (THB)fuel (THB)fuel (THB) 211.97 262.30 -19%

4Q11 4Q11 4Q11 4Q11 –––– CASK CASK CASK CASK ---- IndonesiaIndonesiaIndonesiaIndonesia
Cost / ASK (US cents)Cost / ASK (US cents)Cost / ASK (US cents)Cost / ASK (US cents) 4444Q11 Q11 Q11 Q11 4444Q10 Q10 Q10 Q10
Staff Costs (0.49) (0.53)
Depreciation (0.10) (0.04)
Aircraft Fuel Expense (2.26) (1.68)
Aircraft Operating lease expense (0.76) (0.88)
Maintenance, Overhaul (0.47) (1.02)
2929
User Charges and other related expense (0.48) (0.50)
Travel and tour operations expenses - -
Others Operating Expenses (0.17) (0.12)
Other Income 0.12 0.19
Total Cost / ASK Total Cost / ASK Total Cost / ASK Total Cost / ASK 4.614.614.614.61 4.584.584.584.58

OverviewOverviewOverviewOverview� AirAsia has investments of 48.9% in both TAA and IAA
� The aviation laws of Thailand and Indonesia require foreign shareholdings to not exceed 50%interest in these entities
� Based on the shareholders’ agreements for these entities, TAA is considered to be a jointlycontrolled entity and IAA is considered to be an associate of AirAsia.
� The basis of this consideration is due to the various covenants in the agreements whereby inthe case of TAA, key decisions are taken jointly and in the case of IAA, AirAsia has onlysignificant influence
Accounting for TAA and IAAAccounting for TAA and IAAAccounting for TAA and IAAAccounting for TAA and IAA
significant influence
AccountingAccountingAccountingAccounting ConsiderationsConsiderationsConsiderationsConsiderations� AirAsia’s accounting treatment for its investments in IAA and TAA is in full compliance with
International Financial Reporting Standards (“FRS”)
� The IFRS applied are FRS 131 “Accounting for Jointy Controlled Entities” (IFRS 31) whichapplies to TAA and FRS 128 “ Accounting for Associates” (IFRS 28) which applies to IAA
� TAA and IAA are accounted for using the equity method of accounting per the respectiveStandards
� Consolidation of TAA and IAA is strictly prohibited by the IFRS unless the shareholderarrangements change, which result in AirAsia having control. AirAsia can account for all thelosses of TAA and IAA if it assumes obligations for all liabilities of TAA and IAA which willobviously be detrimental to the shareholders of AirAsia
30

EquityEquityEquityEquity AccountingAccountingAccountingAccounting
� The equity method is a method of accounting whereby the investment is initiallyrecognised at cost and adjusted thereafter for the post-acquisition change in theinvestor’s share of net assets of the investee. The profit or loss of the investorincludes the investor's share of the profit or loss of the investee.
� FRS 128 and FRS 131 provide that if an investor’s share of losses of an associate orjointly controlled entity equals or exceeds its interest in the associate, the investordiscontinues recognising its share of further losses unless the investor has incurred
Accounting for TAA and IAA (cont’)Accounting for TAA and IAA (cont’)Accounting for TAA and IAA (cont’)Accounting for TAA and IAA (cont’)
discontinues recognising its share of further losses unless the investor has incurredlegal or constructive obligations or made payments on behalf of the associate.
� Consequently, as the share of losses for both TAA and IAA have exceeded the cost ofinvestment in these entities, AirAsia has in prior years fully provided for the cost ofinvestment in both TAA and IAA (amounting to RM12 million and RM4 millionrespectively), and discontinued its recognition of share of any further losses, asrequired by the Standard, as it has not provided any legal or constructive obligationsor made payments on behalf of the associate or jointly controlled entity.
31