air sampling media cleanliness for vi investigations … · the importance of air sampling media...
TRANSCRIPT

1
The Importance of Air Sampling Media Cleanliness for Vapor Intrusion Investigations Alyson Fortune and Michael Tuday Columbia Analytical Services Air Quality Laboratory, 2655 Park Center Drive, Simi Valley, CA 93065
ABSTRACT
The increase in regulatory oversight at vapor intrusion sites nationwide, as well as recent publication of Federal and local vapor intrusion guidance documents and screening levels has led to a need for reliable air phase (indoor air and sub-slab/soil vapor) data at extremely low concentrations. This paper will explore and discuss the importance of media cleanliness and certification to achieve typical low level data quality objectives.
Several potential pathways of media contamination will be examined, including: canisters, flow controllers/critical orifice assemblies, vacuum gauges, and canister pressurization/fill stations in the laboratory.
Several contamination situations will be explored and quantified. The resulting data will be used to support laboratory and field sampling best practice recommendations.
INTRODUCTION
Thorough cleaning and certification of canister media has long been an accepted practice in the laboratory community. However, similar cleaning, certification and general care with the associated canister sampling media (e.g. flow controllers and vacuum gauges) has been less commonly discussed and practiced. Since all of this equipment is cleaned and reused, it is critical, especially for ultra low level projects, to ensure that every piece of equipment used to collect a sample has been properly cleaned and certified by the laboratory performing the analysis.
In addition to being described in detail in the EPA TO-15 method1, the importance of canister cleaning and/or the canister cleaning technique itself has been described in several historical documents, such as canister stability studies by Batterman et. al4, Ochai et. al5, and Brymer et. al6.These documents all describe a cleaning procedure using steam cleaning & heat. More recently, canister cleaning has been briefly described in the South Coast Air Quality Management District (SCAQMD) Multiple Air Toxics Exposure Study III (MATES III)7, in the literature by Wang et. al8,and at technical conferences9. To date, cleaning and other maintenance of associated canister sampling equipment (e.g. flow controllers, vacuum gauges) has not been described in great detail in the literature.
The EPA TO-15 method mentions cleaning of the “sampling system components” by rinsing with HPLC grade water and drying in a vacuum oven at 80ºC1. Restek Corporation recommends cleaning “the entire sampling train as you would the can to minimize introduction of contaminants into a clean can”2. Entech Instruments recommends backflushing of flow controllers with nitrogen/zero air and/or baking the flow controllers in a 70ºC oven for higher level applications.3

2
Since most commercial air analysis laboratories analyze canister samples from a variety of applications, including indoor/ambient air monitoring (typically lower concentration samples, sometimes in the low ppbV/high pptV range) and soil vapor/soil vapor extraction (SVE) system monitoring (typically higher concentration samples, sometimes in the high ppmV range), the potential exists for cross contamination and false positive results. The purpose of this paper is to explore the potential data quality implications of equipment cleaning & segregation practices (or the lack thereof) in the laboratory. Specifically, the issue of “carryover” or “memory” in air sampling equipment will be addressed. PROCEDURE
One test sample was created in a 6L electropolished stainless steel (SUMMA) canister with elevated concentrations of a mixture of petroleum hydrocarbons and tetrachloroethene (this sample is referred to as Sample A). The study was split into two areas: contamination of flow controllers (defined as mechanical devices containing an orifice to restrict flow and a diaphragm to maintain consistent flow rate, used for passive time integrated sample collection) and contamination of vacuum gauges (used to check pressure upon receipt at the laboratory after sampling). Flow Controllers Sample A was pressurized to 29.4 psig (3 atmospheres) and allowed to equilibrate for 24 hours. It was then analyzed by Gas Chromatography/Mass Spectrometry (GC/MS) via EPA TO-15 to confirm the actual concentrations of selected target volatile organic compounds (VOCs) and to obtain a visual qualitative “fingerprint”. Refer to Tables 1 & 2 for instrument conditions; refer to Figure 1 for a GC/MS total ion chromatogram (TIC) fingerprint of Sample A.
Table 1. Autosampler/Concentrator Conditions (EPA TO-15) Instrument Tekmar-Dohrmann AUTOCan
Autosampler, equipped with Concentrating Trap, Cryofocusing Module, and Vacuum Pump
Adsorbent Trap Set Point 35C Sample Volume Up to 1L Dry Purge 400 mL Sampling Rate 40-100 mL/min Desorb Temp 230C Desorb Flow Rate 10 mL/min Helium Desorb Time 3 minutes Bakeout after each run 8 minutes at 260C Refocusing Trap Temperature -180C Injection Temperature 120C Injection Time 1 minute
3
2-M
ethy
l but
ane
*
*
**
Table 2. GC/MS Conditions (EPA TO-15) Instrument GC/MS #16 (Agilent 6890 GC/5975C MS) Column J&W DB-1 MS 60m x 0.32mm ID, 1 µm
film thickness Carrier Gas UHP Helium Flow Rate 1 mL/min Temperature Program Initial Temperature: 35ºC Initial Hold: 3 minutes Ramp Rate: 5ºC/min to 125ºC 2nd Ramp Rate: 20ºC/min to 240ºC; hold
for 6 minutes MSD Interface Temperature 280ºC Electron Energy 70 volts (nominal) Mass Range 34-280 amu (SCAN mode) Scan Time Minimum 10 scans/peak, not to exceed 1
second per scan
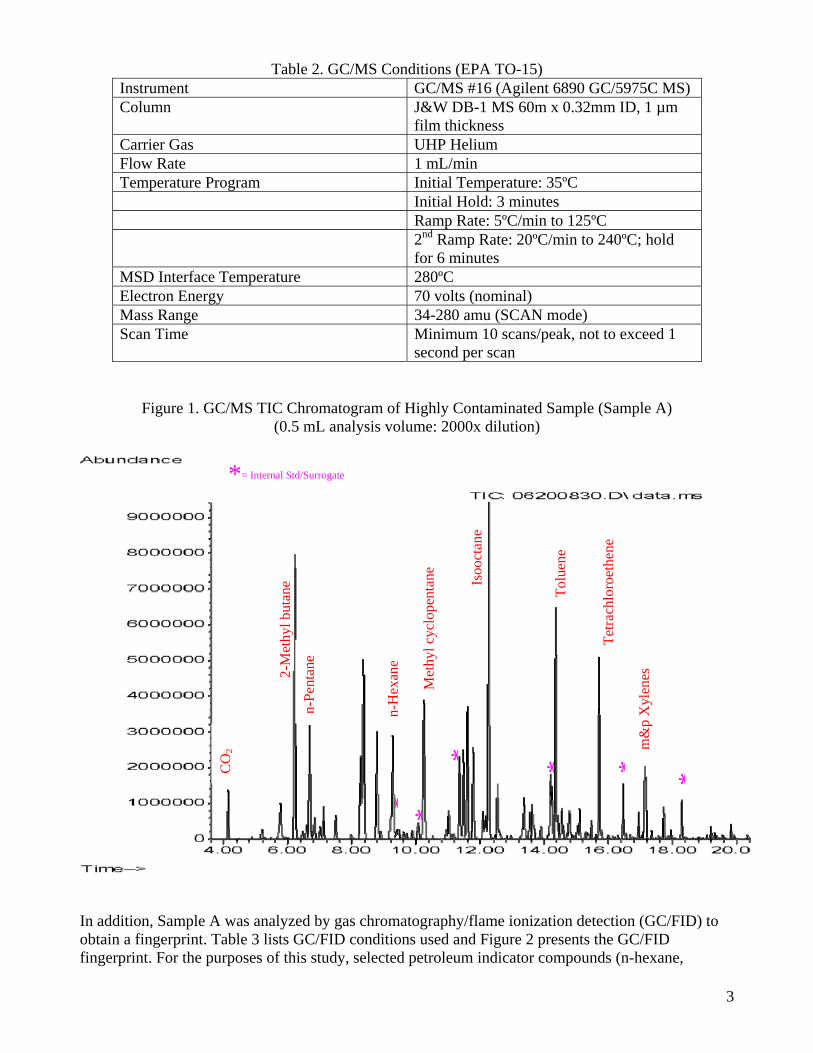
Figure 1. GC/MS TIC Chromatogram of Highly Contaminated Sample (Sample A) (0.5 mL analysis volume: 2000x dilution)
In addition, Sample A was analyzed by gas chromatography/flame ionization detection (GC/FID) to obtain a fingerprint. Table 3 lists GC/FID conditions used and Figure 2 presents the GC/FID fingerprint. For the purposes of this study, selected petroleum indicator compounds (n-hexane,
Isoo
ctan
e
Tolu
ene
Tetra
chlo
roet
hene
n-H
exan
e
n-Pe
ntan
e
Met
hyl c
yclo
pent
ane
m&
p X
ylen
es
*= Internal Std/Surrogate
* *CO
2

4
benzene, isooctane, and 1,2,4-trimethylbenzene (1,2,4-TMB), n-decane, n-undecane, and naphthalene) were tracked in the forthcoming data tables and/or chromatgrams.
Table 3. GC/FID Conditions Instrument GC/FID #19 (Agilent 5890A GC equipped
with Flame Ionization Detector Column Restek Coroporation RTX-1, 60m x
0.53mm ID, 5 µm film thickness Carrier Gas UHP Helium Temperature Program Initial Temperature: 60ºC Initial Hold: 1 minute Ramp Rate: 12ºC/min to 220ºC; hold for
1.5 minutes Injection Type Manual (1 mL gas tight syringe)
Figure 2. GC/FID Fingerprint Chromatogram of Highly Contaminated Sample (Sample A)
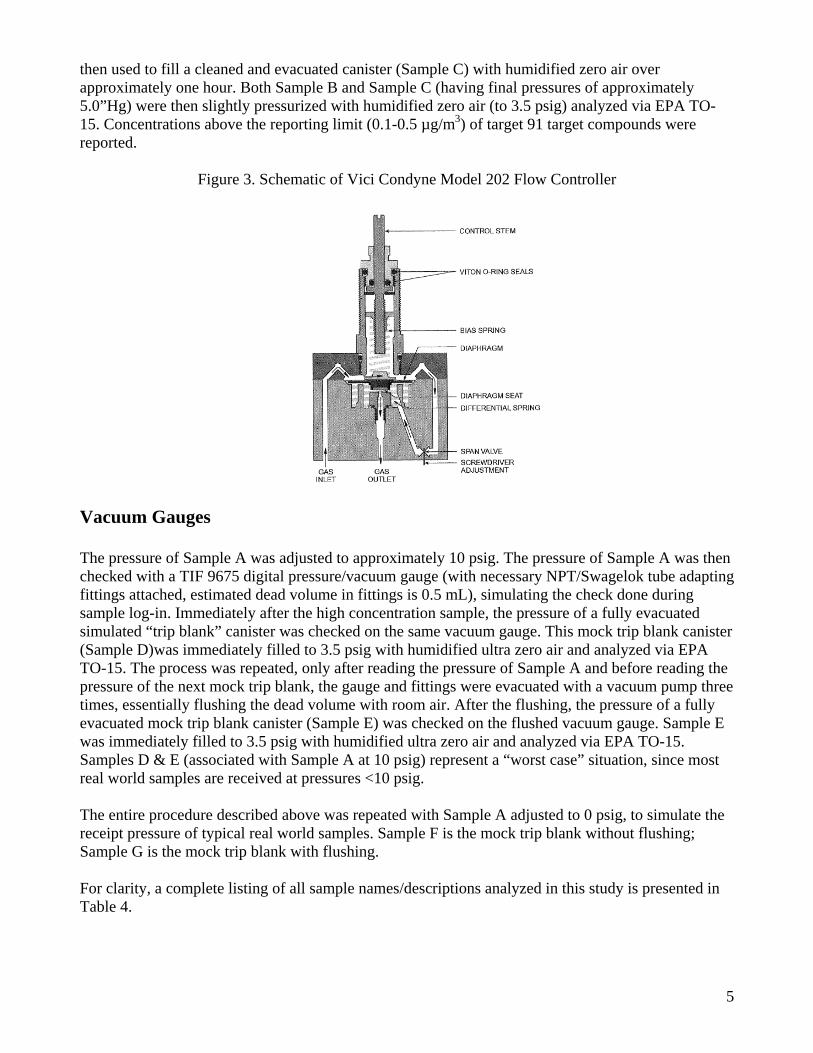
Contaminated air from Sample A was forced through two flow controllers (Vici Condyne Model 202, see Figure 3 for schematic) at a rate of 65 mL/min for 62 minutes (total volume passed through each flow controller was 4L). One of the flow controllers was then subjected to our laboratory’s normal cleaning procedures (purged with high purity air at 30 mL/min in a 60ºC oven for 2.5 hours); the other flow controller was used immediately to fill a cleaned and evacuated canister (Sample B) with humidified zero air over approximately one hour. After the first flow controller was cleaned, it was
5
then used to fill a cleaned and evacuated canister (Sample C) with humidified zero air over approximately one hour. Both Sample B and Sample C (having final pressures of approximately 5.0”Hg) were then slightly pressurized with humidified zero air (to 3.5 psig) analyzed via EPA TO-15. Concentrations above the reporting limit (0.1-0.5 µg/m3) of target 91 target compounds were reported.
Figure 3. Schematic of Vici Condyne Model 202 Flow Controller
Vacuum Gauges The pressure of Sample A was adjusted to approximately 10 psig. The pressure of Sample A was then checked with a TIF 9675 digital pressure/vacuum gauge (with necessary NPT/Swagelok tube adapting fittings attached, estimated dead volume in fittings is 0.5 mL), simulating the check done during sample log-in. Immediately after the high concentration sample, the pressure of a fully evacuated simulated “trip blank” canister was checked on the same vacuum gauge. This mock trip blank canister (Sample D)was immediately filled to 3.5 psig with humidified ultra zero air and analyzed via EPA TO-15. The process was repeated, only after reading the pressure of Sample A and before reading the pressure of the next mock trip blank, the gauge and fittings were evacuated with a vacuum pump three times, essentially flushing the dead volume with room air. After the flushing, the pressure of a fully evacuated mock trip blank canister (Sample E) was checked on the flushed vacuum gauge. Sample E was immediately filled to 3.5 psig with humidified ultra zero air and analyzed via EPA TO-15. Samples D & E (associated with Sample A at 10 psig) represent a “worst case” situation, since most real world samples are received at pressures <10 psig. The entire procedure described above was repeated with Sample A adjusted to 0 psig, to simulate the receipt pressure of typical real world samples. Sample F is the mock trip blank without flushing; Sample G is the mock trip blank with flushing. For clarity, a complete listing of all sample names/descriptions analyzed in this study is presented in Table 4.

6
Table 4. Sample Names and Descriptions Sample Name Description
Sample A Highly Contaminated Canister
Sample B Canister filled via uncleaned flow controller
Sample C Canister filled via cleaned flow controller
Sample D Mock trip blank, pressure measured after measuring pressure of 10psig Sample A (not flushed)
Sample E Mock trip blank, pressure measured after measuring pressure of 10psig Sample A (flushed)
Sample F Mock trip blank, pressure measured after measuring pressure of 0psig Sample A (not flushed)
Sample G Mock trip blank, pressure measured after measuring pressure of 0psig Sample A (flushed)
RESULTS
A distinct difference was observed in the quantitative and qualitative analysis of samples from cleaned and uncleaned flow controllers, and flushed and non-flushed vacuum gauges. Figure 4 shows the GC/MS TIC chromatogram for Sample B (uncleaned flow controller); to contrast, Figure 5 shows the GC/MS TIC chromatogram for Sample C (cleaned flow controller). Figure 6 shows the GC/MS TIC chromatogram for Sample D (mock trip blank, not flushed, 10 psig); to contrast, Figure 7 shows the GC/MS TIC chromatogram for Sample E (mock trip blank, flushed, 10 psig). Results from Samples F (mock trip blank, not flushed, 0 psig) & G (mock trip blank, flushed, 0 psig) are presented in Figures 8 & 9, respectively. Numerical results and evaluations follow in the forthcoming subsections.

7
* *
** * *Ben
zene
Tolu
ene
Isoo
ctan
e
Figure 4. GC/MS TIC Chromatogram: Sample B (Uncleaned Flow Controller)
Figure 5. GC/MS TIC Chromatogram: Sample C (Cleaned Flow Controller)
Nap
htha
lene
*
**
* * *
CO
2
*= Internal Std/Surrogate
*= Internal Std/Surrogate
Tolu
ene
Tetra
chlo
roet
hene
Isoo
ctan
e
1,2,
4-TM
B
Tetra
chlo
roet
hene
1,2,
4-TM
B
Nap
htha
lene

8
*
Tolu
ene
Figure 6. GC/MS TIC Chromatogram: Sample D (Mock Trip Blank, not flushed, 10psig)
Figure 7. GC/MS TIC Chromatogram: Sample E (Mock Trip Blank, flushed, 10psig)
CO
2 *= Internal Std/Surrogate
*
* *
*
**
*= Internal Std/Surrogate
*
* *
*
Tetra
chlo
roet
hene
Isoo
ctan
e
*B
enze
ne
1,2,
4-TM
B

9
Tolu
ene
Ben
zene
Figure 8. GC/MS TIC Chromatogram: Sample F (Mock Trip Blank, not flushed, 0psig)
Figure 9. GC/MS TIC Chromatogram: Sample G (Mock Trip Blank, flushed, 0psig)
CO
2 *= Internal Std/Surrogate
*
* *
*
**
*= Internal Std/Surrogate
**
*
*
*Te
trach
loro
ethe
ne
Isoo
ctan
e
*
1,2,
4-TM
B
CO
2

10
Flow Controllers Tetrachloroethene (PCE) Tetrachloroethene carryover was seen in Sample B (uncleaned flow controller). Assuming a concentration of 250,000 µg/m3 in Sample A, 106 ng tetrachloroethene were pulled through each flow controller; thus, Sample B (uncleaned flow controller) had 0.20% carryover and Sample C (cleaned flow controller) had 0.0002% carryover. While the percentages of carryover observed were very small, the nominal concentrations seen in the canisters as a result of this carryover exceed many established risk based concentrations for indoor air. Table 5 presents the concentrations seen in these samples, as well as the percent reduction in concentration between the cleaned and uncleaned flow controller samples.
Table 5. Tetrachloroethene Flow Controller Results Sample A Concentration (µg/m3)
Sample C Concentration (µg/m3)
Sample B Concentration (µg/m3)
% Reduction in Concentration from Cleaning
250,000 (E) 2.2 2000 (E) 99.89% E=Estimated over calibration range
Petroleum Constituents Petroleum product carryover was seen in Sample B (uncleaned flow controller). Looking at the eight individual marker compounds, Table 6 presents chemical information (molecular weight (MW) and boiling point (BP)), carryover information, and cleaning effectiveness information.
Table 6. Gasoline & Diesel Constituents Flow Controller Results Compound MW BP
(ºC) Sample A Concentration(µg/m3)
Sample C Concentration (µg/m3), % Carryover
Sample B Concentration (µg/m3), % Carryover
% Reduction from Cleaning
n-Hexane 86.17 69 140,000 ND (0.75)
NC 250 (E) 0.04% 99.8%
Benzene
78.11 80 36,000 0.23 0.0002%
100 0.07% 99.8%
Isooctane
114.23 99 300,000 (E) 0.84 0.0001%
810 (E) 0.07% 99.9%
Toluene
92.14 111 190,000 2.4 0.0003%
950 (E) 0.13% 99.8%
1,2,4-TMB
120.2 168 8,400 2.2 0.0065% 520 (E) 1.6% 99.6%
n-Decane 142.28 174 2,400 ND (0.75)
NC 180 (E) 1.9% 99.9%
n-Undecane 156.31 196 610 ND (0.75)
NC 99 4.1% 99.6%
Naphthalene
128.17 218 ND (1000) 4.7 NC 12 NC 61.3%
ND= Not detected (above reporting limit), NC= Not calculable, E=Estimated over calibration range

11
When plotting boiling point versus the percent carryover (Figure 10), the relationship appears to be exponential in nature. Thus, as the boiling point of the contaminant compound increases, the degree of carryover or memory in a flow controller appears to increase exponentially.
Figure 10. Plot of Boiling Point versus Percent Carryover in Sample B
y = 3E-05e0.0372x
R2 = 0.9793
0.00%
0.50%
1.00%
1.50%
2.00%
2.50%
3.00%
3.50%
4.00%
4.50%
0 50 100 150 200 250
Boiling Point, C
% C
arry
over
in U
ncle
aned
Flo
w
Con
trolle
r
Vacuum Gauges Tetrachloroethene (PCE) Tetrachloroethene carryover was seen in Sample D (mock trip blank, not flushed, 10 psig). The carryover concentration seen in Sample F (mock trip blank, not flushed, 0 psig) was reduced by approximately 50%. When the gauge was flushed out in between readings, the carryover concentrations seen in Samples E (10 psig) and G (0 psig) dropped dramatically, but low levels of tetrachloroethene were still seen. The ratio between the 10 psig and 0 psig readings remained similar (the 0 psig reading being approximately half of the 10 psig reading). Table 7 presents the numerical results of this experiment.
Table 7. Tetrachloroethene Vacuum Gauge (Mock Trip Blank) Carryover Results Sample A Concentration (µg/m3)
Sample D Concentration (not flushed, 10 psig) (µg/m3)
Sample E Concentration (flushed, 10 psig) (µg/m3)
Sample F Concentration (not flushed, 0 psig) (µg/m3)
Sample G Concentration (flushed, 0 psig) (µg/m3)
250,000(E) 19 0.36 8.0 0.24 E=Estimated over calibration range Petroleum Constituents Petroleum product carryover was seen in Sample D (mock trip blank, not flushed, 10 psig). The carryover concentration seen in Sample F (mock trip blank, not flushed, 0 psig) was reduced by approximately 50%. When the gauge was flushed out in between readings, the carryover concentrations seen in Samples E (10 psig) and G (0 psig) dropped to below the reporting limit. Tables 8A and 8B present the numerical results of this experiment.

12
Table 8A. Petroleum Constituent Vacuum Gauge (Mock Trip Blank) Carryover Results (Not Flushed) Compound Sample A
Concentration (µg/m3)
Sample D Concentration (not flushed, 10 psig) (µg/m3)
Sample F Concentration (not flushed, 0 psig) (µg/m3)
n-Hexane 140,000 3.4 1.7 Benzene 36,000 1.0 0.52 Isooctane 300,000 (E) 11 5.2 Toluene 190,000 10 4.6 1,2,4-TMB 8,400 2.4 1.1 n-Decane 2,400 0.78 0.32 n-Undecane 610 0.38 0.22 Naphthalene ND (1000) ND ND ND= Not detected (above reporting limit), E=Estimated over calibration range
Table 8B. Petroleum Constituent Vacuum Gauge (Mock Trip Blank) Carryover Results (Flushed) Compound Sample A
Concentration (µg/m3)
Sample E Concentration (flushed, 10 psig) (µg/m3)
Sample G Concentration (flushed, 0 psig) (µg/m3)
n-Hexane 140,000 ND (0.50) ND (0.50) Benzene 36,000 ND (0.10) ND (0.10) Isooctane 300,000 (E) ND (0.50) ND (0.50) Toluene 190,000 ND (0.50) ND (0.50) 1,2,4-TMB 8,400 ND (0.50) ND (0.50) n-Decane 2,400 ND (0.50) ND (0.50) n-Undecane 610 ND (0.50) ND (0.50) Naphthalene ND (1000) ND (0.50) ND (0.50) ND= Not detected (above reporting limit), E=Estimated over calibration range
CONCLUSIONS
The data demonstrate that laboratory best practices should include some type of decontamination for all canister sampling equipment, especially after exposure (or potential exposure) to elevated concentrations. The elevated concentrations of Sample A shown in this study (mg/m3 range) are not atypical for samples collected from a SVE system or soil vapor samples collected near a subsurface contamination source. Thus, the potential exists for carryover and cross contamination of samples, unless care is taken by the laboratory to properly decontaminate and segregate equipment based on concentration level/application. Even with very small percent carryover (as seen in Sample C), the nominal concentrations that may result from any type of equipment carryover can exceed human health risk based target levels for vapor intrusion investigations, resulting in false positives and potentially resulting in unnecessary cleanup work. The data demonstrate that this widely used style of flow controller (orifice/diaphragm assembly) has the potential for carryover, even after cleaning, when exposed to elevated

13
concentrations. In fact, for very boiling point contaminants (e.g. naphthalene), carryover may occur even at lower concentrations; this effect can be observed in the data presented in Table 6 (i.e. even with a moderate concentration less than 1000 µg/m3 in Sample A, we observed naphthalene carryover in Samples B & C). To ensure optimum performance, this equipment should be used for low level (ambient/indoor) applications only. A simpler and less expensive critical orifice device (with less internal surface area and a less convoluted flow path) may be used for higher concentration applications. Flushing out of the vacuum gauge in between sample pressure readings appears to be an effective practice to prevent carryover from highly contaminated samples to less contaminated samples. However, the data show that even after flushing, a low concentration carryover of tetrachloroethene was present (Samples E & G). This may present a problem for vapor intrusion investigations for human health risk assessments where ultra low level reporting limits are required. Therefore, to minimize the chances of this phenomenon occurring, the laboratory may segregate pressure gauges for low level vs. higher level work. On a related note, the data show that the issue of carryover from pressure gauges is exaggerated with positive pressure samples; under these circumstances, care should be taken by the laboratory to thoroughly decontaminate the system to prevent potential carryover. It should be noted that additional sources/sinks of volatile organic compounds (VOCs) may exist in typical vapor intrusion sampling/analytical systems. There have been several recent technical presentations at national vapor intrusion conferences that have mentioned the influence of tubing type on VOC samples, including a comprehensive study performed by Hayes et. al.10 In addition, particulate matter or condensed VOCs entering a canister may act as a source or a sink for VOCs. On the canisters themselves, some older styles of canisters may have pipe thread (NPT) fittings connecting the valve stem to the canister body. These NPT fittings are wrapped with Teflon tape; over time and exposure to elevated concentration samples, this Teflon tape can also act as a source or a sink of VOCs. To conclude, for low level vapor intrusion work, it is critical for the data user to consider each of these analytical issues and insist that proper decontamination and/or segregation of equipment occurs in the laboratory. FUTURE WORK Additional types of sampling equipment may be evaluated, including different brands, designs/configurations, and coating types of flow controller/critical orifice devices. Additional compounds may also be evaluated (other chlorinated VOCs, a better assessment of diesel/heavier hydrocarbons, etc).
ACKNOWLEDGEMENTS
We would like to acknowledge Christopher Parnell, Wida Ang, and the entire TO-15 GC/MS staff at Columbia Analytical Services for providing the analytical support necessary for this paper. Special thanks to Christopher Parnell for his dedicated support on this project and to Maryam Azad for her peer review of this paper.
14
REFERENCES
1. U.S. Environmental Protection Agency, 1999. Compendium Method TO-15: Determination Of Volatile Organic Compounds (VOCs) In Air Collected In Specially-Prepared Canisters And Analyzed By Gas Chromatography/Mass Spectrometry (GC/MS) (EPA/625/R-96/010b). Office of Research and Development.
2. Restek Corporation, 2008. Restek Airmail (GNFL1015). Volume 1, 2008. 3. Entech Instruments. CS1200 Operating Instructions. Accessed online 6/20/08 at:
http://www.entechinst.com/pdf/CS1200E_Instructions.pdf 4. Batterman, S.A.; Zhang, G.Z.; Baumann, M. Analysis and Stability of Aldehydes and Terpenes
in Electropolished Canisters. Atmospheric Environment. 1998, 32, 1647-1655. 5. Ochiai, N..; Daishima, S.; Cardin, D.B. Long-term measurement of volatile organic
compounds in ambient air by canister based one week sampling method. Journal of Environmental Monitoring. 2003, 5, 997-1003.
6. Brymer, D.A.; Ogle, L.D.; Jones, C.J.; Lewis, D.L. Viability of Using SUMMA Polished Canisters for the Collection and Storage of Parts per Billion by Volume Level Volatile Organics. Environmental Science & Technology. 1996, 30, 188-195.
7. South Coast Air Quality Management District, 2008. DRAFT REPORT MATES-III: Multiple Air Toxics Exposure Study in the South Coast Air Basin. Accessed online 6/20/08 at: http://www.aqmd.gov/prdas/matesIII/matesIII.html
8. Wang, D.K.W. and Austin, C. C. Determination of complex mixtures of volatile organic compounds in ambient air: canister methodology. Analytical and Bioanalytical Chemistry, Volume 386, Number 4 (October, 2006): pages 1099-1120.
9. Rasmussen, R.A. History and Application of the SUMMA Canister for Low Level VOC Measurements. Oral presentation at: AWMA Symposium on Air Quality Measurement Methods and Technology, San Francisco, CA, May 2007.
10. Hayes, H.; Benton, D.; and Khan, N. Impact of Sampling Media on Soil Gas Measurements. Presented at: AWMA “Vapor Intrusion- The Next Great Environmental Challenge- An Update” Symposium on Air Quality Measurement Methods and Technology, Los Angeles, CA, September 2006.