agriculture prospects report (august/september 2005)
TRANSCRIPT

Agriculture Prospects Report
(August/September 2005)
Ministry of Agriculture, Animal Husbandry and Food
Food, Agriculture and Animal Husbandry Information Management and Policy Unit (FAAHM)
Kabul, 12 October 2005
Abbreviations APR Agriculture Prospects Report DAP Di-Ammonium Phosphate FAAHM Food, Agriculture and Animal Husbandry Information Management and
Policy Unit FAO Food and Agriculture Organization of the United Nations FMD Foot and Mouth Disease MAAHF Ministry of Agriculture, Animal Husbandry and Food PPR peste des petits ruminants USGS United States Geological Survey WFP World Food Programme
Contact us Comments on this publication are most welcome. Contact us at the following address:
Haqiqatpal Ghulam Rabbani, Director, FAAHM, MAAHF
[email protected] Mobile: +93-(0)70-284879
The FAO project “Support to FAAHM in the MAAHF” (GCP/AFG/034/GER) provides technical guidance and financial support for APR.
Cover page
Good quality rice (Bara) at maturity-stage and corn at grain-filling-stage growing under favourable conditions in Chardara district
in Kunduz province on 4 October 2005 Photo courtesy: Mohamed Omar and Abdul Shukoor, FAAHM Counterpart staff

Contents Abbreviations Contact Address
1. INTRODUCTION 1
2. CROP PRODUCTION IN 2005 2
3. WEATHER CONDITION 2
4. CEREAL AREA, PRODUCTION, UTILIZATION AND SUPPLY 2
5. WORLD WHEAT PRODUCTION 3
6. PRICE OF AGRICULTURAL COMMODITIES AND SERVICES 3
6.1. INTERNATIONAL MARKET PRICE OF WHEAT 4 6.2. CONSUMER PRICE INDEX 5 6.3. CURRENT PRICES 6 6.3.1. WHEAT PRICES 6 6.3.2. LIVESTOCK AND LIVESTOCK PRODUCTS PRICES 8 6.3.3. LABOR COSTS 10 6.3.4. FERTILIZER PRICES 12 6.4. REAL PRICES 13
7. ADVERSE FACTORS IN CROPS 15
8. FOOD SECURITY 15
8.1. SPECIAL PROGRAMME FOR FOOD SECURITY 16 8.2. LOCUST AND SUNN PEST CONTROL 17 8.3. GRAIN STORAGE SILOS 18 8.3.1. PROGRESS UNDER GRAIN SILOS 19 8.3.2. PROGRESS UNDER THE CONSTRUCTION OF SMALL WAREHOUSES 19 8.3.3. BENEFICIARY FEEDBACK 20

Tables Table 1: The 2005 cereal balance sheet Table 2: Forecasted production of wheat in the World in 2005 Table 3: Amount of chemical used and area cleaned under the 2005 locust control Table 4: Amount of chemical used and area cleaned under the 2005 Sunn pest control Table 5: Procurement progress of small grain silos Table 6: Proposed construction sites for the small-warehouses Maps Map 1: Afghanistan with provincial boundaries Map 2: Wheat balance in 2005 by province Annexes 1. Assumptions involved in cereal-utilization calculation 2. Area and production of wheat in 2005 by province 3. Wheat balance in 2005 by province 4. National Consumer Price Index (CPI) for September 2004 to August 2005 at 2004
constant price 5. Kabul CPI for October 2004 to September 2005 at 2002 constant price 6. Monthly retail market prices of selected 17 agricultural commodities and services in
32 provincial market centers (January to September 2005) 7. Weekly retail market prices of 8 commodities in six markets (July-September 2005) 8. Additional information on agricultural prospects by province

-Page 1 -
Ministry of Agriculture, Animal Husbandry and Food
(MAAHF)
Food, Agriculture and Animal Husbandry Information Management and Policy Unit
(FAAHM)
Agriculture Prospects Report
(August/September 2005)
1. Introduction This report supersedes Agriculture Prospects Report (APR) released by MAAHF on 2 August 2005. The purpose of APR is to: (a) provide the estimates of annual crop area and production, (b) quantify the cereal surplus or deficit, (c) identify critical areas needing emergency interventions and/or development initiatives, and (d) present retail market prices of agricultural commodities and their analysis. The APR data are mostly presented at the provincial levels. The present issue is the fourth in the series of bi-monthly APR. The first APR was released in early-March 2005. It provided preliminary forecasts of this year’s wheat and rice production. The ensuing two issues produced in mid-May and early-August provided national and provincial data on cereal supply, demand and surplus/deficit. The primary sources of information for APR are provincial agriculture offices. Radio and telephone are means of communication used for more frequent contacts with them. Information and data provided by other sources (e.g. technical departments in MAAHF, FAO, WFP, USGS Agro-met project) are also used. From January 2005 MAAHF started collecting the prices of 17 agricultural commodities from 32 provinces on a monthly basis. From August 2005, MAAHF started collecting weekly market prices of: (i) local wheat, (ii) flour, and (iii) imported wheat from the provinces. From the first week of October, the MAAHF weekly market prices are broadcasted on the AM radio programme of MAAHF (Karana), which has a national outreach. MAAHF is introducing an improved system of monthly and weekly price collection from November 2005. The new system in 34 provinces will cover over 25 commodities on a monthly basis and the three commodities mentioned above on a weekly basis. The price data collection system of MAAHF is demand-driven. MAAHF is committed to providing the users with the price data on a regular basis and the price data analysis on a bi-monthly basis (together with APR). In near future MAAHF plans to gather and disseminate wholesale and producers’ prices also. It is obvious that the system needs to be strengthened as regards data quality/gap, timeliness, scope, coverage and frequency of reporting. Conduct of probability sample surveys is essential for bringing improvements in the reliability of current agricultural data. Through FAO’s support, in August/September MAAHF/CSO devised, tested and implemented probability sample survey in six provinces (Logar,

-Page 2 -
Nangarhar, Kunduz, Balkh, Hirat, and Bamyan). The purposes of the survey were to collect: (i) data on crop area and yield at the household level and (ii) basic agricultural data at the district level. Data of the survey are being processed.
2. Crop production in 2005 This year’s bumper harvest was possible because of the three factors. Firstly, both winter and spring crops benefited from the well above normal precipitation amounts. Secondly, Integrated Pest Management (IPM) played a very successful role, especially as regards the locust and Sunn pest control. Thirdly, increased agricultural inputs use, better-managed irrigation application, and ameliorated crop husbandry practices have shown tangible impacts on this year’s agricultural production. The pasture and water availability in pastoral areas also benefited from the good rainfall. On the flipside, this year’s crop loss due to the floods is moderately higher than a normal year. Rust inflicted slightly above normal damage on wheat areas in parts of the country. Livestock deaths were reported due to diseases, floods, and inadequate feed and poor animal nutrition during winter.
3. Weather condition The weather condition this year was favorable for the winter and the spring crop growing. The accumulated precipitation from October 2004 to February 2005 was well above normal in all parts of the country. Most of the locations in the country received well above normal precipitation in March 2005 also. The precipitation in April was observed to be below normal for a few stations that reported.1 Rainfall pattern in April 2005 in North-West Frontier Provinces of Pakistan was very good for the standing crops.2 The country experienced higher than Long-Term Average (LTA) rainfall amount in May and June, except in the southern and south-western parts. The amount of rainfall in July in the east, east-central and southern regions was higher compared to the corresponding LTAs. Other regions experienced lower than LTA or no rainfall amount in the month.3
4. Cereal Area, Production, Utilization and Supply Total production of cereal in 2005 is estimated at 5.24 million tonnes, of which wheat is estimated at 4.27 million tonnes. Milled rice production is expected to be 325,000 tons. Maize and barley production are estimated at 315,000 tons and 337,000 tons, respectively. Total cereal utilization in 2005 is estimated at 5.8 million tonnes, of which 4.7 million tonnes (81%) will be wheat. The commercial import requirement in 2005 is estimated at 440,000 tonnes. This includes wheat (337,000 tonnes), milled rice (101,000 tonnes), and corn (2,000 tonnes). (Table 1; next page)
1 Source: USGS Agro-meteorology Project 2 Source: Pakistan Agro-meteorological Service 3 Source: USGS Agro-meteorology Project

-Page 3 -
Given the bumper harvest, the year ending stock-build-up of wheat is forecast at 100,000 tonnes.
Table 1: The 2005 Cereal Balance Sheet (‘000 tonnes)4 for Afghanistan
Description Wheat Rice(milled)
Maize Barley Total
A. Domestic availability Food aid (WFP) Domestic production
4,386120
4,266
325--
325
315 --
315
337 --
337
5,363120
5,243B. Utilization Food use Animal feed Seed provision Losses Year ending stock-build-up
4,7233,688
--295640100
426392
--1123--
317 46
208 16 47 --
337 23
236 26 52 --
5,8034,149
444348762100
Commercial Import (B-A) 337 101 2 -- 440
5. World Wheat Production5 World wheat production in 2005 is forecast at 612 million tonnes, which is about 2% lower than the record harvest in 2004, but still well above the average of the past five years. Wheat production in Asia has been forecasted at 263 million tonnes, an increase by 3.6% over 2004. Wheat production in some of Afghanistan’s neighboring countries is higher by 7% to 8% than the last year. (Table 2)
Table 2: Wheat production in the World and the neighboring countries6
Production (million tonnes) Area 2004 2005
% increase/decrease compared to 2004
World 625.9 614.1 -1.9 Asia 253.6 262.7 +3.6 Pakistan 19.5 21.1 +8.2 Iran 14.0 15.0 +7.1 Kazakhstan 9.9 10.7 +8.1
6. Price of agricultural commodities and services Like elsewhere, commodity prices in Afghanistan are influenced inert alia by country’s supply and demand, volume of import and export, efficacy of transport network, government’s price/fiscal/trade policies, neighboring countries’ policies, and macroeconomic environment.
4 See Annex 1, Annex 2 and Annex 3 for details 5 Source: FAO 6 Source: FAO

-Page 4 -
In a free market economic environment commodity prices play a key role in all of the above. MAAHF needs an operational price information system because: (i) commodity prices are needed for the identification of market-sheds7 and thin-markets8; (ii) they provide seasonal values of the commodities across markets; (iii) they are indicators of demand and supply of the commodities; (iv) they act as incentives or disincentives for production (for farmers) and commodity’s internal/external trade; (v) they are indicators of trade patterns; (vi) they are useful in estimating future supply and demand; (vii) they are needed for analyzing: (a) price relationship of a commodity across market-sheds, (b) price relationship among commodities in the same market and (c) intra-year seasonal price behavior of a commodity or similar commodities.
6.1. International market price of wheat 9 International export market price of wheat in September ranged between US$136-167 per tonne (6.7-8.2 Afs/kg). July and August saw mixed trend in the world market prices of hard and soft wheat: a steady increase in price of US hard red winter No. 2 was observed, whilst the prices of US soft red winter No. 2 and Argentina Trigo Pan showed a moderate downwardly trend.
Export prices of wheat in the world market
0
20
40
60
80
100
120
140
160
180
Mar Apr May Jun Jul Aug Sep
Month
US$
/tonn
e
US Hard Red Winter No.2, Delivered US Gulf ports US Soft Red Winter No.2, Delivered US Gulf portsArgentina, Up River f.o.b
7 Geographical areas where the price tend to move and behave together 8 These are markets with small volumes of trades. Prices in thin-markets are unpredictable and unreliable. 9 Source: International Grain Council and FAO

-Page 5 -
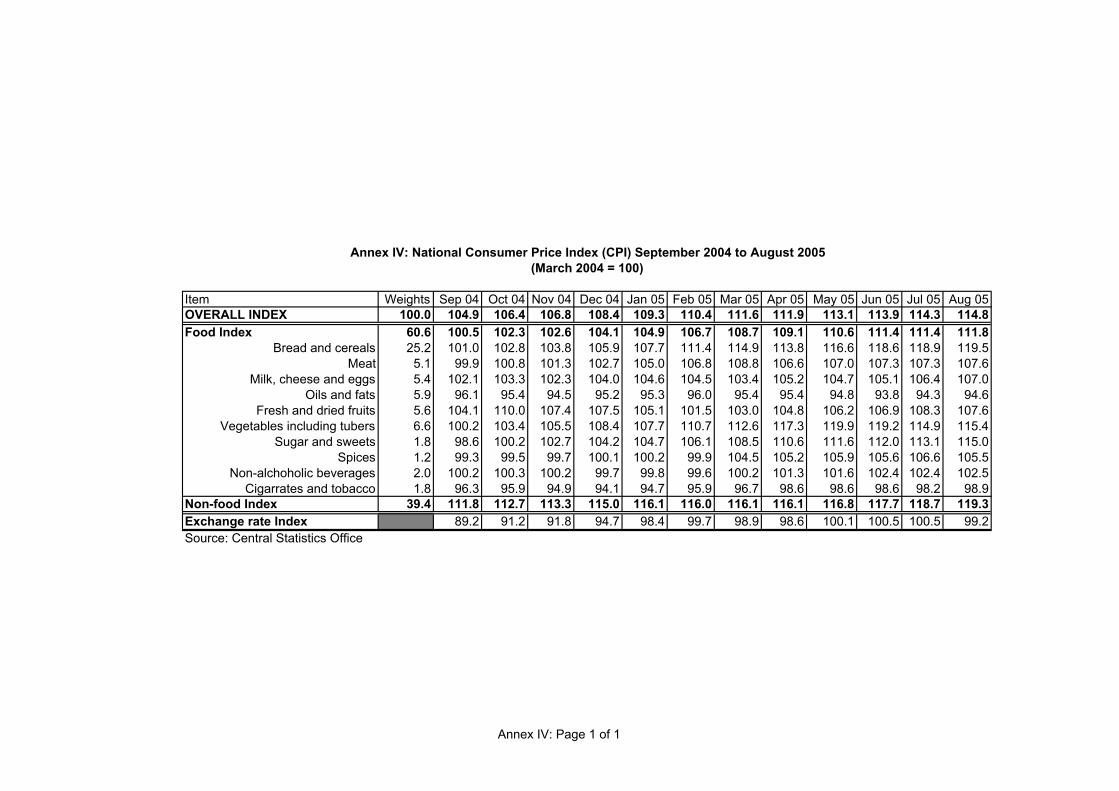
6.2. Consumer Price Index10 National Consumer Price Index (CPI) of Afghanistan is the weighted average of the CPIs for Kabul, Heart, Kandahar, Jalalabad, Mazar-e-Sharif and Khost. The weights assigned to food and non-food items in the national CPI calculations are 60.6% and 39.4%, respectively. March 2004 is the base-period11 used for the calculation. (Annex IV) Compared to September 2004, national CPI in August 2005 was higher by almost 10 percent points. The Exchange-rate Index also rose exactly by 10% points in the reference period. The linear correlation coefficient between monthly CPI and the monthly Exchange-rate Index is high (0.92) and highly significant. This suggests that the inflation in the country has been greatly influenced by the movements in the exchange-rate.
National Consumer Price Index (September 2004 to August 2005)[March 2004=100]
0.0
20.0
40.0
60.0
80.0
100.0
120.0
140.0
Sep 04
Oct 04
Nov 04
Dec 04
Jan 0
5
Feb 05
Mar 05
Apr 05
May 05
Jun 0
5Ju
l 05
Aug 05
Month
Inde
x
Overall Index Food Index Non-food Index Exchange rate Index
With monthly increase in the national CPI between 0.1% and 1.5%, annual increases in the CPI of the food and non-food items were 11.3 and 7.5 percent points, respectively. Bread and cereal – which have one-fourth share in the overall CPI – showed highest increase (up by 18- percent points) among the food items. The price increases were substantial (up 15 percent-points up) also in the case of vegetables and tubers. The increase in the prices of livestock
10 Source: Central Statistics Office (CSO). CPI is a composite index that can be used for measuring inflation. 11 Price in March 2004 = 100

-Page 6 -
products (meat, milk, cheese and eggs) in the one-year period was 5 percent point, which is quite reasonable. Consumer prices of oils and fats exhibited slightly decreasing trend.
Consumer Price Index for some food items
0.0
20.0
40.0
60.0
80.0
100.0
120.0
140.0
Sep 04 Oct 04 Nov 04 Dec 04 Jan 05 Feb 05 Mar 05 Apr 05 May 05 Jun 05 Jul 05 Aug 05
Month
Inde
x
Bread and cereals Meat Milk, cheese and eggs
Oils and fats Fresh and dried fruits Vegetables including tubers
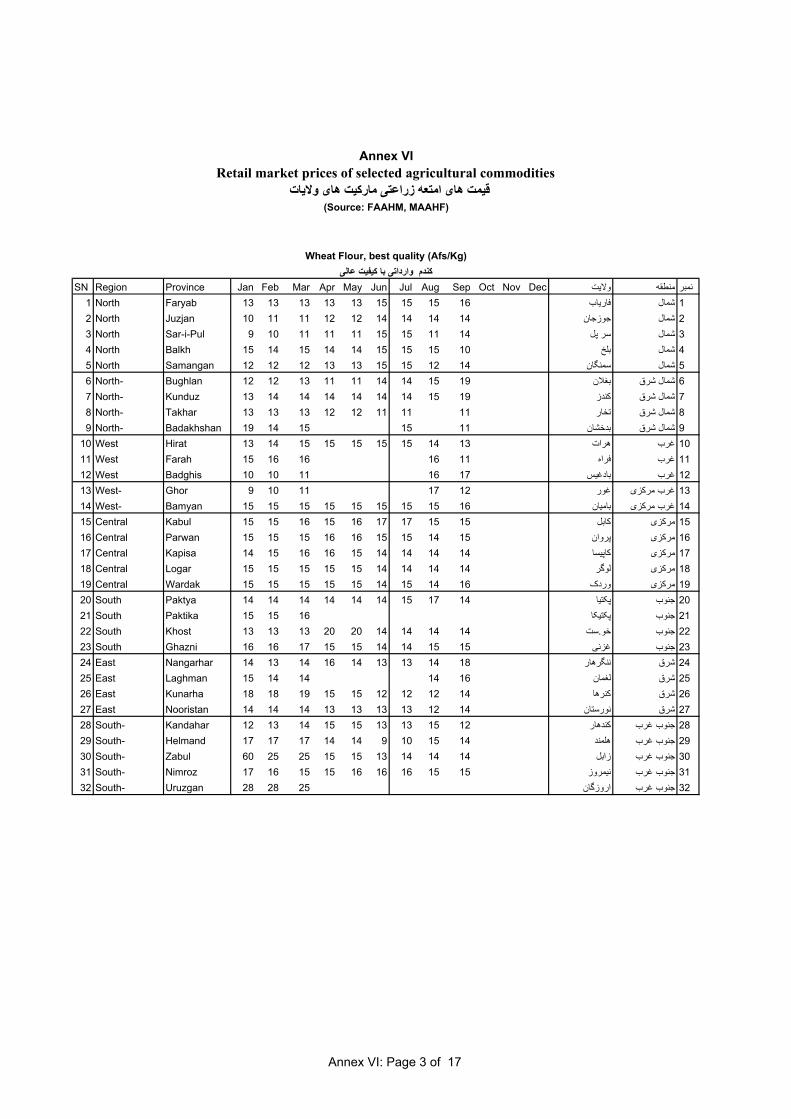
6.3. Current Prices Monthly retail market prices of 17 commodities by province are presented in Annex VI. The purpose below is to summarize and analyze these data at the regional levels.
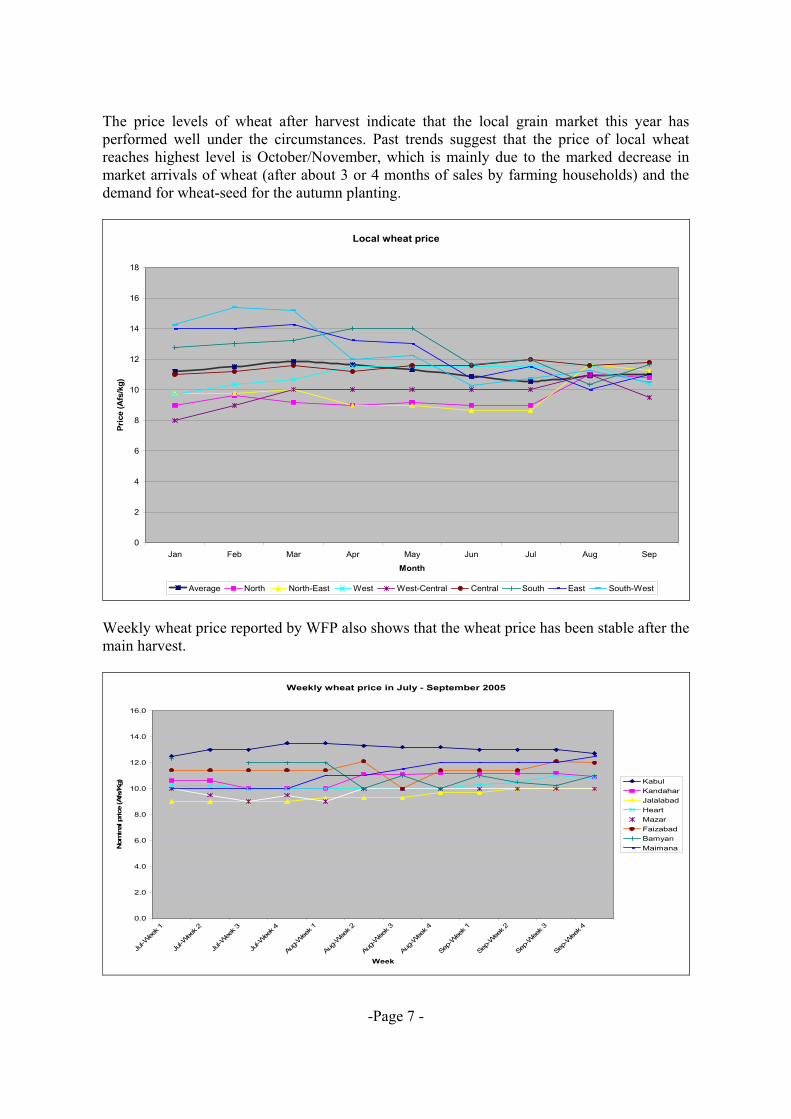
6.3.1. Wheat prices The market price of wheat in 2003 was the record-lowest in the main breadbasket areas (north and north-east). The year had bumper harvest of wheat. The 2004 was one of the worst drought years. The price of local wheat (from 2004 production) was slightly above Afs 11 per kg in January-March 2005. The price variation in the period across provinces was very wide and the price-trend showed slightly increasing tendency. The latter fact is consistent with the demand for wheat seed for the spring planting. The wheat price decreased moderately in April, May, and part of June, which can be explained satisfactorily by the bumper harvest prospects. A market-failure possibility was considered in May and early part of June. After June the prices remained stable especially in the north and north-east. In September the average price of local wheat was Afs 11. The price variations across provinces also narrowed considerably by September.
-Page 7 -
The price levels of wheat after harvest indicate that the local grain market this year has performed well under the circumstances. Past trends suggest that the price of local wheat reaches highest level is October/November, which is mainly due to the marked decrease in market arrivals of wheat (after about 3 or 4 months of sales by farming households) and the demand for wheat-seed for the autumn planting.
Local wheat price
0
2
4
6
8
10
12
14
16
18
Jan Feb Mar Apr May Jun Jul Aug Sep
Month
Pric
e (A
fs/k
g)
Average North North-East West West-Central Central South East South-West Weekly wheat price reported by WFP also shows that the wheat price has been stable after the main harvest.
Weekly wheat price in July - September 2005
0.0
2.0
4.0
6.0
8.0
10.0
12.0
14.0
16.0
Jul-W
eek 1
Jul-W
eek 2
Jul-W
eek 3
Jul-W
eek 4
Aug-W
eek 1
Aug-W
eek 2
Aug-W
eek 3
Aug-W
eek 4
Sep-W
eek 1
Sep-W
eek 2
Sep-W
eek 3
Sep-W
eek 4
Week
Nom
inal
pric
e (A
fs/K
g) KabulKandaharJalalabadHeartMazarFaizabadBamyanMaimana

-Page 8 -
6.3.2. Livestock and livestock products prices North-east and west-central regions experienced gradual increase in price of beef in the January-September period, but the price in the same period in the east showed a decreasing trend.
Price of beef (January-September 2005)
0.0
20.0
40.0
60.0
80.0
100.0
120.0
140.0
160.0
Jan Feb Mar Apr May Jun Jul Aug Sep
Month
Pric
e (A
fs/k
g)
NorthNorth-EastWestWest-CentralCentralSouthEastSouth-West
For other markets, price of beef increased up to March. It became generally cheaper after March. By September beef-price in these markets reached the level of January 2004 price. The difference in beef price across markets narrowed (Afs 110-125/kg) in June-September.
Price of beef, mutton and chicken in Kabul
0
20
40
60
80
100
120
140
160
180
200
Jan Feb Mar Apr May Jun Jul Aug Sep
Month
Pric
e (A
fs/k
g)
Beef Mutton Chicken

-Page 9 -
There was slight increase in price of mutton up to March; then decrease or at par price up to June/July and slightly upwardly movement from July, before reaching or crossing the level of January 2004 price in August/ September 2005. The difference in mutton-price across markets narrowed in July, but did not stabilize.
Mutton price (January - September 2005)
0.0
50.0
100.0
150.0
200.0
250.0
Jan Feb Mar Apr May Jun Jul Aug Sep
Month
Pric
e (A
fs/k
g)
North North-East West West-Central Central South East South-West
Average price of a one-year sheep ranged between Afs 3,000 to 5,000 for most of locations12.
Price of one-year old sheep (July-September 2005)
-
1,000
2,000
3,000
4,000
5,000
6,000
Jul-W
eek 1
Jul-W
eek 2
Jul-W
eek 3
Jul-W
eek 4
Aug-W
eek 1
Aug-W
eek 2
Aug-W
eek 3
Aug-W
eek 4
Sep-W
eek 1
Sep-W
eek 2
Sep-W
eek 3
Sep-W
eek 4
Week
Pric
e (A
fs/k
g)
Kabul Kandahar Jalalabad Heart Mazar Faizabad Bamyan Maimana
12 Source: WFP

-Page 10 -
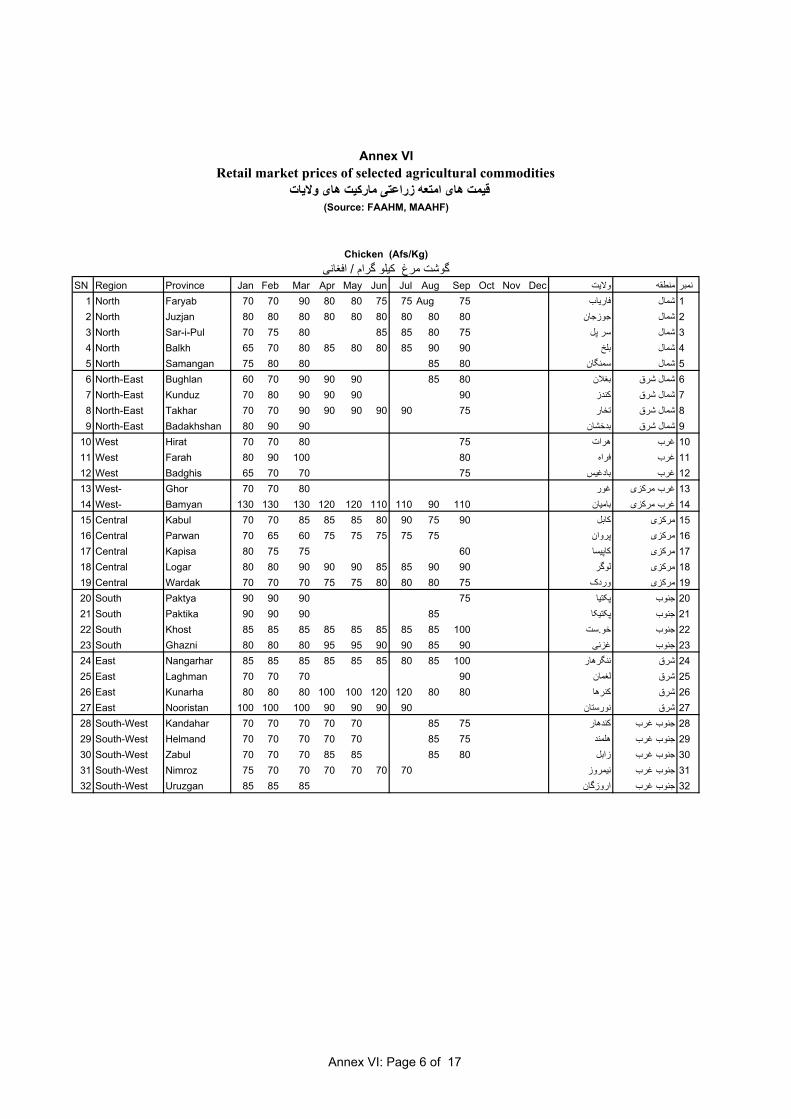
The cheapest sheep were found in the north, but the seasonal price variations in these areas were also much higher. The price range for sheep across provinces was highest in July-September (between Afs 2,000 to 5,000). Seasonal variation in the price of sheep was lesser in regulated markets. The price of chicken showed considerable spatial variations (70-120 Afs/kg). However, it exhibited a consistent seasonal price movement pattern up to May. The price moved moderately higher from January to May. In the East and West-Central region there was a decrease in the price of chicken from June to August, but the price in September was higher than in August. In other areas, the price rose higher from June to August, before having a mixed trend in September. The chicken prices across regions were least variable in August.
Chicken price in different regions
0.0
20.0
40.0
60.0
80.0
100.0
120.0
140.0
Jan Feb Mar Apr May Jun Jul Aug Sep
Moth
Pric
e (A
fs/k
g)
NorthNorth-EastWestWest-CentralCentralSouthEastSouth-West
6.3.3. Labor costs Agriculture labor costs around 125-225 Afs/day. Highest agricultural labor costs were reported from South-Western, Central and Northern Regions.

-Page 11 -
The price levels presented below generally reflect the seasonal increase or decrease in demand for agricultural labors. January is a lean period for agricultural operations. Thereafter there is some demand for agricultural labor in February/March (for spring cropping). The peak demand is in June/July and October/November, when main farm operations are on-stream.
Cost of agriculture labor in different regions
0.0
50.0
100.0
150.0
200.0
250.0
Jan Feb Mar Apr May Jun Jul Aug Sep
Month
Cps
t (A
fs/d
ay)
NorthNorth-EastWestWest-CentralCentralSouthEastSouth-West
The cost of casual labor13 rages between 125-250 Afs/day. It shows not much seasonal variations. The costs are lowest in Jalalabad (East), Kandahar (South-west) and Herat (West), in that order. North and North-East are unstable market for casual labor. The costs are stable in Central, East, South-west, West-Central (partly) and West.
Casual labour costs(July-September 2005)
0.0
50.0
100.0
150.0
200.0
250.0
300.0
Jul-W
eek 1
Jul-W
eek 2
Jul-W
eek 3
Jul-W
eek 4
Aug-Wee
k 1
Aug-Wee
k 2
Aug-Wee
k 3
Aug-Wee
k 4
Sep-Wee
k 1
Sep-Wee
k 2
Sep-Wee
k 3
Sep-Wee
k 4
Week
Cos
t per
day
(Afs
/per
son) Kabul
KandaharJalalabadHeartMazarFaizabadBamyanMaimana
13 Source: WFP

-Page 12 -
6.3.4. Fertilizer prices14 The price of imported urea in September ranged 11-13 Afs/kg on average. The price was stable after April in the entire reporting period in the West-Central region and in the north and north-east. The urea price in the eastern region is also quite stable (note that August/September prices for Nuristan are missing). The Central parts experienced slight rise in price from May to July. The price patterns suggest that South and South-West are thin markets for urea. From June the price of urea has consistent pattern across regions.
Price of imported urea
0.0
2.0
4.0
6.0
8.0
10.0
12.0
14.0
16.0
18.0
Jan Feb Mar Apr May Jun Jul Aug Sep
Month
Pric
e (A
fs/k
g)
NorthNorth-EastWestWest-CentralCentralSouthEastSouth-West
Before August spatial variation in the case of DAP prices was very large.
Price of DAP in different provinces
0.0
5.0
10.0
15.0
20.0
25.0
30.0
Jan Feb Mar Apr May Jun Jul Aug Sep
Month
Pric
e (A
fs/k
g)
NorthNorth-EastWestWest-CentralCentralSouthEastSouth-West
14 The price of fertilizer per bag expressed in Afs/kg

-Page 13 -
Part of these variations in DAP prices across provinces can be attributed to the marked difference in the quality/price of DAP available in the markets and the transportation costs involved. Price in the east (Afs 22-24/kg) and west (Afs 22-25/kg) were most stable. The seasonal prices in the case of north, north-east, south-west and south showed quite similar pattern.
6.4. Real Prices Nominal and real prices15 of wheat in Mazar and Kabul (two typically supply and deficit areas) are presented in the figure below.
Nominal and real prices of local wheat in Mazar and Kabul
0
2
4
6
8
10
12
14
16
Jan-05 Feb-05 Mar-05 Apr-05 May-05 Jun-05 Jul-05 Aug-05
Month
Pric
e (A
fs/k
g)
Mazar-e-Sharif (Real) Kabul (Real)Mazar-e-Sharif (Nominal) Kabul (Nominal)
After the harvest, wheat prices in Mazar and Kabul have been stable up to September, both in nominal and real term. The real price of wheat in Mazar is higher than its nominal price by 11%, compared to 17% more in Kabul. On average the difference between the real prices of wheat in Mazar and Kabul is Afs 4/kg, while the nominal price difference is 3 Afs/kg. This suggests that, as compared to the price in the surplus areas, the inflation distorted the price of local-wheat in urban areas moderately more. The distortion is not noticeably high though.
15 Inflation-deflators have been used in the calculation of real prices. March 2004=100.

-Page 14 -
Like nominal price, real prices of local wheat in all areas showed very stable or slightly downwardly trend after the harvest.
Real retail market price of wheat in six main markets
0
2
4
6
8
10
12
14
16
18
Jan-05 Feb-05 Mar-05 Apr-05 May-05 Jun-05 Jul-05 Aug-05
Month
Rea
l pric
e (A
fs/k
g)
Mazar-e-Sharif (North) Heart (West) Kabul (Central) Khost (South) Jalalabad (East) Kandahar (South-West) Real price of beef in various regions shows a generally consistent pattern of seasonal price movement. This is very interesting.
Real price of beef
0
20
40
60
80
100
120
140
160
180
200
Jan-05 Feb-05 Mar-05 Apr-05 May-05 Jun-05 Jul-05 Aug-05
Month
Pric
e (A
fs/k
g)
Mazar-e-Sharif (North) Heart (West) Kabul (Central) Khost (South) Jalalabad (East) Kandahar (South-West)

-Page 15 -
7. Adverse Factors in crops Crops in fifteen provinces were adversely affected by the floods. The locust was seen mainly in Baghlan, Balkh, Samangan, Kunduz, Juzjan, Nangarhar, Faryab, Saripul, Kabul, Wardak and Ghor. Preventive and control measures against the pest were taken at the earliest two stages of the pests’ life cycle and potentially huge loss of cereals and pastures was avoided, thanks to the efforts made by the donors and FAO. The pest was contained in all areas, except in the remotest (mined) areas of Kunduz and Balkh.16 Sunn pest was seen mainly in Jawzjan, Faryab, Saripul, Badghis, Hirat, Kunduz, Khost, Ghor (especially in Charsada district), Paktiya, Balkh, Samangan and Helmand. The Sunn pest control was also a great success this year although the delivery of the pesticide was slightly delayed. Sunn pest infestation is on rise annually and it will cause more damages to crops in the coming years if its mechanical or chemical control, in that order of preference, is not facilitated in a large scale. This year incidence of rust in wheat was somewhat favored by moisture, especially in north, north-east and south-west regions. Rust in wheat was seen from Surobi (Kabul) and Turkhan (Nangarhar) areas. In Balkh province, three varieties of wheat - Lalmi-3, Takhar-96 and Herat-99 – were found to be seriously affected by rust. Sporadic cases of rust symptoms in wheat were found also in Nangarhar, Nimroz, Bamyan (particularly in Waras and Panjab), Nuristan and Basous village (Imam Sahib) in Kunduz. Smut was mainly seen around Parwan and Kapisa area and was also found in some fields in Nakpai, Quiche, Daulatyar Gultepa villages in Char Dara district of Kunduz. A surge of melon fly – mainly attacking melons, water melons, other fruits, and pumpkin – has been observed in various parts of the country. The problem is most prevalent in Faryab, Jawzjan, Saripul, Balkh and Kunduz. There is a lack of appropriate environmental friendly pesticides for the control. Another prominent problem was that of the Cicadas in vineyards in the central regions of Kabul, Parwan and Kapisa. Some more information on agriculture prospects in individual provinces can be found in Annex VIII.
8. Food security Afghanistan is 90% self-sufficient in cereal production in a good year. It will be far much easier for Afghanistan to achieve self-sufficiency in cereal production through the minimization of pre and post harvest losses in cereals. In this connection, the areas of interventions or control -- in order of priority -- are: (i) the locust, (ii) Sunn pest, (iii) proper storage facilities, (iv) rodents, (v) weeds, (vi) rust and (v) smut.
16 Six Months activity reports, FAO/Mazar, Locust, Sunn Pest project

-Page 16 -
8.1. Special Programme for Food Security “Special Programme for Food Security (SPFS) in Afghanistan – Preparatory Phase for Community-based Food Production Capacity Building” aims to pave the way for the launching of a “National Programme for Food Security” with the objectives of ensuring adequate supply of food for the population, enabling all sections of the society to have access to adequate and safe food, reducing seasonal and year-to-year variability in food supply, and accelerating the growth of the agricultural sector on a sustainable basis. The SPFS in Afghanistan is funded under FAO regular programme with a total budget of US$551,050 for a period of over 4-years (August 2003 to December 2007). The project uses following approaches: (i) improve water management, (ii) increase crop intensity in the pilot areas through the introduction and dissemination of improved, low cost technological packages, (iii) promote profitable crop and livestock diversification in the pilot areas in accordance with natural resources availability, climatic conditions and market potential (iv) develop an effective modality of grassroots organizations for self-help in the pilot areas, and (v) confirm technical feasibility as well as economic and financial viability of intervention in the pilot areas. The project achieved the following in 2005:
(i) Final draft for the up scaling of the National Special Programme for Food Security (NSPFS) prepared.
(ii) 2 new area offices established in Tagab-e-Kishm district of Badakhshan and Behsood 2nd part district of Wardak province.
(iii) 4 training courses on beekeeping and poultry farming in Taluqan, Tagab-e- Kishm and Sorkhrod districts organized.
(iv) Organized field days on beekeeping for 96 participants in Taluqan
(v) Demonstrated 4 poultry farms in Sorkh Rod district.
(vi) 100 demonstration plots of 0.4 ha each in Behsood 2nd part district in Wardak province organized.
(vii) Training and demonstration of 680 plots of improved irrigated & rain fed wheat seed established in Taluqan district continued.
(viii) Training and demonstration of 600 kitchen garden plots of vegetables (Onion and Turnip) and 600 Kitchen Garden demonstration on (Okra) in Sorkhrod district continued.
(ix) Training and demonstration of 66 pits constructed for promotion of organic fertilizer in Taluqan district continued.
(x) Training and demonstration of 10 honey bee farms in Taluqan district continued.
(xi) Wheat threshers/threshing demonstrated to 5 agricultural cooperatives (600 members) in Sorkhrod district.

-Page 17 -
(xii) Demonstrated 6 beekeeping farms (total 60 colonies) to 6 village Shuras in Tagab-e- Kishm district.
(xiii) 5 agricultural cooperatives and 6 village Shuras were organized in Taluqan, Tagab-e- Kishm and Sorkhrod districts.
Following activities will also be completed in 2005:
• Upscale the project in November 2005 by formulating a comprehensive national programme.
• Upgrade artificial insemination centers in Taluqan district.
• Provide training to the government counterparts and the beneficiaries by implementing training courses and field days.
• Establish wheat-seed-production demonstration plots.
8.2. Locust and sunn pest control From 2002 FAO has coordinated emergency control programmes against the locust in northern Afghanistan. The 2005 campaign against locusts started at the earliest two stages of the locusts’ life cycle. Due to the timely and effective interventions, there were “diminished” or “insignificant” infestations of the locust this year. Had there been uncontrolled outbreak of the said pests, there would have been substantial loss of cereals. It is obvious that there is a need for massive donor support in order to control the locust and Sunn pest annually. There is a window of opportunity to address this problem in a sustainable way through the expansion of the already initiated interventions by MAAHF and FAO. Following physical progress were made by FAO in this regard. The following table shows the activities and achievements of the locust control campaign in 2005.
Table 3: Amount of chemical used and area cleaned under the locust control
Amount of chemical used ( liters)
Area cleaned (ha.)
Province
Daltamethrin Dimilin Daltamethrin Dimilin TotalSamangan 2,460 3,500 6,150 11,666 17,816Baghlan 3,700 2,820 9,250 30,833 40,083Kunduz 6,350 2,800 15,875 52,916 68,791Saripul -- 200 -- 666 666Faryab 200 _ 500 -- 500Total 21,450 12,165 48,625 105,564 154,189

-Page 18 -
The table below summarizes the activities and achievements of Sunn pest campaign of 2005.
Table 4: Amount of chemical used and area cleaned under the Sunn pest control 2005
Amount of chemical used (litre)
Area cleaned (ha.)
Province No. of nets distributed
Daltamethrin Dimilin By nets By chemical TotalBalkh 675 -- -- 1,350 -- 1,350Samangan 300 -- -- 600 -- 600Faryab 17,000 9,000 260 34,000 36,000 70,000Saripul 5,000 3,700 200 10,000 14,800 24,800Jawzjan 6,000 2,700 -- 12,000 10,800 22,800Total 28,650 15,400 460 57,950 61,600 119,550 For the Sunn Pest control in Heart, 4,000 litre of chemicals and 10,000 insect collection nets were sent. The Sunn Pest control campaign of 2005 was declared closed on 30 July 2005.
8.3. Grain Storage Silos Over 14,200 grain storage silos are being distributed to farmers in seven provinces of Afghanistan, thanks to an FAO project (OSRO-AFG-408-GER) funded by the Government of Germany.
A grain silo provided by the project is being taken to a farm household

-Page 19 -
The aim of the project is to help reduce post-harvest losses, improve grain quality, increase the income of farmers by allowing them to sell grain during the off-season when prices are more favorable to them, and enhance household food security. The immediate objectives of the silos project are to: (i) locally construct and distribute, through different stakeholders, small metallic silo grain storage containers to farming households, and (ii) rehabilitate 10 Community Warehouses. Main beneficiaries of this pilot project will be 14,000 households and 10 communities in seven grain-producing provinces. This $2.4 million project is to achieve a storage-capacity of 10,000 tons from small metallic silos and 250 tons through ten Community Warehouses.
8.3.1. Progress under Grain silos The production and distribution of the silos is progressing very well indeed. Project-sponsored, locally produced small metallic silos have grain storage capacities from 250 kg to 1,800 kg. (Table 5) About 305 local tinsmiths belonging to 30 districts across seven provinces have been contracted for the fabrication of these silos. The direct beneficiaries are being trained by the NGOs on the use and maintenance of the silos. The silos would provide an advanced grain storage capacity of about 8,500 tonnes. A total of 12,484 silos (88% of the target) have been produced and delivered already. By the third week of October 14,203 silos will have been produced and distributed to the targeted beneficiaries.
Table 5: Procurement progress of small grain silos
Beneficiaries by silos storage capacity
(Target) Province No. of
Districts covered
by the project
Total 250 kg 500 kg 900 kg 1800 kg
Silos already
produced and
delivered
Takhar 4 1,612 522 402 438 250 1,612Baghlan 4 751 107 243 401 -- 751Kunduz 7 4,113 1,950 1,405 582 176 4,113Samangan 1 500 165 163 42 130 500Balkh 3 2,145 547 517 414 667 1,516Faryab 10 4,582 2,778 984 612 208 3,492Heirat 1 500 183 195 49 73 500Total 30 14, 203 6,252 3,909 2,538 1,504 12,484
8.3.2. Progress under the construction of small warehouses Some delays were experienced under this activity mostly due to exogenous factors beyond the control of the project – like procedural delays, weather conditions, and local conditions.
-Page 20 -
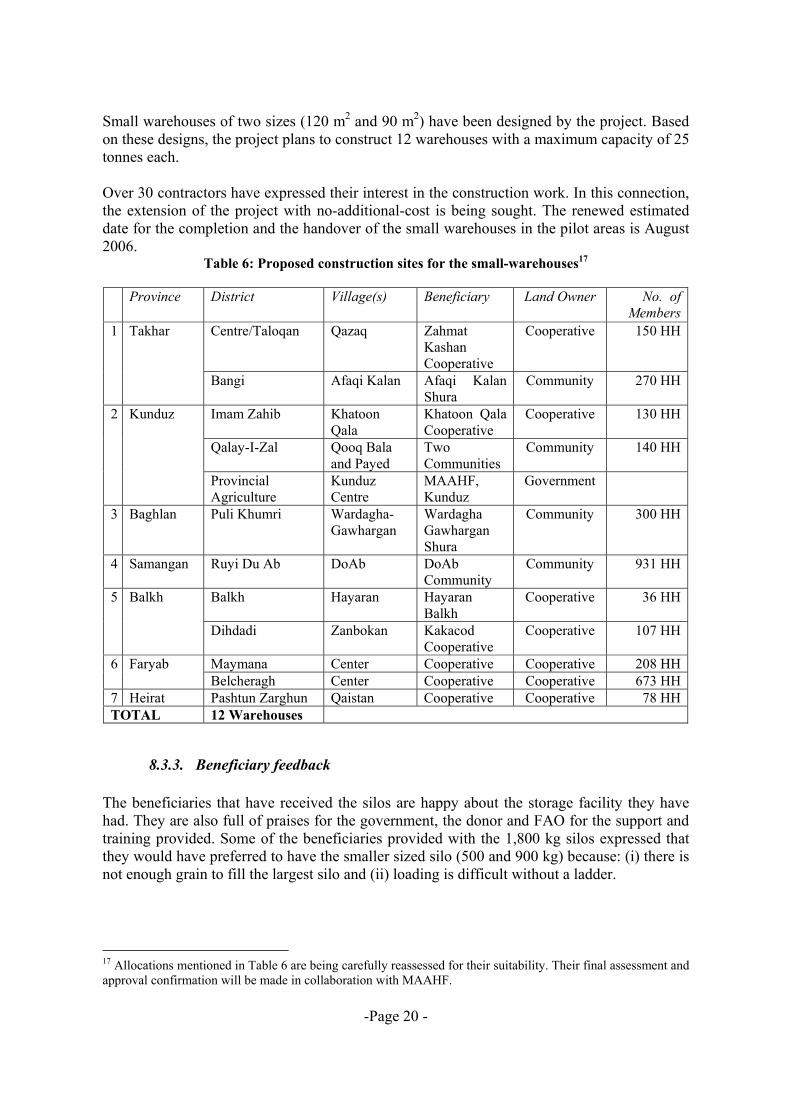
Small warehouses of two sizes (120 m2 and 90 m2) have been designed by the project. Based on these designs, the project plans to construct 12 warehouses with a maximum capacity of 25 tonnes each. Over 30 contractors have expressed their interest in the construction work. In this connection, the extension of the project with no-additional-cost is being sought. The renewed estimated date for the completion and the handover of the small warehouses in the pilot areas is August 2006.
Table 6: Proposed construction sites for the small-warehouses17
Province District Village(s) Beneficiary Land Owner No. of Members
Centre/Taloqan Qazaq Zahmat Kashan Cooperative
Cooperative 150 HH1 Takhar
Bangi Afaqi Kalan Afaqi Kalan Shura
Community 270 HH
Imam Zahib Khatoon Qala
Khatoon Qala Cooperative
Cooperative 130 HH
Qalay-I-Zal Qooq Bala and Payed
Two Communities
Community 140 HH
2 Kunduz
Provincial Agriculture
Kunduz Centre
MAAHF, Kunduz
Government
3 Baghlan Puli Khumri Wardagha-Gawhargan
Wardagha Gawhargan Shura
Community 300 HH
4 Samangan Ruyi Du Ab DoAb DoAb Community
Community 931 HH
Balkh Hayaran Hayaran Balkh
Cooperative 36 HH5 Balkh
Dihdadi Zanbokan Kakacod Cooperative
Cooperative 107 HH
Maymana Center Cooperative Cooperative 208 HH6 Faryab Belcheragh Center Cooperative Cooperative 673 HH
7 Heirat Pashtun Zarghun Qaistan Cooperative Cooperative 78 HHTOTAL 12 Warehouses
8.3.3. Beneficiary feedback The beneficiaries that have received the silos are happy about the storage facility they have had. They are also full of praises for the government, the donor and FAO for the support and training provided. Some of the beneficiaries provided with the 1,800 kg silos expressed that they would have preferred to have the smaller sized silo (500 and 900 kg) because: (i) there is not enough grain to fill the largest silo and (ii) loading is difficult without a ladder.
17 Allocations mentioned in Table 6 are being carefully reassessed for their suitability. Their final assessment and approval confirmation will be made in collaboration with MAAHF.

-Page 21 -
Many non-beneficiary farmers who have seen the silos have been contacting MAAHF offices to request for allocation of the silos to them. Unfortunately, the project has limited fund for additional silo fabrication and distribution. The local tinsmiths, who are indirect beneficiaries of the project, appreciate the effort of FAO to introduce the technology and believe that the silos would open a new avenue for a sustained growth in their regular incomes.

-Page 22 -
Afghanistan Map with Provincial Boundaries
(Source: AIMS)

-Page 23 -

Annex I: Page 1 of 1
Annex 1 Assumptions involved in calculating the cereal utilization
Population (‘000 number) [Source: Central Statistics Office] Population in 2003 22,191.0 Settled population 20,691.0 Nomads 1,500.0 Annual growth-rate is estimated at 1.92%. The 2004 FAO/WFP Crop and Food Supply Mission used a population figure of 22.6 million (22.191x1.0192) in 2004. Projected population in 2005 23,051.5 (22,191x1.0192x1.0192) Of which Settled population 21,493.5 Nomads 1,558.0 Food use 2005
Annual Requirement
(kg/person/year)
Population
(‘000 number)
Food Requirement
(‘000 tons)
Crop
(1) (2) (1)x(2) Wheat 160 23,051.5 3,688 Milled rice 17 23,051.5 392 Maize 2 23,051.5 46 Barley 1 23,051.5 23 Total 180 23,051.5 4,149
Seed and Feed use
Forecast Area
(‘000 ha)
Production
(‘000 t)
Seed-rate
(kg/ha)
Seed use
(‘000 t)
Feed1
(‘000 t)
Loss2
(‘000 t)
Crop
(1) (2) (3) (1)x(3) -- % of (2)Irrigated wheat 1,089 2,728 175 191 -- 409Rainfed wheat 1,253 1,538 83 104 -- 231All wheat 2,342 4,266 126 295 -- 640Paddy 160 325 105 11 -- 23Maize 261 315 60 16 208 47Barley 240 337 110 26 235 51Total 3,003 5,243 -- 348 443 761
1 Feed use: two-third of production for maize and 70% in the case of barley 2 Losses: 15% of production for wheat, maize and barley; 7% for milled rice

REGION/Province Area Yield Production Area Yield Production Area Yield Production
('000 ha) (t/ha) ('000 tons) ('000 ha) (t/ha) ('000 tons) ('000 ha) (t/ha) ('000 tons)NORTH 224 2.51 563 671 1.16 777 895 1.50 1,340Faryab 44 2.50 110 180 1.33 239 224 1.56 349Juzjan 50 2.50 125 95 1.10 105 145 1.59 230Sar-i-Pul 25 2.50 63 115 1.20 138 140 1.44 201Balkh 89 2.50 223 154 1.05 162 243 1.58 385Samangan 16 2.62 42 127 1.05 133 143 1.22 175NORTH-EAST 222 2.53 561 323 1.38 447 545 1.85 1,008Bughlan 54 2.50 135 74 1.50 111 128 1.92 246Kunduz 93 2.50 233 14 1.40 20 107 2.36 253Takhar 50 2.60 130 135 1.30 176 185 1.65 306Badakhshan 25 2.50 63 100 1.40 140 125 1.62 203WEST 144 2.52 363 210 1.28 268 354 1.78 631Heart 97 2.62 254 110 1.23 135 207 1.88 389Farah 24 2.40 58 0 24 2.42 58Badghis 23 2.20 51 100 1.33 133 123 1.50 184WEST-CENTRAL 35 2.09 73 42 0.88 37 77 1.43 110Ghor 22 2.00 44 39 0.88 34 61 1.28 78Bamyan 13 2.20 29 3 1.05 3 16 2.00 32CENTRAL 110 2.60 286 6 1.33 8 116 2.53 294Kabul 21 2.60 55 1 1.05 1 22 2.55 56Parwan 29 2.60 75 5 1.33 7 34 2.41 82Kapisa 10 2.66 27 10 2.70 27Logar 22 2.40 53 22 2.41 53Wardak 28 2.70 76 28 2.71 76SOUTH 102 2.60 265 1 1.00 1 103 2.58 266Paktya 18 2.60 47 18 2.61 47Paktika 16 2.60 42 16 2.63 42Khost 12 2.50 30 12 2.50 30Ghazni 56 2.60 146 1 1.16 1 57 2.58 147EAST 74 2.09 155 74 2.09 155Nangarhar 51 2.00 102 51 2.00 102Laghman 14 2.50 35 14 2.50 35Kunarha 8 2.00 16 8 2.00 16Nooristan 1 2.00 2 1 2.00 2SOUTH-WEST 178 2.60 462 178 2.60 462Kandahar 39 2.50 98 39 2.51 98Helmand 80 2.66 213 80 2.66 213Zabul 12 2.50 30 12 2.50 30Nimroz 14 2.50 35 14 2.50 35Uruzgan 33 2.60 86 33 2.61 86TOTAL 1,089 2.51 2,728 1,253 1.23 1,538 2,342 1.82 4,266Source: FAAHM/MAAHF
Annex 2
Total WheatIrrigated Wheat Rainfed Wheat
Area and Production of Wheat in 2005(July 2005 Estimates)
Annex II: Page 1 of 1

Settled Irrigated Rainfed Wheat Required Seed Post harvest Surplus orREGION/ population wheat wheat Production for human losses DeficitProvince (Projected) consumption
('000) ('000 ha.) ('000 ha.) ('000 tons) ('000 tons) ('000 tons) ('000 tons) ('000 tons)NORTH 3,100.1 224 671 1,340 496.0 94.9 201.0 548.1Faryab 824.9 44 180 349 132.0 22.6 52.4 142.0Juzjan 464.8 50 95 230 74.4 16.6 34.5 104.5Sar-i-Pul 493.2 25 115 201 78.9 13.9 30.2 78.0Balkh 986.4 89 154 385 157.8 28.4 57.8 141.0Samangan 330.8 16 127 175 52.9 13.3 26.3 82.5NORTH-EAST 3,165.0 222 323 1,008 506.4 65.7 151.2 284.7Bughlan 754.8 54 74 246 120.8 15.6 36.9 72.7Kunduz 865.5 93 14 253 138.5 17.4 38.0 59.1Takhar 790.9 50 135 306 126.5 20.0 45.9 113.6Badakhshan 753.8 25 100 203 120.6 12.7 30.5 39.2WEST 1,928.9 144 210 631 308.6 42.6 94.7 185.1Heart 1,254.8 97 110 389 200.8 26.1 58.4 103.7Farah 356.7 24 0 58 57.1 4.2 8.7 -12.0Badghis 317.4 23 100 184 50.8 12.3 27.6 93.3WEST-CENTRAL 918.4 35 42 110 146.9 9.6 16.5 -63.0Ghor 511.5 22 39 78 81.8 7.1 11.7 -22.6Bamyan 406.9 13 3 32 65.1 2.5 4.8 -40.4CENTRAL 5,517.1 110 6 294 882.7 19.7 44.1 -652.5Kabul 3,578.6 21 1 56 572.6 3.8 8.4 -528.8Parwan 765.8 29 5 82 122.5 5.5 12.3 -58.3Kapisa 379.0 10 0 27 60.6 1.8 4.1 -39.5Logar 327.6 22 0 53 52.4 3.9 8.0 -11.3Wardak 466.1 28 0 76 74.6 4.9 11.4 -14.9SOUTH 2,054.6 102 1 266 328.7 17.9 39.9 -120.5Paktya 416.9 18 0 47 66.7 3.2 7.1 -30.0Paktika 371.0 16 0 42 59.4 2.8 6.3 -26.5Khost 316.4 12 0 30 50.6 2.1 4.5 -27.2Ghazni 950.3 56 1 147 152.0 9.9 22.1 -37.0EAST 1,997.5 74 0 155 319.6 13.0 23.3 -200.9Nangarhar 1,148.6 51 0 102 183.8 8.9 15.3 -106.0Laghman 392.8 14 0 35 62.8 2.5 5.3 -35.6Kunarha 340.8 8 0 16 54.5 1.4 2.4 -42.3Nooristan 115.3 1 0 2 18.4 0.2 0.3 -16.9SOUTH-WEST 2,811.9 178 0 462 449.9 31.2 69.3 -88.4Kandahar 949.3 39 0 98 151.9 6.8 14.7 -75.4Helmand 785.7 80 0 213 125.7 14.0 32.0 41.3Zabul 258.8 12 0 30 41.4 2.1 4.5 -18.0Nimroz 157.4 14 0 35 25.2 2.5 5.3 2.0Uruzgan 660.7 33 0 86 105.7 5.8 12.9 -38.4Total for settled 21,493.5 1,089 1,253 4,266 3,439.0 294.6 639.9 -107.5Total for unsettled 1,558.0 -- -- -- 249.3 -- -- -249.3Overall 23,051.5 1,089 1,253 4,266 3,688.3 294.6 639.9 -356.8
Annex 3Wheat Balance in 2005 by Province
Annex III: Page 1 of 1
Item Weights Sep 04 Oct 04 Nov 04 Dec 04 Jan 05 Feb 05 Mar 05 Apr 05 May 05 Jun 05 Jul 05 Aug 05OVERALL INDEX 100.0 104.9 106.4 106.8 108.4 109.3 110.4 111.6 111.9 113.1 113.9 114.3 114.8Food Index 60.6 100.5 102.3 102.6 104.1 104.9 106.7 108.7 109.1 110.6 111.4 111.4 111.8
Bread and cereals 25.2 101.0 102.8 103.8 105.9 107.7 111.4 114.9 113.8 116.6 118.6 118.9 119.5Meat 5.1 99.9 100.8 101.3 102.7 105.0 106.8 108.8 106.6 107.0 107.3 107.3 107.6
Milk, cheese and eggs 5.4 102.1 103.3 102.3 104.0 104.6 104.5 103.4 105.2 104.7 105.1 106.4 107.0Oils and fats 5.9 96.1 95.4 94.5 95.2 95.3 96.0 95.4 95.4 94.8 93.8 94.3 94.6
Fresh and dried fruits 5.6 104.1 110.0 107.4 107.5 105.1 101.5 103.0 104.8 106.2 106.9 108.3 107.6Vegetables including tubers 6.6 100.2 103.4 105.5 108.4 107.7 110.7 112.6 117.3 119.9 119.2 114.9 115.4
Sugar and sweets 1.8 98.6 100.2 102.7 104.2 104.7 106.1 108.5 110.6 111.6 112.0 113.1 115.0Spices 1.2 99.3 99.5 99.7 100.1 100.2 99.9 104.5 105.2 105.9 105.6 106.6 105.5
Non-alchoholic beverages 2.0 100.2 100.3 100.2 99.7 99.8 99.6 100.2 101.3 101.6 102.4 102.4 102.5Cigarrates and tobacco 1.8 96.3 95.9 94.9 94.1 94.7 95.9 96.7 98.6 98.6 98.6 98.2 98.9
Non-food Index 39.4 111.8 112.7 113.3 115.0 116.1 116.0 116.1 116.1 116.8 117.7 118.7 119.3Exchange rate Index 89.2 91.2 91.8 94.7 98.4 99.7 98.9 98.6 100.1 100.5 100.5 99.2Source: Central Statistics Office
Annex IV: National Consumer Price Index (CPI) September 2004 to August 2005(March 2004 = 100)
Annex IV: Page 1 of 1

Item Weights Oct 04 Nov 04 Dec 04 Jan 05 Feb 05 Mar 05 Apr 05 May 05 Jun 05 Jul 05 Aug 05 Sep 05OVERALL INDEX 100.0 115.5 116.7 119.1 119.4 120.8 123.0 123.7 124.9 125.9 126.2 126.9 129.3Food 60.6 109.1 110.8 113.7 114.4 116.8 120.3 121.1 122.3 122.8 122.5 122.7 124.1
Bread and cereals 25.2 113.4 115.9 121.7 123.8 129.5 134.8 134.6 136.4 137.2 136.3 136.4 139.4Meat 5.1 129.9 131.9 134.2 135.2 135.6 137.7 143.5 145.6 146.4 145.3 145.6 145.4
Milk, cheese and eggs 5.4 115.5 116.9 118.9 120.2 121.0 120.4 120.4 119.5 119.2 119.0 120.3 121.7Oils and fats 5.9 95.1 95.3 95.9 96.0 97.2 97.4 96.5 95.3 95.2 95.3 94.5 94.8
Fresh and dried fruits 5.6 110.9 113.1 112.0 107.1 104.8 109.0 110.6 112.6 113.9 114.4 114.2 114.7Vegetables including tubers 6.6 86.5 86.6 87.3 87.2 87.8 93.2 95.4 97.4 96.0 96.3 96.4 96.3
Sugar and sweets 1.8 110.9 113.7 116.4 117.2 117.7 120.7 121.4 123.5 124.2 124.4 127.4 127.3Spices 1.2 93.8 94.6 95.9 96.9 97.0 101.8 102.9 104.9 108.2 111.3 112.6 111.5
Non-alchoholic beverages 2.0 109.1 108.7 108.2 108.5 107.5 109.0 109.4 109.6 190.9 110.1 109.6 109.2Cigarrates and tobacco 1.8 102.5 102.7 102.7 102.5 102.4 102.2 102.4 102.3 102.1 102.1 102.2 104.1
Non-food Index 39.4 125.4 125.8 127.4 127.0 127.0 127.0 127.8 129.0 130.8 132.1 133.4 137.2Exchange rate Index 89.6 90.2 93.0 96.6 97.9 97.1 96.8 98.3 98.7 98.7 97.4 97.4Source: Central Statistics Office
Annex V: Kabul Consumer Price Index for October 2004 to September 2005(December 2002 = 100)
Annex V: Page 1 of 1

SN Region Province Jan Feb Mar Apr May Jun Jul Aug Sep Oct Nov Dec ولايت منطقه نمبر1 North Faryab 12 12 10 10 11 11 11 12 13 فارياب شمال 12 North Juzjan 8 9 10 10 10 10 10 15 11 جوزجان شمال 23 North Sar-i-Pul 6 7 8 9 9 9 9 10 11 سر پل شمال 34 North Balkh 10 11 10 9 9 9 9 9 9 بلخ شمال 45 North Samangan 9 9 8 7 7 6 6 9 10 سمنگان شمال 56 North-East Bughlan 11 10 10 7 7 7 8 10 10 بغلان شمال شرق 67 North-East Kunduz 9 9 10 10 10 9 8 15 11 کندز شمال شرق 78 North-East Takhar 10 10 10 10 10 10 10 10 11 تخار شمال شرق 89 North-East Badakhshan 9 10 10 13 بدخشان شمال شرق 9
10 West Hirat 10 11 11 11 11 11 11 11 10 هرات غرب 1011 West Farah 11 12 12 12 12 12 12 12 10 فراه غرب 1112 West Badghis 8 8 9 12 11 بادغيس غرب 1213 West-Central Ghor 7 9 10 12 8 غور غرب مرکزی 1314 West-Central Bamyan 9 9 10 10 10 10 10 10 11 باميان غرب مرکزی 1415 Central Kabul 10 11 11 11 11 12 12 12 11 کابل مرکزی 1516 Central Parwan 11 11 12 10 11 9 9 12 12 پروان مرکزی 1617 Central Kapisa 13 13 13 13 13 13 14 12 12 کاپيسا مرکزی 1718 Central Logar 11 11 11 11 11 11 12 12 12 لوگر مرکزی 1819 Central Wardak 10 10 11 11 12 13 13 10 12 وردک مرکزی 1920 South Paktya 14 14 14 14 14 14 15 12 11 پکتيا جنوب 2021 South Paktika 14 15 15 پکتيکا جنوب 2122 South Khost 11 11 11 12 12 10 10 9 10 خو.ست جنوب 2223 South Ghazni 12 12 13 16 16 11 11 10 14 غزنی جنوب 2324 East Nangarhar 10 11 12 12 11 7 10 9 12 ننگرهار شرق 2425 East Laghman 15 14 13 12 12 11 11 11 11 لغمان شرق 2526 East Kunarha 11 11 12 11 11 10 10 10 10 کنرها شرق 2627 East Nooristan 20 20 20 18 18 15 15 نورستان شرق 2728 South-West Kandahar 11 12 13 13 14 12 12 12 11 کندهار جنوب غرب 2829 South-West Helmand 10 10 10 8 8 6 7 11 10 هلمند جنوب غرب 2930 South-West Zabul 20 20 15 15 14 15 13 11 زابل جنوب غرب 3031 South-West Nimroz 15 14 13 12 12 9 9 9 10 نيمروز جنوب غرب 3132 South-West Uruzgan 21 21 20 اروزگان جنوب غرب 32
Wheat, localگندم محلی در مارکيت های داخلی ( فی کيلو / به افغانی )
Annex VIRetail market prices of selected agricultural commodities
قيمت های امتعه زراعتی مارکيت های ولايات (Source: FAAHM, MAAHF)
Annex VI: Page 1 of 17

Annex VIRetail market prices of selected agricultural commodities
قيمت های امتعه زراعتی مارکيت های ولايات (Source: FAAHM, MAAHF)
SN Region Province Jan Feb Mar Apr May Jun Jul Aug Sep Oct Nov Dec ولايت منطقه نمبر1 North Faryab 14 14 14 13 12 11 11 13 12 فارياب شمال 12 North Juzjan 10 10 جوزجان شمال 23 North Sar-i-Pul 11 11 10 10 سر پل شمال 34 North Balkh 9 9 9 9 9 9 9 10 8 بلخ شمال 45 North Samangan 8 8 10 سمنگان شمال 56 North- Bughlan 12 12 13 10 9 8 8 9 10 بغلان شمال شرق 67 North- Kunduz 10 9 10 10 کندز شمال شرق 78 North- Takhar 11 تخار شمال شرق 89 North- Badakhshan 10 11 11 بدخشان شمال شرق 9
10 West Hirat 9 10 10 10 10 10 10 10 هرات غرب 1011 West Farah فراه غرب 1112 West Badghis 15 11 بادغيس غرب 1213 West- Ghor غور غرب مرکزی 1314 West- Bamyan 12 12 13 12 11 11 11 14 12 باميان غرب مرکزی 1415 Central Kabul 13 13 14 12 11 11 11 15 14 کابل مرکزی 1516 Central Parwan 13 13 13 12 11 10 10 10 12 پروان مرکزی 1617 Central Kapisa 11 11 11 12 12 کاپيسا مرکزی 1718 Central Logar 10 10 10 10 11 11 11 12 13 لوگر مرکزی 1819 Central Wardak 10 10 11 11 11 11 11 12 11 وردک مرکزی 1920 South Paktya 14 13 پکتيا جنوب 2021 South Paktika 13 14 14 پکتيکا جنوب 2122 South Khost 10 10 خو.ست جنوب 2223 South Ghazni 15 15 15 13 13 9 9 9 غزنی جنوب 2324 East Nangarhar 12 12 12 11 10 10 11 10 ننگرهار شرق 2425 East Laghman 15 14 13 11 لغمان شرق 2526 East Kunarha 11 11 12 10 10 9 9 9 9 کنرها شرق 2627 East Nooristan 11 11 12 10 10 11 11 نورستان شرق 2728 South- Kandahar 11 12 13 کندهار جنوب غرب 2829 South- Helmand 9 9 10 هلمند جنوب غرب 2930 South- Zabul 14 14 20 21 زابل جنوب غرب 3031 South- Nimroz 16 15 15 12 12 9 9 نيمروز جنوب غرب 3132 South- Uruzgan اروزگان جنوب غرب 32
Wheat Imported, best quality (Afs/Kg)گندم وارداتی باکيفيت عالی
Annex VI: Page 2 of 17
Annex VIRetail market prices of selected agricultural commodities
قيمت های امتعه زراعتی مارکيت های ولايات (Source: FAAHM, MAAHF)
SN Region Province Jan Feb Mar Apr May Jun Jul Aug Sep Oct Nov Dec ولايت منطقه نمبر1 North Faryab 13 13 13 13 13 15 15 15 16 فارياب شمال 12 North Juzjan 10 11 11 12 12 14 14 14 14 جوزجان شمال 23 North Sar-i-Pul 9 10 11 11 11 15 15 11 14 سر پل شمال 34 North Balkh 15 14 15 14 14 15 15 15 10 بلخ شمال 45 North Samangan 12 12 12 13 13 15 15 12 14 سمنگان شمال 56 North- Bughlan 12 12 13 11 11 14 14 15 19 بغلان شمال شرق 67 North- Kunduz 13 14 14 14 14 14 14 15 19 کندز شمال شرق 78 North- Takhar 13 13 13 12 12 11 11 11 تخار شمال شرق 89 North- Badakhshan 19 14 15 15 11 بدخشان شمال شرق 9
10 West Hirat 13 14 15 15 15 15 15 14 13 هرات غرب 1011 West Farah 15 16 16 16 11 فراه غرب 1112 West Badghis 10 10 11 16 17 بادغيس غرب 1213 West- Ghor 9 10 11 17 12 غور غرب مرکزی 1314 West- Bamyan 15 15 15 15 15 15 15 15 16 باميان غرب مرکزی 1415 Central Kabul 15 15 16 15 16 17 17 15 15 کابل مرکزی 1516 Central Parwan 15 15 15 16 16 15 15 14 15 پروان مرکزی 1617 Central Kapisa 14 15 16 16 15 14 14 14 14 کاپيسا مرکزی 1718 Central Logar 15 15 15 15 15 14 14 14 14 لوگر مرکزی 1819 Central Wardak 15 15 15 15 15 14 15 14 16 وردک مرکزی 1920 South Paktya 14 14 14 14 14 14 15 17 14 پکتيا جنوب 2021 South Paktika 15 15 16 پکتيکا جنوب 2122 South Khost 13 13 13 20 20 14 14 14 14 خو.ست جنوب 2223 South Ghazni 16 16 17 15 15 14 14 15 15 غزنی جنوب 2324 East Nangarhar 14 13 14 16 14 13 13 14 18 ننگرهار شرق 2425 East Laghman 15 14 14 14 16 لغمان شرق 2526 East Kunarha 18 18 19 15 15 12 12 12 14 کنرها شرق 2627 East Nooristan 14 14 14 13 13 13 13 12 14 نورستان شرق 2728 South- Kandahar 12 13 14 15 15 13 13 15 12 کندهار جنوب غرب 2829 South- Helmand 17 17 17 14 14 9 10 15 14 هلمند جنوب غرب 2930 South- Zabul 60 25 25 15 15 13 14 14 14 زابل جنوب غرب 3031 South- Nimroz 17 16 15 15 16 16 16 15 15 نيمروز جنوب غرب 3132 South- Uruzgan 28 28 25 اروزگان جنوب غرب 32
Wheat Flour, best quality (Afs/Kg)کندم وارداتی با کيفيت عالی
Annex VI: Page 3 of 17

Annex VIRetail market prices of selected agricultural commodities
قيمت های امتعه زراعتی مارکيت های ولايات (Source: FAAHM, MAAHF)
SN Region Province Jan Feb Mar Apr May Jun Jul Aug Sep Oct Nov Dec ولايت منطقه نمبر1 North Faryab 120 140 130 130 130 120 120 120 120 فارياب شمال 12 North Juzjan 110 120 140 130 130 130 130 130 140 جوزجان شمال 23 North Sar-i-Pul 120 120 140 120 120 120 120 سر پل شمال 34 North Balkh 140 145 150 150 150 150 150 140 130 بلخ شمال 45 North Samangan 120 140 150 130 120 سمنگان شمال 56 North- Bughlan 90 100 100 120 150 150 120 بغلان شمال شرق 67 North- Kunduz 100 120 120 120 120 120 120 115 140 کندز شمال شرق 78 North- Takhar 100 100 100 110 110 120 120 115 110 تخار شمال شرق 89 North- Badakhshan 100 120 140 150 بدخشان شمال شرق 9
10 West Hirat 120 130 140 130 130 130 130 120 120 هرات غرب 1011 West Farah 120 130 130 120 120 فراه غرب 1112 West Badghis 90 100 140 100 100 بادغيس غرب 1213 West- Ghor 100 110 120 120 120 غور غرب مرکزی 1314 West- Bamyan 100 100 100 110 110 120 120 120 120 باميان غرب مرکزی 1415 Central Kabul 120 130 130 130 130 140 140 120 120 کابل مرکزی 1516 Central Parwan 110 110 110 120 120 120 120 120 پروان مرکزی 1617 Central Kapisa 120 120 120 120 120 کاپيسا مرکزی 1718 Central Logar 120 120 120 120 120 130 130 120 120 لوگر مرکزی 1819 Central Wardak 110 110 110 120 120 125 125 130 130 وردک مرکزی 1920 South Paktya 110 120 120 120 120 پکتيا جنوب 2021 South Paktika 110 110 120 پکتيکا جنوب 2122 South Khost 95 95 95 100 100 110 110 100 100 خو.ست جنوب 2223 South Ghazni 118 119 120 120 120 115 115 130 100 غزنی جنوب 2324 East Nangarhar 110 110 110 100 110 120 120 120 110 ننگرهار شرق 2425 East Laghman 120 120 120 110 لغمان شرق 2526 East Kunarha 100 100 100 100 100 100 100 100 110 کنرها شرق 2627 East Nooristan 180 180 180 150 150 120 120 نورستان شرق 2728 South- Kandahar 120 120 120 130 130 115 140 کندهار جنوب غرب 2829 South- Helmand 120 120 120 115 118 هلمند جنوب غرب 2930 South- Zabul 125 125 125 100 100 130 110 زابل جنوب غرب 3031 South- Nimroz 140 140 130 130 130 130 130 نيمروز جنوب غرب 3132 South- Uruzgan 120 120 120 اروزگان جنوب غرب 32
Beef (Afs/Kg)گوشت گا و يک کيلو گرام به افغانی
Annex VI: Page 4 of 17

Annex VIRetail market prices of selected agricultural commodities
قيمت های امتعه زراعتی مارکيت های ولايات (Source: FAAHM, MAAHF)
SN Region Province Jan Feb Mar Apr May Jun Jul Aug Sep Oct Nov Dec ولايت منطقه نمبر1 North Faryab 150 160 180 160 160 150 150 150 150 فارياب شمال 12 North Juzjan 120 130 160 160 160 160 160 160 160 جوزجان شمال 23 North Sar-i-Pul 150 160 180 150 150 150 150 سر پل شمال 34 North Balkh 170 175 180 160 160 160 170 170 160 بلخ شمال 45 North Samangan 160 170 180 160 140 سمنگان شمال 56 North-East Bughlan 140 150 150 180 180 180 150 بغلان شمال شرق 67 North-East Kunduz 140 150 160 160 160 225 160 کندز شمال شرق 78 North-East Takhar 140 140 160 150 150 140 140 150 تخار شمال شرق 89 North-East Badakhshan 120 150 170 180 بدخشان شمال شرق 9
10 West Hirat 190 200 200 180 180 170 170 180 160 هرات غرب 1011 West Farah 180 190 200 170 165 فراه غرب 1112 West Badghis 160 170 200 170 130 بادغيس غرب 1213 West- Ghor 120 130 140 140 140 غور غرب مرکزی 1314 West- Bamyan 170 170 170 160 160 160 160 160 160 باميان غرب مرکزی 1415 Central Kabul 160 160 160 175 175 180 180 180 180 کابل مرکزی 1516 Central Parwan 200 180 180 180 180 160 160 160 پروان مرکزی 1617 Central Kapisa 160 150 140 180 160 کاپيسا مرکزی 1718 Central Logar 170 170 170 160 160 150 150 170 160 لوگر مرکزی 1819 Central Wardak 180 200 200 180 180 200 200 185 160 وردک مرکزی 1920 South Paktya 170 165 165 180 180 پکتيا جنوب 2021 South Paktika 160 150 150 پکتيکا جنوب 2122 South Khost 135 135 130 140 140 160 160 150 140 خو.ست جنوب 2223 South Ghazni 150 160 160 200 200 155 155 170 130 غزنی جنوب 2324 East Nangarhar 140 140 140 150 150 150 180 180 140 ننگرهار شرق 2425 East Laghman 150 150 150 150 لغمان شرق 2526 East Kunarha 150 150 150 150 150 160 160 140 170 کنرها شرق 2627 East Nooristan 200 200 200 170 170 150 150 نورستان شرق 2728 South- Kandahar 177 177 185 200 200 215 188 کندهار جنوب غرب 2829 South- Helmand 180 180 180 165 165 150 170 هلمند جنوب غرب 2930 South- Zabul 175 175 175 220 220 170 180 زابل جنوب غرب 3031 South- Nimroz 195 190 185 170 170 170 170 نيمروز جنوب غرب 3132 South- Uruzgan 200 200 222 اروزگان جنوب غرب 32
Mutton / Lamb (Afs/Kg)گوشت گوسفند کيلو گرام / افغانی
Annex VI: Page 5 of 17
Annex VIRetail market prices of selected agricultural commodities
قيمت های امتعه زراعتی مارکيت های ولايات (Source: FAAHM, MAAHF)
SN Region Province Jan Feb Mar Apr May Jun Jul Aug Sep Oct Nov Dec ولايت منطقه نمبر1 North Faryab 70 70 90 80 80 75 75 Aug 75 فارياب شمال 12 North Juzjan 80 80 80 80 80 80 80 80 80 جوزجان شمال 23 North Sar-i-Pul 70 75 80 85 85 80 75 سر پل شمال 34 North Balkh 65 70 80 85 80 80 85 90 90 بلخ شمال 45 North Samangan 75 80 80 85 80 سمنگان شمال 56 North-East Bughlan 60 70 90 90 90 85 80 بغلان شمال شرق 67 North-East Kunduz 70 80 90 90 90 90 کندز شمال شرق 78 North-East Takhar 70 70 90 90 90 90 90 75 تخار شمال شرق 89 North-East Badakhshan 80 90 90 بدخشان شمال شرق 9
10 West Hirat 70 70 80 75 هرات غرب 1011 West Farah 80 90 100 80 فراه غرب 1112 West Badghis 65 70 70 75 بادغيس غرب 1213 West- Ghor 70 70 80 غور غرب مرکزی 1314 West- Bamyan 130 130 130 120 120 110 110 90 110 باميان غرب مرکزی 1415 Central Kabul 70 70 85 85 85 80 90 75 90 کابل مرکزی 1516 Central Parwan 70 65 60 75 75 75 75 75 پروان مرکزی 1617 Central Kapisa 80 75 75 60 کاپيسا مرکزی 1718 Central Logar 80 80 90 90 90 85 85 90 90 لوگر مرکزی 1819 Central Wardak 70 70 70 75 75 80 80 80 75 وردک مرکزی 1920 South Paktya 90 90 90 75 پکتيا جنوب 2021 South Paktika 90 90 90 85 پکتيکا جنوب 2122 South Khost 85 85 85 85 85 85 85 85 100 خو.ست جنوب 2223 South Ghazni 80 80 80 95 95 90 90 85 90 غزنی جنوب 2324 East Nangarhar 85 85 85 85 85 85 80 85 100 ننگرهار شرق 2425 East Laghman 70 70 70 90 لغمان شرق 2526 East Kunarha 80 80 80 100 100 120 120 80 80 کنرها شرق 2627 East Nooristan 100 100 100 90 90 90 90 نورستان شرق 2728 South-West Kandahar 70 70 70 70 70 85 75 کندهار جنوب غرب 2829 South-West Helmand 70 70 70 70 70 85 75 هلمند جنوب غرب 2930 South-West Zabul 70 70 70 85 85 85 80 زابل جنوب غرب 3031 South-West Nimroz 75 70 70 70 70 70 70 نيمروز جنوب غرب 3132 South-West Uruzgan 85 85 85 اروزگان جنوب غرب 32
Chicken (Afs/Kg)گوشت مرغ کيلو گرام / افغانی
Annex VI: Page 6 of 17

Annex VIRetail market prices of selected agricultural commodities
قيمت های امتعه زراعتی مارکيت های ولايات (Source: FAAHM, MAAHF)
SN Region Province Jan Feb Mar Apr May Jun Jul Aug Sep Oct Nov Dec ولايت منطقه نمبر1 North Faryab 25 25 25 25 25 26 26 32 32 فارياب شمال 12 North Juzjan 17 20 23 25 25 28 28 28 31 جوزجان شمال 23 North Sar-i-Pul 23 23 23 23 23 31 26 سر پل شمال 34 North Balkh 30 30 35 25 25 25 23 22 31 بلخ شمال 45 North Samangan 20 20 20 24 28 سمنگان شمال 56 North-East Bughlan 18 20 21 20 20 22 20 بغلان شمال شرق 67 North-East Kunduz 20 22 22 19 19 31 کندز شمال شرق 78 North-East Takhar 18 20 20 20 20 20 20 32 تخار شمال شرق 89 North-East Badakhshan 20 20 20 بدخشان شمال شرق 9
10 West Hirat 24 25 25 25 25 20 19 28 هرات غرب 1011 West Farah فراه غرب 1112 West Badghis بادغيس غرب 1213 West-Central Ghor غور غرب مرکزی 1314 West-Central Bamyan 25 25 25 26 26 26 26 17 30 باميان غرب مرکزی 1415 Central Kabul 21 23 34 20 24 کابل مرکزی 1516 Central Parwan 17 17 17 24 25 26 26 پروان مرکزی 1617 Central Kapisa 16 16 16 17 15 کاپيسا مرکزی 1718 Central Logar 25 25 31 32 لوگر مرکزی 1819 Central Wardak 28 32 وردک مرکزی 1920 South Paktya 17 17 17 24 پکتيا جنوب 2021 South Paktika پکتيکا جنوب 2122 South Khost 20 20 20 20 20 20 خو.ست جنوب 2223 South Ghazni 25 25 25 23 23 20 غزنی جنوب 2324 East Nangarhar 14 14 14 16 14 14 14 18 23 ننگرهار شرق 2425 East Laghman 23 24 23 لغمان شرق 2526 East Kunarha 25 25 25 30 30 30 30 30 30 کنرها شرق 2627 East Nooristan 16 16 16 15 15 18 18 20 20 نورستان شرق 2728 South-West Kandahar 25 25 25 25 25 25 25 25 25 کندهار جنوب غرب 2829 South-West Helmand 25 25 25 25 25 25 25 25 25 هلمند جنوب غرب 2930 South-West Zabul 28 28 28 28 28 28 28 28 28 زابل جنوب غرب 3031 South-West Nimroz نيمروز جنوب غرب 3132 South-West Uruzgan اروزگان جنوب غرب 32
Rice Local (Afs/Kg)برنج محلی کيلو گرام /افغانی
Annex VI: Page 7 of 17

Annex VIRetail market prices of selected agricultural commodities
قيمت های امتعه زراعتی مارکيت های ولايات (Source: FAAHM, MAAHF)
SN Region Province Jan Feb Mar Apr May Jun Jul Aug Sep Oct Nov Dec ولايت منطقه نمبر1 North Faryab 32 32 32 32 32 31 31 32 33 فارياب شمال 12 North Juzjan 28 32 35 35 35 35 35 35 33 جوزجان شمال 23 North Sar-i-Pul 32 32 32 33 33 33 سر پل شمال 34 North Balkh 35 35 36 33 33 33 33 33 33 بلخ شمال 45 North Samangan 32 35 35 31 32 سمنگان شمال 56 North-East Bughlan 32 32 32 35 35 35 23 بغلان شمال شرق 67 North-East Kunduz 32 32 32 30 30 30 33 کندز شمال شرق 78 North-East Takhar 35 تخار شمال شرق 89 North-East Badakhshan 33 33 33 بدخشان شمال شرق 9
10 West Hirat 30 30 30 34 34 هرات غرب 1011 West Farah 30 30 30 35 فراه غرب 1112 West Badghis 35 35 36 35 35 بادغيس غرب 1213 West-Central Ghor 35 35 36 35 35 غور غرب مرکزی 1314 West-Central Bamyan 35 35 35 37 37 40 40 35 37 باميان غرب مرکزی 1415 Central Kabul 34 34 34 28 35 33 33 35 31 کابل مرکزی 1516 Central Parwan 33 33 33 32 32 31 31 30 پروان مرکزی 1617 Central Kapisa 31 31 31 33 34 کاپيسا مرکزی 1718 Central Logar 31 31 31 35 35 35 35 30 32 لوگر مرکزی 1819 Central Wardak 30 30 30 31 31 32 32 35 35 وردک مرکزی 1920 South Paktya 29 29 31 28 29 پکتيا جنوب 2021 South Paktika 35 35 35 پکتيکا جنوب 2122 South Khost 32 32 33 35 35 35 35 30 30 خو.ست جنوب 2223 South Ghazni 30 30 41 31 31 34 غزنی جنوب 2324 East Nangarhar 33 33 33 33 31 31 31 30 27 ننگرهار شرق 2425 East Laghman 32 32 32 لغمان شرق 2526 East Kunarha 36 36 36 35 35 35 35 35 35 کنرها شرق 2627 East Nooristan 40 40 40 35 35 32 32 نورستان شرق 2728 South-West Kandahar 40 40 40 35 35 30 36 کندهار جنوب غرب 2829 South-West Helmand 42 42 42 30 30 36 31 هلمند جنوب غرب 2930 South-West Zabul 32 32 32 31 31 32 33 زابل جنوب غرب 3031 South-West Nimroz 32 31 31 36 36 36 36 نيمروز جنوب غرب 3132 South-West Uruzgan 43 41 41 اروزگان جنوب غرب 32
Rice Imported (Afs/Kg)برنج وارداتی کيلو گرام /افغانی
Annex VI: Page 8 of 17

Annex VIRetail market prices of selected agricultural commodities
قيمت های امتعه زراعتی مارکيت های ولايات (Source: FAAHM, MAAHF)
SN Region Province Jan Feb Mar Apr May Jun Jul Aug Sep Oct Nov Dec ولايت منطقه نمبر1 North Faryab 14 14 14 14 14 14 14 فارياب شمال 12 North Juzjan 9 9 12 11 11 11 11 11 12 جوزجان شمال 23 North Sar-i-Pul 11 11 12 11 11 11 11 13 سر پل شمال 34 North Balkh 11 11 11 11 11 11 11 11 11 بلخ شمال 45 North Samangan 10 10 10 11 سمنگان شمال 56 North-East Bughlan 11 10 10 10 بغلان شمال شرق 67 North-East Kunduz 13 13 13 12 کندز شمال شرق 78 North-East Takhar 13 13 13 13 13 13 13 تخار شمال شرق 89 North-East Badakhshan 13 10 10 بدخشان شمال شرق 9
10 West Hirat 17 17 17 13 هرات غرب 1011 West Farah 16 16 16 13 فراه غرب 1112 West Badghis 11 11 11 13 بادغيس غرب 1213 West-Central Ghor 10 10 10 13 غور غرب مرکزی 1314 West-Central Bamyan 13 13 13 14 14 14 14 14 باميان غرب مرکزی 1415 Central Kabul 13 13 14 29 25 22 22 15 کابل مرکزی 1516 Central Parwan 20 20 22 15 15 15 15 پروان مرکزی 1617 Central Kapisa 16 16 16 کاپيسا مرکزی 1718 Central Logar 34 33 33 15 15 15 15 15 لوگر مرکزی 1819 Central Wardak 20 20 22 20 20 20 20 15 وردک مرکزی 1920 South Paktya 17 16 15 پکتيا جنوب 2021 South Paktika 16 16 پکتيکا جنوب 2122 South Khost 13 13 13 15 25 18 18 13 خو.ست جنوب 2223 South Ghazni 20 20 20 17 17 13 غزنی جنوب 2324 East Nangarhar 14 10 10 16 16 15 15 15 ننگرهار شرق 2425 East Laghman 19 19 19 لغمان شرق 2526 East Kunarha 12 11 11 11 11 10 10 کنرها شرق 2627 East Nooristan نورستان شرق 2728 South-West Kandahar 17 17 17 15 15 13 کندهار جنوب غرب 2829 South-West Helmand 12 11 11 14 14 12 هلمند جنوب غرب 2930 South-West Zabul 20 20 21 زابل جنوب غرب 3031 South-West Nimroz 18 18 18 17 17 17 17 نيمروز جنوب غرب 3132 South-West Uruzgan 30 30 25 اروزگان جنوب غرب 32
Best Quality Wheat Seed (Afs/Kg)تخم گندم با کيفيت عالی کيلو گرام / افغانی
Annex VI: Page 9 of 17

Annex VIRetail market prices of selected agricultural commodities
قيمت های امتعه زراعتی مارکيت های ولايات (Source: FAAHM, MAAHF)
SN Region Province Jan Feb Mar Apr May Jun Jul Aug Sep Oct Nov Dec ولايت منطقه نمبر1 North Faryab 8 8 8 فارياب شمال 12 North Juzjan 8 9 10 11 جوزجان شمال 23 North Sar-i-Pul 10 11 11 10 10 11 سر پل شمال 34 North Balkh 8 8 8 10 10 10 10 10 11 بلخ شمال 45 North Samangan 9 10 10 11 سمنگان شمال 56 North-East Bughlan 10 10 10 10 بغلان شمال شرق 67 North-East Kunduz 11 11 11 11 کندز شمال شرق 78 North-East Takhar 11 11 11 12 12 12 12 تخار شمال شرق 89 North-East Badakhshan 12 10 10 بدخشان شمال شرق 9
10 West Hirat 14 15 15 12 هرات غرب 1011 West Farah 14 15 15 11 فراه غرب 1112 West Badghis 9 9 9 11 بادغيس غرب 1213 West-Central Ghor 9 9 10 غور غرب مرکزی 1314 West-Central Bamyan 10 10 10 13 باميان غرب مرکزی 1415 Central Kabul 11 11 11 25 22 13 کابل مرکزی 1516 Central Parwan پروان مرکزی 1617 Central Kapisa 14 14 14 13 کاپيسا مرکزی 1718 Central Logar 20 20 20 15 15 15 15 15 لوگر مرکزی 1819 Central Wardak 14 وردک مرکزی 1920 South Paktya 16 16 15 پکتيا جنوب 2021 South Paktika 15 15 15 پکتيکا جنوب 2122 South Khost 13 13 13 15 20 15 15 23 خو.ست جنوب 2223 South Ghazni 18 18 18 13 13 31 غزنی جنوب 2324 East Nangarhar 14 10 10 14 14 14 14 14 15 ننگرهار شرق 2425 East Laghman لغمان شرق 2526 East Kunarha 11 11 11 11 11 10 10 کنرها شرق 2627 East Nooristan 16 16 16 17 17 17 17 نورستان شرق 2728 South-West Kandahar 12 13 13 14 14 12 کندهار جنوب غرب 2829 South-West Helmand 11 11 10 10 10 10 هلمند جنوب غرب 2930 South-West Zabul 25 25 25 14 14 21 زابل جنوب غرب 3031 South-West Nimroz 17 17 16 16 17 17 17 نيمروز جنوب غرب 3132 South-West Uruzgan 28 28 22 اروزگان جنوب غرب 32
Improved variety wheat seed (Afs/Kg)تخم اصلاح شده گندم افغانی /کيلو گرام
Annex VI: Page 10 of 17

Annex VIRetail market prices of selected agricultural commodities
قيمت های امتعه زراعتی مارکيت های ولايات (Source: FAAHM, MAAHF)
SN Region Province Jan Feb Mar Apr May Jun Jul Aug Sep Oct Nov Dec ولايت منطقه نمبر1 North Faryab 150 150 180 200 200 240 240 250 فارياب شمال 12 North Juzjan 140 140 200 150 150 150 150 150 150 جوزجان شمال 23 North Sar-i-Pul 120 150 200 200 250 180 سر پل شمال 34 North Balkh 180 200 230 130 150 150 200 200 200 بلخ شمال 45 North Samangan 120 120 150 200 200 سمنگان شمال 56 North-East Bughlan 130 120 150 150 180 180 بغلان شمال شرق 67 North-East Kunduz 130 130 150 130 130 180 کندز شمال شرق 78 North-East Takhar 100 100 120 130 130 130 130 200 تخار شمال شرق 89 North-East Badakhshan 120 120 120 بدخشان شمال شرق 9
10 West Hirat 150 140 150 180 هرات غرب 1011 West Farah 200 200 200 200 فراه غرب 1112 West Badghis 100 100 110 150 بادغيس غرب 1213 West-Central Ghor 100 100 150 200 غور غرب مرکزی 1314 West-Central Bamyan 200 200 200 150 150 150 150 190 باميان غرب مرکزی 1415 Central Kabul 180 180 200 200 200 180 180 200 170 کابل مرکزی 1516 Central Parwan 200 200 200 150 200 175 175 پروان مرکزی 1617 Central Kapisa 200 200 250 200 کاپيسا مرکزی 1718 Central Logar 200 200 200 180 180 180 180 180 200 لوگر مرکزی 1819 Central Wardak 200 200 200 200 200 200 200 200 وردک مرکزی 1920 South Paktya 170 170 170 180 پکتيا جنوب 2021 South Paktika 180 180 180 پکتيکا جنوب 2122 South Khost 160 160 150 150 200 200 خو.ست جنوب 2223 South Ghazni 120 120 150 150 150 200 200 200 غزنی جنوب 2324 East Nangarhar 150 150 150 150 150 150 150 140 120 ننگرهار شرق 2425 East Laghman 160 160 160 150 لغمان شرق 2526 East Kunarha 120 120 120 120 120 120 120 200 کنرها شرق 2627 East Nooristan 150 150 150 150 150 150 150 نورستان شرق 2728 South-West Kandahar 150 150 150 150 150 200 200 200 200 کندهار جنوب غرب 2829 South-West Helmand 150 150 150 200 200 200 200 200 200 هلمند جنوب غرب 2930 South-West Zabul 160 160 160 200 200 200 200 200 200 زابل جنوب غرب 3031 South-West Nimroz 225 250 250 250 300 300 300 200 200 نيمروز جنوب غرب 3132 South-West Uruzgan 200 200 200 اروزگان جنوب غرب 32
Agriculture Labour (Afs/Day)کارگر زراعتی افغانی / کيلو گرام
Annex VI: Page 11 of 17

Annex VIRetail market prices of selected agricultural commodities
قيمت های امتعه زراعتی مارکيت های ولايات (Source: FAAHM, MAAHF)
SN Region Province Jan Feb Mar Apr May Jun Jul Aug Sep Oct Nov Dec ولايت منطقه نمبر1 North Faryab 400 400 400 350 350 350 350 400 فارياب شمال 12 North Juzjan 600 500 600 600 600 600 600 100 جوزجان شمال 23 North Sar-i-Pul 200 300 350 350 350 400 سر پل شمال 34 North Balkh 700 800 1000 600 600 600 600 600 700 بلخ شمال 45 North Samangan 400 400 500 500 سمنگان شمال 56 North-East Bughlan 450 400 400 600 600 600 بغلان شمال شرق 67 North-East Kunduz 450 400 400 500 کندز شمال شرق 78 North-East Takhar 350 350 350 350 350 300 300 تخار شمال شرق 89 North-East Badakhshan بدخشان شمال شرق 9
10 West Hirat 500 400 هرات غرب 1011 West Farah 400 400 400 200 فراه غرب 1112 West Badghis 350 200 بادغيس غرب 1213 West-Central Ghor 600 700 500 غور غرب مرکزی 1314 West-Central Bamyan 600 600 850 باميان غرب مرکزی 1415 Central Kabul 500 500 500 400 400 500 500 800 500 کابل مرکزی 1516 Central Parwan 500 500 500 500 500 350 350 پروان مرکزی 1617 Central Kapisa 500 500 450 500 کاپيسا مرکزی 1718 Central Logar 300 300 300 500 500 700 700 900 1000 لوگر مرکزی 1819 Central Wardak 500 500 500 450 450 450 450 600 وردک مرکزی 1920 South Paktya پکتيا جنوب 2021 South Paktika پکتيکا جنوب 2122 South Khost خو.ست جنوب 2223 South Ghazni 650 650 500 غزنی جنوب 2324 East Nangarhar 500 500 500 350 350 350 400 400 400 ننگرهار شرق 2425 East Laghman 500 500 500 500 لغمان شرق 2526 East Kunarha 250 250 250 200 200 200 200 450 کنرها شرق 2627 East Nooristan 300 300 300 300 300 نورستان شرق 2728 South-West Kandahar کندهار جنوب غرب 2829 South-West Helmand هلمند جنوب غرب 2930 South-West Zabul 500 500 500 750 زابل جنوب غرب 3031 South-West Nimroz نيمروز جنوب غرب 3132 South-West Uruzgan 600 600 600 اروزگان جنوب غرب 32
Pair of Oxen Hiring (Afs/Day)قلبه گاو افغانی در روز
Annex VI: Page 12 of 17

Annex VIRetail market prices of selected agricultural commodities
قيمت های امتعه زراعتی مارکيت های ولايات (Source: FAAHM, MAAHF)
SN Region Province Jan Feb Mar Apr May Jun Jul Aug Sep Oct Nov Dec ولايت منطقه نمبر1 North Faryab 250 250 250 200 200 200 200 فارياب شمال 12 North Juzjan 250 250 300 200 200 200 200 200 200 جوزجان شمال 23 North Sar-i-Pul 100 120 200 سر پل شمال 34 North Balkh 200 250 300 500 500 500 300 200 200 بلخ شمال 45 North Samangan 150 200 250 سمنگان شمال 56 North-East Bughlan 200 بغلان شمال شرق 67 North-East Kunduz کندز شمال شرق 78 North-East Takhar تخار شمال شرق 89 North-East Badakhshan بدخشان شمال شرق 9
10 West Hirat 150 200 هرات غرب 1011 West Farah 80 80 80 70 فراه غرب 1112 West Badghis بادغيس غرب 1213 West-Central Ghor 100 250 غور غرب مرکزی 1314 West-Central Bamyan 170 170 باميان غرب مرکزی 1415 Central Kabul 120 90 90 120 120 200 100 کابل مرکزی 1516 Central Parwan 120 120 120 200 200 پروان مرکزی 1617 Central Kapisa 350 350 350 400 کاپيسا مرکزی 1718 Central Logar 170 150 150 150 150 150 150 150 170 لوگر مرکزی 1819 Central Wardak 120 120 120 120 120 120 120 90 وردک مرکزی 1920 South Paktya 180 پکتيا جنوب 2021 South Paktika 250 250 250 پکتيکا جنوب 2122 South Khost 200 400 420 250 250 260 خو.ست جنوب 2223 South Ghazni 150 150 150 150 غزنی جنوب 2324 East Nangarhar 200 200 200 70 70 70 80 80 100 ننگرهار شرق 2425 East Laghman لغمان شرق 2526 East Kunarha 200 200 200 200 200 200 200 کنرها شرق 2627 East Nooristan نورستان شرق 2728 South-West Kandahar 300 300 300 120 120 کندهار جنوب غرب 2829 South-West Helmand 200 200 200 150 150 240 هلمند جنوب غرب 2930 South-West Zabul 300 زابل جنوب غرب 3031 South-West Nimroz نيمروز جنوب غرب 3132 South-West Uruzgan اروزگان جنوب غرب 32
Service Charge for Water Pump (Afs/Hour)قيمت واتر پمپ فی ساعت
Annex VI: Page 13 of 17

Annex VIRetail market prices of selected agricultural commodities
قيمت های امتعه زراعتی مارکيت های ولايات (Source: FAAHM, MAAHF)
SN Region Province Jan Feb Mar Apr May Jun Jul Aug Sep Oct Nov Dec ولايت منطقه نمبر1 North Faryab 12 12 12 14 14 14 14 14 فارياب شمال 12 North Juzjan 10 10 10 11 11 12 12 14 جوزجان شمال 23 North Sar-i-Pul 11 11 11 13 13 12 13 سر پل شمال 34 North Balkh 12 12 12 10 10 10 10 10 13 بلخ شمال 45 North Samangan 12 12 12 13 13 سمنگان شمال 56 North-East Bughlan 11 12 12 12 12 10 15 بغلان شمال شرق 67 North-East Kunduz 12 12 13 11 11 12 کندز شمال شرق 78 North-East Takhar 9 11 11 10 10 10 10 13 تخار شمال شرق 89 North-East Badakhshan 14 14 15 12 بدخشان شمال شرق 9
10 West Hirat 7 7 هرات غرب 1011 West Farah فراه غرب 1112 West Badghis بادغيس غرب 1213 West-Central Ghor غور غرب مرکزی 1314 West-Central Bamyan 14 14 14 14 باميان غرب مرکزی 1415 Central Kabul 11 11 11 12 11 کابل مرکزی 1516 Central Parwan 10 10 10 12 12 14 14 11 پروان مرکزی 1617 Central Kapisa 13 کاپيسا مرکزی 1718 Central Logar 12 12 لوگر مرکزی 1819 Central Wardak 12 وردک مرکزی 1920 South Paktya پکتيا جنوب 2021 South Paktika پکتيکا جنوب 2122 South Khost 12 12 خو.ست جنوب 2223 South Ghazni 11 غزنی جنوب 2324 East Nangarhar ننگرهار شرق 2425 East Laghman لغمان شرق 2526 East Kunarha کنرها شرق 2627 East Nooristan 18 18 16 16 16 16 16 نورستان شرق 2728 South-West Kandahar 10 11 13 11 کندهار جنوب غرب 2829 South-West Helmand هلمند جنوب غرب 2930 South-West Zabul زابل جنوب غرب 3031 South-West Nimroz نيمروز جنوب غرب 3132 South-West Uruzgan اروزگان جنوب غرب 32
Local Urea (Afs/Kg)يوريا محلی افغانی /کيلو گرام
Annex VI: Page 14 of 17

Annex VIRetail market prices of selected agricultural commodities
قيمت های امتعه زراعتی مارکيت های ولايات (Source: FAAHM, MAAHF)
SN Region Province Jan Feb Mar Apr May Jun Jul Aug Sep Oct Nov Dec ولايت منطقه نمبر1 North Faryab 10 10 10 12 12 12 12 12 13 فارياب شمال 12 North Juzjan 6 7 8 9 جوزجان شمال 23 North Sar-i-Pul 10 10 10 12 12 11 سر پل شمال 34 North Balkh 7 7 7 7 7 8 8 9 9 بلخ شمال 45 North Samangan 12 12 12 9 سمنگان شمال 56 North-East Bughlan 12 10 بغلان شمال شرق 67 North-East Kunduz 10 11 کندز شمال شرق 78 North-East Takhar 13 12 12 11 11 11 11 13 تخار شمال شرق 89 North-East Badakhshan 14 14 15 12 بدخشان شمال شرق 9
10 West Hirat 10 10 11 11 12 هرات غرب 1011 West Farah 12 13 13 14 16 فراه غرب 1112 West Badghis 12 12 13 12 بادغيس غرب 1213 West-Central Ghor 12 12 12 14 12 غور غرب مرکزی 1314 West-Central Bamyan 14 14 14 13 13 13 13 12 12 باميان غرب مرکزی 1415 Central Kabul 11 12 12 11 11 12 12 کابل مرکزی 1516 Central Parwan 9 10 10 13 13 15 15 12 پروان مرکزی 1617 Central Kapisa 12 12 13 15 13 کاپيسا مرکزی 1718 Central Logar 11 11 11 12 12 13 13 12 12 لوگر مرکزی 1819 Central Wardak 11 11 11 12 12 12 12 12 12 وردک مرکزی 1920 South Paktya 11 پکتيا جنوب 2021 South Paktika 11 12 12 پکتيکا جنوب 2122 South Khost 12 11 11 15 15 12 12 11 11 خو.ست جنوب 2223 South Ghazni 9 10 11 15 12 غزنی جنوب 2324 East Nangarhar 14 14 12 11 11 11 10 10 10 ننگرهار شرق 2425 East Laghman 12 12 12 لغمان شرق 2526 East Kunarha 12 12 12 12 12 12 12 12 12 کنرها شرق 2627 East Nooristan 20 20 21 22 22 23 23 نورستان شرق 2728 South-West Kandahar 11 12 13 13 13 10 12 کندهار جنوب غرب 2829 South-West Helmand 12 13 14 12 12 12 12 هلمند جنوب غرب 2930 South-West Zabul 15 15 17 12 12 16 11 زابل جنوب غرب 3031 South-West Nimroz 12 12 12 10 10 9 9 نيمروز جنوب غرب 3132 South-West Uruzgan 12 12 14 اروزگان جنوب غرب 32
Urea Imported, best quality (Afs/Kg)يوريا وارداتی باکيقيت افغانی / کيلو گرام
Annex VI: Page 15 of 17

Annex VIRetail market prices of selected agricultural commodities
قيمت های امتعه زراعتی مارکيت های ولايات (Source: FAAHM, MAAHF)
SN Region Province Jan Feb Mar Apr May Jun Jul Aug Sep Oct Nov Dec ولايت منطقه نمبر1 North Faryab 10 10 10 9 9 9 9 10 14 فارياب شمال 12 North Juzjan 10 10 10 9 جوزجان شمال 23 North Sar-i-Pul 14 14 14 11 11 12 21 سر پل شمال 34 North Balkh 16 16 16 16 16 15 10 8 15 بلخ شمال 45 North Samangan 10 10 10 18 سمنگان شمال 56 North-East Bughlan 18 18 18 20 20 30 24 بغلان شمال شرق 67 North-East Kunduz 18 18 18 18 18 10 22 کندز شمال شرق 78 North-East Takhar 18 18 18 12 12 12 12 25 تخار شمال شرق 89 North-East Badakhshan 23 23 23 بدخشان شمال شرق 9
10 West Hirat 24 24 24 24 24 24 24 24 22 هرات غرب 1011 West Farah 25 25 25 26 26 فراه غرب 1112 West Badghis 25 26 26 16 17 بادغيس غرب 1213 West-Central Ghor 26 26 26 24 21 غور غرب مرکزی 1314 West-Central Bamyan 18 18 18 20 20 25 25 23 23 باميان غرب مرکزی 1415 Central Kabul 19 20 20 24 24 23 23 22 24 کابل مرکزی 1516 Central Parwan 17 18 18 26 25 25 25 14 پروان مرکزی 1617 Central Kapisa 22 22 22 22 22 کاپيسا مرکزی 1718 Central Logar 25 25 27 25 25 25 25 22 22 لوگر مرکزی 1819 Central Wardak 20 20 20 22 22 22 22 24 24 وردک مرکزی 1920 South Paktya 18 20 29 22 پکتيا جنوب 2021 South Paktika 25 26 28 پکتيکا جنوب 2122 South Khost 20 25 27 25 25 22 22 20 21 خو.ست جنوب 2223 South Ghazni 23 23 25 26 26 24 24 22 24 غزنی جنوب 2324 East Nangarhar 19 18 17 21 21 20 20 22 18 ننگرهار شرق 2425 East Laghman 21 22 22 22 لغمان شرق 2526 East Kunarha 24 24 24 25 25 25 25 25 23 کنرها شرق 2627 East Nooristan 26 26 26 26 26 نورستان شرق 2728 South-West Kandahar 20 22 23 24 24 20 26 کندهار جنوب غرب 2829 South-West Helmand 23 23 25 24 24 20 22 هلمند جنوب غرب 2930 South-West Zabul 20 20 20 22 22 20 21 زابل جنوب غرب 3031 South-West Nimroz 17 17 17 16 16 15 15 نيمروز جنوب غرب 3132 South-West Uruzgan 21 21 24 اروزگان جنوب غرب 32
Best Quality DAP (Afs/Kg)دی ای پی با کيفيت کيو گرام / افغانی
Annex VI: Page 16 of 17

Annex VIRetail market prices of selected agricultural commodities
قيمت های امتعه زراعتی مارکيت های ولايات (Source: FAAHM, MAAHF)
SN Region Province Jan Feb Mar Apr May Jun Jul Aug Sep Oct Nov Dec ولايت منطقه نمبر1 North Faryab 420 420 600 فارياب شمال 12 North Juzjan 400 400 400 جوزجان شمال 23 North Sar-i-Pul 450 450 500 سر پل شمال 34 North Balkh 400 600 600 500 500 500 بلخ شمال 45 North Samangan 670 سمنگان شمال 56 North-East Bughlan 500 500 450 بغلان شمال شرق 67 North-East Kunduz 500 500 500 کندز شمال شرق 78 North-East Takhar 400 400 400 550 تخار شمال شرق 89 North-East Badakhshan بدخشان شمال شرق 9
10 West Hirat 600 هرات غرب 1011 West Farah 450 فراه غرب 1112 West Badghis 470 بادغيس غرب 1213 West-Central Ghor 700 غور غرب مرکزی 1314 West-Central Bamyan 400 400 750 باميان غرب مرکزی 1415 Central Kabul 350 350 350 350 350 350 350 300 کابل مرکزی 1516 Central Parwan 300 300 430 450 300 250 250 پروان مرکزی 1617 Central Kapisa 600 کاپيسا مرکزی 1718 Central Logar 300 300 300 350 350 370 370 400 400 لوگر مرکزی 1819 Central Wardak 600 وردک مرکزی 1920 South Paktya 200 250 300 پکتيا جنوب 2021 South Paktika پکتيکا جنوب 2122 South Khost 200 300 350 360 400 350 350 345 خو.ست جنوب 2223 South Ghazni 400 400 500 450 450 650 650 450 غزنی جنوب 2324 East Nangarhar 500 500 500 400 400 400 400 400 400 ننگرهار شرق 2425 East Laghman 500 500 500 400 لغمان شرق 2526 East Kunarha 500 500 500 250 250 250 250 750 کنرها شرق 2627 East Nooristan نورستان شرق 2728 South-West Kandahar 300 300 400 کندهار جنوب غرب 2829 South-West Helmand 400 400 500 هلمند جنوب غرب 2930 South-West Zabul 500 زابل جنوب غرب 3031 South-West Nimroz نيمروز جنوب غرب 3132 South-West Uruzgan اروزگان جنوب غرب 32
Tractor Hiring Charge (Afs/Hour)تراکتور افغانی /ساغت
Annex VI: Page 17 of 17

Location Commodity/ServiceWeek 1 Week 2 Week 3 Week 4 Week 1 Week 2 Weeek 3 Week 4 Week 1 Week 2 Weeek 3 Week 4
Kabul Wheat (kg) 12.5 13.0 13.0 13.5 13.5 13.3 13.2 13.2 13.0 13.0 13.0 12.7Kandahar Wheat (kg) 10.6 10.6 10.0 10.0 10.0 11.1 11.1 11.2 11.2 11.2 11.2 10.9Jalalabad Wheat (kg) 9.0 9.0 9.0 9.0 9.3 9.3 9.3 9.7 9.7 10.0 10.0 10.0Heart Wheat (kg) 10.3 10.2 10.0 10.0 10.0 10.0 10.0 10.0 10.3 10.5 11.0 10.8Mazar Wheat (kg) 10.0 9.5 9.0 9.5 9.0 10.0 10.0 10.0 10.0 10.0 10.0 10.0Faizabad Wheat (kg) 11.4 11.4 11.4 11.4 11.4 12.1 10.0 11.4 11.4 11.4 12.1 12.0Bamyan Wheat (kg) 12.3 12.0 12.0 12.0 10.0 11.0 10.0 11.0 10.5 10.2 11.0Maimana Wheat (kg) 10.0 10.0 10.0 10.0 11.0 11.0 11.5 12.0 12.0 12.0 12.0 12.5Kabul Wheat flour (kg) 14.1 14.1 14.1 14.1 14.3 14.2 14.0 14.0 13.8 13.6 13.6 13.5Kandahar Wheat flour (kg) 12.6 12.6 12.6 12.8 12.9 12.6 12.5 12.4 12.4 12.4 12.6 12.6Jalalabad Wheat flour (kg) 12.8 12.8 12.8 12.8 13.0 13.2 13.2 13.3 13.3 13.3 13.3 13.3Heart Wheat flour (kg) 13.8 13.8 13.8 14.0 14.5 14.4 14.4 14.3 14.5 13.6 13.6 14.5Mazar Wheat flour (kg) 11.0 11.0 11.0 11.5 11.0 12.0 12.0 12.0 12.0 12.5 12.0 12.0Faizabad Wheat flour (kg) 14.3 12.9 14.2 14.2 14.3 13.6 14.3 14.8 15.7 15.7 15.0 15.0Bamyan Wheat flour (kg) 14.3 14.0 14.1 14.0 14.0 14.0 14.0 13.8 14.2 14.0 14.0Maimana Wheat flour (kg) 13.5 13.5 14.0 14.0 13.0 14.0 14.5 14.5 13.5 14.0 14.0 14.5Kabul Bread (kg) 18.0 18.0 18.0 30.0 18.0 18.0 18.0 18.0 18.0 18.0 18.0 18.0Kandahar Bread (kg) 20.0 20.0 20.0 20.0 20.0 20.0 20.0 20.0 20.0 20.0 20.0 20.0Jalalabad Bread (kg) 17.6 17.6 17.6 17.6 17.6 17.6 17.6 17.6 17.6 17.6 17.6 17.6Heart Bread (kg) 20.0 20.0 20.0 20.0 20.0 20.0 20.0 20.0 20.0 20.0 20.0 20.0Mazar Bread (kg) 20.0 20.0 20.0 20.0 20.0 20.0 20.0 20.0 20.0 20.0 20.0 20.0Faizabad Bread (kg) 33.3 33.3 33.3 33.3 33.3 33.3 33.3 33.3 33.3 33.3 33.3 33.3Bamyan Bread (kg) 30.0 30.0 30.0 30.0 30.0 18.2 18.2 30.0 30.0 30.0 17.8Maimana Bread (kg) 33.3 33.3 33.3 33.3 33.3 33.3 33.3 33.3 33.3 33.3 33.0 33.3
Aug-05 Sep-05Jul-05
Annex VII
Weekly Market price of agricultural commodities/services (July-September 2005)[Source: Vulnerability Mapping Unit (VAM), WFP Afghanistan]
Annex VII: Page 1 of 2

Location Commodity/ServiceWeek 1 Week 2 Week 3 Week 4 Week 1 Week 2 Weeek 3 Week 4 Week 1 Week 2 Weeek 3 Week 4
Aug-05 Sep-05Jul-05
Annex VII
Weekly Market price of agricultural commodities/services (July-September 2005)[Source: Vulnerability Mapping Unit (VAM), WFP Afghanistan]
Kabul Diesel/litre 24.0 24.0 24.0 25.0 25.5 26.0 26.0 27.0 27.0 27.0 29.0 32.0Kandahar Diesel/litre 22.5 24.0 25.0 25.0 25.0 24.5 24.5 25.0 27.5 30.0 30.0 30.0Jalalabad Diesel/litre 25.2 25.0 25.3 26.6 26.3 26.3 26.8 26.8 26.8 34.0 34.3 32.6Heart Diesel/litre 22.0 22.0 25.0 25.0 25.0 25.0 25.0 25.0 25.0 27.0 27.0 27.0Mazar Diesel/litre 24.0 24.0 24.0 24.0 24.0 25.0 24.0 24.0 40.0 32.0 30.0 32.0Faizabad Diesel/litre 28.0 28.0 29.0 28.0 28.0 30.0 32.0 32.0 42.0 41.0 40.0 40.0Bamyan Diesel/litre 28.0 27.0 27.0 28.0 28.0 28.0 29.0 31.0 39.0 39.0 37.0Maimana Diesel/litre 24.5 25.0 25.0 25.0 26.0 26.0 27.0 26.0 27.0 32.0 29.0 30.0Kabul One-year female sheep, live 4,850 4,850 4,850 4,890 4,800 4,650 4,850 4,800 4,750 4,800 4,900 4,700Kandahar One-year female sheep, live 4,000 4,000 4,000 4,000 4,000 4,000 4,000 4,000 4,000 4,000 4,000 4,000Jalalabad One-year female sheep, live 4,200 4,200 4,200 4,166 4,166 4,166 4,166 4,100 4,266 4,066 3,866 3,866Heart One-year female sheep, live 3,800 3,900 3,800 3,850 3,800 3,750 3,800 3,750 3,700 3,650 3,600 3,500Mazar One-year female sheep, live 3,800 3,800 3,200 3,300 3,200 3,000 3,100 3,200 3,400 3,400 3,500 3,500Faizabad One-year female sheep, live 5,000 5,000 5,000 5,000 5,000 5,000 5,000 5,000 5,000 5,000 5,000 5,000Bamyan One-year female sheep, live 3,830 3,800 3,750 3,730 3,500 2,000 2,000 3,720 3,700 3,700 4,000Maimana One-year female sheep, live 4,300 4,500 4,500 4,500 3,500 4,000 4,000 4,000 4,000 3,800 3,600 3,800Kabul Casual labour/day 170.0 180.0 180.0 180.0 180.0 180.0 180.0 180.0 175.0 175.0 180.0 175.0Kandahar Casual labour/day 150.0 150.0 150.0 150.0 150.0 150.0 150.0 150.0 150.0 150.0 150.0 150.0Jalalabad Casual labour/day 126.6 126.6 126.6 125.0 126.6 126.6 126.6 126.6 126.6 126.6 126.6 126.6Heart Casual labour/day 155.0 160.0 160.0 160.0 160.0 160.0 160.0 160.0 170.0 170.0 170.0 170.0Mazar Casual labour/day 180.0 180.0 170.0 180.0 180.0 170.0 180.0 180.0 180.0 170.0 170.0 170.0Faizabad Casual labour/day 200.0 200.0 200.0 200.0 200.0 200.0 200.0 200.0 200.0 200.0 250.0 250.0Bamyan Casual labour/day 190.0 175.0 170.0 170.0 170.0 200.0 200.0 170.0 175.0 180.0 200.0Maimana Casual labour/day 200.0 200.0 200.0 180.0 240.0 220.0 200.0 200.0 200.0 200.0 200.0 200.0
Annex VII: Page 2 of 2

Annex VIII: Page 1 of 4
Annex VIII
Additional Information at provincial levels
Region Province Narrative summary of agricultural condition and problems North Faryab Rust and smut in wheat seen in some areas
Fungal disease in potato is sporadic FMD and enterotoxaemia seen in many parts
North Jawzjan Fruit fly and aphid damage noticed in horticulture crops in some parts Bees damaged vines in parts of the province Post-harvest damage caused by rodents is on rise A new disease in camels has been reported
North Saripul Fruit fly adversely affected 550 hectares of melon and water melon Lack of marketing facilities for agricultural commodities Lack of agricultural staff in Saiad, Kohistanatand Gosfandi and Sozma Qala districts Inadequate supply of wheat seed and chemical fertilizer; sub-standard quality is also a problem
North Balkh Fruit fly was seen in some places Farm lands are occupied by some people for building their houses Compound wall needed for protection of agriculture lands and research farms Rust in wheat was seen in some areas
North Samangan FMD and PPR reported widely in the last two months; now contained North- East Kundoz Cotton and mung beans were adversely affected by diseases
Aphid damaged fruit trees Rodents are big problems
North- East Takhar Aphid damaged fruit trees Codling moth damaged apple and pears Aphid damaged melon

Annex VIII: Page 2 of 4
Region Province Narrative summary of agricultural condition and problems North- East Badakhshan Anthrax and enterotoxaemia prevalent in some areas
Borer worm damaged fruit trees Wilting in pepper and tomatoes is common
West Hirat Sunn pest (in wheat) in Koshk, Gulran, Koshk Kohna, Kohsan and Korokh districts Powdery mildew reported in grapes in Oba district.
West Farah FMD reported in some areas Sheep pox exists in some areas Vines damaged by powdery mildew and Qarghana
West Badghis Anthrax, enterotoxaemia, sheep pox and FMD common New Castle and Pasteurollosis were seen in many areas Vaccines are not available for prevention Fruit fly, aphid, and powder mildew in vegetables caused considerable damages Rodents reported to be one of the main problems
West - Central
Ghor PPR in Tolak district Rust in wheat quite widespread Sunn pest and brown tail moth were seen in the some areas
West - Central
Bamyan Rust in wheat was seen in some areas
Central Kabul Aphid in the vines is one of the main problems Lack of improved seeds Rust and brown-tail moth quite prominent in some areas Aphid seen in some areas Death of animals in Shakardara, Guldara and Estalif districts due to various diseases
Central Parwan Powdery mildew in grapes; chemical is being used for the control Qarghana exists in Dolana, Bagram and central part of Parwan Onion and tomato adversely affected by an unknown disease, which results in shrinking of the leaves and falling-down of stems Potato flower adversely affected by worms

Annex VIII: Page 3 of 4
Region Province Narrative summary of agricultural condition and problems Central Kapisa Improved wheat adversely affected by rust in some parts
Fruit plants adversely affected by aphid Qarghana in grapes, mug bean, beans and cotton Pastreutlosis common Powdery mildew in grapes reduced now Pomegranate adversely affected by aphids and worms. The sample has been sent to the plant protection department for the analysis Nematodes damaged peppers FMD is under control now
Central Logar Death of 200-300 animals due to various diseases Lack of equipment for vaccine storage 300 ha of grapes adversely affected by crown gall (smut) and powdery mildew Late-blight damaged potatoes in some areas
Central Wardak/Maidan Outbreak of FMD and successful treatment New Castle exists widely Codling moth is a problem in some areas Rodents are problems
South Paktya Smut in wheat and maize in some places Grapes damaged by a disease that causes the falling of grape bunches
South Khost Anthrax is a common phenomenon Black leg has been seen in all districts
South Ghazni Smut in Moqor district Lack of vaccines in Nawar, Qara baghand Andar Lack of farm power; oxen hiring is very expensive, especially during peak farming periods
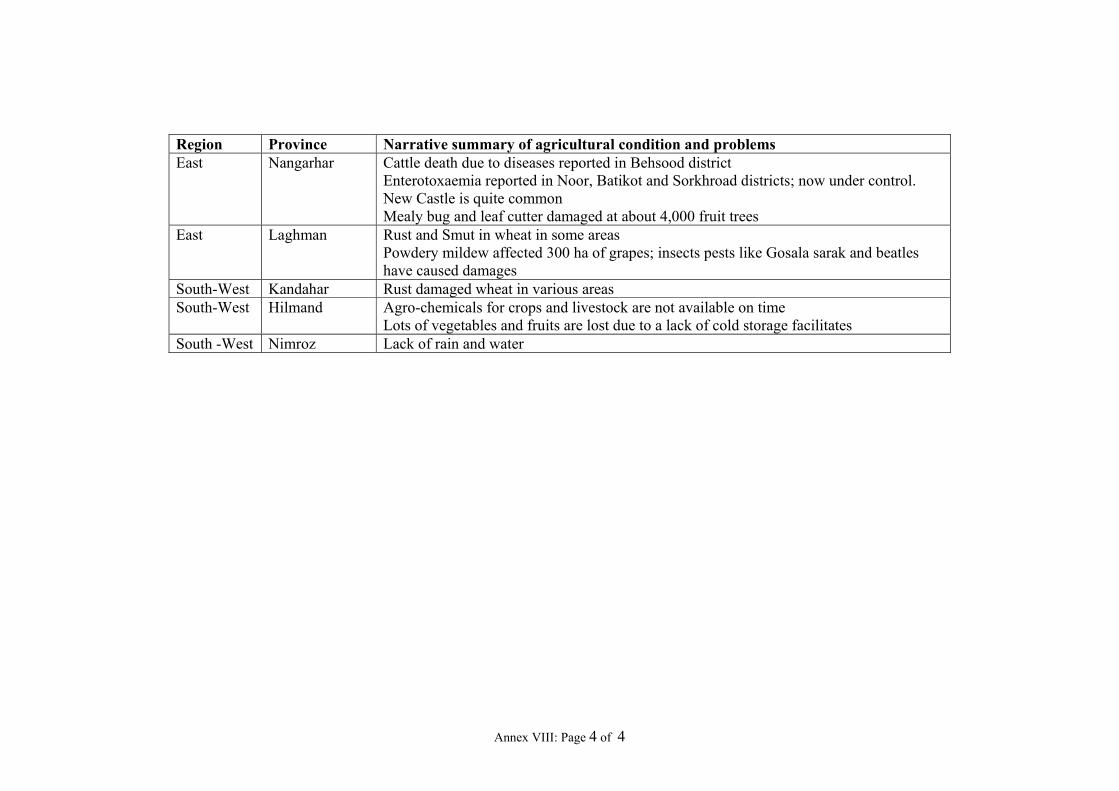
Annex VIII: Page 4 of 4
Region Province Narrative summary of agricultural condition and problems East Nangarhar Cattle death due to diseases reported in Behsood district
Enterotoxaemia reported in Noor, Batikot and Sorkhroad districts; now under control. New Castle is quite common Mealy bug and leaf cutter damaged at about 4,000 fruit trees
East Laghman Rust and Smut in wheat in some areas Powdery mildew affected 300 ha of grapes; insects pests like Gosala sarak and beatles have caused damages
South-West Kandahar Rust damaged wheat in various areas South-West Hilmand Agro-chemicals for crops and livestock are not available on time
Lots of vegetables and fruits are lost due to a lack of cold storage facilitates South -West Nimroz Lack of rain and water