the world after 2005: prospects and choices for the...
TRANSCRIPT
The Apparel and Textile Industries After 2005: Prospects and Choices
Boston University School of Management
Working Paper #2005-23
Frederick H. Abernathy, Anthony Volpe, and David Weil
Harvard Center for Textile and Apparel Research
Version: March 28, 2005
Affiliations:
• Abernathy, Division of Engineering and Applied Sciences, Harvard University and Harvard Center for Textile and Apparel Research
• Volpe, Division of Engineering and Applied Sciences, Harvard University and Harvard Center for Textile and Apparel Research
• Weil, School of Management, Boston University and Harvard Center for Textile and Apparel Research
Contact author information: Weil, Associate Professor of Economics Boston University School of Management 595 Commonwealth Avenue, Room 520A Boston, MA 02215 Email: [email protected]: 617-353-4615
Final draft: Not for quotation or reproduction.
"The Apparel and Textile Industries after 2005: Prospects and Choices"
ABSTRACT
The expectation that Chinese apparel and textile exports will swamp the US and
EU retail markets now that international quotas on those products have been eliminated
has fueled much of the discussion of the future of these industries. Although imports
from China have surged since the elimination of quotas on January 1, 2005, this
conventional wisdom masks important choices that remain for public and private policies
over time. In particular, two factors will continue to have major effects on the location of
apparel and textile production going forward. First, public policy choices will continue
to influence sourcing location, in particular as they relate to tariffs and regional trade
polices as well as policies affecting the linkages between countries. Second, the lean
retailing model that now prevails requires apparel suppliers to replenish products on a
weekly basis. As that retailing model became dominant in the 1990s, so too did the
advantage of sourcing certain apparel items closer to the U.S. market so that products
could be manufactured and delivered more rapidly. This also explains how some
segments of the U.S. apparel industry have survived even in the face of low cost labor
elsewhere in the world. Even though costs remain a driving factor, we show that
proximity advantages for certain classes of products will continue in a post-quota world
as retailers raise the bar ever higher on the responsiveness and flexibility required of their
suppliers.
Version: March 28, 2005 1

Final draft: Not for quotation or reproduction.
The Apparel and Textile Industries after 2005: Prospects and Choices
I. Introduction
On January 1, 2005, the quota system that limits textile and apparel imports into
the United States and other nations ended for all member countries of the World Trade
Organization (WTO). Not surprisingly, there has been widespread speculation about the
long-term impact of this monumental liberalization of international trade. A brief survey
from the over 43,000 Google hits related to “textile apparel quota” quickly reveals a
prevailing notion among scholars, industry groups and government agents: exports from
low wage countries in general, and China in particular, will grow rapidly, virtually
wiping out the textile and apparel sectors of the US and many other established suppliers.
The United State Trade Commission released its own report in January 2004 on the
Assessment of the Competitiveness of Certain Foreign Suppliers to the U.S. Market
concluding:
China is expected to become the “supplier of choice” for most U.S.
importers (the large apparel companies and retailers) because of
its ability to make almost any type of textile and apparel product at
any quality level at a competitive price… Although many countries
may see their share of the U.S. market decline, a large number of
countries likely will become second-tier suppliers to U.S. apparel
companies and retailers in niche goods and service.
The first few months of trade data following the end of quotas seems to confirm this view
of the post-2005 world: Apparel imports from China surged in the first months of 2005,
growing overall by 47% and in some categories like cotton shirts by over 250% over
levels in 2004 (Blustein 2005). Similar increases in the rate of growth of Chinese imports
into the European Union were reported in early 2005. Prospects for many of the
Version: March 28, 2005 2
Final draft: Not for quotation or reproduction.
countries that have developed apparel and textile sectors under the former system seem
bleak.
The conventional wisdom rooted in the above forecasts and interpretation of the
first few months of post quota trade data hinge on basic economic principles of
international trade: factor prices, exchange rates, shipping costs and tariff rates. When
sourcing decisions faced by global retailers and manufacturers are made strictly based on
these traditional forces, it becomes obvious why so many producers are left wondering
how to protect their present share of the huge US or EU markets. In particular, garment
workers, their families and communities within the US and other developed countries
appear most vulnerable to lower cost developing nations no longer bounded by quotas.
The reality of modern sourcing strategy for retail goods may not be so
straightforward. Our research suggests that factors driving textile and apparel sourcing
decisions are much more nuanced than is suggested by these dire forecasts. Traditional
decision factors alone can not explain the existence of certain phenomena within the
industry, like the survival of relatively high-cost, quick-turn-around apparel sectors in
New York and Southern California1, or Bangladesh’s domination of the European import
market for T-Shirts, but not the U.S. market.2
The continued survival of apparel manufacturing in Los Angeles and New York
raises the critical importance of supplier characteristics that go beyond the traditional cost
and quality components that have gained significance in retail strategy and deserve
attention in the post-2005 debate. These “modern” factors, which include inventory risk,
product diversity, replenishment and service, will remain influential for the private retail
decision-makers even after quotas are lifted. By responding to these additional
considerations, apparel and textile producers have some control over their fate.
1 Employment in apparel within New York City was 45,800, Southern California 96,700 in 2002 (Bureau
of Labor Statistics, Current Employment Statistics). 2 U.S. imports of T-Shirts from Bangladesh were not “quota-constrained” in 2003. Cotton T-shirts (not
including underwear) fall within quota categories 338 and 339, which are together assigned a single quota
level. T-shirts of man-made fibers fall within 638 and 639, and again receive a single aggregated quota.
Undershirts of cotton or man-made fiber fall into 352 and 652, respectively, together receiving a single
aggregated quota. In 2003, Bangladesh had quota fill rates of 87.1%, 78.9%, and 80.8%, respectively.
Version: March 28, 2005 3
Final draft: Not for quotation or reproduction.
The very different fates of Bangladeshi T-shirts in the European and U.S. markets
serve as a reminder of the continuing role that public policies will play in shaping
sourcing patterns. Tariffs will remain even after quotas are removed and can be used as a
control mechanism to strategically tilt supply patterns. Bangladesh, due to its status as a
“Least Developed Nation” enjoys free entry into the EU on apparel that undergoes two
stages of production. In the case of T-shirts, this is knitting and sewing, both well within
the capability of Bangladeshi producers. This competitive advantage allows the country
to be the leading source of T-shirts into the EU, a status unrealized in the U.S. market
where Mexico and Caribbean nations enjoy duty free T-shirt imports and Bangladesh
does not. Clearly, then, through the forging of bi-lateral and regional trade agreements
that reduce or eliminate tariffs for certain trade partners, governments will retain the
opportunity to impact global retailers’ sourcing decisions.
This article considers the impact of quota removal in light of the new market
forces cited above, particularly changes in the relation of retail-apparel-textile supply
chains, and the continuing role of public policies affecting trade flows. In doing so, we
argue that the volitional choices of private and public actors remain important in the post-
quota era. These choices will affect future market share for apparel suppliers in close
proximity to the U.S. (e.g. Mexico, Caribbean nations) and EU (e.g. Eastern Europe,
northern Africa, and Mediterranean nations) markets, as well as employment within the
US and EU textile and apparel sectors. These choices will also impact the fate of other
developed and developing nations hoping to sustain or improve their nation’s competitive
positions in a quota-less world.
II. Background
The Rise of the Global Market
Since the production of mechanical sewing machines in the 1850’s, developing
countries have seen the export of apparel products as a major pathway of economic
development. Sewing apparel products has always been and remains a labor-intensive
activity while textile production has been a capital-intensive industry since it was first
mechanized in England in the later part of the 18th century and later in this country in
Version: March 28, 2005 4
Final draft: Not for quotation or reproduction.
New England (Rose 2000). Today spinning yarn and weaving cloth is a highly
automated, very capital-intensive industry producing very high quality fabrics in nearly
lint free plants. Modern textile plants worldwide use comparable machinery made by the
same small group of equipment makers; the difference in product and its quality is then
due primarily to worker training and process procedures and control.
Apparel manufacturing, on the other hand, depends much less on capital
investment and more on the skill of the individual workers in the sequence of operations
required in apparel production. In the U.S., apparel manufacturers have always looked
for a stable low-wage work force. In the early part of the 20th century U.S. apparel was
cut and sewn primarily in big cities relying on a workforce composed mostly of recent
immigrants. Such groups had a strong work ethic but were willing to work for low
wages, because of their limited opportunities for finding other employment. In the
1920’s and 1930’s textile production and large segments of the apparel industry went to
the south looking for lower wage rates, a less unionized workforce, and newer plants than
those in New England and in the larger cities. The desired workforce was found in the
small stable rural southern towns.
After WWII, international trade in all products began to expand with more
reliable shipping and better communications. More clothing began to be made offshore,
continuing the long-standing trend of seeking out the low-cost supplier. In 1962 the
Long Term Arrangement Regarding International Trade in Cotton Textiles (LTA)
attempted to bring order concerning access to the U.S. market. In 1974 the more
sophisticated Multi-Fiber Arrangement (MFA) was created under The General agreement
on Tariff and Trade (GATT). It provided the framework for international trade in apparel
for almost 20 years until its expiration in 1994. The logic of MFA was to provide the
textile and clothing industries in developed countries time to adjust to more competition
from developing nations, while at the same time, fostering free trade. Essentially,
member nations could maintain quotas established prior to the agreement, but were
constrained from expanding those quotas by complicated restrictions.3 For example,
3 On January 1, 1995, the United States, Canada, the European Union (15 countries) and Norway had a total
of 81 restraint agreements with WTO Members, comprising over a thousand individual quotas. Moreover,
Version: March 28, 2005 5
Final draft: Not for quotation or reproduction.
under the MFA, the annual growth rates applicable to these quotas ranged from less than
1 percent up to 10 percent but were mainly in the area of 3 to 6 percent.
The ATC
On January 1, 1995 the MFA gave way to the Agreement on Textile and Clothing
(ATC) under GATT. The ATC seeks to eliminate quotas through a highly complicated
method of integration that entails a gradual four-step elimination of quotas so that all
textile and apparel products stand quota free at the end of the 10-year period. At each
stage, products amounting to a defined minimum percentage of the country’s textile and
apparel import volume in 1990 (base volume) are to be taken off quota (see Table 1).
Furthermore, the set of integration-bound products during each phase must include
minimum shares in each of four product categories; tops and yarn, fabrics, made-ups, and
clothing. The first three phases have already taken effect, cumulatively eliminating the
quotas on 51% of each member nation’s base volume. The last step in this process will
occur on January 1, 2005. The remaining quota-constrained products, which represent
49% of 1990 volume trade, will then become quota free.
The ATC is built upon the same classification structure utilized under the MFA.
First, every apparel or textile product imported into the U.S. is described by a 10 digit
Harmonized Tariff Schedule of the United States (HTS) code based on the six digit
international Harmonized Schedule (HS). The additional four-digit suffix allows the U.S.
to track trade at a level of detail not possible under the standard international HS system4.
As an example, HTS codes distinguish between men’s cotton blue denim pants
(6203424010) and men’s cotton corduroy pants (6203424005). Next, a number of similar
products are aggregated into an MFA Quota Category. To illustrate, the two distinct
types of men’s cotton pants above are binned together with 25 other products (i.e., HTS there were 29 non-MFA agreements or unilateral measures imposing restrictions on imports of textiles and
apparel. 4 Data of apparel imported into the U.S. is available on the U.S. Department of Commerce’s Office of
Textile and Apparel (OTEXA) WEB site for each HTS coded item from every exporting country. The
current as well as the past quota fill rates for each MFA Quota Category is also available for each exporting
country.
Version: March 28, 2005 6
Final draft: Not for quotation or reproduction.
codes) to comprise quota category 347, “Men’s and Boy’s Cotton Trousers, Breeches,
and Shorts”. It is at this level that quotas act to restrict import volumes into the U.S. from
a given country. As a result, the import volume of men’s denim jeans from China, for
instance, has a direct effect on the potential number of corduroy pants imports.
One of the clear intentions of the ATC, like the MFA before it, was to cushion
and backload the impacts of quota elimination into the future. Besides the
disproportionate 51% of volume still to be removed, the potential impact of the fourth
phase is exaggerated by two other factors. First, during the initial two phases, developed
countries took advantage of the lack of precision in the wording of the agreement.
Because the ATC required the integration of a designated percentage of all textile and
apparel imports, not a percentage of the previously restricted imports, the importing
countries integrated products that were not restricted previously.5 Indeed, in the case of
the US and the European Union, the percentage of imports of products not covered by
restrictions in 1990 (the base year used for integration), was about 34% and 37%
respectively. Thus, for these countries, it was possible to meet obligations in the first two
stages without significantly removing restrictions.6
The second factor that may amplify the impact of the final integration is that
importers were careful through the first ten years to liberalize largely in the lower value
products, thus protecting their own value-added clothing industries. For example, in the
first phase of quota removals, 70% of the products integrated were yarns and fabrics.7
The value of the products integrated by the EU and the US in the first phase was 8.7%
and 6.62% respectively of total textile and clothing imports (to achieve 16% physical
volume requirement) and in the second phase 12.92% and 10.73% respectively (to
achieve 17% physical volume requirement).8 Thus, each producing nation has yet to
witness the effects of quota removal on any major product groups vital to its domestic
5 Multi-fibre Arrangement and the Agreement on Textiles and Clothing www.foei.org/trade/
activistguide/mfa.htm6 Agreement on Textiles and Clothing - chapter 14 7 Multi-fibre Arrangement and the Agreement on Textiles and Clothing www.foei.org/trade/
activistguide/mfa.htm8 Bhattacharya and Rahman, 2002.
Version: March 28, 2005 7

Final draft: Not for quotation or reproduction.
industry. For the U.S., this means every notable category will only now lose quota
protection, including cotton pants, shirts and T-shirts (see Table 2).
Along with the phase out of quotas by 2005, the ATC also required that during the
transition period, member nations increased the growth rate of quota covered products
that had not been released. Once again, the rate of required increase in “quota
constrained” product categories was set out in the agreement. This means that in some
cases, the required annual quota growth rate would exceed the growth in demand for the
quota, leading to the de facto elimination of quota restrictions even before those
categories were totally released via integration. 9
Tariffs and Regional Trade Agreements
Although quotas end at the end of 2004 under terms of the ATC, tariffs
established within the ornate system of bilateral apparel and textile agreements between
countries will remain for a long time. Tariff agreements are then overlaid by an equally
complex set of regional trade agreements that provide participants with full or partial
relief from their partners’ standard tariff rates on certain products under certain
conditions.10 Furthermore, these pacts may include provisions whereby imported
garments meeting specific criteria do not count against an exporter’s quota. As a result,
particular supplier nations with duty free or quota free benefits may enjoy a substantial
competitive advantage over competitors excluded from similar arrangements.
For the U.S., the North American Free Trade Agreement (NAFTA) is the most
widely known regional treaty. Signed in 1994, NAFTA has eliminated quotas and tariffs
on most apparel moving between member countries, provided the products were 9 For example, if the annual growth rate for a quota is fixed under a bilateral agreement at 6%, it will have
to be increased by 16% for the first three years of ATC (i.e. annual growth rate will be 6% x 1.16 = 6.96%
in 1995, 1996 and 1997); 25% for the next four year (i.e. annual growth rate will be 6.96% x 1.25 = 8.70%
in 1998, 1999, 2000 and 2001); and 27% for the last three years (i.e. annual growth rate will be 8.7% x
1.27 = 11.05% in 2002, 2003 and 2004). See Agreement on Textiles and Clothing - Article 2 Paragraph 13
& 14 10 See Claire Chiron, “An Overview of Apparel and Textile Quota, Tariff and Trade Agreements,” Harvard
Center for Textile and Apparel Research, Working Paper, available at www.hctar.org for a detailed look at
the trade agreements dictating tariff and quota rules for textile and apparel entering the U.S.
Version: March 28, 2005 8
Final draft: Not for quotation or reproduction.
assembled from yarn originating in a member country.11 Equally important is the
Caribbean Basin Trade Partnership Act (CBPTA), enacted in 2000. The 24 beneficiary
countries can also receive duty free and quota free access to the U.S., this time provided
that garments are constructed strictly from U.S. yarns and textiles. As will be discussed
later, this qualification has vital implications for the American textile sector. A third
example is the African Growth Opportunity Act (AGOA) of 2000, which closely
resembles the CBPTA in structure and aims to encourage investment in 36 sub-Saharan
nations. Besides these and other regional treaties, the U.S. has engaged in separate bi-
lateral agreements with Israel, Jordan and others that ultimately provide some
combination of duty or quota relief to producers in these partner nations.
The EU, for its part, has its own complex web of trade agreements. Like the U.S.
the greatest benefits seem reserved for nations in close proximity to the European market
and the world’s under-developed regions. Of particular note are three arrangements
illustrating this, all of which provide duty free and quota free access to the EU apparel
market: the Euro-Mediterranean Partnership, which involves twelve Mediterranean and
Middle Eastern nations; the Stabilization and Association Agreement,12 which includes
free trade terms for five western Balkan nations; and the 2001 Everything but Arms
Initiative, benefiting the 50 Least Developed Countries.
The Special Case of China
When China sought to become a WTO member in the late 1990s, one of the major
issues in contention in the “accession” agreement was apparel and textiles. A set of
conditions apart from the ATC was negotiated regarding the phase out of quotas from
China. Although the overall ATC timetable applies to China, several features of the 1997
US/China bilateral textile agreement differ.
11 This type of criterion is known as “yarn-forward”, stipulating that each value added step, beginning with
the creation of yarn forward to weaving, cutting and sewing, must be conducted in a NAFTA country. In
the case of man-made fibers, the qualifying rule of origin for a garment is fiber-forward. 12 All apparel and textile exports from participating countries enter the EU duty and quota free, except for textiles from Serbia and Montenegro on which tariffs still apply. (See Appendix II for a list of beneficiary countries.)
Version: March 28, 2005 9

Final draft: Not for quotation or reproduction.
First, the agreement set the quota growth at an average of 1% annually (much lower
than the growth rates for non-released categories under the ATC). This meant in effect that
when China became a WTO Member in December 2001, even with the catching up of the
accelerated growth rates from the phases that had already occurred, quota for products only
increased slightly in the period before 2005. Indeed, based on the same rules as above, the
quota growth rate will increase to merely 1.16%, 1.45% and 1.84% at each stage
respectively (Tse and Ip 2002). The second difference concerns the presence of more
extensive “safeguard” measures between the US and China that provides the US with
rights to re-impose quotas under specified circumstances. Under the separate
Memorandum of Understanding between the U.S. and China, a bilateral consultation
mechanism remains in affect for four additional years beyond the end of quotas for WTO
countries (through December 31, 2008).13 This safeguard mechanism allows the U.S. to
seek to extend quotas with China for specific goods where the elimination of such
restrictions would result in “…market disruption, threatening to impede the orderly
development of trade between the two countries…” (USITC 1999: 8-12). These safeguard
provisions have already been invoked a number of times, most recently in regard to an
alleged “surge” of imports of bras.14
III. The Structure of Global Sourcing
The Textile and Apparel Industry Today
From 1989 to 2003, apparel imports to the U.S. rose from $21B to $61B, now
representing about 60% of all apparel sold in the U.S. Figure 1 chronicles U.S. apparel
consumption over the last fifteen years from both foreign and domestic producers. It
should be noted that an additional $5.2 billion of apparel was produced domestically but
13 Both countries initialed the Memorandum of Understanding regarding China’s accession to the WTO on
February 1, 1997. 14 Neil King and Dan Morse, “Bush Sets Quotas on Some Imports of Chinese Goods,” Wall Street Journal,
11/19/03.
Version: March 28, 2005 10
Final draft: Not for quotation or reproduction.
exported to countries throughout the world.15 Figure 2 presents the national sources of
the $61 billion worth of apparel imported to the U.S. in 2003. The drivers for sourcing
will be discussed below, but it is worth pointing out here both the national diversity of
import sources, and also the concentration in certain areas, particularly Mexico, so-called
Caribbean Basin nations (a grouping that also includes Central America) and China and
Asian sources.
Not surprisingly, the growth in apparel imports has been accompanied by a steady
reduction in both U.S. employment and output within the apparel and textile sectors.
From the period 1989-2002, textile production in real dollar output terms declined by an
average of 3.3% per year and apparel production by about 3.4%. Employment declined
even more rapidly during those periods for both textile and apparel, reflecting both shifts
towards domestic production of higher value products and increases in productivity
(particularly for the textile industry).16 Despite these declines, a large number of workers
remain employed in both industries, leaving much at stake as the dynamics of the global
textile and apparel market change on January 1, 2005.
Sourcing Decision Makers
Discussion of the future of apparel and textile industries often focuses at this
national level of trade flows. But these flows reflect decisions of private actors along
supply chains (retailers, and producers of textiles and apparel) that operate within the
restrictions of national and international trade and other public policies. One must
understand how private decisions lead to observed flows of garments in order to forecast
the post-2005 market.17
15 Office of Textile and Apparel, International Trade Administration, Export Market Report (available at
http://otexa.ita.doc.gov/scripts/exphist.exe). A total of $10.5 billion of textile products were exported by
the U.S. in the same year. 16 Bureau of Labor Statistics, Employment and Earnings, various years. 17 A study from 1993 by the U.S. Customs Service analyzing the top 100 apparel importers found that 48
percent of top importers were retailers; 22 percent designers; and about 20 percent U.S. based
manufacturers. The remaining group were made up of wholesalers and other intermediaries not involved in
either design, marketing, or production decisions (Feenstra 1998; Gereffi 1999). Wholesale intermediaries
declined further as a group in the supply chains with the rise of lean retailing (Abernathy et. al. 1999).
Version: March 28, 2005 11
Final draft: Not for quotation or reproduction.
Making sourcing decisions in the global apparel market is a daunting task. Due to
factors including language and custom barriers, communications hurdles, and the sheer
number of producers scattered across the world, U.S. retailers have had to change the
way they approach the world market. Some large retailers have established their own
buying offices overseas to administer the outsourcing of their private label products.
Others work with large and sophisticated independent sourcing agents to handle this
intricate task.
Most American manufactures of branded or private label apparel products have
developed contacts in apparel exporting countries. Some U.S. companies have opened
plants offshore that they own jointly with local owners. Most often they seek indigenous
cut and sew contractors, or they go to organizations that provide completed apparel
products, the so-called full package providers. There are currently very few other
nations’ branded apparel products that are exported into the U.S. market. For every
Giorgio Armani one might think of there are more brands such as Levi, Lee, Wrangler,
and private labels such as Brooks Brothers, Lands’ End and L.L.Bean. It is tempting to
think of clothing from any of the last six as American, and apparel with the Armani tag as
Italian. However, although the design and merchandising of the product is likely to be
American or Italian, the actual garments are often sewn outside of the U.S. and Italy.
The evolution of one of the foremost sourcing firms illustrates changes in the
underlying drivers of sourcing patterns. Li & Fung (Trading) Ltd. of Hong Kong is one
of the largest international sourcing agents, acting as the link between its customer base
(major retailers and apparel companies) and an international supply network.18 Li & Fung
was founded in 1906, originally as an exporting agent of porcelain and silk from China.
Following World War II, it began to focus on export of garments, toys, and other
manufactured goods. As an important element of its garment exporting business, the
company gained expertise in buying and selling quotas from Asian markets for shipment
into the U.S. in the 1970s and 1980s. As a buying agent and broker in quotas, it
established relationships with more than 2000 Asian suppliers and links forward in the
18 For background, see Loveman, and O’Connell 1996; Fung 1998; Tanner 1999; Hagel and Brown 2001.
Version: March 28, 2005 12
Final draft: Not for quotation or reproduction.
supply chain to manufacturers and retailers. In the late 1980s and 1990s, the company
took advantage of its network of Asian suppliers and its growing facility with logistic
management to offer U.S. retailers an efficient means of sourcing products in Asian
nations through the auspices of Li & Fung (Fung 1998). With the growth of new
methods of retailing (see below) and greater pressure from other competitors
(intermediaries as well as retailers establishing their own sourcing footholds), its logistics
capacity became a central element of the company’s business, and evinced by its 2003
annual report which describes its core business as “…managing the supply chain for high
volume, time sensitive goods.”.
By 2001 the company had an estimated 7500 suppliers in about 40 countries
around the world. In recent years as more and more U.S. manufacturers have turned to
full package providers to help them with sourcing problems, Li & Fung and other
sourcing agents have moved into an even-more expanded list of services including:
product development, raw material sourcing, production planning, factory sourcing,
manufacturing control, quality assurance, export documentation, and shipping
consolidation. Perhaps indicative of the next step of evolution, the company recently
entered a licensing agreement with Levi Strauss & Co. in which they will design,
manufacture and market men’s tops for the U.S. market under various Levi’s® labels,
including Levi Strauss Signature™ branded jeans to U.S. mass marketers.
Sourcing choices arise from the drivers of profitability: cost considerations related
to acquiring factors of production balanced against factors affecting revenue, including
pricing, marketing, and distribution. In large part, these lead private actors to weigh
familiar issues of labor, material, and shipping costs as well as costs related to tariffs and
the presence of quotas in selecting sources. However, as will be demonstrated, modern
supply chain dynamics are adding factors to this traditional list regarding which party
will hold the sizeable inventory risk.
Labor, Material and Shipping Costs
Because apparel manufacturing is labor intensive, wage rates are clearly a major
factor in sourcing decisions. This gives an immediate competitive advantage to
producers in developing countries, including China and India. This advantage, however,
Version: March 28, 2005 13
Final draft: Not for quotation or reproduction.
is not reserved for Asian countries alone, as Table 3 demonstrates. Many African
nations, including Madagascar and Kenya, have among the world’s cheapest work forces,
but are not major competitors in exporting apparel to the U.S. Mexican labor, in contrast,
is much more expensive, yet retains a very prominent place in this market.
Given the fact that not all apparel products require the same amount of labor, the
benefit arising from low wages is magnified on labor-intensive products. This can be
seen in comparing labor costs across different types of garments and sources of
production. Table 4 compares the factor costs associated with producing two types of
garments: a single pair of men’s jeans and a cotton rung spun T-shirt. We compare the
cost of production in Mexico, the Caribbean, and Coastal China for each case.
Allowing for differences across the producers in terms of wages and productivity
(labor cost per garment), China’s low wage rate still leads it to have the lowest cost
associated with cutting, assembling and finishing the garment relative to the other two
cases.
Of course, labor costs alone do not determine the total cost of an apparel product
landing on U.S. shelves. A second factor cost highlighted in Table 4 is the price of
procuring fabric. In fact, this expenditure may be even more responsible for variation
among different supply sources than labor, as it is for jeans. Clearly, producers in close
proximity to cotton textile manufacturers have an advantage over those far away. For
example, it is more costly to utilize American denim in Columbian jeans factories than in
Mexican shops. Furthermore, nearness to inexpensive textiles is an even greater
advantage. China, for example, which has a growing cotton textile industry of its own, is
able to secure lower cost fabric than its competitors using U.S. fabric.
Shipping cost is the final major factor cost associated with apparel imports.
Proximity to retail markets in the U.S. or EU matters in this elementary regard, at the
very least. (Later it will be shown how it matters even more for other reasons.) Although
the $.05 per garment difference between shipping a pair of jeans from Mexico rather than
China may at first seem insignificant, it may not always be so, especially in the case of
inexpensive products where the difference represents a meaningful percentage of the
product’s overall cost.
Version: March 28, 2005 14

Final draft: Not for quotation or reproduction.
So after considering the labor, material, and freight, it is easy to suggest that
countries like India, China and their neighbors could grow to dominate the U.S. market
once quotas no longer restrict them. This seems even more plausible for products such as
dresses, where the cost variation is especially large. Despite the distance from the U.S.,
any shipping cost disadvantage is quickly erased for these producers through the
combination of low wages and inexpensive fabric from local textile makers. This is not
the whole story.
Direct Policy Costs
The total cost for a pair of jeans landing on U.S. soil does not end with the
components listed in Table 4. In fact, the policy costs enumerated in Table 5 can often
comprise the largest cost differentials among producers. In the jeans example, duty and
quota charges account for 46% of the total landed cost of from a coastal Chinese
producer in 2003.
The first policy cost illustrated in Table 5 arises from quotas. Each nation
determines the method for distributing the quotas it has available given its bilateral
agreements with trading partners. The methods for doing so vary across different
countries (Krishna and Hui Tan 1998). For low wage countries with excess capacity,
quota volume into the lucrative U.S. or EU markets becomes a source of revenue as well
as opportunity to attract additional companies seeking sourcing opportunities. As a
result, global manufacturers seeking to fill U.S. retailer orders from a producer in China
pay substantial fees for acquiring quota. In other words, quotas on constrained product
categories become a tax on goods headed to the U.S. market.19 As a result, for the jeans
in Table 5, Mexico and Nicaragua inherit the mantle of low cost supplier from China due
to their preferential treatment through NAFTA and the CBPTA, respectively.
19 This raises a potential problem for the Chinese government which stands to lose, according to our
estimates, around $1 billion annually in hard currency once quotas are lifted. This loss of revenues have
led some to speculate that there will be pressure to find alternative sources of dollars and other international
currency to compensate for the loss in revenues. The recent announcement by the Chinese government of
the imposition of an export tax (see below) in part may arise from this motivation.
Version: March 28, 2005 15
Final draft: Not for quotation or reproduction.
Although quota-related costs will drop out of the equation after January 1, 2005,20
it is worth reiterating that tariffs will remain in place. Table 5 makes it clear that this
second policy-driven expense can also be influential, as duty rates on U.S. bound apparel
can reach as high as 30%. This can provide a considerable advantage to countries covered
by regional trade agreements like those discussed earlier which reduce or eliminate this
expense. In the case of jeans presented here, even without quota costs, Mexico pulls to
within 1% of China because of its membership in NAFTA. For T-Shirts, the $0.29 duty
that applies to Chinese imports dramatically changes the analysis. This same pattern
would be recognized in the total cost supplier comparisons for a significant number of
apparel products. Furthermore, because most of the countries partnered in U.S. trade
agreements come from the Western Hemisphere, the net effect of the current U.S. tariff
structure is a shift in market share toward Mexico, the Caribbean Basin and South
America for the many products fitting this cost profile. Likewise, European imports of
these same products will likely originate in neighboring Mediterranean countries or least-
developed nations such as Bangladesh. Again, this factor will not disappear on January
1, insuring that many products will continue to be supplied according to current trends,
and that products from more proximate sources will remain competitive.
Lean Retailing and Replenishment
The factor costs and policy costs described thus far once may have been the only
forces driving international retailers’ and manufacturers’ sourcing decisions. As the role
of the manufacturer in the supply chain has changed, though, so too has his objectives.
Many of these changes have been customer driven; that is to say, retailers are undergoing
revolutionary changes of their own, and in turn, demanding more from their suppliers.
Modern retailers no longer have warehouses full of apparel products ready for the
selling floor. Rather they have become “lean retailers” owning just the products on the
selling floor. As a result, suppliers’ warehouses and distribution centers act in many
20 The Chinese government announced in December 2004 that it will impose an export tariff on textiles and
apparel products after expiration of quotas. When implemented, the new tax will add additional policy-
related costs to Chinese exports. It is unclear at this point how much it will raise costs relative to those
associated with the costs of purchasing quotas under the former system.
Version: March 28, 2005 16
Final draft: Not for quotation or reproduction.
ways as virtual warehouses and distribution centers for the retailers. At least once a
week, most often on Sunday evening after the weekend sales are known, retailers have
their computer inventory system order replenishment products from their suppliers.
Products are ordered at the stock keeping unit (SKU) level. For example, an order will be
placed with a manufacturer for a specific number of their men’s jeans of a given style,
color, fabric weight and finishing treatment, waist size and inseam length. The order
goes to the manufacturer’s computer and is generally received on that Sunday evening.
The retail order requires that the jeans be placed in identified cartons for each of the
retailer’s stores, and the order is to be delivered to the appropriate retailer’s distribution
center by Wednesday of the same week. The cartons must be identified with the
appropriate bar codes identifying the specific store to which it is to go. The jeans must be
floor-ready, that is, they must be ready to be placed on the retailer’s floor with
appropriate price marked as they are taken from the packing carton. In all likelihood the
jeans will not be touched from the time they are placed in the shipping container at the
manufacturer’s distribution center until they arrive at the store ready to be placed on a
table for sale on Thursday morning. In fact, the outside of the carton will be touched
only when truck trailers are loaded and unloaded. The sorting from supplier’s trailer to
trailer destined for specific stores is fully automatic.
The processes and the paperwork associated with the products must be completely
understood by the manufacturer and the retailers and conform to well known industrial
standards.21 These added services place significant new costs on suppliers, in essence
shifting risk from retailers backwards onto their suppliers (Abernathy et. al. 1999).
For the supplier, this evolving role in the supply chain has led to an increased
focus on inventory carrying costs and risks, and manufacturers making global sourcing
decisions have begun to account for these expenses (Abernathy et. al. 2000). Table 6
carries forward the ongoing jeans and T-shirt examples from Tables 4 and 5 by including
these modern factors. For this comparison, we use total landed cost less quota cost as the
basis of comparison since we are concerned about the post-2005 period. First, consider
men’s jeans, where the typical Mexican, Caribbean and Coastal Chinese supplier will
21 For further details on lean retailing, see Abernathy, et al. 1999.
Version: March 28, 2005 17
Final draft: Not for quotation or reproduction.
have lead times of three, five, and eleven weeks, respectively. Assuming shipments
arrive at the manufacturer’s distribution center from all three candidates with the same or
nearly the same frequency, the variation in cycle time will surface in three important
operating metrics.
The most obvious of these is the work-in-process inventory (WIP), which
increases with the lead time on a direct basis. WIP costs are carried by the supplier and
represent capital tied up in the production process itself. Given the low capitalization of
many apparel suppliers, the consequences of large amounts of WIP can be substantial.22
As a result, the associated WIP carrying costs for sourcing the Chinese producer will be
nearly three times those incurred when using the Mexican producer ($.11 per garment for
Mexico versus $.30 for China).
Next, when planning safety stocks necessary for insuring against inevitable
fluctuations in demand, a longer cycle time translates into larger finished-goods
inventories (FGI). To illustrate this, consider the branded jeans manufacturer supplying
products to a number of retail outlets, where from week to week, demand may vary from
expected volumes. Depending on the producer’s lead time, special orders aimed at
replenishing a particularly popular SKU may or may not arrive in time for the
manufacturer to achieve the negotiated fill rates with the retailer. So to assure high
service levels, the manufacturer is forced to hold FGI in amounts adequate to service
these fluctuations. In other words, longer cycle times equate to delayed responsiveness to
the market, which ultimately necessitates higher safety stocks. Hence, a decision to
contract the Chinese producer in Table 6 means keeping two or three additional weeks
worth of FGI than if the western suppliers were chosen.
Inventory-at-risk is the final operating metric to reflect the variance in cycle
times. Unlike WIP cost and FGI cost, it does not easily translate to the total cost buildup
in Table 6.23 But the potential costs represented by inventory at risk are considerable,
perhaps larger than many of the more direct costs. This is because the possibilities of
unanticipated product obsolescence or cancellation at any time during a product life- 22 As in other aspects of supply chain relations, these costs are born increasingly by organizations upstream
of retailers and branded apparel companies. 23 This problem is discussed at length in Abernathy et. al. 2000. See also Bouhia and Abernathy 2004.
Version: March 28, 2005 18
Final draft: Not for quotation or reproduction.
cycle, means that the current inventory, or some part of it, must be sold at a deeply
discounted level or, in the worst case, may never be sold at all. A sudden drop in the
demand for a line of goods means that a supplier faces liquidating 15 or more weeks of
product, simply because it cannot “turn off the tap” of supply instantaneously. For the
decision-making manufacturer who stands to lose in this situation, lower inventory-at-
risk is an added incentive to choose the shorter-cycle producers in Mexico or Nicaragua.
In the comparative analysis in Table 6, the value at risk for a supplier of jeans is
substantial. For example, if a retailer’s weekly order of 10,000 units of a specific line of
jeans is abruptly terminated, the manufacturer is left holding $650,000 of inventory that
must be liquidated if sourced from Mexico versus $1.42 million if sourced from China.
For a manufacturer or sourcing agent seeking producers of jeans bound for the
U.S., the sourcing decision may seem ambiguous when looking only at factor costs. As
the example suggests, the preferred producer for this product does not surface until the
impact of proximity is taken into account by determining the work-in-process and
finished-goods inventory costs, as well as the inventory at risk. What may have gone
unnoticed, though, are the specific characteristics of jeans that played such a vital role in
this result.
The above discussion highlights the importance of taking product characteristics
into account when projecting future sourcing patterns. More specifically, a product’s
fashion content, which is highly correlated with its level of replenishment, is a very
influential factor in manufacturers’ production decisions. For fashion products like the
dress, the decision will lean more heavily on factor and policy costs. This means low
wage nations, and especially those with access to inexpensive textiles, have the potential
for major market gains when quotas are removed. On the other hand, for replenishment
products, it would seem that producers in close proximity to the world’s major markets
are on solid footing even without the lowest wage rates. Not surprisingly, these trends
are already being reflected in current international sourcing patterns.
Version: March 28, 2005 19
Final draft: Not for quotation or reproduction.
IV. Implications for post-2005 sourcing patterns
Apparel
The forgoing argument implies that the prospects for apparel sourcing into the US
and EU markets will be driven by two sets of forces. For products with single seasons
and limited prospect for replenishment such as dresses, womens’ blouses, and fashion
sensitive clothing in general, traditional cost factors, and the continuing cost of tariffs
will frame sourcing decisions. For these goods, the world after 2005 will change
dramatically for those countries whose garment industry depended on quota-driven
advantages (for example as a low-cost portal for quota-constrained suppliers), or whose
cost advantages were only somewhat above the costs of purchasing quotas. For these
countries, the end of quotas implies the kind of head-to-head competition implied by the
conventional wisdom, albeit along a broader set of factors than just labor costs. For
example, quota-constrained producer nations like India, already successful in the market
due to lower combined manufacturing and policy costs, stand to expand market share.24
For products where retailers and suppliers seek ongoing replenishment—either
throughout the year (men’s jeans) or within a season, direct costs related to labor, textile
inputs, shipping, and tariffs are balanced against the costs associated with lead times,
inventory, and their attendant risks. As such, proximity of suppliers matters too, and
post-2005 sourcing decisions may shift less—or in different ways—than predicted by the
common wisdom.
The clothing produced in U.S. and EU markets are composed of a mix of
replenishable and non-replenishable products. Although the level of replenishment
required by retailers varies across segments (mass merchants demand a higher level of
replenishment, albeit for a more narrow product mix than department stores for example)
Figure 3 provides an indication of the extent and variety of replenishment products for
different types of apparel for a major U.S. department store in 2000.
24 Of course, there are other factors affecting sourcing decisions. These include quality of the basic fabric
(e.g. cashmere), specialization in production and design (e.g. Italian suits), and certain highly skilled
sewing details (e.g. complex stitching patterns). These characteristics tend to arise from historic
specialization not easily replicated. We focus on more generic factors.
Version: March 28, 2005 20
Final draft: Not for quotation or reproduction.
A comparison of the replenishment content of all garment products shipped for
major sources of production provides evidence consistent with the importance of
replenishment products for sources of production more proximate to the U.S. and E.U
markets. The top twenty sources of men’s jeans for the U.S. and the EU in 2003 are
dominated by more proximate sources of supply (Tables 7(a) and 7(b)). As predicted, the
list of U.S. partners is dominated by Mexico, which enjoys beneficial policy position
through NAFTA (no tariffs) and the closest proximity. Additionally, a number of
regional CBPTA countries play a major role. China is well down the list, and its focus
for the category seems to be on more fashionable styles as evidenced by its higher unit
cost ($ per dozen). Bangladesh tops the EU list of suppliers, parlaying its very low wage
rate with its preferential tariff treatment as a least developed nation. Yet a high number of
Mediterranean nations also make the list. Finally, the very different composition of
apparel sources for jeans into the US and EU market is telling, implying that the
decisions leading to current sourcing patterns are balancing a much wider set of factors
than lowest manufacturing costs.
A similar story can be seen for sourcing of T-shirts into the U.S. and EU markets
(Tables 8a and 8b). The top 4 sources of T-shirts into the U.S. market, comprising 60
percent of all imports of that category, are in proximate nations (Honduras, Mexico, El
Salvador and Dominican Republic). A number of nations with comparable or lower unit
prices for T-shirts (Bangladesh, Egypt, Thailand) fall low in the list of sources even
though they were not quota constrained for that product category. The EU list is
dominated by both Asian sources of production (particularly Bangladesh that has
preferential tariff treatment) as well as regional producers like Turkey, and Morocco.
In contrast, consider sourcing for dresses. Fashion items, which are expensive to
produce and not typically replenished, would presumably have similar supply patterns
into both the U.S. and EU. This is due to the fact that factor costs play a large role and the
inventory and risk considerations are non-discriminating. Tables 9(a) and 9(b) support
this assertion. For the US, none of the proximate nations that dominate the men’s jeans
list appear in the top 10 of sources for cotton dresses, and many countries that do not
even appear in Table 7(a) appear near the top of 9(a) (e.g. India and Sri Lanka). The
national sources of cotton dresses into the EU look more similar to those supplying jeans.
Version: March 28, 2005 21
Final draft: Not for quotation or reproduction.
The overlap between US and EU sources is far greater here, reflecting the dominance of
more traditional drivers.
Figure 4 incorporates our measures of product-level replenishment into estimating
the total value of 2003 U.S. imports of replenishable apparel from various regions. As
we would predict, Mexico and the CBI provide a far higher amount of replenishable
products (over $4 billion) than China ($1.3 billion) or other low cost Asian producers.
Similarly, while about 22 percent of all apparel sources from Mexico and CBI nations is
replenishable, less than 10 percent of products sourced in China or other Asian nations
have this characteristic. Since these factors will still prove important after quotas are
lifted, rapid shifts in sourcing to Asian and other low wage but distant nations are
unlikely. As lean retailing practices take greater hold in Europe, the benefits from
replenishment will also tend to favor products sourced in the low wage regions on the
continent and from countries in the Euro-Mediterranean Partnership – countries primarily
bordering the Mediterranean Sea.
Textiles
The fate of the textile industry is closely tied to apparel.25 Concern over the
effects of lifting quotas has as much or more to do with the vulnerability of the U.S.
textile industry as it does apparel.
For the portion of the U.S. textile industry that supplies apparel, the shift towards
Mexico and the CBI has been very beneficial. This can be seen in the trade figures on
textile exports from the U.S. to Mexico and Caribbean nations versus U.S. textile exports
to countries in Asia such as China and Bangladesh.26 Figure 5 compares U.S. textile
25 It is not, however, as directly linked today as it once was. Textile products are inputs for three very
distinct industries: apparel, home furnishing, and industrial uses, each using roughly one-third of annual
textile production. Home furnishing industry includes sheets, towels, carpets, and related products.
Industrial applications represent a varied set of uses from biotechnology applications (cardiac stents) to
large scale construction applications such as the tent-like structures used as roofing for the Denver
International Airport. See Abernathy et. al. 1999, chapter 11 for a complete discussion. 26 Based on U.S. Department of Commerce value of imported textiles, SITC 65 (see the appendix for
information on the underlying data). The fall in textile employment in the US during the 1990s is often
mistakenly ascribed to the same factors that reduced US apparel employment. In fact, the textile industry
Version: March 28, 2005 22
Final draft: Not for quotation or reproduction.
exports as a percentage of apparel imports from a variety of countries. For Mexico and
the CBI, this percentage is high (over 40 percent for Mexico and close to 30 percent for
CBI countries like Honduras and El Salvador). In contrast, U.S. textile exports to China
are less than 2 percent of the value of imported apparel items sourced there and
Bangladesh even lower. The economic benefit to the U.S.-based textile sector arising
from a garment imported from Mexico or Honduras is therefore far greater than if
sourced in China (see Feenstra 1998 for further discussion of this issue).
The use of U.S. textiles by suppliers working out of Mexico, Central America,
and the Caribbean reflects as we have argued throughout the choices of private actors
operating within the bounds of public policies and institutions. It is reflective of public
policies such as the terms of the Caribbean Basin Partnership Trade Act that requires as a
quid pro quo for duty-free entrance into the U.S. market that products sewn in Central
America and the Caribbean utilize American textiles. But it also arises because of the
proximity, quality, and cost of US textile products that have made U.S. an attractive
source for Mexico even though under NAFTA duty-free treatment would be granted if
textiles originated in Mexico. The continuing effects of regional trade agreements
reducing relative tariffs and proximity advantages mean that significant demand for US
products should remain in the medium term, providing that both apparel and textile
providers take continuing advantage of the proximity premium. Equally, the backward
linkage from apparel to textiles means that regional trade policies (e.g. the Central
American Free Trade Act) may be especially important for that sector after 2005.
A further implication of these trade figures is the longer term opportunity for
Mexico to further expand its textile sector. Along with increasing Mexican investment in
textile production, many major U.S. textile companies have moved capital there. Yet the
obstacles to developing a high quality, technologically advanced textile sector are much
more substantial than for apparel. Textile production is a far more capital intensive
process requiring development of infrastructure, electricity, water, and the management
as well as for other major end users experienced growth in production over this period, and much of the
employment reduction arose from technological changes and increasing capital intensity of production.
See Abernathy, Dunlop, Hammond, and Weil (1999), Chapters 11 and 12.
Version: March 28, 2005 23
Final draft: Not for quotation or reproduction.
of sophisticated manufacturing processes.27 Thus, the development of a major textile
sector in Mexico and its attendant effects on the U.S. industry will occur over a longer
period of time.28
V. Conclusion
The sourcing decisions facing textile and apparel manufacturers are more
complicated than commonly acknowledged. With expanding free trade, there are more
potential producers. With consumers demanding more variety, more fashion, more
product access and lower prices, pressure on suppliers to search for new sources of
supply will only increase. Finally, modern retail and distribution strategies place the risk
arising from added variability of product demand further up the supply chain, forcing
suppliers to balance the direct costs of sourcing against the indirect consequences of
being left “holding the bag” of inventory.
The ultimate impact of the removal of quotas on the global network of firms
supplying the US and European markets rests on volitional choices taken by private
players along the supply chain and public entities in developed and developing nations.
27 There is evidence that managerial problems are increasingly affecting the performance in apparel and
textile production in Mexico. For example, a top executive of one of the largest U.S. textile manufacturers
told us that it was managerial capacity that was the primary limitation to the growth of the Mexican textile
sector in the next decade. More generally, the advantages arising from Mexico’s geographic proximity to
the U.S. consumer market can be undermined if suppliers cannot provide short lead times and reliable
deliveries to retail distribution centers. If lead times increase and the reliability of shipments decrease,
Mexico will become increasingly subject to competition from nations that can provide similar performance
at lower cost. For a recent account of resurgence in activity among Mexican “maquiladora” producers, see
Malkin 2004. 28 It is less clear that the CBI nations will be able to develop a textile sector in the near term for several
reasons. First, the NAFTA parity in tariff treatment for the CBI still requires use of textile products
manufactured in the U.S. (unlike NAFTA where there is no such precondition for apparel imported from
Mexico). Second, capital constraints are more substantial in the CBI nations than in Mexico. Finally, the
CBI apparel manufacturers currently in operation have specialized primarily in assembly. There is
therefore less experience in the management of more complex apparel manufacturing than one finds in
Mexico, limiting the supply of skilled managers for textile operations.
Version: March 28, 2005 24
Final draft: Not for quotation or reproduction.
Rather than a preordained future driven by inexorable forces, we believe that informed
choices taken at the private and public level powerfully affect those who will win and
lose in the next decade.
Private Choices
We have argued that the competitive strategies and choices of retailers, apparel
manufacturers, and textile producers will have a major impact on the location of
production for different types of products. The continuing importance of logistic
connections between the manufacturing and distribution of clothing mean that supply
chains will reflect a blend of considerations regarding factor prices, transportation costs
and increasingly adjustments to the risks associated with sourcing products in different
locations. As supply chain decision-makers adopt better means of pricing these risks as
has happened in other markets, it will play an even larger role in sourcing activities. The
fact that innovative firms like Li & Fung have brought risk considerations into their core
strategies is indicative of this latter trend.
With the elimination of quotas, survival of the remaining-- but still sizeable--
apparel sector in US and EU markets depend on using the benefits of proximity from a
design, marketing, and production point of view to respond to increasingly volatile
market demand. The persistence of apparel production in Southern California cannot be
explained away by low wages arising from slack enforcement of labor standards (Weil
2005), but arises from the responsiveness of those firms that have survived. Yet the
pressures to find new means to further expand the advantages from proximity are
significant and will intensify. This requires new means of restructuring the way that
networks of contractors manage supply chain risks (see Tan and Gershwin 2004; Bouhia
and Abernathy 2004).
Textile manufacturers that supply regional and US apparel producers have
survived by a combination of the preferential treatment of domestic fabrics and through
investing in technology at the spinning, weaving, and finishing steps of production thus
allowing them to achieve some of the highest productivity and quality in the world. In
addition, many producers have developed significant brand recognition, creating
Version: March 28, 2005 25
Final draft: Not for quotation or reproduction.
distinctive products such as Polartec®. Survival will require further progress in these areas
as well as further improving their responsiveness to US retailers and consumers.
Similarly, the apparel industries in Mexico, Central America, and the Caribbean
will only maintain their position—even with tariff advantages—by continually improving
the advantages arising from proximity. The quantity of shipments from Mexico and to a
lesser extent from CBI nations has decreased since 2002, arising from the US recession,
trade-related impacts of the 9/11 attacks, and some substitution from other countries. It
may also reflect, however, the lack of improvement in short cycle responsiveness among
Mexican suppliers. Intrinsic advantages arising from physical proximity can be lost if
those producers do not adjust manufacturing, information, and distribution practices to
allow them to be responsive.
The private choices facing developing nations are therefore more complex than
suggested by the common wisdom. Bair and Gereffi (2001, 2003) advocates that Mexico
and other developing nations should focus on the design and marketing phases of apparel
operation as a critical step towards survival. Although this strategy is very tempting,
particularly because (as they point out) a great deal of the profits captured by the supply
chain occur at the design and marketing end, it is not clear that they will successfully
wrest these functions from retailers and major brands for this very reason. Instead, we
believe that Mexican suppliers in Torreon and elsewhere will need to be able not only to
provide the full package of product and services demanded by their powerful customers,
but also do so in a manner that is sustainable for the companies. This is far from simple:
We have seen many US firms whose domestic operations were undermined as much by
factor prices disadvantages as they were from their incapacity to manage risk effectively.
Opportunities for countries in Eastern Europe, North Africa, and Turkey for taking
advantage of proximity advantages into the EU require similar types of competitive
strategies and adjustments.
The impact of replenishment and risk shifting in supply channels also alters the
traditional role apparel and textile industries can play in developing nations. Apparel and
textile sectors remain attractive industries in terms of economic development. But
assuring the success of those industries has become more complex. It will be difficult for
many nations with inadequate infrastructure, distant location from major consumer
Version: March 28, 2005 26
Final draft: Not for quotation or reproduction.
markets, or political (or even climactic) instability, will be at a considerable competitive
disadvantage for many apparel products, even if they have low wage rates. Further, for
those categories of apparel where replenishment is not a major factor in sourcing, the
presence of a large number of countries with extensive apparel capacity means more
intense competition among these nations for a smaller market of non-replenishment
products. Together, these forces will make the future of apparel industries reliant solely
on low wages as the source of competitive advantage (e.g., Bangladesh) increasingly
bleak and vulnerable to the removal of quotas.
Public Choices29
“The death of distance is exaggerated. Trade costs are large, even aside from
trade-policy barriers and even between apparently highly integrated economies.”
(Anderson and Wincoop 2004, p. 691; See also Evans 2003).
Trade costs consist of transport, border-related, local distribution costs that stand
between foreign suppliers and final users. Many of these are directly affected by explicit
public policy (tariffs, exchange rate systems like pegged currencies) as well as implicit
policies such as investments in transportation infrastructures, the efficiency, variability,
and integrity of administrative mechanisms affecting trade relations, and regulations
affecting flows of goods.
National public policies will therefore continue to have a major impact on a
quota-free trading system. For nations hoping to expand their capacities, public policies
that impact the links between their markets and US, EU, and other major consumer
markets will be critical. For example, the port infrastructures in Bangladesh suffer from
problems arising from physical geography, climatologic uncertainty, and enormous 29 We do not deal in this essay with the highly significant issue of public policies dealing with the
employment dislocations arising from trade. The diffuse benefits and concentrated costs arising from quota
elimination require public policy choices regarding how the resulting employment dislocation and sectoral
adjustments are handled. They also raise the equally important set of questions regarding how gains from
trade are shared between labor, capital, and communities. Analytic judgments regarding the way that
underlying forces shape the flow of trade (our concern in this essay) and evaluation of how to redress the
distributional impacts of those flows are distinct. We address those questions elsewhere (e.g. Weil 2005).
Version: March 28, 2005 27
Final draft: Not for quotation or reproduction.
administrative problems. Bangladesh’s long term viability as a source of apparel and
textiles rest on the adoption of public policies that appreciably lower trade costs
associated with the administrative problems (including a significant problem of the
integrity of those processes) and investments in infrastructures that dramatically reduce
the time required to move goods in and out of the country. Movement along these lines
have been very limited in the view of a number of analysts (Rahman 2002; Bhattacharya
and Rahman 2002).
Regional trade policies will also be important sources of public choices after
2005. Tariffs will remain in place for the foreseeable future. In fact, despite the
reduction of tariffs that are part of the WTO, the end of quotas will further reduce
national interest in removing those tariffs. Because they will continue to represent
significant costs (see Table 5), regional agreements that provide tariff relief for signatory
countries like NAFTA, CBTPA and AGOA for the US and the Euro-Mediterranean
Partnership for the EU will remain important instruments of public policies. Proximity
effects further raise the ongoing benefits that may arise from regional arrangements.30
We have cited our skepticism about the conventional wisdom throughout this
essay. Although traditional factors and the ending of the quota system will impact the
sourcing of products, we believe that mainstream predictions miss the mark in several
respects—even in light of the immediate, post-quota surge of apparel imports from
China. Replenishment considerations arising from the new economics of distribution
and production channels explain an important portion of the shifts in sourcing over the
past decade. As lean retailing becomes even more widespread and suppliers more
sophisticated in thinking about managing risk, replenishment considerations will factor
even more heavily into sourcing decisions. This will make the countries with proximity
more competitive for those goods where replenishment is important, and will subject
those countries competing along traditional lines to greater competition over a smaller set
30 The use of safeguard and circuit breaker provisions (particularly with China) will have short- to medium-
term impacts on the location of production (take material from policy paper and place it here). Finally, the
role of the WTO in a quota-less world will be important.
Version: March 28, 2005 28
Final draft: Not for quotation or reproduction.
of apparel products. As these economic factors will not disappear in coming years-
indeed, they will intensify-- this driver of sourcing location will persist.31
31 Even the most sophisticated efforts to forecast the post-2005 impacts have left out the replenishment
dynamic. The USITC models of the effects of China’s accession to the WTO on U.S. apparel production
and employment are indicative. The USITC models are run at the aggregate rather than commodity level.
This undermines the models’ ability to capture the types of changes described here since they have their
primary impact through the composition of products sourced from different countries. The USITC report
indirectly acknowledges this problem: “Finally, the simulations reflect the assumption that the purchasers’
willingness to substitute imports for domestic production remains constant throughout the 12-year period
[1998-2010]. This may not be the case. For example, if domestic producers were to shift production to
specialized sub-sectors, imports could become less viable substitutes and, as a result, purchasers would be
less responsive to changes in import prices.” (USITC 1999, p. 8-20).
Version: March 28, 2005 29

Final draft: Not for quotation or reproduction.
Acknowledgements
We are grateful to the Alfred P. Sloan Foundation for funds supporting this research. We
are also grateful to Janice Hammond, Soundouss Bouhia, Mustafizur Rahman, and
conference participants at the University of North Carolina for their insights and input on
this project and paper.
References
Abernathy, Frederick H., John T. Dunlop, and Janice H. Hammond, and David
Weil. 1999. A Stitch in Time: Lean Retailing and the Transformation of
Manufacturing—Lessons from the Apparel and Textile Industries. (New York: Oxford
University Press).
Abernathy, Frederick H., John T. Dunlop, and Janice H. Hammond, and David
Weil. 2000. “Control Your Inventory in a World of Lean Retailing.” Harvard Business
Review, November/December, pp. 169-176.
Abernathy, Frederick H., John T. Dunlop, and Janice H. Hammond, and David
Weil. 2004. “Globalization in the Apparel and Textile Industries: What is New and What
is Not?” in Martin Kenney and Richard Florida, eds., Locating Global Advantage:
Industry Dynamics in the Global Supply Chain, (Stanford, CA: Stanford University
Press), pp. 23-51.
Anderson, James E. and Eric van Wincoop. 2004. “Trade Costs.” Journal of
Economic Literature. V. 42 (September), pp. 691-751.
Anderson, James E. and Eric van Wincoop. 2002. “Borders, Trade, and
Welfare..” Brookings Trade Forum. Susan Collins and Dani Rodrik, eds., Washington,
D.C.: Brookings Institution, pp. 207-244.
Version: March 28, 2005 30
Final draft: Not for quotation or reproduction.
Bair, Jennifer and Gary Gereffi. 2003. “Upgrading, Uneven Development, and
Jobs in the North American Apparel Industry.” Global Networks, v. 3, no. 2, pp. 143-
169.
Bhattacharya, Debapriya and Mustafizur Rahman. 2002. “Experience with
Implementation of WTO-ATC and Implications for Bangladesh.” Centre for Policy
Dialogue Occasional Paper Series No. 7.
Blustein, Paul. 2005. “Quotas Lifted, Chinese Imports Soar.” Washington Post,
March 12, p.E1.
Bouhia, Soundouss and Frederick Abernathy. 2004. “Scheduling and Ordering
Production Policies in a Limited Capacity Manufacturing System: The Multiple
Replenishment Products Case,” Working Paper, Harvard Center for Textile and Apparel
Research, http://www.hctar.org/pages/pubs.html.
Evans, Carolyn. 2003. “The Economic Significance of National Border Effects.”
American Economic Review, v. 93, no. 4, pp. 1291-1312.
Evans, Carolyn and James Harrigan. 2003. “Tight Clothing: How the MFA
Affects Asian Exports.” Working Paper, Federal Reserve Bank of New York.
Evans, Carolyn and James Harrigan. 2003. “Distance, Time, and Specialization.”
NBER Working Paper no. 9729.
Feenstra, Robert. 1998. “Integration of Trade and Disintegration of Production in
the Global Economy.” Journal of Economic Perspectives. v.12, no. 4, pp. 31-50.
Fung, Victor. 1998. “"Supply Chain Management, Hong Kong Style." Harvard
Business Review, Sep-Oct, pp.104 - 114.
Version: March 28, 2005 31
Final draft: Not for quotation or reproduction.
Gereffi, Gary. 1998. “The Transformation of the North American Apparel
Industry: Is NAFTA a Curse or Blessing?” in Integration and Trade. v. 4, no. 11, pp.
47-95.
Gereffi, Gary. 1999. “International Trade and Industrial Upgrading in the
Apparel Commodity Chain.” Journal of International Economics, v. 48 no. 1 pp. 37-70.
Hagel, John and John Seely Brown. 2001. “Cut Loose from Old Business
Processes,” Optimize Magazine, pp.
Jassin-O’Rourke Group. 2002. “Global Competitiveness Report: Selling to Full
Package Providers.” Report. New York, NY.
Krishna, Kala M. and Ling Hui Tan. 1998. Rags and Riches: Implementing
Apparel Quotas under the Multi-Fiber Arrangement. (Ann Arbor, MI: The University of
Michigan Press).
Loveman, Gary and O’Connell, Jamie 1996. Li & Fung (Trading) Ltd, Harvard
Business School Case Program, .9-396-075.
Malkin, Elisabeth. 2004. “A Boom Along Mexico’s Border.” New York Times,
August 26, 2004, p.W1.
Rahman. Mustafizur. 2002. “U.S.A. Trade and Development Act 2000: A
Response from the Bangladesh Perspective.” Centre for Policy Dialogue Occasional
Paper Series No. 6.
Rose, Mary. 2000. Firms, Networks and Business Values: The British and
American Cotton Industries since 1750. Cambridge, UK: Cambridge University Press.
Version: March 28, 2005 32
Final draft: Not for quotation or reproduction.
Tan, Baris and Stanley Gershwin. 2004. “Production and Subcontracting
Strategies for Manufacturers with Limited Capacity and Volatile Demand.” Annals of
Operations Research, v. 125, pp. 205-232.
Tanzer, Andrew 1999. “Stitches in Time,” Forbes Global, June 6, www.
forbes.com
Tse, Joseph and Joanna Ip. 2002. “WTO Chine.” Deloitte Touche Tohmatsu
Report.
United States International Trade Commission. 1999. Assessment of the Economic
Effects of China’s Accession to the WTO. Investigation No. 332-403, Publication 3229.
Washington, DC: USITC.
United States International Trade Commission. 2004 Textiles and Apparel:
Assessment of the Competitiveness of Certain Foreign Suppliers to the U.S. Market.
(Publication 3671. Washington, DC: USITC.
Weil, David. 2005. “Public Enforcement / Private Monitoring: Evaluating a New
Approach to Regulating the Minimum Wage.” Industrial and Labor Relations Review.
v.58, no.2, pp. 238-257.
Version: March 28, 2005 33
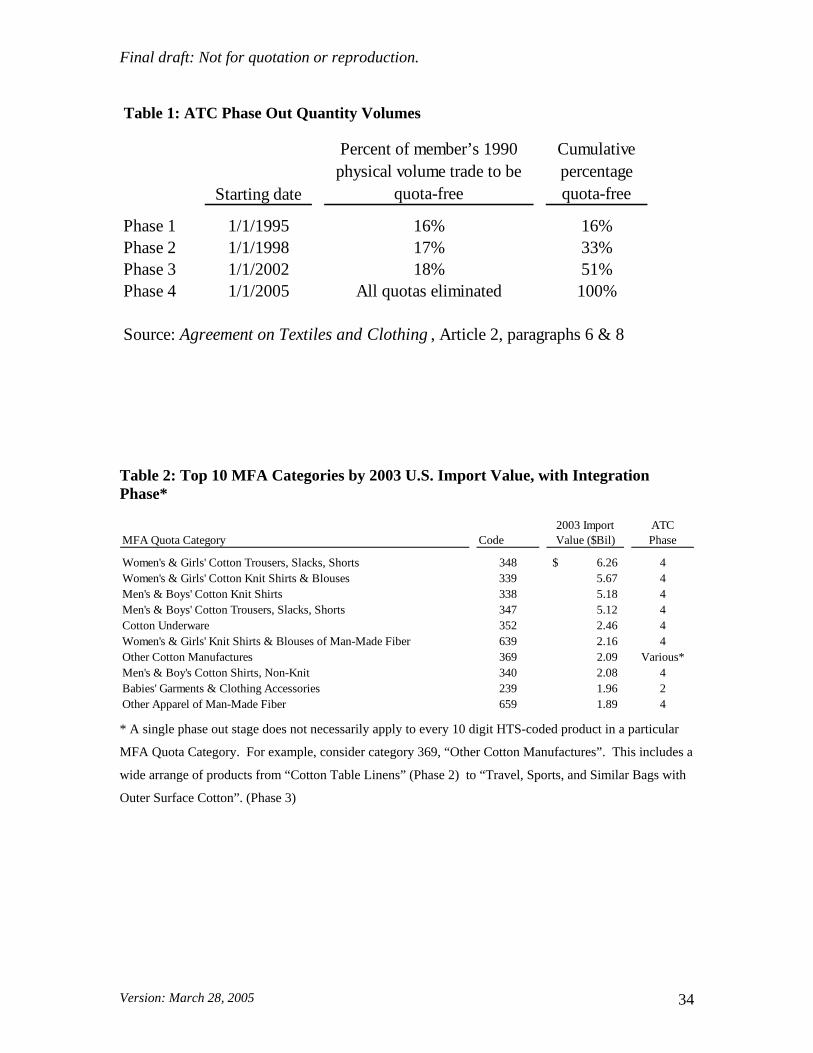
Final draft: Not for quotation or reproduction.
Table 1: ATC Phase Out Quantity Volumes
Starting date
Phase 1 1/1/1995 16% 16%Phase 2 1/1/1998 17% 33%Phase 3 1/1/2002 18% 51%Phase 4 1/1/2005 All quotas eliminated 100%
Source: Agreement on Textiles and Clothing , Article 2, paragraphs 6 & 8
Cumulative percentage quota-free
Percent of member’s 1990 physical volume trade to be
quota-free
Table 2: Top 10 MFA Categories by 2003 U.S. Import Value, with Integration Phase*
2003 Import ATCMFA Quota Category Code Value ($Bil) Phase
Women's & Girls' Cotton Trousers, Slacks, Shorts 348 6.26$ 4Women's & Girls' Cotton Knit Shirts & Blouses 339 5.67 4Men's & Boys' Cotton Knit Shirts 338 5.18 4Men's & Boys' Cotton Trousers, Slacks, Shorts 347 5.12 4Cotton Underware 352 2.46 4Women's & Girls' Knit Shirts & Blouses of Man-Made Fiber 639 2.16 4Other Cotton Manufactures 369 2.09 Various*Men's & Boy's Cotton Shirts, Non-Knit 340 2.08 4Babies' Garments & Clothing Accessories 239 1.96 2Other Apparel of Man-Made Fiber 659 1.89 4 * A single phase out stage does not necessarily apply to every 10 digit HTS-coded product in a particular
MFA Quota Category. For example, consider category 369, “Other Cotton Manufactures”. This includes a
wide arrange of products from “Cotton Table Linens” (Phase 2) to “Travel, Sports, and Similar Bags with
Outer Surface Cotton”. (Phase 3)
Version: March 28, 2005 34
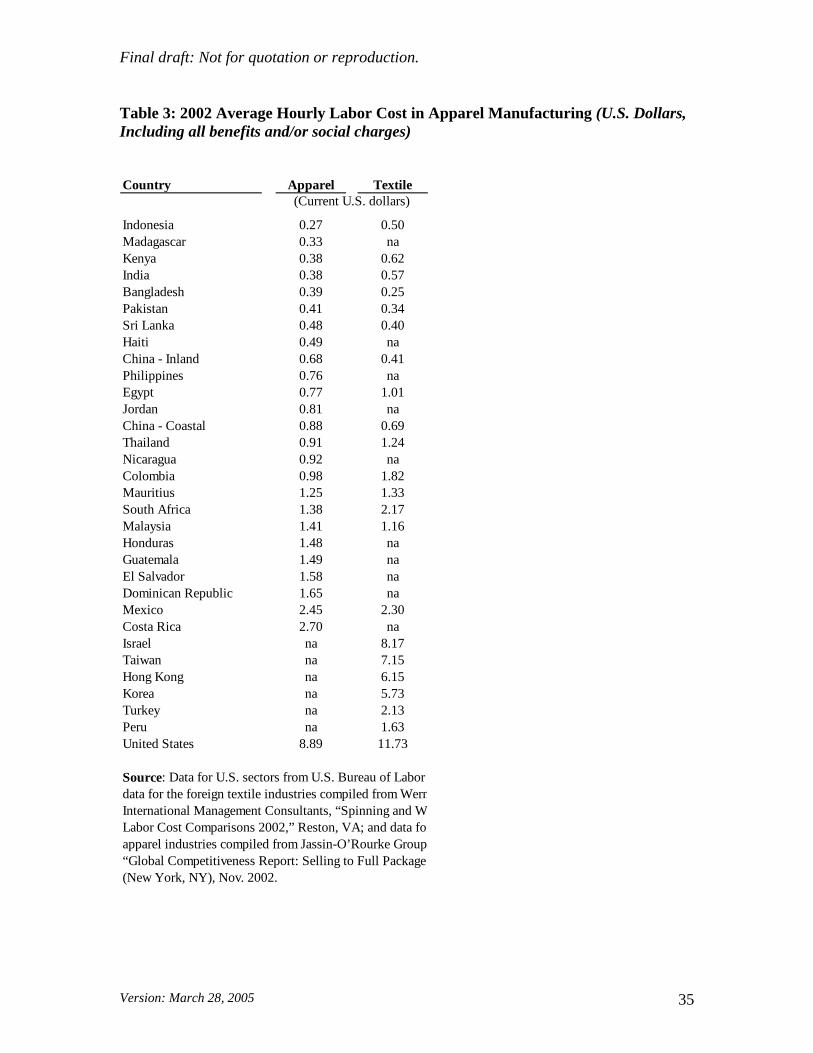
Final draft: Not for quotation or reproduction.
Table 3: 2002 Average Hourly Labor Cost in Apparel Manufacturing (U.S. Dollars, Including all benefits and/or social charges)
Country Apparel Textile
Indonesia 0.27 0.50Madagascar 0.33 naKenya 0.38 0.62India 0.38 0.57Bangladesh 0.39 0.25Pakistan 0.41 0.34Sri Lanka 0.48 0.40Haiti 0.49 naChina - Inland 0.68 0.41Philippines 0.76 naEgypt 0.77 1.01Jordan 0.81 naChina - Coastal 0.88 0.69Thailand 0.91 1.24Nicaragua 0.92 naColombia 0.98 1.82Mauritius 1.25 1.33South Africa 1.38 2.17Malaysia 1.41 1.16Honduras 1.48 naGuatemala 1.49 naEl Salvador 1.58 naDominican Republic 1.65 naMexico 2.45 2.30Costa Rica 2.70 naIsrael na 8.17Taiwan na 7.15Hong Kong na 6.15Korea na 5.73Turkey na 2.13Peru na 1.63United States 8.89 11.73
Source: Data for U.S. sectors from U.S. Bureau of Labor data for the foreign textile industries compiled from WernInternational Management Consultants, “Spinning and WLabor Cost Comparisons 2002,” Reston, VA; and data forapparel industries compiled from Jassin-O’Rourke Group“Global Competitiveness Report: Selling to Full Package (New York, NY), Nov. 2002.
(Current U.S. dollars)
Version: March 28, 2005 35
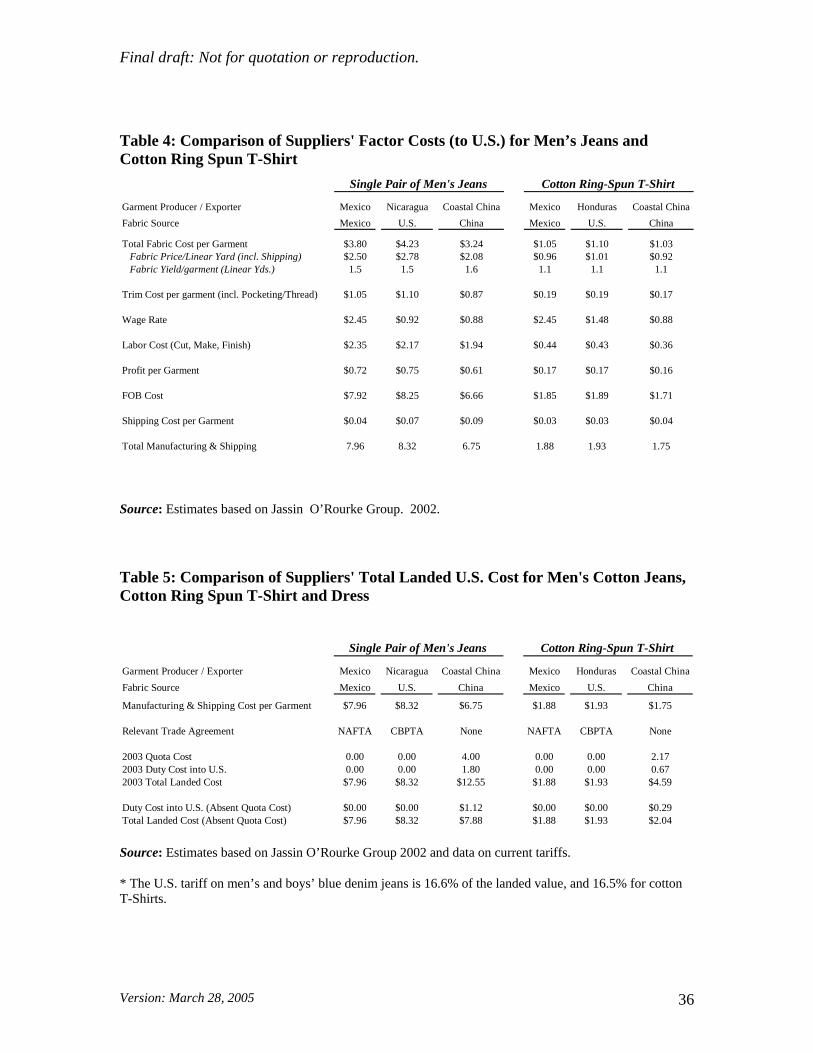
Final draft: Not for quotation or reproduction.
Table 4: Comparison of Suppliers' Factor Costs (to U.S.) for Men’s Jeans and Cotton Ring Spun T-Shirt
Garment Producer / Exporter Mexico Nicaragua Coastal China Mexico Honduras Coastal ChinaFabric Source Mexico U.S. China Mexico U.S. China
Total Fabric Cost per Garment $3.80 $4.23 $3.24 $1.05 $1.10 $1.03 Fabric Price/Linear Yard (incl. Shipping) $2.50 $2.78 $2.08 $0.96 $1.01 $0.92 Fabric Yield/garment (Linear Yds.) 1.5 1.5 1.6 1.1 1.1 1.1
Trim Cost per garment (incl. Pocketing/Thread) $1.05 $1.10 $0.87 $0.19 $0.19 $0.17
Wage Rate $2.45 $0.92 $0.88 $2.45 $1.48 $0.88
Labor Cost (Cut, Make, Finish) $2.35 $2.17 $1.94 $0.44 $0.43 $0.36
Profit per Garment $0.72 $0.75 $0.61 $0.17 $0.17 $0.16
FOB Cost $7.92 $8.25 $6.66 $1.85 $1.89 $1.71
Shipping Cost per Garment $0.04 $0.07 $0.09 $0.03 $0.03 $0.04
Total Manufacturing & Shipping 7.96 8.32 6.75 1.88 1.93 1.75
Single Pair of Men's Jeans Cotton Ring-Spun T-Shirt
Source: Estimates based on Jassin O’Rourke Group. 2002.
Table 5: Comparison of Suppliers' Total Landed U.S. Cost for Men's Cotton Jeans, Cotton Ring Spun T-Shirt and Dress
Garment Producer / Exporter Mexico Nicaragua Coastal China Mexico Honduras Coastal ChinaFabric Source Mexico U.S. China Mexico U.S. China
Manufacturing & Shipping Cost per Garment $7.96 $8.32 $6.75 $1.88 $1.93 $1.75
Relevant Trade Agreement NAFTA CBPTA None NAFTA CBPTA None
2003 Quota Cost 0.00 0.00 4.00 0.00 0.00 2.172003 Duty Cost into U.S. 0.00 0.00 1.80 0.00 0.00 0.672003 Total Landed Cost $7.96 $8.32 $12.55 $1.88 $1.93 $4.59
Duty Cost into U.S. (Absent Quota Cost) $0.00 $0.00 $1.12 $0.00 $0.00 $0.29Total Landed Cost (Absent Quota Cost) $7.96 $8.32 $7.88 $1.88 $1.93 $2.04
Single Pair of Men's Jeans Cotton Ring-Spun T-Shirt
Source: Estimates based on Jassin O’Rourke Group 2002 and data on current tariffs.
* The U.S. tariff on men’s and boys’ blue denim jeans is 16.6% of the landed value, and 16.5% for cotton T-Shirts.
Version: March 28, 2005 36
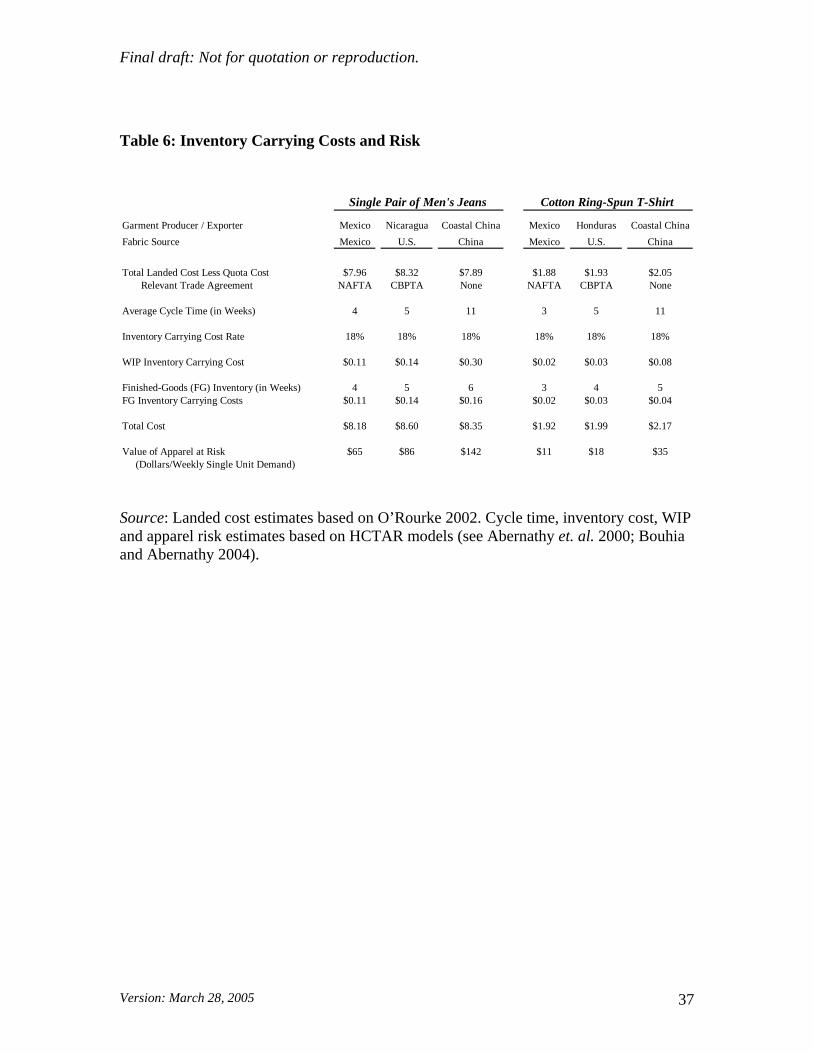
Final draft: Not for quotation or reproduction.
Table 6: Inventory Carrying Costs and Risk
Garment Producer / Exporter Mexico Nicaragua Coastal China Mexico Honduras Coastal ChinaFabric Source Mexico U.S. China Mexico U.S. China
Total Landed Cost Less Quota Cost $7.96 $8.32 $7.89 $1.88 $1.93 $2.05 Relevant Trade Agreement NAFTA CBPTA None NAFTA CBPTA None
Average Cycle Time (in Weeks) 4 5 11 3 5 11
Inventory Carrying Cost Rate 18% 18% 18% 18% 18% 18%
WIP Inventory Carrying Cost $0.11 $0.14 $0.30 $0.02 $0.03 $0.08
Finished-Goods (FG) Inventory (in Weeks) 4 5 6 3 4 5FG Inventory Carrying Costs $0.11 $0.14 $0.16 $0.02 $0.03 $0.04
Total Cost $8.18 $8.60 $8.35 $1.92 $1.99 $2.17
Value of Apparel at Risk $65 $86 $142 $11 $18 $35 (Dollars/Weekly Single Unit Demand)
Single Pair of Men's Jeans Cotton Ring-Spun T-Shirt
Source: Landed cost estimates based on O’Rourke 2002. Cycle time, inventory cost, WIP and apparel risk estimates based on HCTAR models (see Abernathy et. al. 2000; Bouhia and Abernathy 2004).
Version: March 28, 2005 37
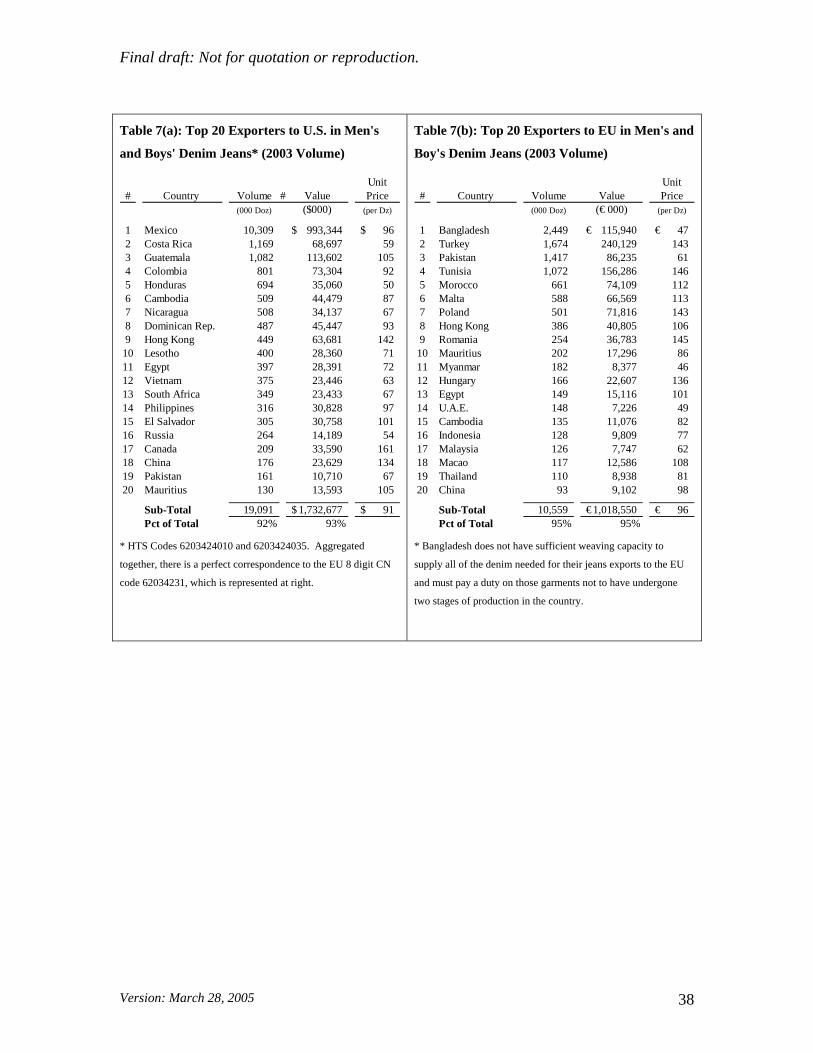
Final draft: Not for quotation or reproduction.
Table 7(a): Top 20 Exporters to U.S. in Men's
and Boys' Denim Jeans* (2003 Volume)
Unit# Country Volume # Value Price
(000 Doz) ($000) (per Dz)
1 Mexico 10,309 993,344$ 96$ 2 Costa Rica 1,169 68,697 59 3 Guatemala 1,082 113,602 105 4 Colombia 801 73,304 92 5 Honduras 694 35,060 50 6 Cambodia 509 44,479 87 7 Nicaragua 508 34,137 67 8 Dominican Rep. 487 45,447 93 9 Hong Kong 449 63,681 142
10 Lesotho 400 28,360 71 11 Egypt 397 28,391 72 12 Vietnam 375 23,446 63 13 South Africa 349 23,433 67 14 Philippines 316 30,828 97 15 El Salvador 305 30,758 101 16 Russia 264 14,189 54 17 Canada 209 33,590 161 18 China 176 23,629 134 19 Pakistan 161 10,710 67 20 Mauritius 130 13,593 105
Sub-Total 19,091 1,732,677$ 91$ Pct of Total 92% 93%
* HTS Codes 6203424010 and 6203424035. Aggregated
together, there is a perfect correspondence to the EU 8 digit CN
code 62034231, which is represented at right.
Table 7(b): Top 20 Exporters to EU in Men's and
Boy's Denim Jeans (2003 Volume)
Unit# Country Volume Value Price
(000 Doz) (€ 000) (per Dz)
1 Bangladesh 2,449 115,940€ 47€ 2 Turkey 1,674 240,129 143 3 Pakistan 1,417 86,235 61 4 Tunisia 1,072 156,286 146 5 Morocco 661 74,109 112 6 Malta 588 66,569 113 7 Poland 501 71,816 143 8 Hong Kong 386 40,805 106 9 Romania 254 36,783 145
10 Mauritius 202 17,296 86 11 Myanmar 182 8,377 46 12 Hungary 166 22,607 136 13 Egypt 149 15,116 101 14 U.A.E. 148 7,226 49 15 Cambodia 135 11,076 82 16 Indonesia 128 9,809 77 17 Malaysia 126 7,747 62 18 Macao 117 12,586 108 19 Thailand 110 8,938 81 20 China 93 9,102 98
Sub-Total 10,559 1,018,550€ 96€ Pct of Total 95% 95%
* Bangladesh does not have sufficient weaving capacity to
supply all of the denim needed for their jeans exports to the EU
and must pay a duty on those garments not to have undergone
two stages of production in the country.
Version: March 28, 2005 38
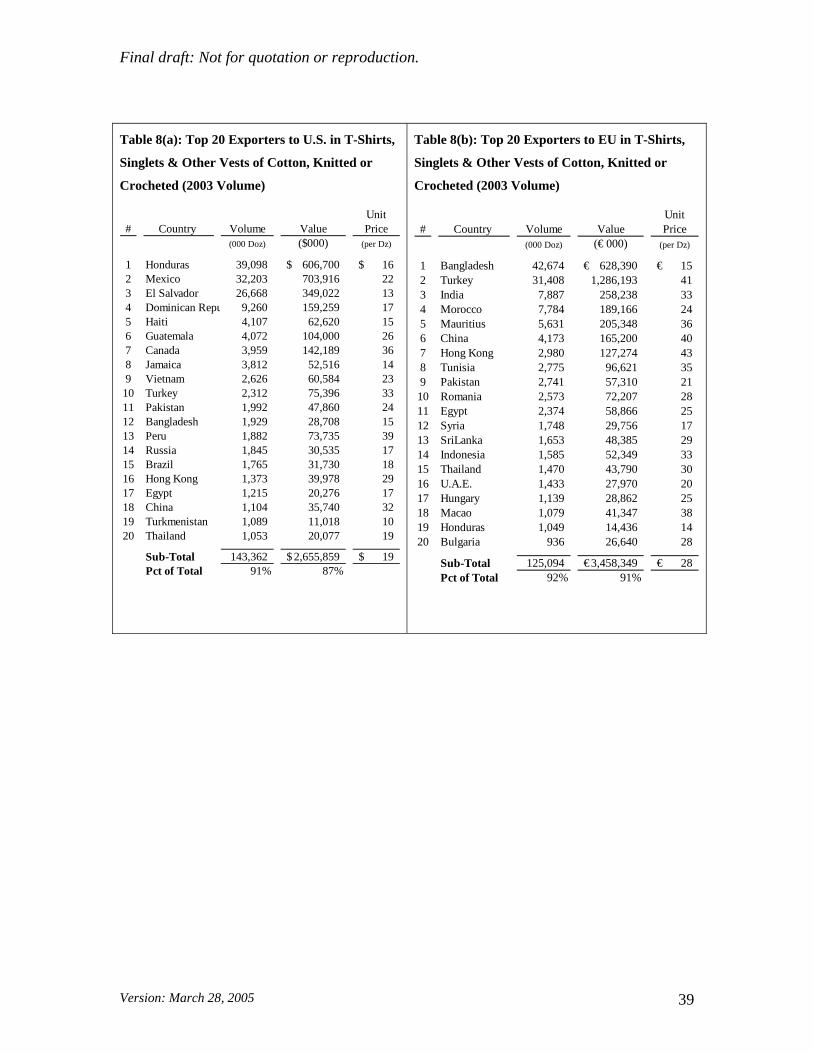
Final draft: Not for quotation or reproduction.
Table 8(a): Top 20 Exporters to U.S. in T-Shirts,
Singlets & Other Vests of Cotton, Knitted or
Crocheted (2003 Volume)
Unit# Country Volume Value Price
(000 Doz) ($000) (per Dz)
1 Honduras 39,098 606,700$ 16$ 2 Mexico 32,203 703,916 22 3 El Salvador 26,668 349,022 13 4 Dominican Repu 9,260 159,259 17 5 Haiti 4,107 62,620 15 6 Guatemala 4,072 104,000 26 7 Canada 3,959 142,189 36 8 Jamaica 3,812 52,516 14 9 Vietnam 2,626 60,584 23 10 Turkey 2,312 75,396 33 11 Pakistan 1,992 47,860 24 12 Bangladesh 1,929 28,708 15 13 Peru 1,882 73,735 39 14 Russia 1,845 30,535 17 15 Brazil 1,765 31,730 18 16 Hong Kong 1,373 39,978 29 17 Egypt 1,215 20,276 17 18 China 1,104 35,740 32 19 Turkmenistan 1,089 11,018 10 20 Thailand 1,053 20,077 19
Sub-Total 143,362 2,655,859$ 19$ Pct of Total 91% 87%
Table 8(b): Top 20 Exporters to EU in T-Shirts,
Singlets & Other Vests of Cotton, Knitted or
Crocheted (2003 Volume)
Unit# Country Volume Value Price
(000 Doz) (€ 000) (per Dz)
1 Bangladesh 42,674 628,390€ 15€ 2 Turkey 31,408 1,286,193 41 3 India 7,887 258,238 33 4 Morocco 7,784 189,166 24 5 Mauritius 5,631 205,348 36 6 China 4,173 165,200 40 7 Hong Kong 2,980 127,274 43 8 Tunisia 2,775 96,621 35 9 Pakistan 2,741 57,310 21 10 Romania 2,573 72,207 28 11 Egypt 2,374 58,866 25 12 Syria 1,748 29,756 17 13 SriLanka 1,653 48,385 29 14 Indonesia 1,585 52,349 33 15 Thailand 1,470 43,790 30 16 U.A.E. 1,433 27,970 20 17 Hungary 1,139 28,862 25 18 Macao 1,079 41,347 38 19 Honduras 1,049 14,436 14 20 Bulgaria 936 26,640 28
Sub-Total 125,094 3,458,349€ 28€ Pct of Total 92% 91%
Version: March 28, 2005 39

Final draft: Not for quotation or reproduction.
Table 9(a): Top 20 Exporters to U.S. in
Women's & Girls' Cotton Dresses, Not Knitted
or Crocheted (2003 Volume)
Unit# Country Volume Value Price
(000 Dz) ($000) (per Dz)
1 India 551 39,915$ 72$ 2 Philippines 491 29,220 60 3 Bangladesh 319 14,564 46 4 Sri Lanka (Ceylon) 288 17,847 62 5 Thailand 164 8,668 53 6 China 164 22,130 135 7 Indonesia 146 8,975 62 8 Pakistan 134 3,999 30 9 Vietnam 126 5,734 46 10 Hong Kong 121 16,364 135 11 United Arab Emirates 84 4,535 54 12 Cambodia 83 5,093 61 13 Mexico 57 3,787 67 14 El Salvador 32 2,671 83 15 Qatar 30 1,313 44 16 Macau 27 3,022 111 17 Nepal 27 1,086 40 18 South Africa 24 1,223 52 19 Taiwan 22 2,728 121 20 Turkey 22 1,681 75
Sub-Total 2,912 194,554$ 67$ Pct of Total 93% 88%
Table 9(b): Top 20 Exporters to EU in Women's
& Girls' Cotton Dresses, Not Knitted or
Crocheted (2003 Volume)
Unit# Country Volume Value Price
(000 Dz) (€ 000) (per Dz)
1 India 856 47,743€ 56€ 2 Morocco 227 20,118 89 3 Hong Kong 202 16,214 80 4 Germany 175 20,208 116 5 Turkey 169 15,657 93 6 Bangladesh 156 5,966 38 7 Tunisia 150 14,905 100 8 China 133 11,217 85 9 Belgium 131 11,850 91 10 France 97 16,166 167 11 Romania 73 8,514 117 12 Sri Lanka 72 3,818 53 13 Italy 61 18,488 305 14 Pakistan 60 2,303 39 15 Netherlands 58 7,583 131 16 Spain 51 8,833 175 17 Thailand 46 2,502 55 18 Macao 45 3,740 83 19 Indonesia 39 2,663 67 20 Portugal 38 5,001 133
Sub-Total 2,835 243,490€ 86€ Pct of Total 87% 84%
Version: March 28, 2005 40
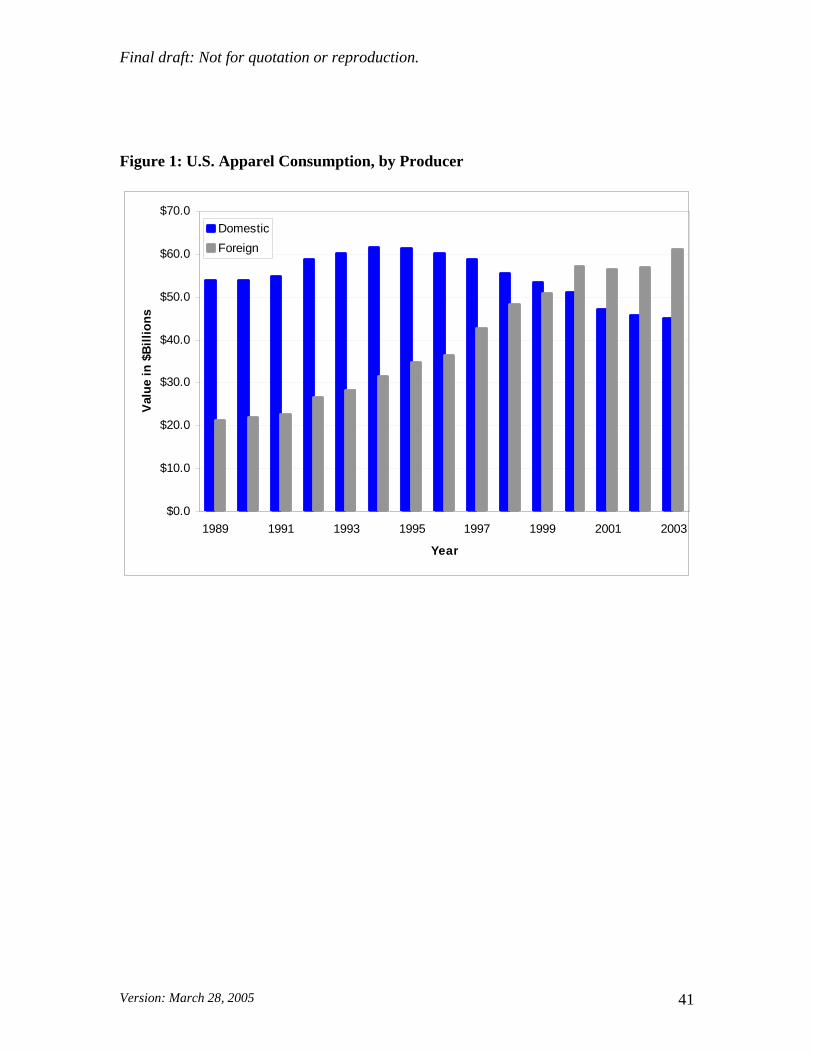
Final draft: Not for quotation or reproduction.
Figure 1: U.S. Apparel Consumption, by Producer
$0.0
$10.0
$20.0
$30.0
$40.0
$50.0
$60.0
$70.0
1989 1991 1993 1995 1997 1999 2001 2003
Year
Val
ue in
$B
illio
ns
DomesticForeign
Version: March 28, 2005 41
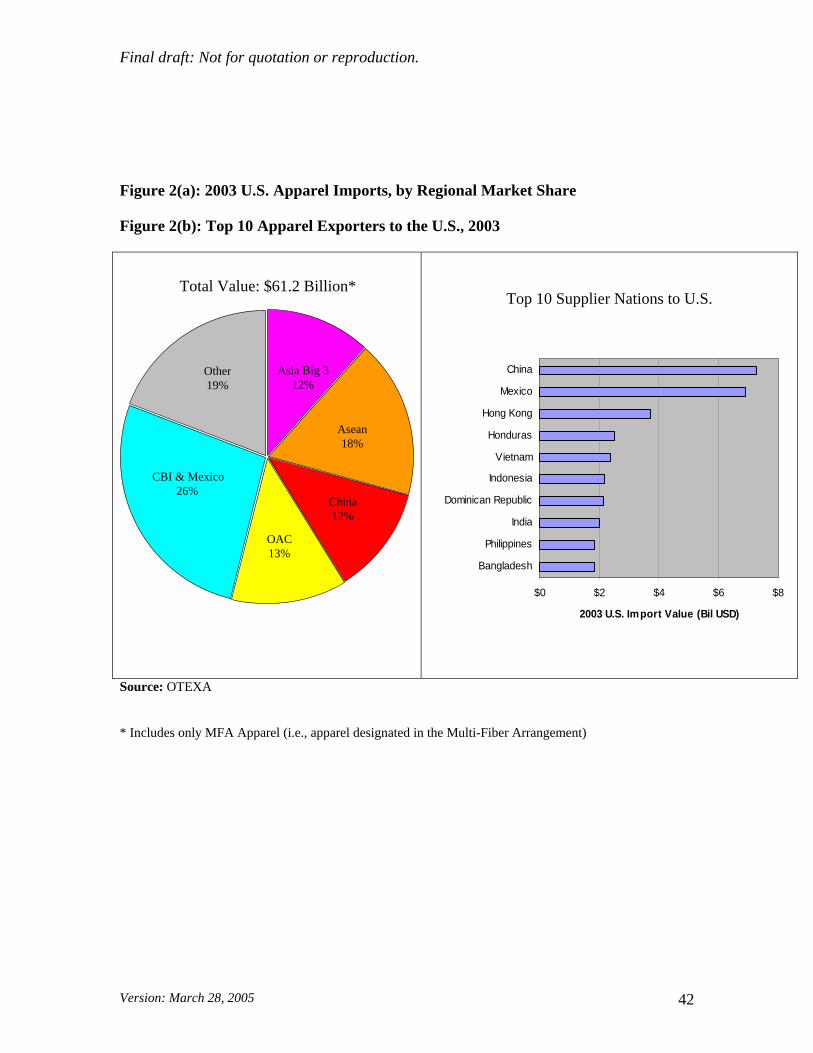
Final draft: Not for quotation or reproduction.
Figure 2(a): 2003 U.S. Apparel Imports, by Regional Market Share
Figure 2(b): Top 10 Apparel Exporters to the U.S., 2003
Top 10 Supplier Nations to U.S.
$0 $2 $4 $6 $8
Bangladesh
Philippines
India
Dominican Republic
Indonesia
Vietnam
Honduras
Hong Kong
Mexico
China
2003 U.S. Import Value (Bil USD)
Total Value: $61.2 Billion*
Other19%
CBI & Mexico26%
OAC 13%
China12%
Asean18%
Asia Big 312%
Source: OTEXA
* Includes only MFA Apparel (i.e., apparel designated in the Multi-Fiber Arrangement)
Version: March 28, 2005 42
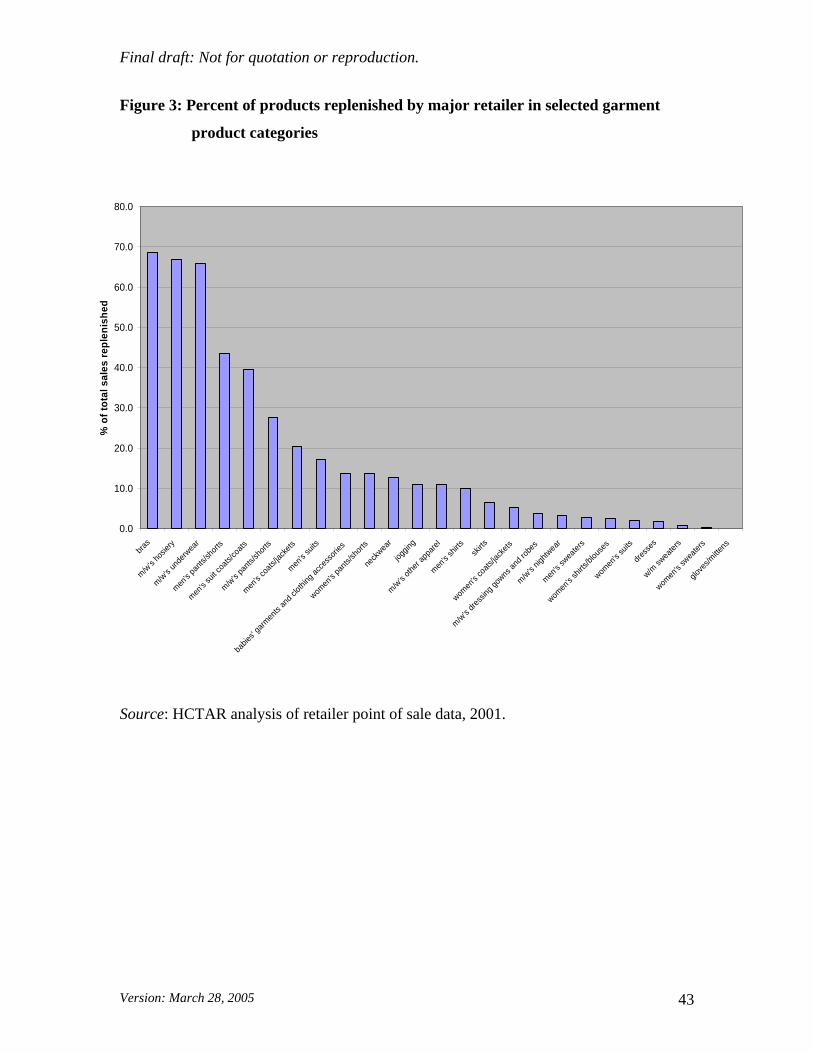
Final draft: Not for quotation or reproduction.
Figure 3: Percent of products replenished by major retailer in selected garment
product categories
0.0
10.0
20.0
30.0
40.0
50.0
60.0
70.0
80.0
bras
m/w's
hosie
ry
m/w's
unde
rwea
r
men's p
ants/
short
s
men's
suit c
oats/
coats
m/w's
pants
/short
s
men's c
oats/
jacke
ts
men's
suits
babie
s' garm
ents
and c
lothin
g acc
esso
ries
women
's pan
ts/sh
orts
neck
wear
joggin
g
m/w's o
ther a
ppare
l
men's s
hirts
skirts
women
's co
ats/ja
ckets
m/w's
dress
ing go
wns an
d rob
es
m/w's
nightw
ear
men's
swea
ters
women
's shir
ts/blo
uses
women
's su
its
dress
es
w/m sw
eater
s
women
's sw
eater
s
glove
s/mitte
ns
% o
f tot
al s
ales
repl
enis
hed
Source: HCTAR analysis of retailer point of sale data, 2001.
Version: March 28, 2005 43
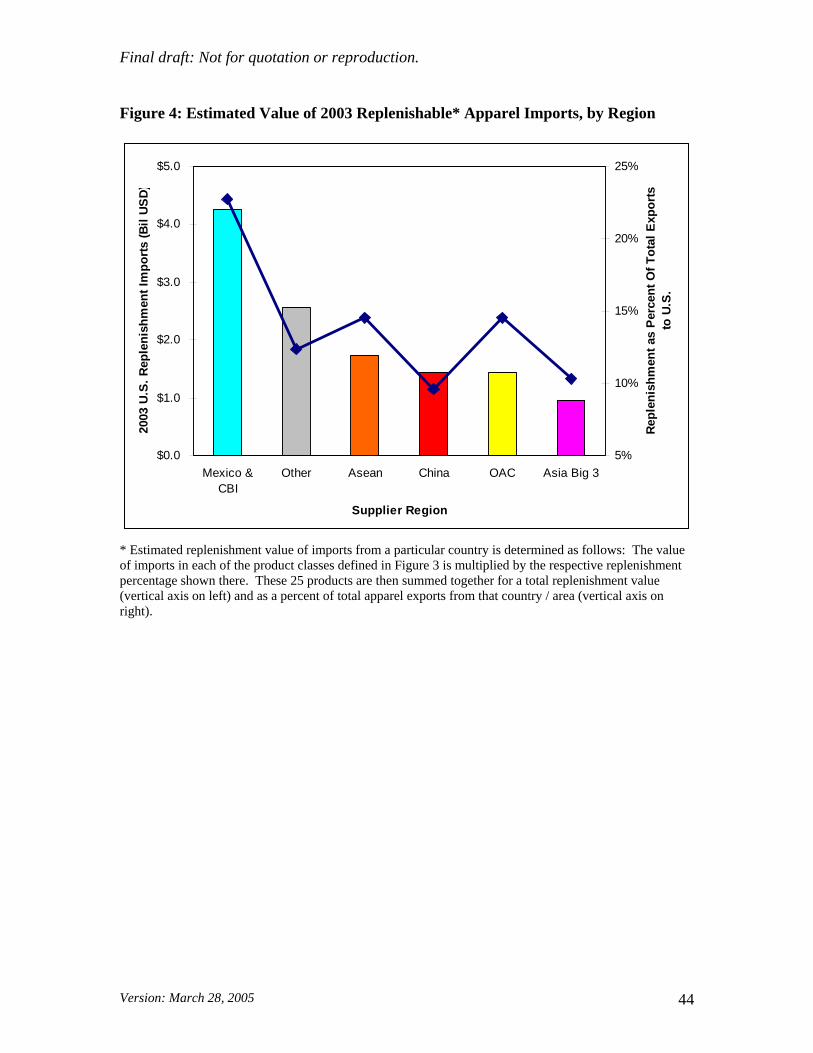
Final draft: Not for quotation or reproduction.
Figure 4: Estimated Value of 2003 Replenishable* Apparel Imports, by Region
$0.0
$1.0
$2.0
$3.0
$4.0
$5.0
Mexico &CBI
Other Asean China OAC Asia Big 3
Supplier Region
2003
U.S
. Rep
leni
shm
ent I
mpo
rts
(Bil
USD
)
5%
10%
15%
20%
25%
Repl
enis
hmen
t as
Per
cent
Of T
otal
Exp
orts
to
U.S
.
* Estimated replenishment value of imports from a particular country is determined as follows: The value of imports in each of the product classes defined in Figure 3 is multiplied by the respective replenishment percentage shown there. These 25 products are then summed together for a total replenishment value (vertical axis on left) and as a percent of total apparel exports from that country / area (vertical axis on right).
Version: March 28, 2005 44
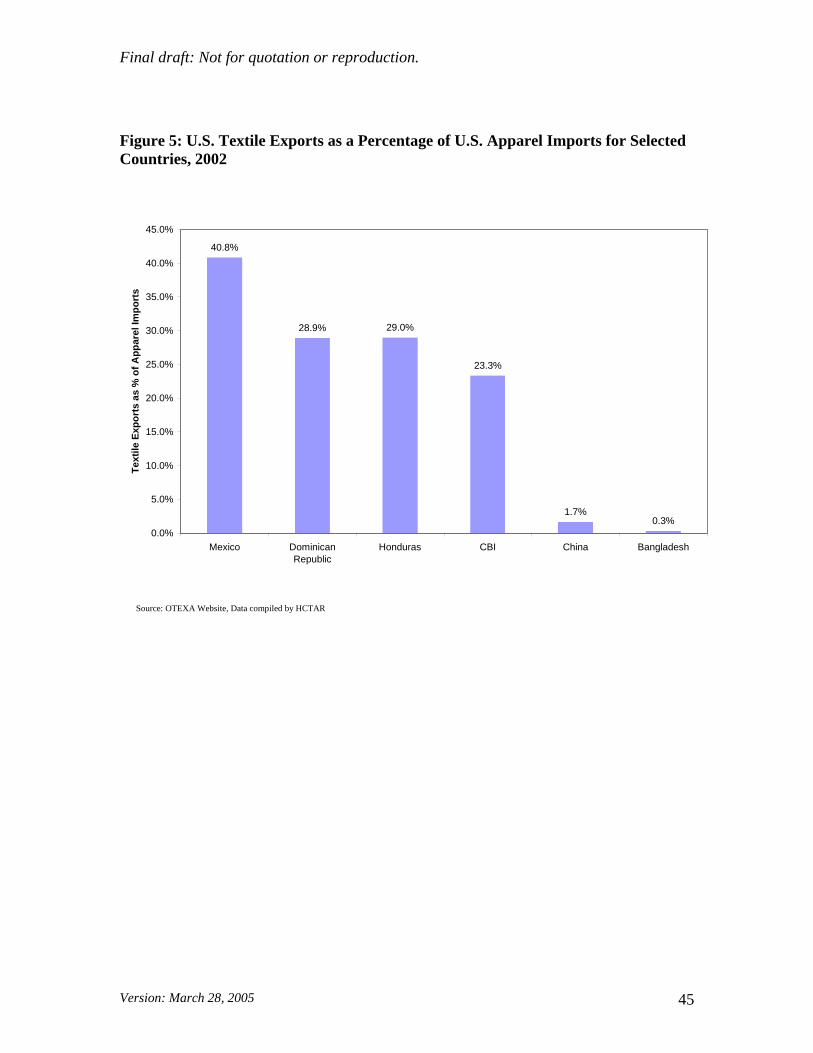
Final draft: Not for quotation or reproduction.
Figure 5: U.S. Textile Exports as a Percentage of U.S. Apparel Imports for Selected Countries, 2002
28.9% 29.0%
1.7%
40.8%
0.3%
23.3%
0.0%
5.0%
10.0%
15.0%
20.0%
25.0%
30.0%
35.0%
40.0%
45.0%
Mexico DominicanRepublic
Honduras CBI China Bangladesh
Text
ile E
xpor
ts a
s %
of A
ppar
el Im
port
s
Source: OTEXA Website, Data compiled by HCTAR
Version: March 28, 2005 45