administrative services survey overview - stanford university
TRANSCRIPT
1
ADMINISTRATIVE SERVICES SURVEY OVERVIEW
Survey Goals:
1. To provide the campus community with an opportunity to give input on their satisfaction and dissatisfaction with administrative services provided in support of Stanford’s mission.
2. To understand what is working well and why.
3. To identify areas for improved user experience and increased efficiency
4. To serve as the basis for action plans that support continuous improvement.
Survey Scope: The survey covered a variety of administrative areas, including human resources, research administration, purchasing, expense reimbursement, invoice payment and travel services. Survey Date: October 20 – November 9, 2009. Respondents: The survey was targeted to the primary users of Stanford’s administrative services: 1,868 Stanford University faculty and 10,263 Stanford staff. Employees at SLAC and Hoover Institution and members of the campus bargaining units were not included.
2
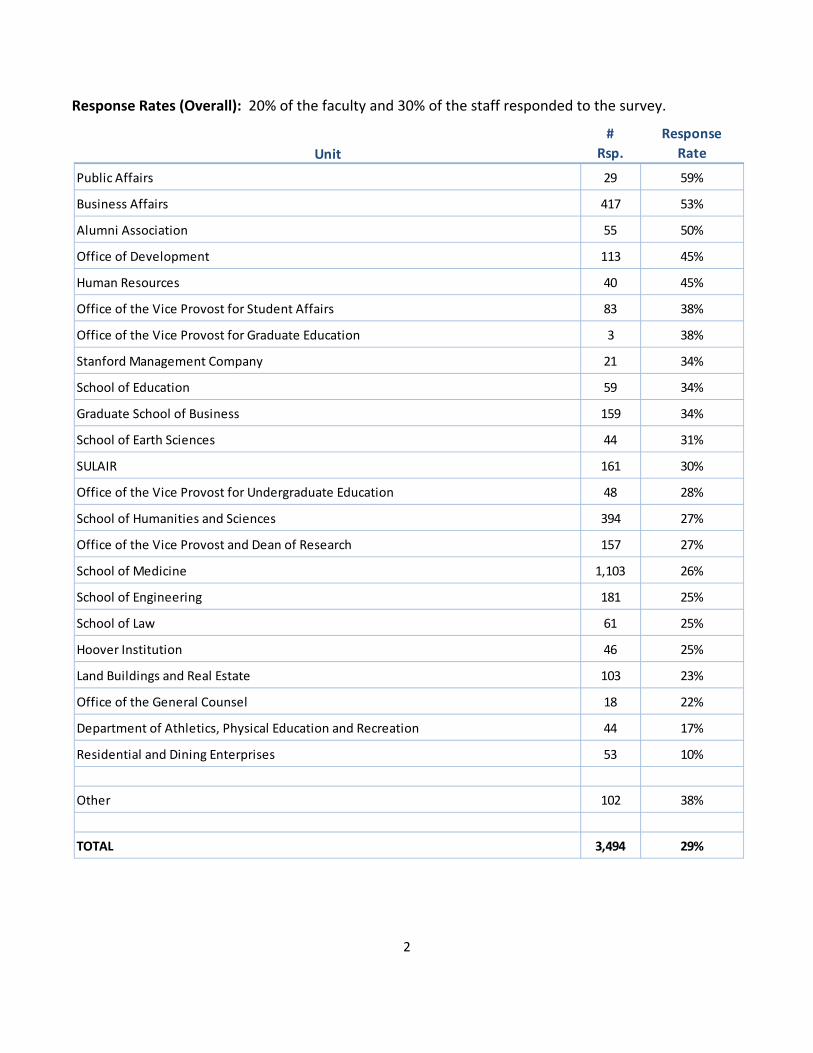
Response Rates (Overall): 20% of the faculty and 30% of the staff responded to the survey.
Unit#
Rsp.Response
Rate
Public Affairs 29 59%
Business Affairs 417 53%
Alumni Association 55 50%
Office of Development 113 45%
Human Resources 40 45%
Office of the Vice Provost for Student Affairs 83 38%
Office of the Vice Provost for Graduate Education 3 38%
Stanford Management Company 21 34%
School of Education 59 34%
Graduate School of Business 159 34%
School of Earth Sciences 44 31%
SULAIR 161 30%
Office of the Vice Provost for Undergraduate Education 48 28%
School of Humanities and Sciences 394 27%
Office of the Vice Provost and Dean of Research 157 27%
School of Medicine 1,103 26%
School of Engineering 181 25%
School of Law 61 25%
Hoover Institution 46 25%
Land Buildings and Real Estate 103 23%
Office of the General Counsel 18 22%
Department of Athletics, Physical Education and Recreation 44 17%
Residential and Dining Enterprises 53 10%
Other 102 38%
TOTAL 3,494 29%
3
ADMINISTRATIVE SERVICES SURVEY QUESTIONS AND RESULTS
I. Research Administration: General II. Research Administration: Submitting Sponsored Research Proposals III. Research Administration: Setting Up Sponsored Research Awards IV. Research Administration: Grant Management V. Research Administration: Website VI. Purchasing: General VII. Purchasing: Online Catalogue Ordering VIII. Purchasing: Rapid Purchase Order IX. Purchasing: Standard Requisition X. Invoice Payments XI. Expense Reports and Reimbursements XII. Travel Services XIII. Gateway to Financial Activities XIV. Help Desk XV. Human Resources: Services XVI. Human Resources: Website and Other Online Tools XVII. Human Resources: Staff Recruiting XVIII. Stanford’s Administrative Guide
Note: The responses in the following report are broken down between faculty and staff whenever relevant. When fewer than 50 faculty members responded, and their responses represented less than 10% of the total, only the total response is shown.
4
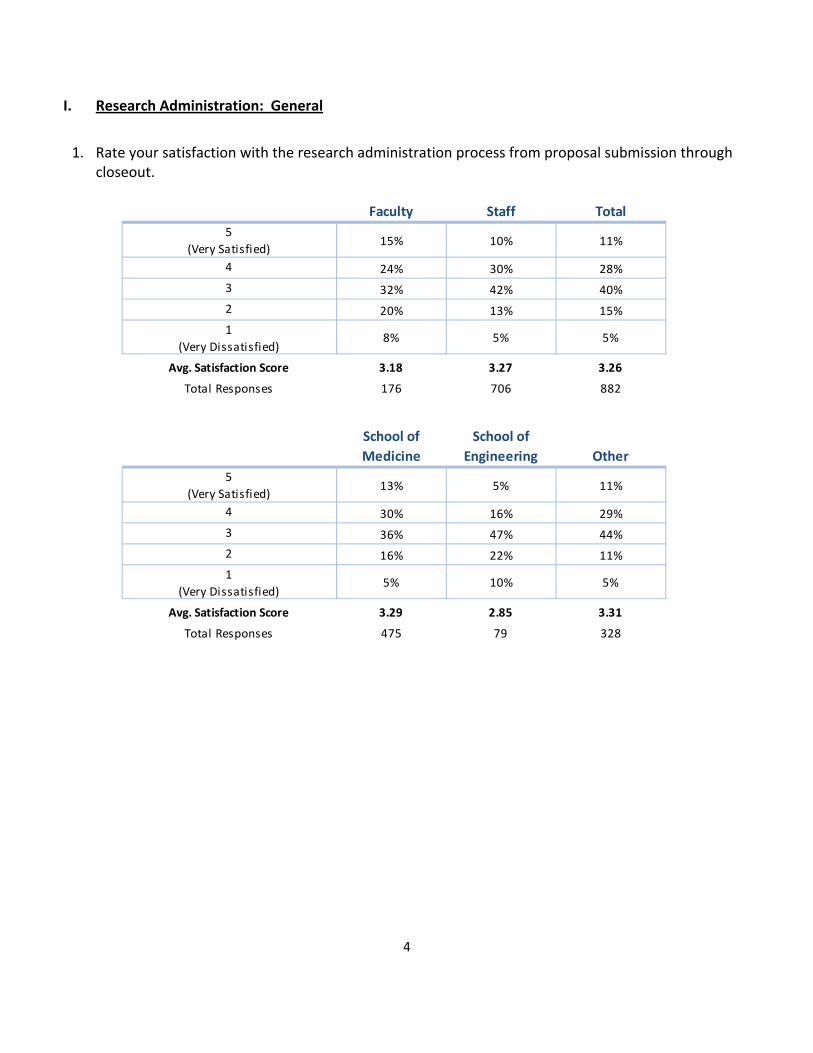
I. Research Administration: General
1. Rate your satisfaction with the research administration process from proposal submission through closeout.
Faculty Staff Total5
(Very Satisfied)15% 10% 11%
4 24% 30% 28%
3 32% 42% 40%
2 20% 13% 15%
1(Very Dissatisfied)
8% 5% 5%
Avg. Satisfaction Score 3.18 3.27 3.26
Total Responses 176 706 882
School of Medicine
School of Engineering Other
5(Very Satisfied)
13% 5% 11%
4 30% 16% 29%
3 36% 47% 44%
2 16% 22% 11%
1(Very Dissatisfied)
5% 10% 5%
Avg. Satisfaction Score 3.29 2.85 3.31
Total Responses 475 79 328
5
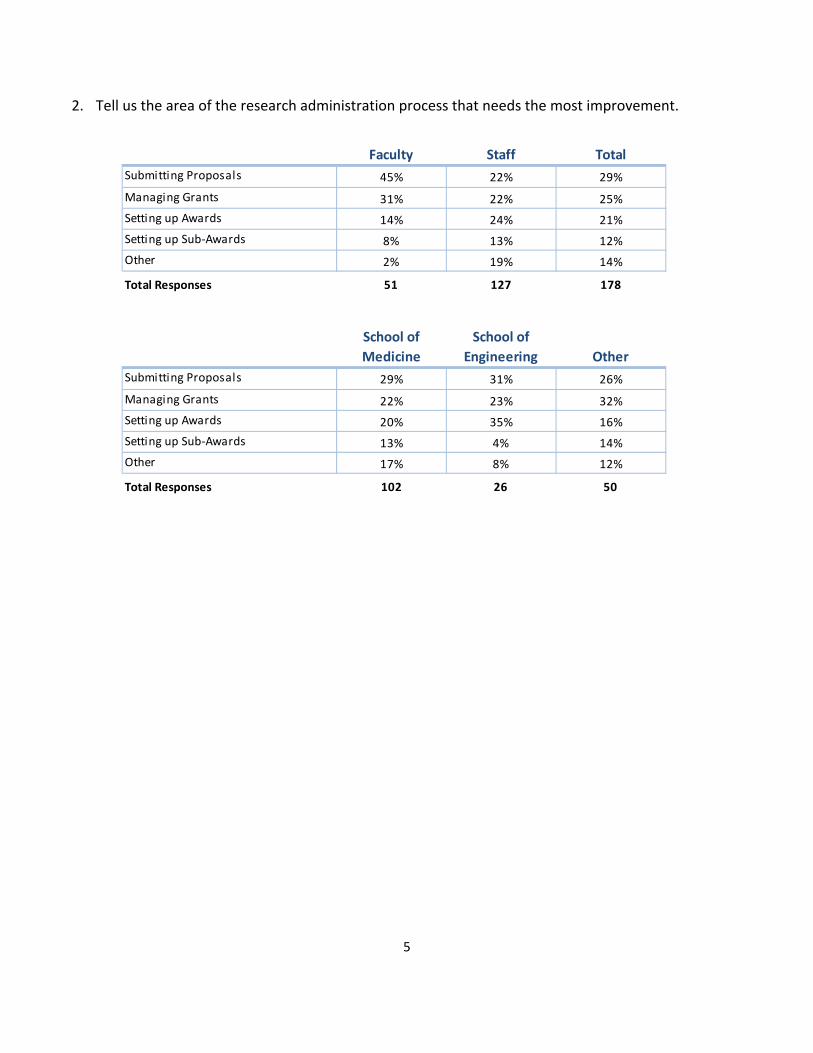
2. Tell us the area of the research administration process that needs the most improvement.
Faculty Staff TotalSubmitting Proposals 45% 22% 29%
Managing Grants 31% 22% 25%
Setting up Awards 14% 24% 21%
Setting up Sub‐Awards 8% 13% 12%
Other 2% 19% 14%
Total Responses 51 127 178
School of Medicine
School of Engineering Other
Submitting Proposals 29% 31% 26%
Managing Grants 22% 23% 32%
Setting up Awards 20% 35% 16%
Setting up Sub‐Awards 13% 4% 14%
Other 17% 8% 12%
Total Responses 102 26 50
6
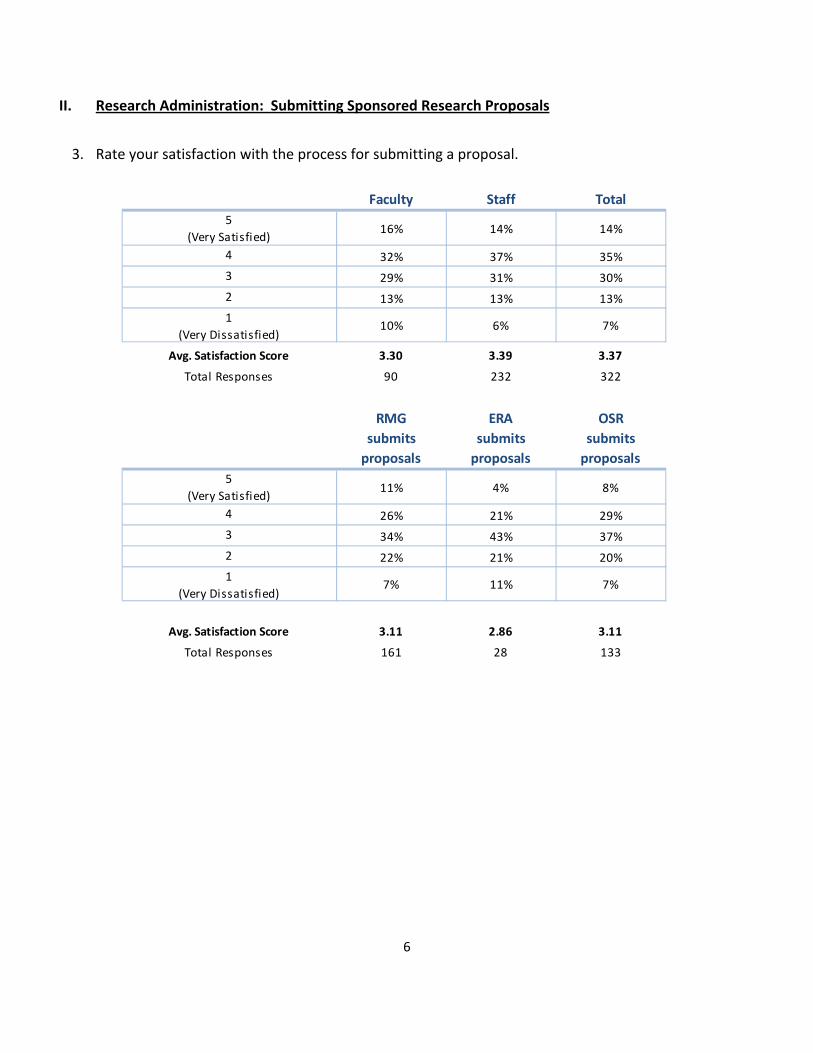
II. Research Administration: Submitting Sponsored Research Proposals
3. Rate your satisfaction with the process for submitting a proposal.
Faculty Staff Total5
(Very Satisfied)16% 14% 14%
4 32% 37% 35%
3 29% 31% 30%
2 13% 13% 13%
1(Very Dissatisfied)
10% 6% 7%
Avg. Satisfaction Score 3.30 3.39 3.37
Total Responses 90 232 322
RMGsubmits proposals
ERAsubmits proposals
OSRsubmits proposals
5(Very Satisfied)
11% 4% 8%
4 26% 21% 29%
3 34% 43% 37%
2 22% 21% 20%
1(Very Dissatisfied)
7% 11% 7%
Avg. Satisfaction Score 3.11 2.86 3.11
Total Responses 161 28 133
7
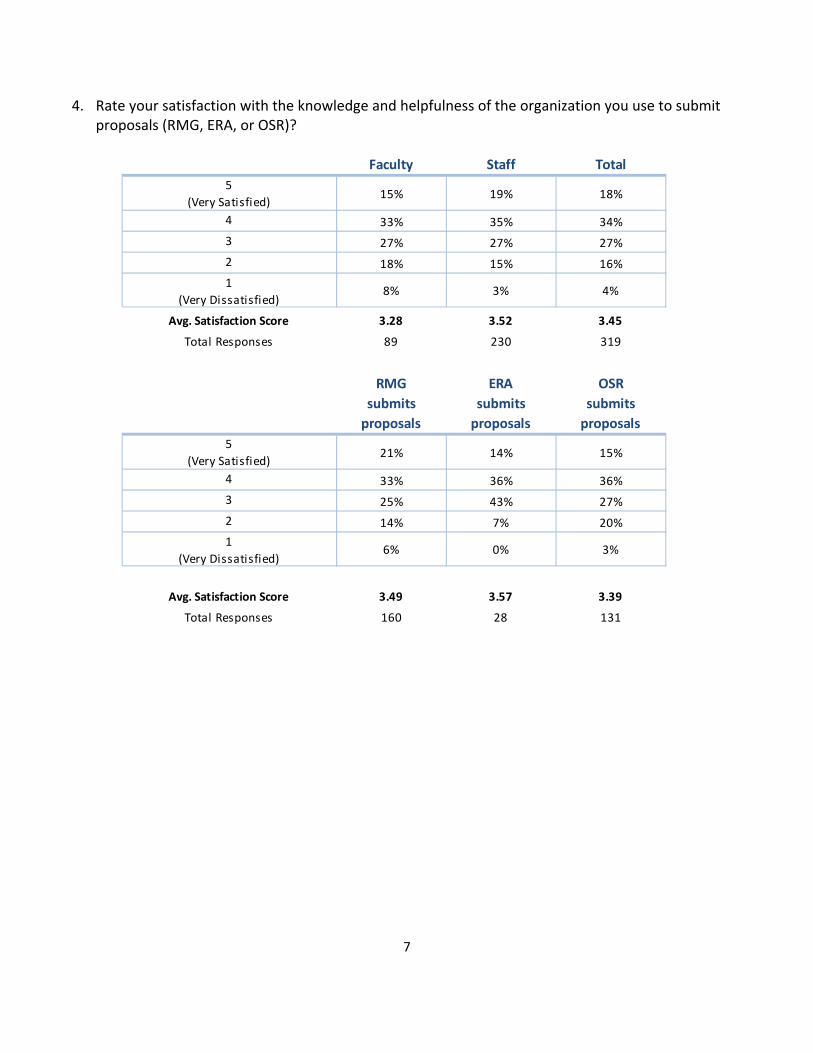
4. Rate your satisfaction with the knowledge and helpfulness of the organization you use to submit proposals (RMG, ERA, or OSR)?
Faculty Staff Total5
(Very Satisfied)15% 19% 18%
4 33% 35% 34%
3 27% 27% 27%
2 18% 15% 16%
1(Very Dissatisfied)
8% 3% 4%
Avg. Satisfaction Score 3.28 3.52 3.45
Total Responses 89 230 319
RMGsubmits proposals
ERAsubmits proposals
OSRsubmits proposals
5(Very Satisfied)
21% 14% 15%
4 33% 36% 36%
3 25% 43% 27%
2 14% 7% 20%
1(Very Dissatisfied)
6% 0% 3%
Avg. Satisfaction Score 3.49 3.57 3.39
Total Responses 160 28 131
8
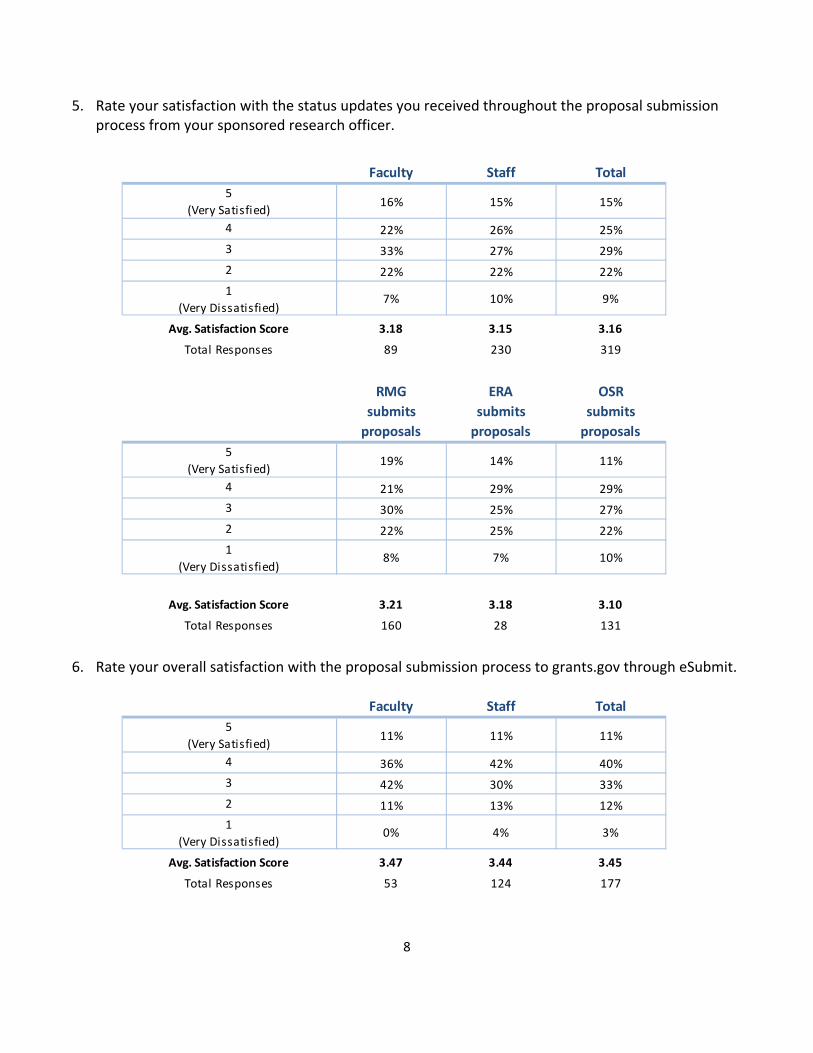
5. Rate your satisfaction with the status updates you received throughout the proposal submission process from your sponsored research officer.
6. Rate your overall satisfaction with the proposal submission process to grants.gov through eSubmit.
Faculty Staff Total5
(Very Satisfied)16% 15% 15%
4 22% 26% 25%
3 33% 27% 29%
2 22% 22% 22%
1(Very Dissatisfied)
7% 10% 9%
Avg. Satisfaction Score 3.18 3.15 3.16
Total Responses 89 230 319
RMGsubmits proposals
ERAsubmits proposals
OSRsubmits proposals
5(Very Satisfied)
19% 14% 11%
4 21% 29% 29%
3 30% 25% 27%
2 22% 25% 22%
1(Very Dissatisfied)
8% 7% 10%
Avg. Satisfaction Score 3.21 3.18 3.10
Total Responses 160 28 131
Faculty Staff Total5
(Very Satisfied)11% 11% 11%
4 36% 42% 40%
3 42% 30% 33%
2 11% 13% 12%
1(Very Dissatisfied)
0% 4% 3%
Avg. Satisfaction Score 3.47 3.44 3.45
Total Responses 53 124 177
9
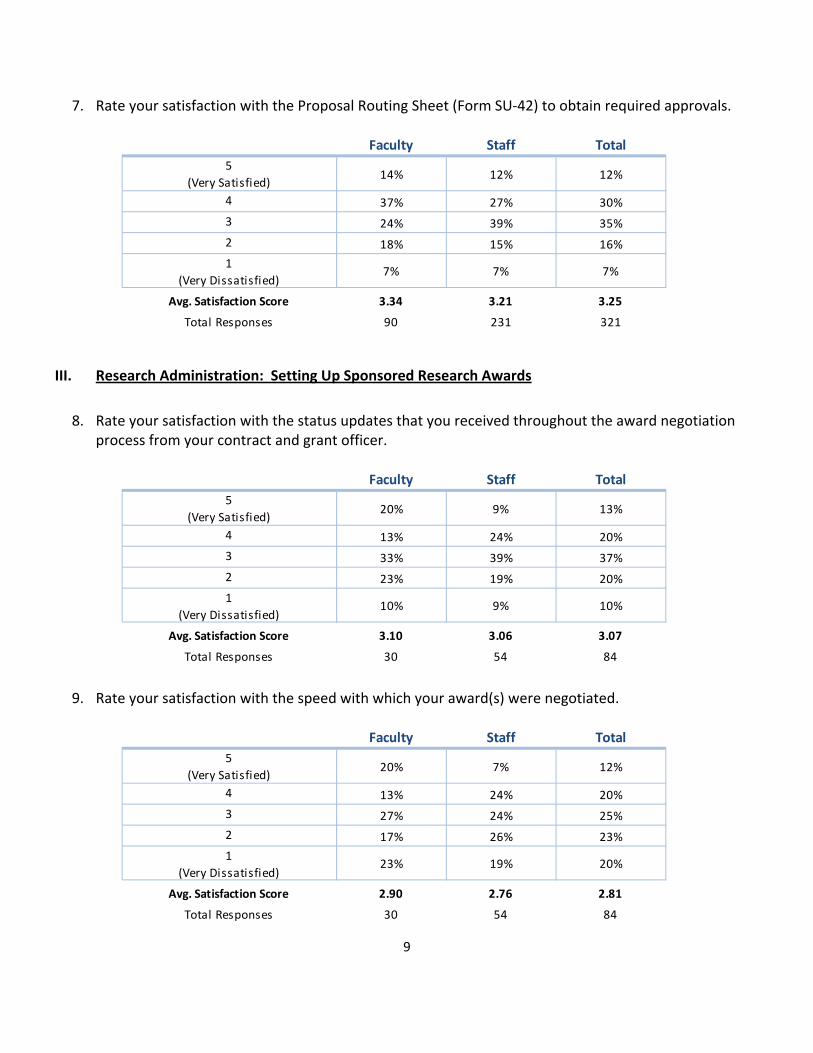
7. Rate your satisfaction with the Proposal Routing Sheet (Form SU‐42) to obtain required approvals.
III. Research Administration: Setting Up Sponsored Research Awards
8. Rate your satisfaction with the status updates that you received throughout the award negotiation
process from your contract and grant officer.
9. Rate your satisfaction with the speed with which your award(s) were negotiated.
Faculty Staff Total5
(Very Satisfied)14% 12% 12%
4 37% 27% 30%
3 24% 39% 35%
2 18% 15% 16%
1(Very Dissatisfied)
7% 7% 7%
Avg. Satisfaction Score 3.34 3.21 3.25
Total Responses 90 231 321
Faculty Staff Total5
(Very Satisfied)20% 9% 13%
4 13% 24% 20%
3 33% 39% 37%
2 23% 19% 20%
1(Very Dissatisfied)
10% 9% 10%
Avg. Satisfaction Score 3.10 3.06 3.07
Total Responses 30 54 84
Faculty Staff Total5
(Very Satisfied)20% 7% 12%
4 13% 24% 20%
3 27% 24% 25%
2 17% 26% 23%
1(Very Dissatisfied)
23% 19% 20%
Avg. Satisfaction Score 2.90 2.76 2.81
Total Responses 30 54 84
10
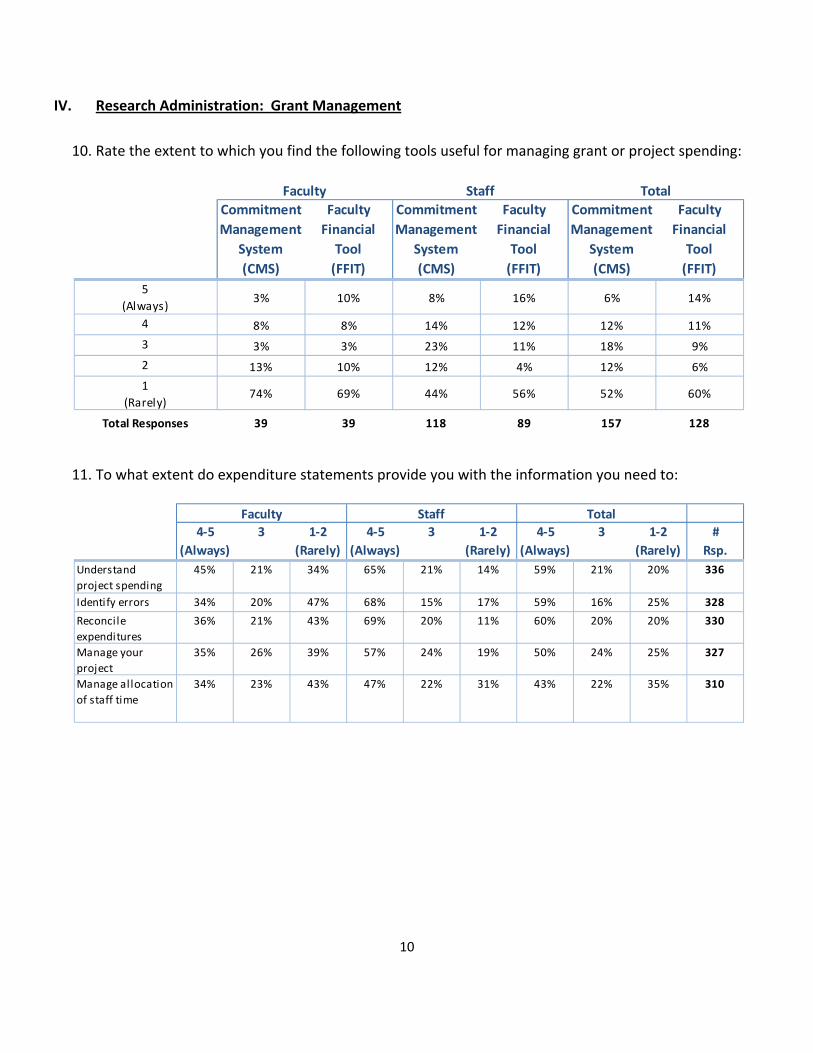
IV. Research Administration: Grant Management
10. Rate the extent to which you find the following tools useful for managing grant or project spending:
11. To what extent do expenditure statements provide you with the information you need to:
Faculty Staff TotalCommitment Management
System (CMS)
Faculty Financial Tool (FFIT)
Commitment Management
System (CMS)
Faculty Financial Tool (FFIT)
Commitment Management
System (CMS)
Faculty Financial Tool (FFIT)
5(Always)
3% 10% 8% 16% 6% 14%
4 8% 8% 14% 12% 12% 11%
3 3% 3% 23% 11% 18% 9%
2 13% 10% 12% 4% 12% 6%
1(Rarely)
74% 69% 44% 56% 52% 60%
Total Responses 39 39 118 89 157 128
Faculty Staff Total4‐5
(Always)3 1‐2
(Rarely)4‐5
(Always)3 1‐2
(Rarely)4‐5
(Always)3 1‐2
(Rarely)#
Rsp.Understand project spending
45% 21% 34% 65% 21% 14% 59% 21% 20% 336
Identify errors 34% 20% 47% 68% 15% 17% 59% 16% 25% 328
Reconcile expenditures
36% 21% 43% 69% 20% 11% 60% 20% 20% 330
Manage your project
35% 26% 39% 57% 24% 19% 50% 24% 25% 327
Manage allocation of staff time
34% 23% 43% 47% 22% 31% 43% 22% 35% 310
11
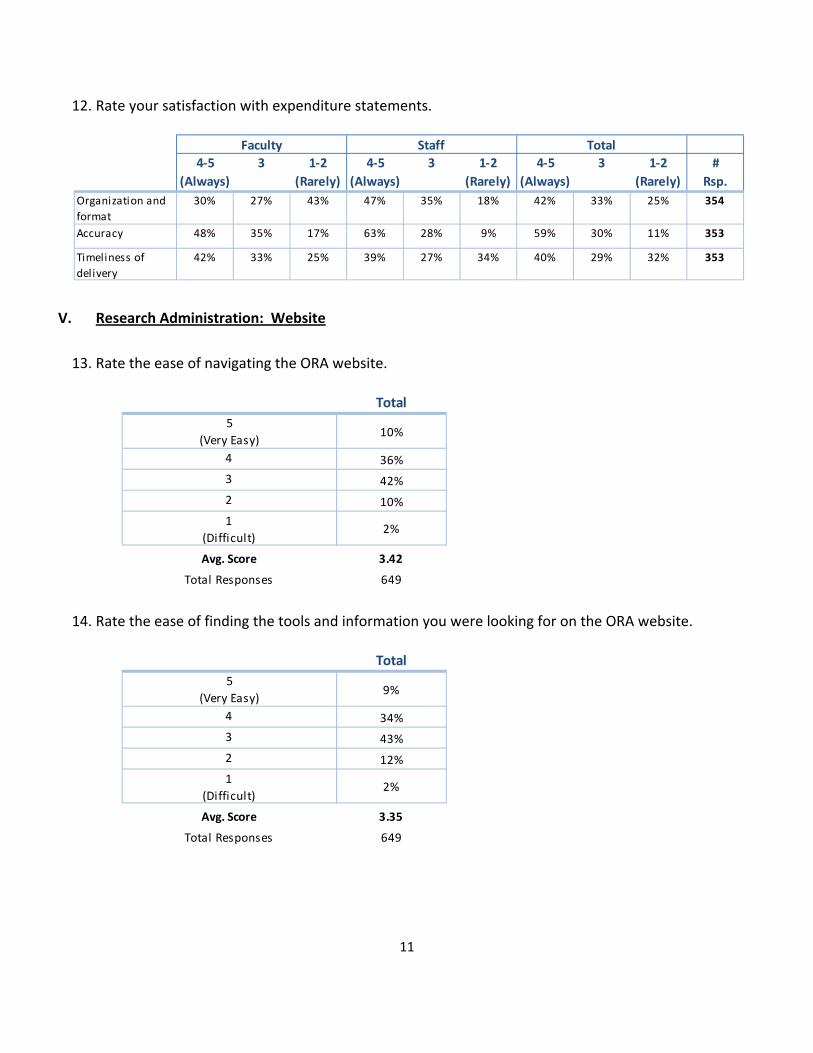
12. Rate your satisfaction with expenditure statements.
V. Research Administration: Website
13. Rate the ease of navigating the ORA website.
14. Rate the ease of finding the tools and information you were looking for on the ORA website.
Faculty Staff Total4‐5
(Always)3 1‐2
(Rarely)4‐5
(Always)3 1‐2
(Rarely)4‐5
(Always)3 1‐2
(Rarely)#
Rsp.Organization and format
30% 27% 43% 47% 35% 18% 42% 33% 25% 354
Accuracy 48% 35% 17% 63% 28% 9% 59% 30% 11% 353
Timeliness of delivery
42% 33% 25% 39% 27% 34% 40% 29% 32% 353
Total5
(Very Easy)10%
4 36%
3 42%
2 10%
1(Difficult)
2%
Avg. Score 3.42
Total Responses 649
Total5
(Very Easy)9%
4 34%
3 43%
2 12%
1(Difficult)
2%
Avg. Score 3.35
Total Responses 649
12
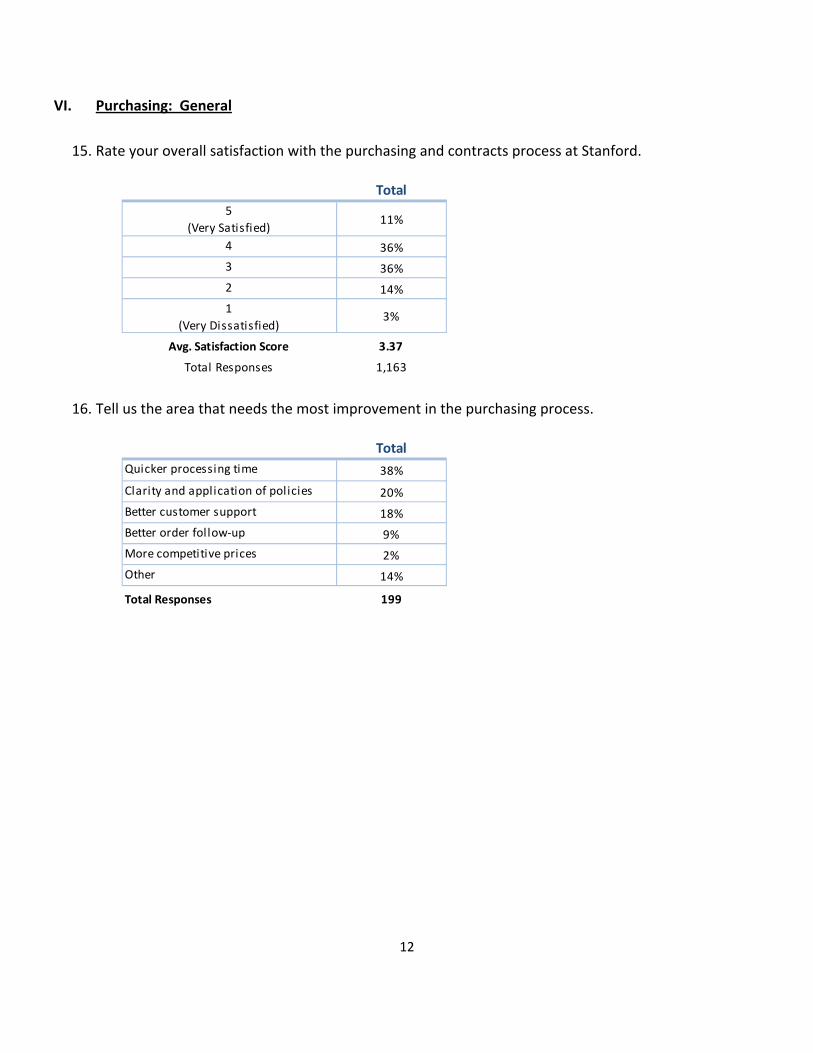
VI. Purchasing: General
15. Rate your overall satisfaction with the purchasing and contracts process at Stanford.
16. Tell us the area that needs the most improvement in the purchasing process.
Total5
(Very Satisfied)11%
4 36%
3 36%
2 14%
1(Very Dissatisfied)
3%
Avg. Satisfaction Score 3.37
Total Responses 1,163
TotalQuicker processing time 38%
Clarity and application of policies 20%
Better customer support 18%
Better order follow‐up 9%
More competitive prices 2%
Other 14%
Total Responses 199
13
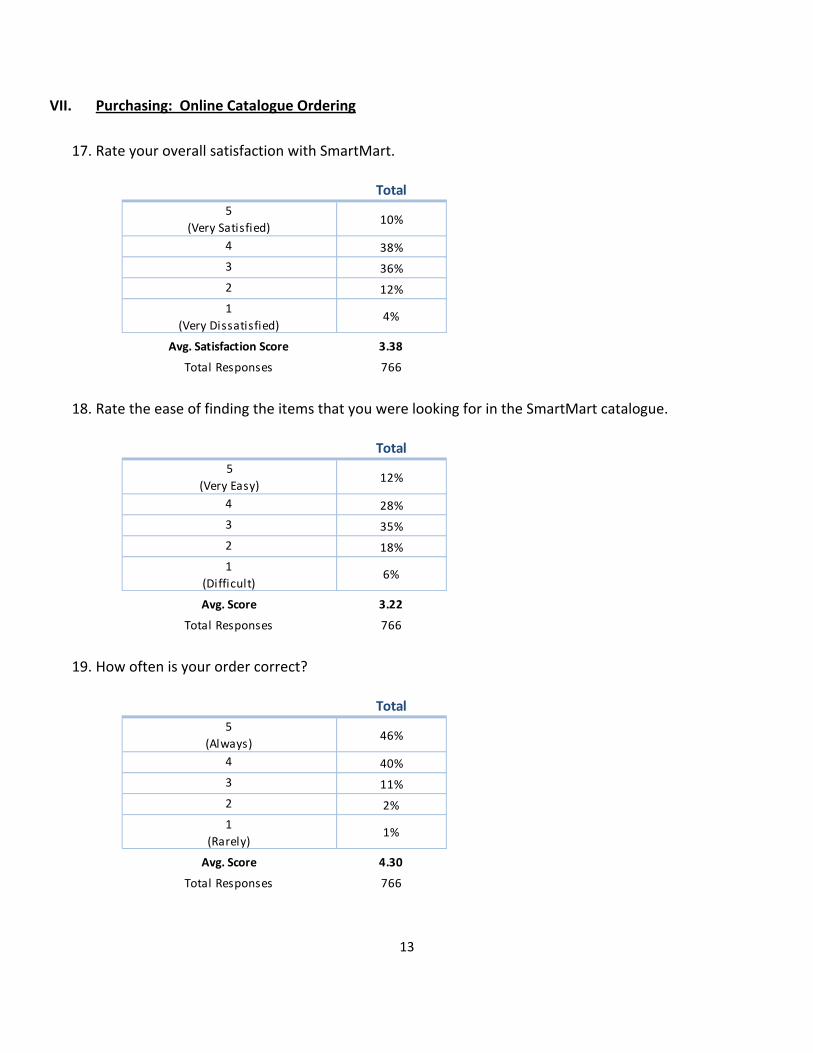
VII. Purchasing: Online Catalogue Ordering
17. Rate your overall satisfaction with SmartMart.
18. Rate the ease of finding the items that you were looking for in the SmartMart catalogue.
19. How often is your order correct?
Total5
(Very Satisfied)10%
4 38%
3 36%
2 12%
1(Very Dissatisfied)
4%
Avg. Satisfaction Score 3.38
Total Responses 766
Total5
(Very Easy)12%
4 28%
3 35%
2 18%
1(Difficult)
6%
Avg. Score 3.22
Total Responses 766
Total5
(Always)46%
4 40%
3 11%
2 2%
1(Rarely)
1%
Avg. Score 4.30
Total Responses 766
14
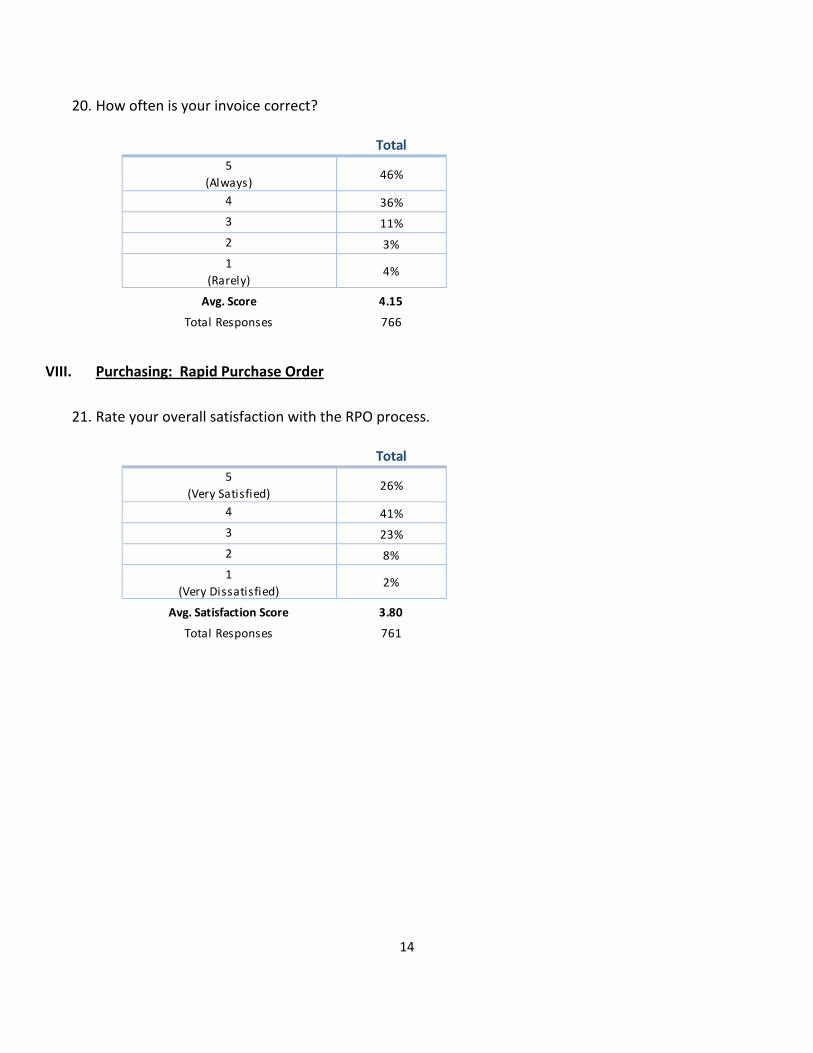
20. How often is your invoice correct?
VIII. Purchasing: Rapid Purchase Order
21. Rate your overall satisfaction with the RPO process.
Total5
(Always)46%
4 36%
3 11%
2 3%
1(Rarely)
4%
Avg. Score 4.15
Total Responses 766
Total5
(Very Satisfied)26%
4 41%
3 23%
2 8%
1(Very Dissatisfied)
2%
Avg. Satisfaction Score 3.80
Total Responses 761
15
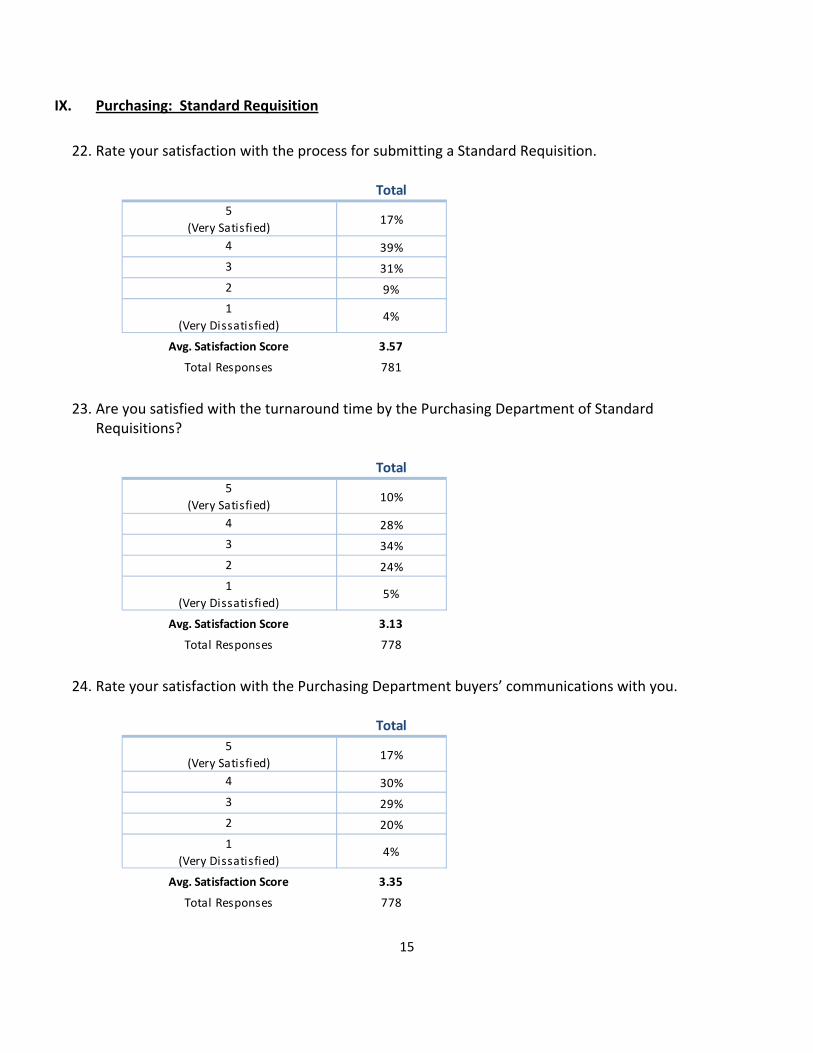
IX. Purchasing: Standard Requisition
22. Rate your satisfaction with the process for submitting a Standard Requisition.
23. Are you satisfied with the turnaround time by the Purchasing Department of Standard Requisitions?
24. Rate your satisfaction with the Purchasing Department buyers’ communications with you.
Total5
(Very Satisfied)17%
4 39%
3 31%
2 9%
1(Very Dissatisfied)
4%
Avg. Satisfaction Score 3.57
Total Responses 781
Total5
(Very Satisfied)10%
4 28%
3 34%
2 24%
1(Very Dissatisfied)
5%
Avg. Satisfaction Score 3.13
Total Responses 778
Total5
(Very Satisfied)17%
4 30%
3 29%
2 20%
1(Very Dissatisfied)
4%
Avg. Satisfaction Score 3.35
Total Responses 778
16
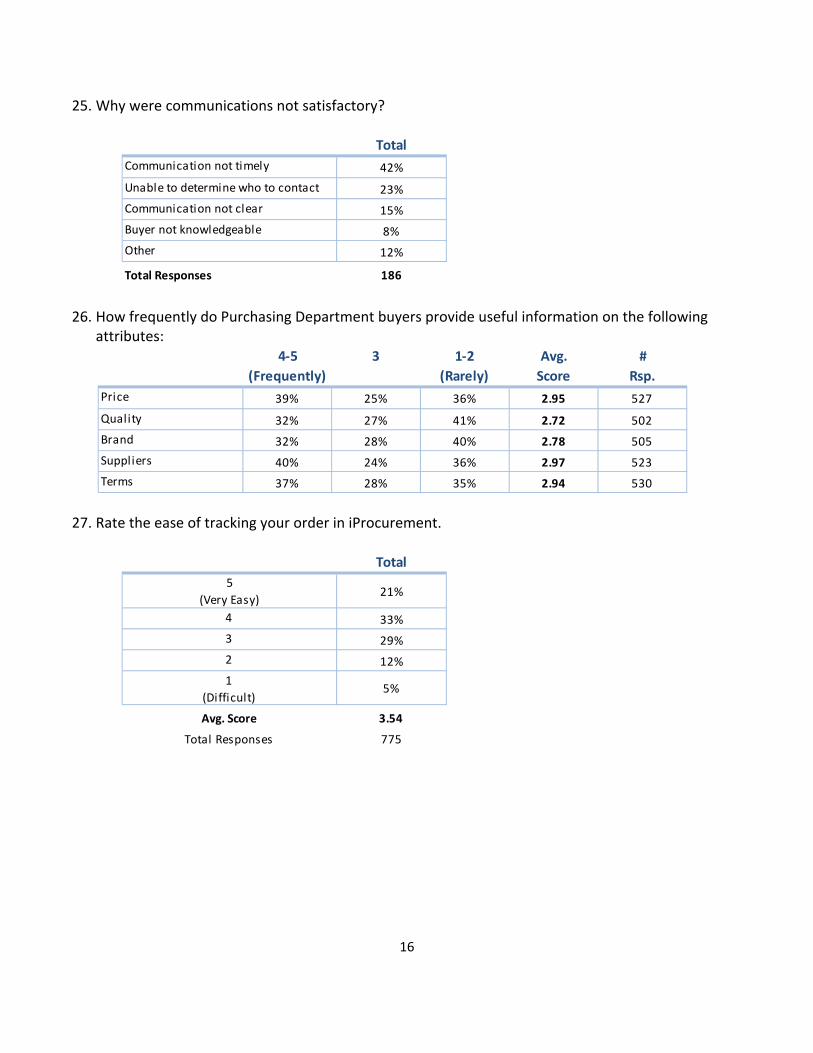
25. Why were communications not satisfactory?
26. How frequently do Purchasing Department buyers provide useful information on the following attributes:
27. Rate the ease of tracking your order in iProcurement.
TotalCommunication not timely 42%
Unable to determine who to contact 23%
Communication not clear 15%
Buyer not knowledgeable 8%
Other 12%
Total Responses 186
4‐5 (Frequently)
3 1‐2 (Rarely)
Avg. Score
#Rsp.
Price 39% 25% 36% 2.95 527
Quality 32% 27% 41% 2.72 502
Brand 32% 28% 40% 2.78 505
Suppliers 40% 24% 36% 2.97 523
Terms 37% 28% 35% 2.94 530
Total5
(Very Easy)21%
4 33%
3 29%
2 12%
1(Difficult)
5%
Avg. Score 3.54
Total Responses 775
17
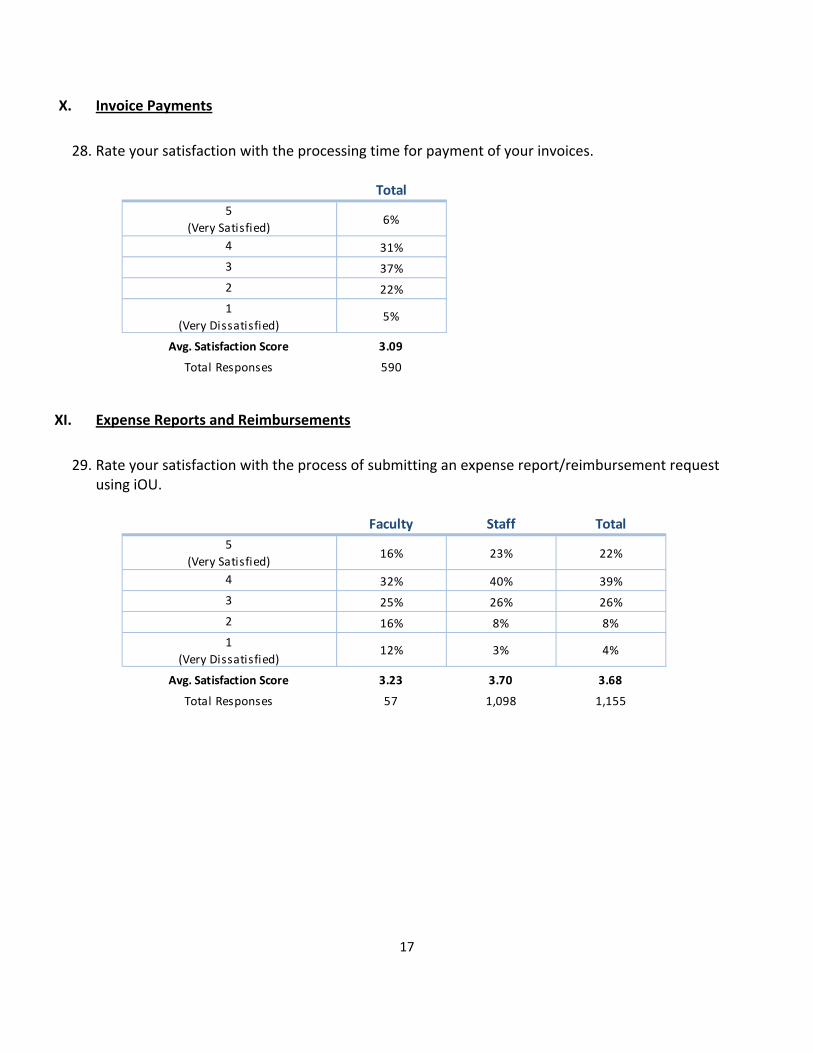
X. Invoice Payments
28. Rate your satisfaction with the processing time for payment of your invoices.
XI. Expense Reports and Reimbursements
29. Rate your satisfaction with the process of submitting an expense report/reimbursement request
using iOU.
Total5
(Very Satisfied)6%
4 31%
3 37%
2 22%
1(Very Dissatisfied)
5%
Avg. Satisfaction Score 3.09
Total Responses 590
Faculty Staff Total5
(Very Satisfied)16% 23% 22%
4 32% 40% 39%
3 25% 26% 26%
2 16% 8% 8%
1(Very Dissatisfied)
12% 3% 4%
Avg. Satisfaction Score 3.23 3.70 3.68
Total Responses 57 1,098 1,155
18
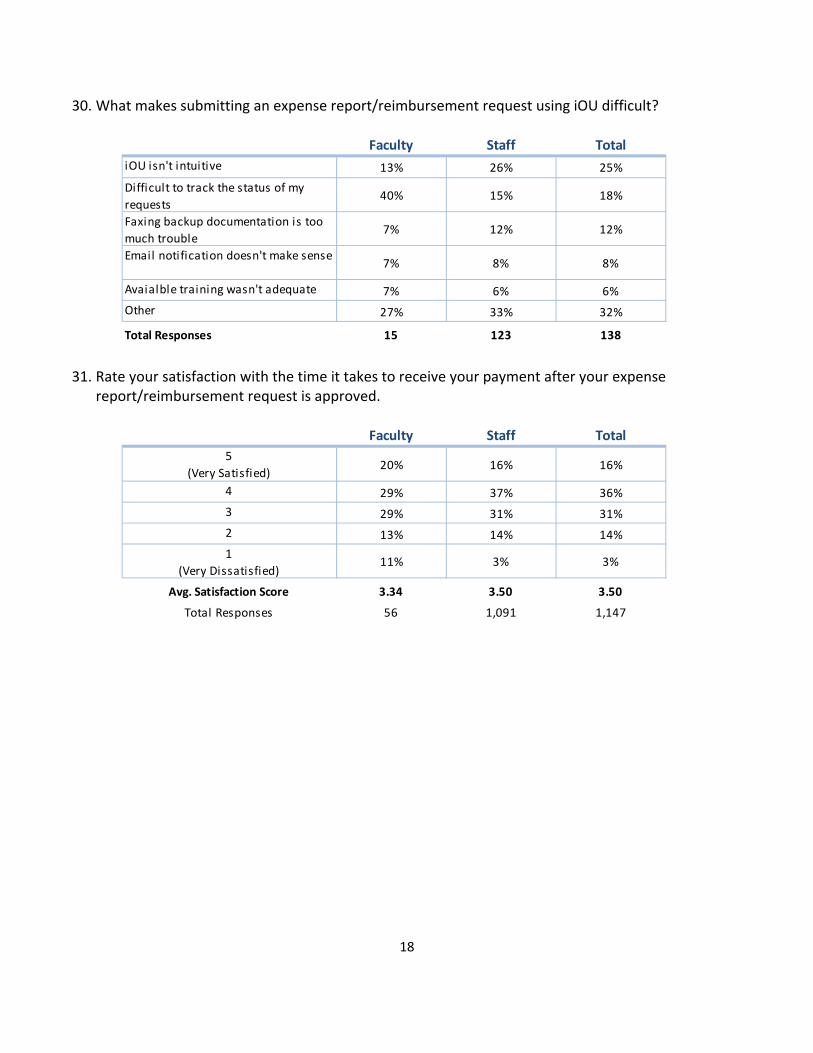
30. What makes submitting an expense report/reimbursement request using iOU difficult?
31. Rate your satisfaction with the time it takes to receive your payment after your expense report/reimbursement request is approved.
Faculty Staff TotaliOU isn't intuitive 13% 26% 25%
Difficult to track the status of my requests
40% 15% 18%
Faxing backup documentation is too much trouble
7% 12% 12%
Email notification doesn't make sense7% 8% 8%
Avaialble training wasn't adequate 7% 6% 6%
Other 27% 33% 32%
Total Responses 15 123 138
Faculty Staff Total5
(Very Satisfied)20% 16% 16%
4 29% 37% 36%
3 29% 31% 31%
2 13% 14% 14%
1(Very Dissatisfied)
11% 3% 3%
Avg. Satisfaction Score 3.34 3.50 3.50
Total Responses 56 1,091 1,147
19
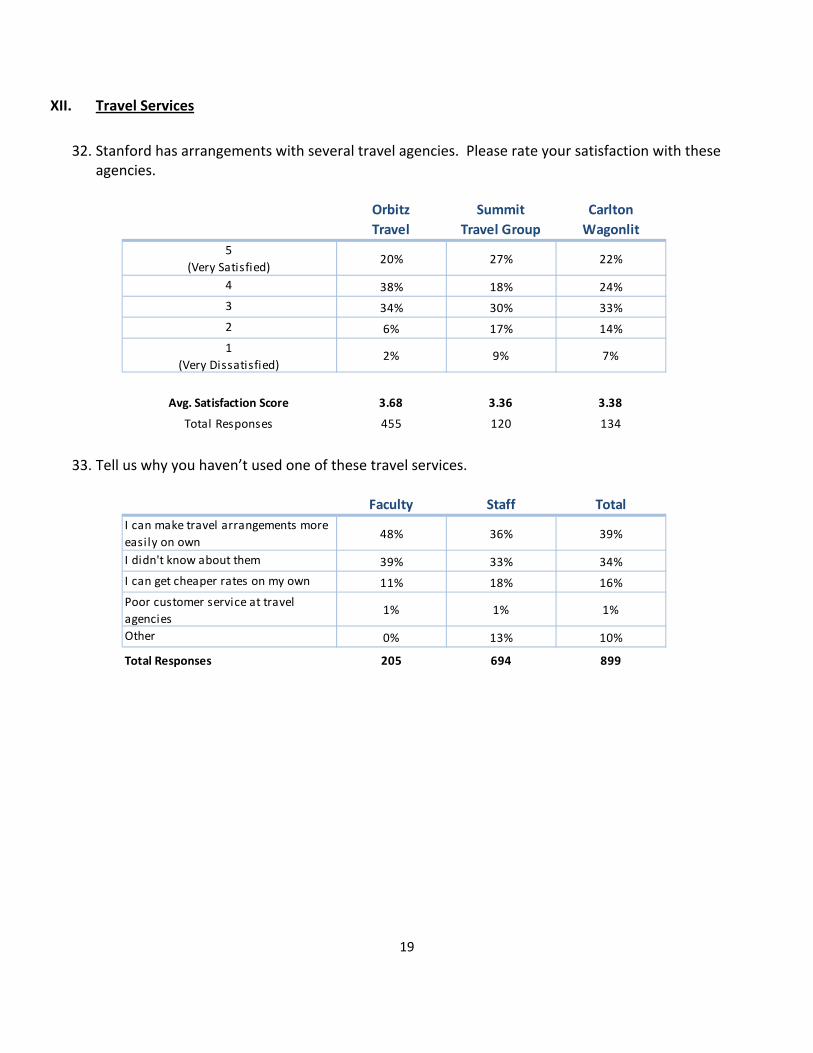
XII. Travel Services
32. Stanford has arrangements with several travel agencies. Please rate your satisfaction with these
agencies.
33. Tell us why you haven’t used one of these travel services.
Orbitz Travel
Summit Travel Group
Carlton Wagonlit
5(Very Satisfied)
20% 27% 22%
4 38% 18% 24%
3 34% 30% 33%
2 6% 17% 14%
1(Very Dissatisfied)
2% 9% 7%
Avg. Satisfaction Score 3.68 3.36 3.38
Total Responses 455 120 134
Faculty Staff TotalI can make travel arrangements more easily on own
48% 36% 39%
I didn't know about them 39% 33% 34%
I can get cheaper rates on my own 11% 18% 16%
Poor customer service at travel agencies
1% 1% 1%
Other 0% 13% 10%
Total Responses 205 694 899
20
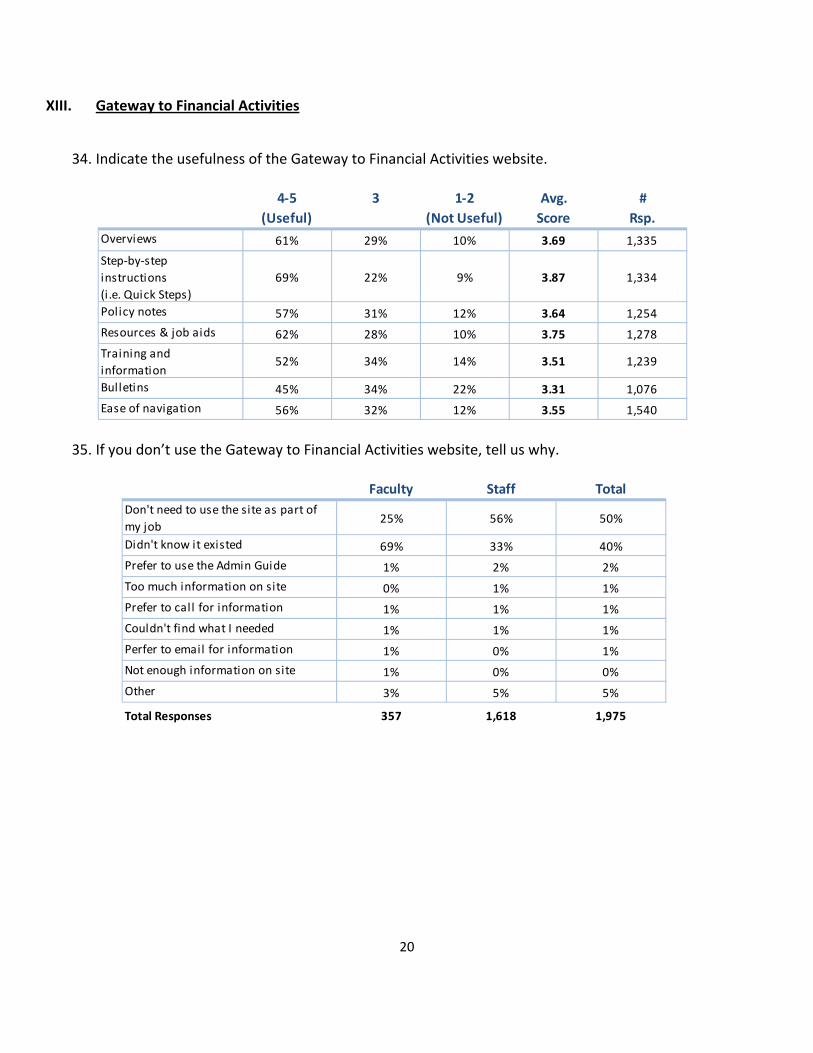
XIII. Gateway to Financial Activities
34. Indicate the usefulness of the Gateway to Financial Activities website.
35. If you don’t use the Gateway to Financial Activities website, tell us why.
4‐5 (Useful)
3 1‐2 (Not Useful)
Avg. Score
#Rsp.
Overviews 61% 29% 10% 3.69 1,335
Step‐by‐step instructions (i .e. Quick Steps)
69% 22% 9% 3.87 1,334
Policy notes 57% 31% 12% 3.64 1,254
Resources & job aids 62% 28% 10% 3.75 1,278
Training and information
52% 34% 14% 3.51 1,239
Bulletins 45% 34% 22% 3.31 1,076
Ease of navigation 56% 32% 12% 3.55 1,540
Faculty Staff TotalDon't need to use the site as part of my job
25% 56% 50%
Didn't know it existed 69% 33% 40%
Prefer to use the Admin Guide 1% 2% 2%
Too much information on site 0% 1% 1%
Prefer to call for information 1% 1% 1%
Couldn't find what I needed 1% 1% 1%
Perfer to email for information 1% 0% 1%
Not enough information on site 1% 0% 0%
Other 3% 5% 5%
Total Responses 357 1,618 1,975
21
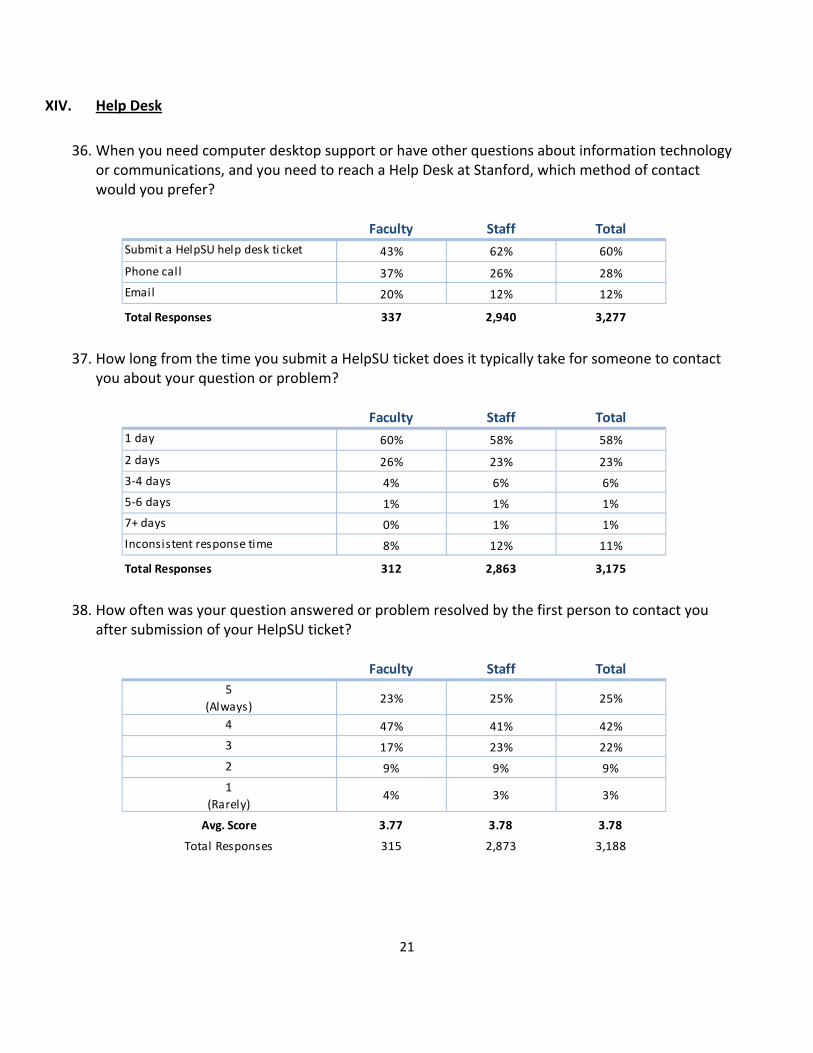
XIV. Help Desk
36. When you need computer desktop support or have other questions about information technology or communications, and you need to reach a Help Desk at Stanford, which method of contact would you prefer?
37. How long from the time you submit a HelpSU ticket does it typically take for someone to contact you about your question or problem?
38. How often was your question answered or problem resolved by the first person to contact you after submission of your HelpSU ticket?
Faculty Staff TotalSubmit a HelpSU help desk ticket 43% 62% 60%
Phone call 37% 26% 28%
Email 20% 12% 12%
Total Responses 337 2,940 3,277
Faculty Staff Total1 day 60% 58% 58%
2 days 26% 23% 23%
3‐4 days 4% 6% 6%
5‐6 days 1% 1% 1%
7+ days 0% 1% 1%
Inconsistent response time 8% 12% 11%
Total Responses 312 2,863 3,175
Faculty Staff Total5
(Always)23% 25% 25%
4 47% 41% 42%
3 17% 23% 22%
2 9% 9% 9%
1(Rarely)
4% 3% 3%
Avg. Score 3.77 3.78 3.78
Total Responses 315 2,873 3,188
22
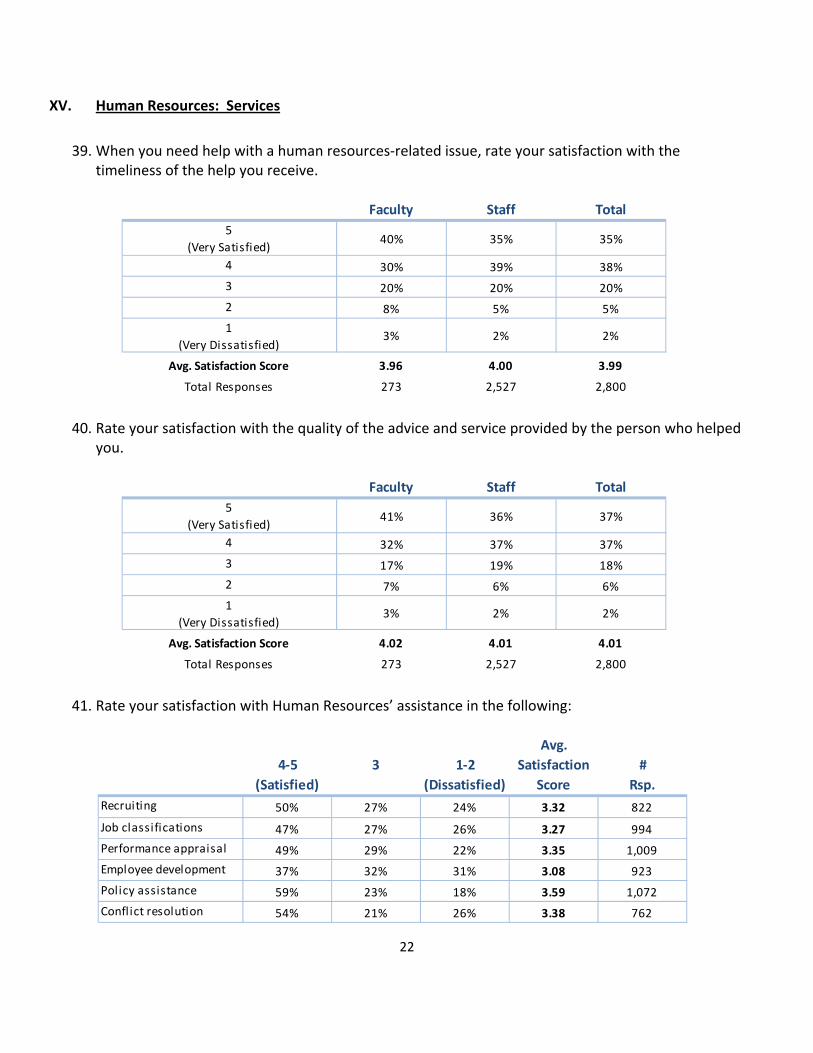
XV. Human Resources: Services
39. When you need help with a human resources‐related issue, rate your satisfaction with the
timeliness of the help you receive.
40. Rate your satisfaction with the quality of the advice and service provided by the person who helped
you.
41. Rate your satisfaction with Human Resources’ assistance in the following:
Faculty Staff Total5
(Very Satisfied)40% 35% 35%
4 30% 39% 38%
3 20% 20% 20%
2 8% 5% 5%
1(Very Dissatisfied)
3% 2% 2%
Avg. Satisfaction Score 3.96 4.00 3.99
Total Responses 273 2,527 2,800
Faculty Staff Total5
(Very Satisfied)41% 36% 37%
4 32% 37% 37%
3 17% 19% 18%
2 7% 6% 6%
1(Very Dissatisfied)
3% 2% 2%
Avg. Satisfaction Score 4.02 4.01 4.01
Total Responses 273 2,527 2,800
4‐5 (Satisfied)
3 1‐2 (Dissatisfied)
Avg. Satisfaction
Score#
Rsp.Recruiting 50% 27% 24% 3.32 822
Job classifications 47% 27% 26% 3.27 994
Performance appraisal 49% 29% 22% 3.35 1,009
Employee development 37% 32% 31% 3.08 923
Policy assistance 59% 23% 18% 3.59 1,072
Conflict resolution 54% 21% 26% 3.38 762
23
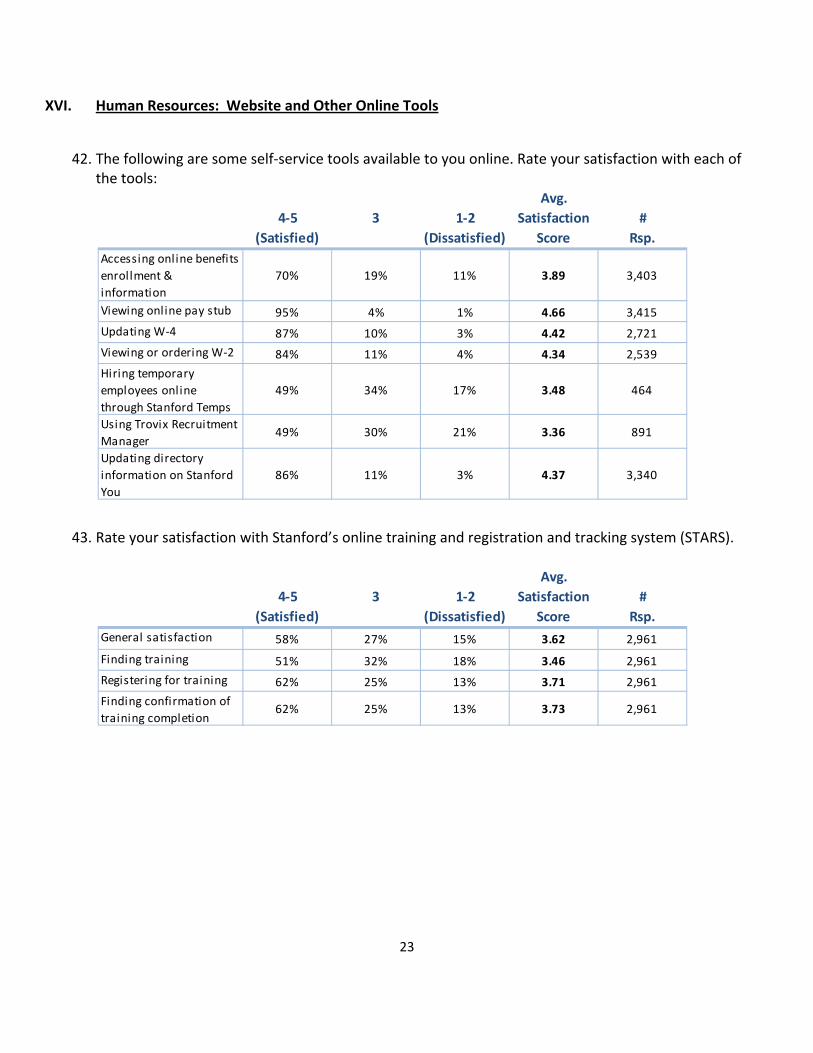
XVI. Human Resources: Website and Other Online Tools
42. The following are some self‐service tools available to you online. Rate your satisfaction with each of the tools:
43. Rate your satisfaction with Stanford’s online training and registration and tracking system (STARS).
4‐5 (Satisfied)
3 1‐2 (Dissatisfied)
Avg. Satisfaction
Score#
Rsp.Accessing online benefits enrollment & information
70% 19% 11% 3.89 3,403
Viewing online pay stub 95% 4% 1% 4.66 3,415
Updating W‐4 87% 10% 3% 4.42 2,721
Viewing or ordering W‐2 84% 11% 4% 4.34 2,539
Hiring temporary employees online through Stanford Temps
49% 34% 17% 3.48 464
Using Trovix Recruitment Manager
49% 30% 21% 3.36 891
Updating directory information on Stanford You
86% 11% 3% 4.37 3,340
4‐5 (Satisfied)
3 1‐2 (Dissatisfied)
Avg. Satisfaction
Score#
Rsp.General satisfaction 58% 27% 15% 3.62 2,961
Finding training 51% 32% 18% 3.46 2,961
Registering for training 62% 25% 13% 3.71 2,961
Finding confirmation of training completion
62% 25% 13% 3.73 2,961
24
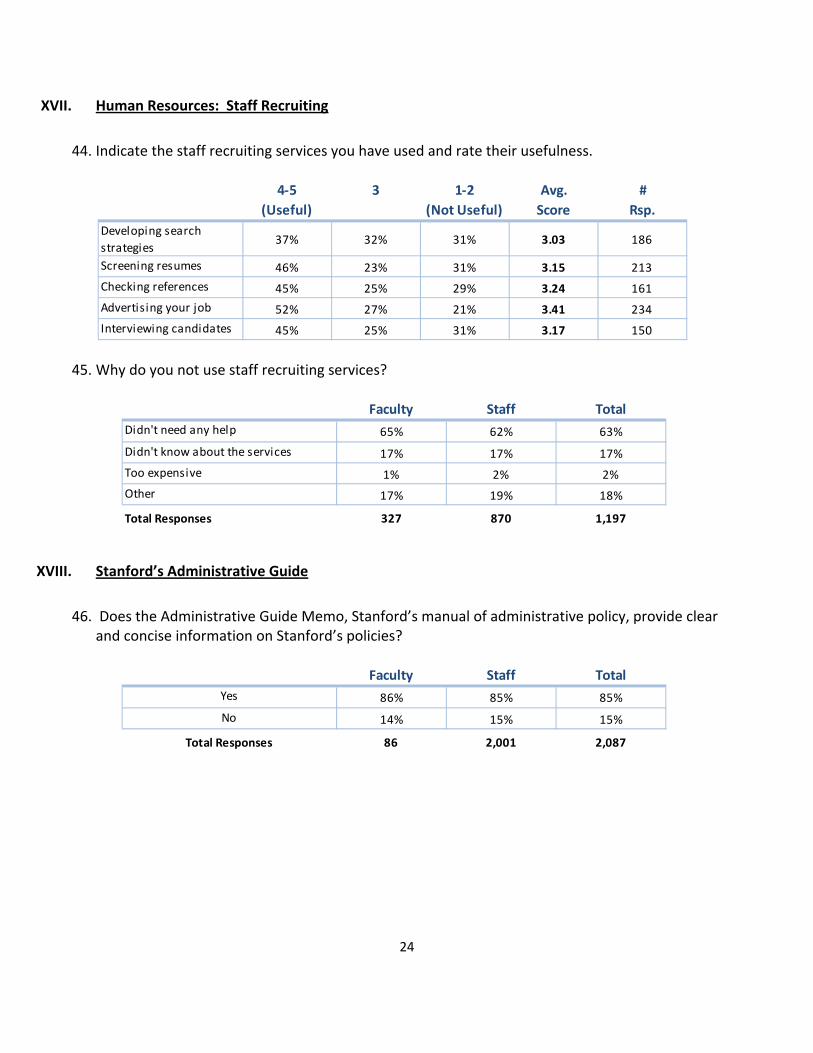
XVII. Human Resources: Staff Recruiting
44. Indicate the staff recruiting services you have used and rate their usefulness.
45. Why do you not use staff recruiting services?
XVIII. Stanford’s Administrative Guide
46. Does the Administrative Guide Memo, Stanford’s manual of administrative policy, provide clear
and concise information on Stanford’s policies?
4‐5 (Useful)
3 1‐2 (Not Useful)
Avg. Score
#Rsp.
Developing search strategies
37% 32% 31% 3.03 186
Screening resumes 46% 23% 31% 3.15 213
Checking references 45% 25% 29% 3.24 161
Advertising your job 52% 27% 21% 3.41 234
Interviewing candidates 45% 25% 31% 3.17 150
Faculty Staff TotalDidn't need any help 65% 62% 63%
Didn't know about the services 17% 17% 17%
Too expensive 1% 2% 2%
Other 17% 19% 18%
Total Responses 327 870 1,197
Faculty Staff TotalYes 86% 85% 85%
No 14% 15% 15%
Total Responses 86 2,001 2,087
25
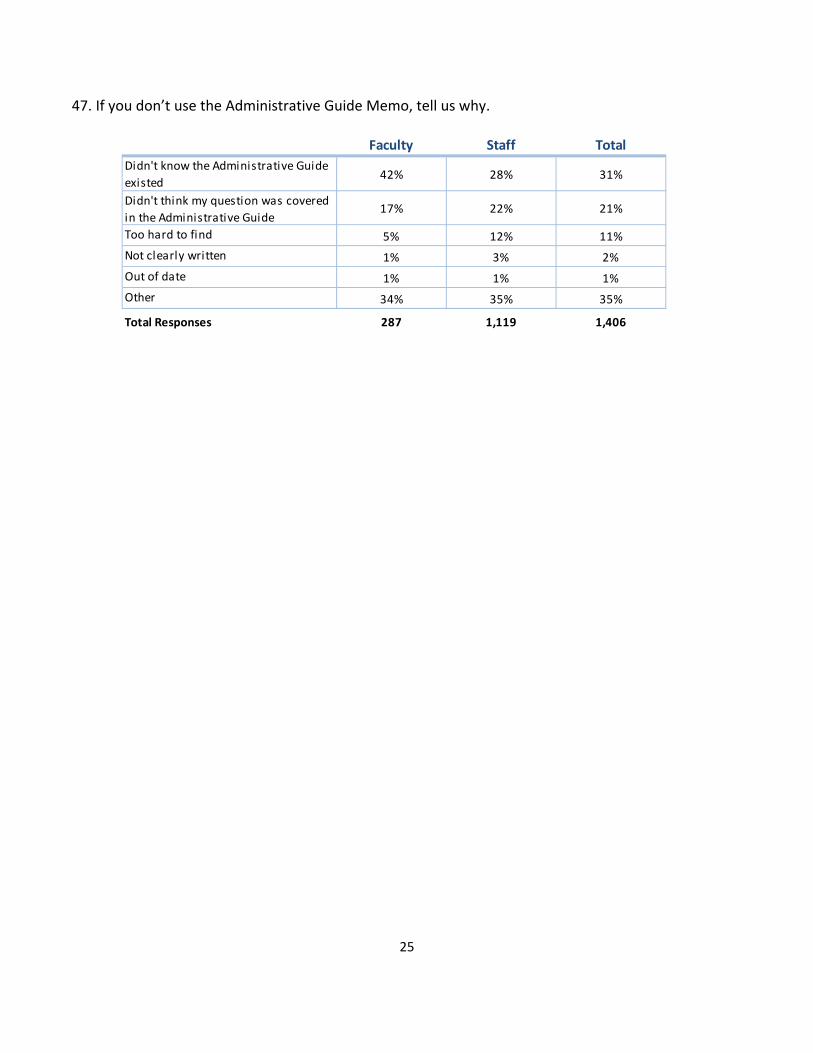
47. If you don’t use the Administrative Guide Memo, tell us why.
Faculty Staff TotalDidn't know the Administrative Guide existed
42% 28% 31%
Didn't think my question was covered in the Administrative Guide
17% 22% 21%
Too hard to find 5% 12% 11%
Not clearly written 1% 3% 2%
Out of date 1% 1% 1%
Other 34% 35% 35%
Total Responses 287 1,119 1,406