activity reportpdf.usaid.gov/pdf_docs/pnacg371.pdf · activity report no. 47 options for monitoring...
TRANSCRIPT

ACTIVITY REPORTACTIVITY REPORTACTIVITY REPORTACTIVITY REPORTNo. 47No. 47No. 47No. 47
Options for MonitoringBiological and Environmental Lead During
the Phase-out of Lead in Gasoline in Latin America & the Caribbean
September 1999
byJanie L. Gittleman
Patricia BilligSteven K. Ault
andMauricio Hernández-Avila
Prepared for the Office of Health and Nutrition, Global Bureau andthe Environment Team, Office of Regional Sustainable Development,
Bureau for Latin America and the CaribbeanU.S. Agency for International Development
under EHP Activity No. 250-CC

Environmental Health ProjectContract No. HRN-C-00-93-00036-11, Project No. 936-5994
is sponsored by the Bureau for Global Programs, Field Support and ResearchOffice of Health and Nutrition
U.S. Agency for International DevelopmentWashington, DC 20523

i
CONTENTS
PREFACE...........................................................................................................................................................vABOUT THE AUTHORS............................................................................................................................ viiACKNOWLEDGMENTS ........................................................................................................................... ixACRONYMS.....................................................................................................................................................xiEXECUTIVE SUMMARY.......................................................................................................................... xiii
Part A: OVERVIEW
1 INTRODUCTION ....................................................................................................................................1
1.1 Health Effects from Lead Exposure .................................................................................................11.2 Experience Monitoring Lead Levels..................................................................................................31.3 The World Bank Program to Support the Phase-out of Lead.......................................................51.4 Development of Monitoring Options ...............................................................................................6
2 TARGET POPULATIONS......................................................................................................................9
2.1 Occupationally Exposed Adults .........................................................................................................92.2 Children............................................................................................................................................... 102.3 Pregnant Women at Time of Delivery ........................................................................................... 112.4 Monitoring Multiple Populations .................................................................................................... 122.5 Case Study in Peru............................................................................................................................. 13
3 APPROACHES TO MONITORING................................................................................................. 17
3.1 General Considerations in the Design of Monitoring Options.................................................. 173.2 Biological Monitoring ....................................................................................................................... 193.3 Environmental Monitoring .............................................................................................................. 233.4 Regional Resources for Assessing Lead Exposure ....................................................................... 263.5 Issues for Consideration ................................................................................................................... 26
Part B: STUDY DESIGN AND PROTOCOLS
4 STUDY DESIGN FOR SURVEY OF OCCUPATIONALLYEXPOSED WORKERS......................................................................................................................... 33
4.1 Recruitment of the Study Population ............................................................................................. 334.2 Sample Size and Follow-Up............................................................................................................. 334.3 Questionnaire Information .............................................................................................................. 354.4 Data Analysis...................................................................................................................................... 35
4.5 Blood Sampling and Laboratory Analysis...................................................................................... 364.6 Counseling for High Blood Lead Levels........................................................................................ 374.7 Reporting Results and Information Dissemination...................................................................... 37

ii
5 STUDY DESIGN FOR SURVEY OF SCHOOL-AGE CHILDREN......................................... 39
5.1 Recruitment of the Study Population.......................................................................................... 39 5.2 Sample Size and Follow-Up.......................................................................................................... 40 5.3 Questionnaire Information........................................................................................................... 41
5.4 Data Analysis .................................................................................................................................. 415.5 Blood Sampling and Laboratory Analysis .................................................................................. 425.6 Counseling for High Blood Lead Levels .................................................................................... 435.7 Reporting Results and Information Dissemination .................................................................. 44
6 STUDY DESIGN FOR SURVEY OF UMBILICAL CORD BLOOD LEAD .......................... 45
6.1 Recruitment of the Study Population.......................................................................................... 45 6.2 Sample Size and Follow-Up.......................................................................................................... 45 6.3 Questionnaire Information........................................................................................................... 46
6.4 Data Analysis .................................................................................................................................. 466.5 Blood Sampling and Laboratory Analysis .................................................................................. 476.6 Counseling for High Blood Lead Levels .................................................................................... 486.7 Reporting Results and Information Dissemination .................................................................. 48
7 AIR MONITORING FOR LEAD....................................................................................................... 49
7.1 Collection of Lead Particulates in Air Samples ............................................................................. 497.2 Laboratory Analysis of Lead Particulates in Air Samples............................................................ 507.3 Data Completeness and Reporting Requirements........................................................................ 517.4 Data Analysis...................................................................................................................................... 51
REFERENCES............................................................................................................................................... 53
APPENDIXES
A Members of the External and USAID Technical Review Panel ....................................................... 65B List of LAC Laboratories currently enrolled in CDC PAT Program ............................................... 67C List of LAC/PAHO Lab Network Members ...................................................................................... 73D Sample Questionnaires ............................................................................................................................ 77E Whole Blood Collection and Processing .............................................................................................. 93F Standard Guide for Evaluating Performance of On-Site Extraction and Field-Portable
Electrochemical or Spectrophotometric Analysis for Lead (ASTM etc.) ........................................ 99G Standard Practice for Collection of Airborne Particulate Lead during
Abatement and Construction Activities (ASTM Standard E 1553-93) .......................................... 105
FIGURES
1 Effects of Inorganic Lead on Children and Adults: Lowest Observable AdverseHealth Effects ..............................................................................................................................................2
2 World Bank Gasoline Lead Phase-Out Project Organization..............................................................7
TABLES
1 Recently Published Studies Describing Blood Lead Levels amongSelected Populations in Latin America and the Caribbean ...................................................................4
2 Studies That Have Evaluated Blood Lead Levels in AdultsOccupationally Exposed to Lead in Gasoline...................................................................................... 10
3 Summary of Studies Conducted before and after Reduction of Lead in Gasoline ........................ 184 Advantages and Disadvantages of Monitoring Options
for Phase-out of Lead in Gasoline......................................................................................................... 205 Country-Specific Measurements of Lead in Soil, Air and Blood ...................................................... 256 Regional Resources Available for Environmental and Blood Lead Monitoring ............................ 277 Estimated Sample Sizes Needed to Detect Declines in Blood Lead Levels.................................... 348 Estimated Sample Sizes Needed to Detect Differences
in Blood Lead Levels between Two Populations ................................................................................ 409 Estimated Sample Sizes Needed to Detect Differences
in Umbilical Cord Blood Lead Levels between Two Populations.................................................... 46

iv

v
PREFACE
Declaration 23 of the Plan of Action of the Summit of the Americas (Miami, Florida, December 9-11, 1994) first established a hemispheric Partnership for Pollution Prevention. In November 1995, ameeting of country technical experts was held in Puerto Rico to further structure the Partnershipand to specify initial activities to be undertaken. As a result, the partner governments committedthemselves to develop and implement national action plans to phase out the use of lead in gasolineas rapidly as possible.
To provide technical assistance in meeting this goal, a task force of international and nationalagencies was created under the leadership of the World Bank. The task force advises the WorldBank in its efforts to lay out and coordinate a comprehensive program of joint support to encouragethe phase-out of leaded gasoline in Latin America and the Caribbean (LAC). This report is one ofseveral tools developed at the request of the task force. It is the result of collaborative effort amongUSAID�s Environmental Health Project, the Pan American Health Organization/World HealthOrganization (PAHO/WHO), and the World Bank, and is funded by the Environmental Initiativeof the Americas (EIA) and the Hemispheric Free Trade Expansion (HFTE) project of USAID�sBureau for Latin America and the Caribbean and the USAID Global Bureau�s Centers forEnvironment and Population/Health/ Nutrition.
The phase-out of leaded gasoline potentially affects trade in three ways. First, it could promotethe wider use of catalytic converters in new cars sold in LAC. Second, countries that produceunleaded gasoline can expect to see increased gasoline export sales. Third, the increased use ofsubstitutes for lead in gasoline could affect trade in octane enhancers and oxygenators.
This report provides a description of methodologies for biological and environmentalmonitoring for lead during the phase-out of lead in gasoline in Latin America and the Caribbean,options which can be adapted and used throughout the LAC region.

vii
ABOUT THE AUTHORS
Janie L. Gittleman, Ph.D., MRP, is currently the Branch Chief of the Hearing Loss PreventionBranch, and the Acting Chief of the Surveillance Branch at the National Institute for OccupationalSafety and Health (NIOSH), Pittsburgh Research Laboratory. From 1991-1995 she served as theProject Officer for the Adult Blood Lead Epidemiology and Surveillance Program (ABLES) atNIOSH, where she developed a national reporting system for state-based occupational reports ofadult blood lead levels. Since 1992, the reporting system has grown from 4 to 27 states nationwideand is the first occupational disease condition reported on a quarterly basis in the CDC�s Morbidityand Mortality Weekly Report. In addition to establishing the lead surveillance network she hasconducted numerous research investigations of lead exposures in general industry and constructionand has identified the problem of take-home lead among workers in the battery reclamationbusiness. She is currently involved in the Strategic Planning Process for NIOSH Surveillance andnoise-related research.
Patricia Billig, MA, MPH, REHS, is an environmental toxicologist with Camp Dresser & McKeeInternational in the area of public health and ecological risk assessment. She is an expert in the areaof metal toxicity at mining sites and has conducted over 100 public health and ecological riskassessments, including air, water, and soil pathways for heavy metals, pathogens, organic chemicals,asbestos, and radioactive waste. Ms. Billig is also the Senior Technical Director for theEnvironmental Health Project. Ms. Billig was the overall Team Leader for the activities in Zlatna,Romania. In that multi-year activity, she initiated the baseline blood lead level survey, developed theblood lead reduction program, and provided overall coordination for three intervention activitiesthat succeeded in reducing child blood lead levels by 28 percent.
Steven K. Ault served from 1994 to March 1997 as Technical Director for Public Health on theEnvironmental Health Project, during which time he managed a portfolio of USAID activities inLatin America, Central Europe, and Egypt. He is an environmental health scientist and entomologist(BSc with PhD studies, University of California at Davis; MSc University of Liverpool�s School ofTropical Medicine) and a Registered Environmental Health Specialist (Sanitarian). He is currentlyserving as Environmental Health Advisor for the Pan American Health Organization in Guatemala.
Mauricio Hernández-Avila served as the Director of the Center for Public Health Research at theNational Institute of Public Health in Mexico from 1991 to 1998. During that time, he conductedvarious research projects regarding the epidemiology of lead intoxication in Mexico. He is a medicaldoctor with a D.Sc. Degree in Epidemiology from the Harvard School of Public Health in Boston.In 1998-99, he held a joint appointment as researcher in the National Institute of Public Health inMexico and visiting professor in the Department of Environmental and Occupational Health in theRollins School of Public Health, Atlanta, Georgia.

viii
ACKNOWLEDGMENTS
The authors gratefully acknowledge the assistance given by the following people in preparation ofthis report: Kevin Ashley, Sherry Baron, John Borrazzo, Eddy Bresnitz, Mariano Cebrian, JohnCrawford, Teresa Fortoul, Howard Frumkin, Luis A.C. Galvão, Ed Gracely, Margie Grasberger,Edward Hayes, Fernando Meneses, Robert Jones, Masami Kojima, Philip Landrigan, Barry Levy,Tom Matte, Robert McConnell, Horst Otterstetter, Daniel Paschal, Vijay Potula, Gustavo Olaiz,Enrique Paz-Argandona, Carol Pertowski, Isabelle Romieu, Ellen Silbergeld, Babasaheb Sonawane,Cor P.W. van der Sterren, Luz Maritza Tennassee, Walter Tsou, and Elizabeth Whelan.

x
ACRONYMS
ALA-D gamma-aminolevulinic acid dehydratase
ANOVA analysis of variance
ARPEL Asistencia Recítroca Petrolera Emtresarial Latinoamericana(Reciprocal Assistance of Latin American Oil Companies)
ASV anodic stripping voltametry
BLL blood lead level
CCHAC Committee for Cooperation on Hydrocarbons in Central America
CDC U.S. Centers for Disease Control and Prevention
CEDI Caribbean Environment and Development Institute
CIDA Canadian International Development Agency
EIA Environmental Initiative of the Americas
EHP Environmental Health Project
ELPAT Environmental Lead Proficiency Analytical Testing Program
EPA U.S. Environmental Protection Agency
FIOCRUZ Fundacão Oswaldo Cruz
GFAAS graphite furnace atomic absorption spectrometry
HFTE Hemispheric Free Trade Expansion (USAID project)
LAC Latin America and Caribbean region(also a Bureau in USAID)
NHANES U.S. National Health and Nutrition Examination Survey
NIOSH U.S. National Institute of Occupational Safety and Health
OLADE Organización Latinoamericana de Energía(Latin American Organization for Energy)
OSHA Occupational Safety and Health Administration
PAHO Pan American Health Organization

xi
PAT Proficiency Analytical Testing program
PPP Partnership for Pollution Prevention (1994 accord)
SAS Commercial software program for statistical analysis
SD standard deviation
SYSTAT Commercial software program for statistical analysis
TSP total suspended particulate
UPC urinary coproporphyrin
USAID U.S. Agency for International Development
WHO World Health Organization
ZPP zinc protoporphyrin
Scientific Measurements and Units
m3 cubic meters
PM10 particulate matter less than or equal to 10 micrometers in diameter
cg/dL micrograms per deciliter

xii
EXECUTIVE SUMMARY
Background
The use of leaded gasoline results in lead emissions from vehicles, and this contributes significantlyto urban environmental degradation in Latin America and the Caribbean (LAC). In the UnitedStates, leaded gasoline has been identified as a significant contributor to the cumulative lead burdenof high-risk human populations, particularly children and women of child-bearing age in urban areas(NAS 1993; Pirkle et al. 1994). Studies conducted in several countries suggest that measurableproblems in learning can be detected in children whose median or average blood lead levels are aslow as 5 to 10 cg/dL (IPCS 1995; Needleman and Gastonis 1990; Schwartz 1994). Cumulative leadburdens in adults are also linked to neurological and physiological problems such as increasedhypertension (Payton et al. 1998; Hu et al. 1996b) and associated renal and cardiovascular disease(Kim et al. 1996; Schwartz 1995).
Chronic lead poisoning is suspected as a health problem affecting many children and adults in theLAC region. Published information on blood lead levels in children and adults and lead in theenvironment has been limited, though more information has recently become available (Howson etal. 1996; Lacasaña et al. 1996). Despite limited information, lead intoxication is recognized as one ofthe major public health problems in some countries of the region.
Approach
This report describes methodologies for monitoring blood lead levels during the phase-out of lead ingasoline at the national level. The proposal focuses on particular segments of the general population,chosen because their health (or that of their offspring) is strongly impacted by exposure to lead andbecause they are more readily accessible at schools, workplaces, and hospitals. In addition, it issuggested that environmental monitoring be conducted in parallel, by periodic assessment of leadedgasoline use or sampling for lead in air.
Issues for Consideration
An important aspect in carrying out these monitoring options is the requirement that the options beimplemented in the context of existing programs and with current facilities in the LAC region.Monitoring should be incorporated into an existing health institution�s activities or within thecontext of a university-based research group. The institutional locus of monitoring should beflexible, accounting for differing capabilities from country to country.
In addition, those undertaking blood lead monitoring programs need to be prepared for thediscovery of important sources of lead exposure other than leaded gasoline. As demonstrated by thecase study in Peru (see section 2.5 in Chapter 2), blood lead monitoring programs often reveal othersources of lead exposure. If these other sources of exposure are significant, from a public healthpoint of view, follow up with study participants will be required and, potentially, interventions toreduce these other sources of exposure will be needed.

PART A: OVERVIEW

1
INTRODUCTION
1.1 Health Effects from Lead Exposure
In the United States, emissions from vehicles using leaded gasoline have been identified as asignificant contributor to the cumulative lead burden of sensitive human populations, particularlychildren and women of child-bearing age in urban areas (NAS 1993; Pirkle et al. 1994). Studiesconducted in several countries suggest that measurable problems in learning can be detected inchildren whose median or average blood lead levels are as low as 5 to 10 cg/dL (IPCS 1995;Needleman and Gastonis 1990; Schwartz 1994). These adverse health effects are illustrated in Figure1.
In recent years, researchers have reported extensively on the developmental and neuropsychologicaleffects of lead in children (Calderón-Salinas et al. 1996; Pocock et al. 1987; see Banks et al. 1997 fora review). Groups of children with high lead levels have been shown to have lower scores on IQtests, and researchers have also accumulated data to suggest that blood lead levels are inverselyrelated to cognitive function and ability (Bentou-Maranditou et al. 1988; Hansen et al. 1989; PAHO1990a and b; Damm et al. 1993). Associations between body lead levels and neuroconductivity havealso been reported by Fergusson et al. (1993), Grandjean et al. (1991), and Stiles and Bellinger(1993). Motor-visual integration effects of lead have been reported by Baghurst et al. (1995) andBellinger (1995) and behavioral problems as reported by teachers and parents, have been cited bySilva et al. (1988).
Additionally, Muñoz et al. (1993) examined neurocognitive developmental capacity in children inMexico City with chronic lead exposures. The results showed that blood lead levels were a strongpredictor for lower performance on full-scale IQ as measured by a version of the WeschlerIntelligence Scale for Children, as well as lower scores on other measures of school performance.The average blood lead levels exceeded 19 cg/dL and that the major sources of exposure werevehicular traffic near the child�s residence, use of glazed pots for preparing and storing food orjuices, and frequency of chewing pencils.
The current �level of concern� for adverse developmental effects in children is 10 cg/dL,established by the U.S. Centers for Disease Control and Prevention (CDC 1991) and other nationaland international health authorities (e.g., French Academy of Pediatrics; Australian Medical ResearchCouncil; Health and Welfare Canada; World Health Organization/Pan American HealthOrganization).
Figure 1Effects of Inorganic Lead on Children and Adults:
Lowest Observable Adverse Health Effects

2
CHILDREN Lead Concentration inBlood
(µg Pb/dL)
ADULTS
150
100
50
40
30
20
10
Death ×
Encephalopathy ×Nephropathy ×
Frank anemia ×
Colic ×
yHemoglobin synthesis ×
yVitamin D metabolism ×
yNerve conduction velocity ×
xErythrocyte protoporphyrin ¿ ³ ×
yVitamin D metabolism (?) Ù
Developmental Toxicity ×
yIQ, yHearing, y Growth ×
Transplacental Transfer ×
Ø Encephalopathy
Ø Frank anemia
Ø Decreased longevity
Ø yHemoglobin synthesis
Ú Peripheral neuropathiesØ ³ Infertility B
À Nephropathy
Ú xSystolic blood pressure BØ ³ À yHearing acuity
Ø xErythrocyte protoporphyrin B
Ø xErythrocyte protoporphyrin C
Ø xHypertension (?)
x Increased Function y Decreased FunctionSource: ATSDR 1992. In Howson et al. 1996. Lead in the Americas.

3
Cumulative lead burdens in adults are also linked to neurological (Payton et al. 1998) andphysiological problems such as increased hypertension (Hu et al. 1996b) and associated renal andcardiovascular disease (Kim et al. 1996; Schwartz 1995).
Chronic lead poisoning is suspected as a health problem affecting many children and adults in theLatin American and Caribbean (LAC) region. Historically, published information on blood leadlevels in children and adults and lead in the environment in this region has been limited but,recently, more data has been published (Howson et al. 1996; Lacasaña et al. 1996). (See Table 1 for areview of recently published studies.) Despite limited information, some LAC countries haverecognized lead intoxication as one of the major public health problems. In Mexico, for example,leaded gasoline has been reported as one of the contributors to high blood lead levels in children(Romieu et al. 1990; Rothenberg et al. 1998). Other major sources of lead exposure identified inurban environments in the LAC region include air particulates and industrial waste from lead-acidbattery recycling (Vahter et al. 1997; Bonilla et al. 1998), pencils coated with lead-paint (Olaiz et al.1996a), consumption of canned foods containing lead solder, household plumbing and water storagetanks, and use of lead-glazed ceramics used for food preparation and storage (Romieu et al. 1994;Romieu et al. 1995). In addition, populations living in close proximity to smelting and miningoperations are also at risk of lead exposure (Calderón-Salinas et al. 1996; Ordoñez et al. 1976).
1.2 Experience Monitoring Lead Levels
Monitoring changes in lead levels in human populations has allowed environmental health scientiststo present evidence that environmental interventions are successful in reducing exposure as shownby declines in blood lead levels. One major intervention used in Mexico, the United States, andother countries in the Americas has been to eliminate lead from gasoline.
In the Americas, no country has a continuous, nationwide monitoring program for biological lead.However, the periodic U.S. National Health and Nutritional Examination Surveys (NHANES)helped track changes in blood lead levels among a representative sampling of 27,801 children andadults in the United States from the 1970s through the 1980s, the period in which the phase-out ofleaded gasoline occurred. These studies have reported a significant lowering of blood lead levelsamong the general population (Annest 1983; Pirkle et al. 1994) associated with the phase out ofleaded gasoline. By 1991-1994, the Phase 2 NHANES study estimated that only 4.4% of children 1-5 years in the United States had blood lead levels A10 cg/dL (CDC 1997). A monitoring study ofthe long-term trend (1974-1988) in blood lead levels among children in a large U.S. city (Chicago)and its relationship to air lead levels found that median blood lead levels had declined from30 cg/dL in 1968 to 12 cg/dL in 1988, and were strongly associated with declining average air leadlevels (r = 0.8, p < 0.001) from 1974 through 1988; most of the decline was attributed to the phase-out of leaded gasoline in Chicago during this period (Hayes et al. 1994).

4
Table 1Recently Published Studies Describing Blood Lead Levels among
Selected Populations in Latin America and the Caribbean
Author and year ofpublication City and country
Age group(years)
Populationstudied
Samplesize Sources of exposure identified
Mean BloodLead Level
(µg/dL)
Villa Venezuela, Nicaragua 1-14 years Children 30 Air lead 7.4
Bonilla et al. [1998] Managua, Nicaragua6 months to 13years Children 97 Living close to a battery factory 17.2
Vahter et al. [1997] Rural communities, Ecuador 4-15 Children 82 Recycling of batteries 52.6
Schutz et al. [1997] Montevideo, Uruguay 2-14 Children 96 Exposure to traffic 9.5
Lopez-Carrillo et al.[1996] 1-5 Children 603
Ambient airLead glazed ceramics 15.0
Romieu et al. [1995] 1-5 Children 200Ambient airLead glazed ceramics 9.9
Hernández-Avila et al.[1997] At birth Children 1,849
Ambient airLead glazed ceramics 7.1
Farias et al. [1996] 13-43Pregnantwomen 513
Ambient airLead glazed ceramics 11.08
Rothenberg et al. [1998] Mexico City, Mexico 6-18 months Children 104Lead in gasolineLead-glazed ceramics
Lima, Peru 26.9
Huancayo, Peru 22.4
La Oroya, Peru 34.8
Ramirez et al. [1997] Yaupi, Peru 18-50 Adults 320 Degree of industrialization 14.0
Jacoby [1998] Lima, Peru 1-4 Children 40 Not mentioned 11.7
At birth 2.99
Santiago, Chile 24 months 312 5.04
At birth 1.99
Frenz et al. [1997] San Felipe, Chile (rural area) 24 months Children 113
Ambient airPaintHand/Mouth BehaviorLiving in Santiago 3.65

5

6
In Europe, the results of monitoring experiences in Budapest, Hungary, provide similar findings.Hungary is a medium-income country, like many in Latin America. Periodic monitoring of bothenvironmental and blood lead levels has been performed. Airborne lead in the city declined from amean of 3.0 cg/m3 in 1985 to a mean of 0.6 cg/m3 in 1993. The mean blood lead level inBudapest�s children in 1985 was 24.8 cg/dL; by 1993 it had dropped to 7.6 cg/dL. In the sameperiod (1985-1993), the lead content of gasoline was gradually reduced from 0.7 g/liter to 0.15g/liter (Lovei 1996).
In Mexico, prior to the 1992 phase-out of lead in gasoline in Mexico City, a 1980 study reported themedian blood lead levels of a cohort of 85 adult schoolteachers was 24 cg/dL (AECLP/EDF1994). Periodic monitoring in the Metropolitan Zone of Mexico City since 1991, however, hasfound that blood lead levels in the general population have decreased (Romieu and Lacasaña 1996).Elevated blood lead levels were also confirmed in a hospital-based study conducted in Mexico City(1991-92). Average blood lead levels among children were measured at 15.6 cg/dL (Jimenez 1993).Currently, approximately 30 to 50% of the children are estimated to have blood lead levelsexceeding 10 cg/dL (Romieu and Lacasaña 1996).
It is estimated that 1,500 metric tons of lead were released into the air of Mexico City each year inthe 1980s from the combustion of leaded gasoline alone (Contreras 1990). In the metropolitan areaof Mexico City, ambient air monitoring carried out continuously since 1988 has documented amarked decrease in lead levels in ambient air, which in 1988 registered 1.95 cg/m3 but by 1994 haddropped to 0.28 cg/m3 (Howson et al. 1996; Romieu et al. 1992). Over the same period, a paralleldecrease in blood lead levels in the �residential� population (i.e., referring to the general population,a mixture of adults and children) of the area was also documented (Driscoll et al. 1992; Romieu et al.1994; Romieu and Lacasaña 1996; Rothenberg et al. 1998).
1.3 The World Bank Program to Support the Phase-out of Lead
The World Bank has recommended the phase-out of leaded gasoline worldwide, increased itsinterest in promoting investments to reduce the use of leaded gasoline in the LAC region (Lovei1996), and secured co-funding from CIDA (the Canadian International Development Agency) tosupport these efforts. Initial work has focused on gathering existing information principally throughARPEL (a South American organization of state oil concerns), CCHAC (Committee forCooperation on Hydrocarbons in Central America), and CEDI (the Caribbean Environment andDevelopment Institute).
Overall, the Bank is developing seven tools for addressing the issue of lead risk reduction: 1) supportfor an inventory of gasoline use in the LAC region; 2) a study examining the health impacts of leadin gasoline and its alternatives; 3) development of monitoring options to describe trends in bloodlead levels and environmental lead levels over time as leaded gasoline is eliminated throughout theLAC region; 4) the automobile industry and government studies summarizing the experience ofolder cars using unleaded gasoline; 5) the consequences for refineries switching to production ofunleaded gasoline; 6) alternative fuels to gasoline; and (7) country-specific case studies of theconversion to unleaded automobile fuels. Figure 2 shows the seven World Bank �tools� for carryingout the leaded gasoline phase-out program. This paper represents options for the health monitoringtool.
1.4 Development of Monitoring Options

7
This report describes methods for tracking the changes in air lead levels and biological exposures tolead during the phase-out of lead in gasoline at either the national or municipal levels. The objectiveis to suggest monitoring options that can be adapted and used in countries throughout LatinAmerica and the Caribbean region. The data generated can be used to aid policy-makers and healthprofessionals in evaluating the impact of the phase-out of lead in gasoline.
The lead monitoring options will provide data to describe trends in measured blood lead levels inselected segments of the general population of the country, indirectly help identify other potentialsources of lead that may impact blood lead levels, and help track changes in leaded gasoline use, aswell as monitor levels of lead in urban air.
Although decreases in blood lead levels relative to the phasing of lead from gasoline have beendocumented in all age groups and various occupational groups, it is more efficient to focus onbiological monitoring of three segments of the general population: worker populationsoccupationally exposed to leaded gasoline emissions, young urban children, and pregnant women atthe time of delivery. These groups were chosen because their health (or that of their offspring isstrongly impacted by exposure to lead and because they are readily accessible at schools, workplaces,and hospitals. It is also important that environmental monitoring be conducted in parallel withbiological monitoring, through periodic assessment of leaded gasoline use or sampling for lead in air.It is recommended that biological and environmental monitoring be done annually, over a ten-yearhorizon, to inform program development and evaluation.
Both cost and infrastructure limitations prohibit the conduct of national population-based surveys inthe region. However, targeting of these selected populations, representative sampling methods, andadequate sample sizes, will provide sound scientific information which can be used to informpolicymakers and public health officials for decision-making purposes.

8
Lead Phase Outin Gasoline
TechnicalAssistance
Dissemination Asst. to CountryNational Plans
Training Program
InventoryDiagnosis
HealthIssues
HealthMonitoring
CarAspects
RefineryAspects
AlternativeFuels
CountryStudies
Task ForcePartnership Pollution
Prevention
SteeringCommittee
National LeadFocal Points
Figure 2World Bank Gasoline Lead Phase-Out Project Organization
Source: Ing. Cor P. W. van der Sterren, Oil and Gas Division, Industry and Energy Department, WorldBank.
10
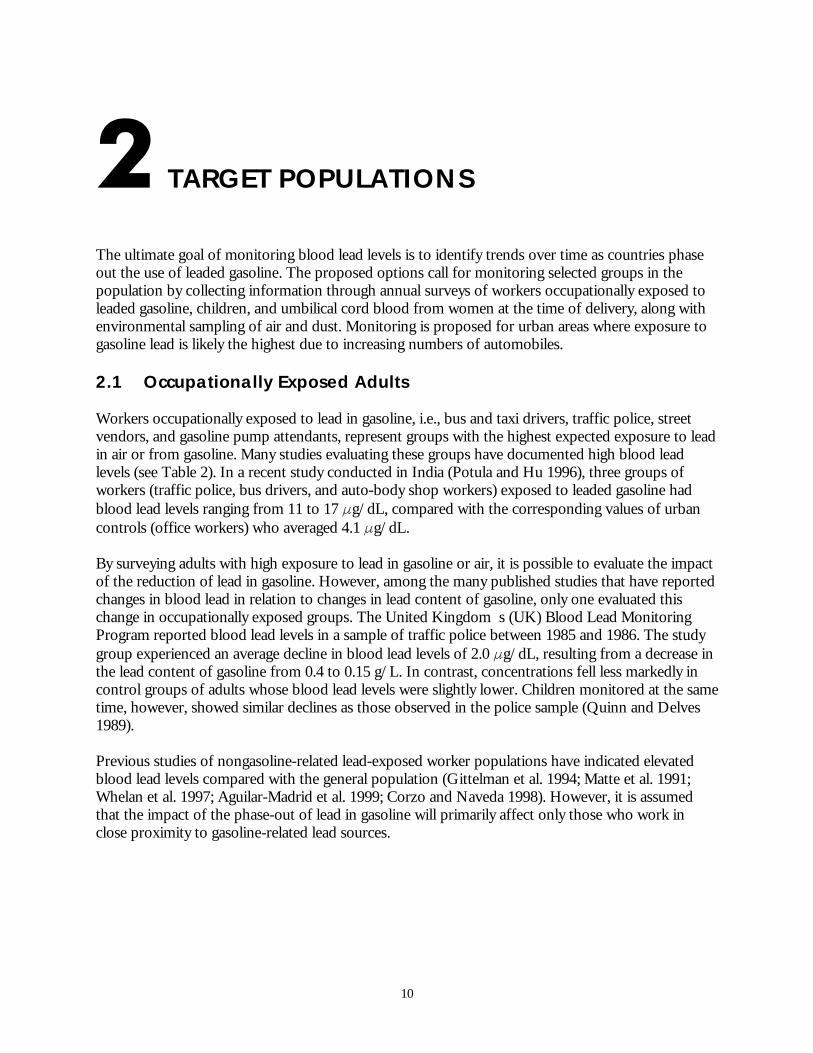
TARGET POPULATIONS
The ultimate goal of monitoring blood lead levels is to identify trends over time as countries phaseout the use of leaded gasoline. The proposed options call for monitoring selected groups in thepopulation by collecting information through annual surveys of workers occupationally exposed toleaded gasoline, children, and umbilical cord blood from women at the time of delivery, along withenvironmental sampling of air and dust. Monitoring is proposed for urban areas where exposure togasoline lead is likely the highest due to increasing numbers of automobiles.
2.1 Occupationally Exposed Adults
Workers occupationally exposed to lead in gasoline, i.e., bus and taxi drivers, traffic police, streetvendors, and gasoline pump attendants, represent groups with the highest expected exposure to leadin air or from gasoline. Many studies evaluating these groups have documented high blood leadlevels (see Table 2). In a recent study conducted in India (Potula and Hu 1996), three groups ofworkers (traffic police, bus drivers, and auto-body shop workers) exposed to leaded gasoline hadblood lead levels ranging from 11 to 17 cg/dL, compared with the corresponding values of urbancontrols (office workers) who averaged 4.1 cg/dL.
By surveying adults with high exposure to lead in gasoline or air, it is possible to evaluate the impactof the reduction of lead in gasoline. However, among the many published studies that have reportedchanges in blood lead in relation to changes in lead content of gasoline, only one evaluated thischange in occupationally exposed groups. The United Kingdom�s (UK) Blood Lead MonitoringProgram reported blood lead levels in a sample of traffic police between 1985 and 1986. The studygroup experienced an average decline in blood lead levels of 2.0 cg/dL, resulting from a decrease inthe lead content of gasoline from 0.4 to 0.15 g/L. In contrast, concentrations fell less markedly incontrol groups of adults whose blood lead levels were slightly lower. Children monitored at the sametime, however, showed similar declines as those observed in the police sample (Quinn and Delves1989).
Previous studies of nongasoline-related lead-exposed worker populations have indicated elevatedblood lead levels compared with the general population (Gittelman et al. 1994; Matte et al. 1991;Whelan et al. 1997; Aguilar-Madrid et al. 1999; Corzo and Naveda 1998). However, it is assumedthat the impact of the phase-out of lead in gasoline will primarily affect only those who work inclose proximity to gasoline-related lead sources.

11
Table 2Studies That Have Evaluated Blood Lead Levels in
Adults Occupationally Exposed to Lead in Gasoline
Authors City Exposure Group
SampleSize
n
MeanBlood Lead
Level(µg/dL)
Taxi drivers 40 22.8Flindt et al. [1976] Manchester,England Control NA
Police 175 11.3Quinn et al. [1987] Various cities,England Control 195 10.9
Bus drivers 342 6.4Sharp et al. [1988] San Francisco,USA Control NA
Taxi drivers 50 28.7Jones et al. [1972] London, England
Control NA
Transport workers 150 52.1
Traffic Police 36 51.0
Shop keepers in busy roads 36 52.1
Khan et al. [1995] Various cities,Pakistan
Control 36 24
Street vendors 76 30.3Bossano andOviedo [1996]
Quito, Ecuador
Pregnant house wives (control) 83 18.4
Office worker (control 10 4.1
Auto-shop worker 9 17.5
Bus driver 22 12.1
Potula and Hu[1996]
Madras, India
Traffic Police 88 11.2
Bus Drivers 47 5.8
Gas-station attendants 42 5.6
Taxi drivers 47 5.9
Kapaki et al. [1998] Athens, Greece
Control 33 5.7
NA = Not available in the reference
2.2 Children
Children are the most vulnerable segment of the population for health risks associated with leadexposure, because their systems absorb lead to a much greater extent than adults and theirdeveloping neurologic systems are more sensitive to lead exposure (Lovei 1995). In addition,children are typically moer exposed to lead in their environment due to frequent had to mouthcontacts.

12
The evolution of our understanding of the dangers of lead to children has several benchmarks. Atthe end of the nineteenth century, lead was recognized as a poison to children where a clinical caseseries of children with high blood lead levels experienced concomitant symptoms of paralysis andophthalmoplegia (Needleman 1988 and 1994). In the 1960s, development of biologic markers forlow exposure levels and clinical identification of associated health effects increased ourunderstanding of the adverse health effects associated with elevated blood lead levels.
Young children are known to absorb lead from the gastrointestinal tract more efficiently than doadults; it is estimated that children retain as much as 60% of ingested lead, while adults retain onlyabout 5 to 10% (EPA 1986). In addition, children�s higher respiratory rate and relative volumes ofrespiration (amount of air inhaled per unit of body weight) expose them to larger doses of airbornecontaminants. And because children�s brains are continuing to develop for the first six to eightyears after birth, the brain cells of young children may be more sensitive to the long-lasting effectsof lead on that organ (Silbergeld 1992).
One impediment to sampling children six months to six years (the target group for lead screening)has been difficulty in obtaining venous blood specimens. During recent years, researchers havefound that capillary sampling or a finger stick�a much less unpleasant and intimidatingprocedure�may provide valid information regarding blood lead levels (Schlenker et al. 1994; Sargent1996; Johnson 1997). The combination of finger stick sampling with new portable blood-leaddetection devices that produce accurate results in the field within minutes have greatly enhanced thecapability for blood lead testing. (The LeadCare� system consists of a compact, hand-held,battery-powered instrument that requires no manual calibration. See Appendix E) These instrumentshave been used successfully in remote areas of Ecuador (Counter et al. 1998) and in Lima, Peru (seecase study described in Section 2.5).
2.3 Pregnant Women at Time of Delivery
Because of intrauterine exposure of the fetus, pregnant women are an important high-riskpopulation for the effects of lead. There is little inhibition of lead as it crosses the placenta, withexposure to the fetus documented as early as 12 to 14 weeks gestation (Buchet et al. 1978; Al-Salehet al. 1995). Blood lead levels of women have been highly correlated with the blood lead levels oftheir developing fetuses and newborn infants; the mother�s blood lead level can act as an earlyindicator of the adverse health effects that may accrue to a child during critical formative stages ofdevelopment (Rabinowitz et al. 1991; Al-Saleh et al. 1995; Rothenberg et al. 1996).
Studies of umbilical cord blood lead levels have also been used as predictors of future neurologicand behavioral development of the fetus and, as some suggest, sentinels for environmental exposureto lead (Needleman et al. 1990; Schwartz 1994; Bellinger et al. 1994). These types of studies havebeen conducted in various countries, including the United States, Canada, Taiwan, Mexico,Venezuela, and Egypt (Harris 1972; Hu et al. 1996b; Troster and Schwartzman 1988; Clark 1977).
In the 1996 study in Mexico City, Rothenberg and coauthors examined the passage of lead from thepregnant mother to the unborn child. The mean maternal blood lead level was 8.4 cg/dL and themean umbilical cord blood lead level was 7.4 cg/dL, indicating a high correlation between thematernal and cord lead levels (r=.80, p< .0001). The results of that study provided evidence tosupport the transfer of lead from the mother to the fetus. Such studies suggest that low levels of leadexposure to pregnant women may also be considered hazardous to the mother, resulting in

13
increased potential for sterility, abortion, stillbirths, and neonatal deaths. Furthermore, researchershave suggested that low levels of lead exposure in utero may be related to deficits in both fetal growthand postnatal behavior (Clark 1977). Bellinger et al. (1984, 1987) also reported neurobehavioraldeficits on the Bayley Scale of Infant Development associated with higher prenatal exposures (cordblood lead levels of 10-25 cg/dL).
The skeleton is the primary storage site for approximately 95% of lead in the adult human body.Bone uptake of lead had been assumed to principally involve sequestration; however, significantamounts of bone lead may be released from bone into blood in response to the increased boneturnover associated with pregnancy. Recent studies (Gulson et al. 1997; 1998) with a lead isotopecomposition method have estimated that the skeletal contribution resulted in a mean increase of31% in the 206Pb/ 204Pb ratio. Mobilization of bone lead has been raised as a concern for usingumbilical cord blood lead levels to monitor environmental interventions. Because umbilical cordblood lead levels reflect the joint contribution of environmental (diet and air) and endogenous(skeletal lead) sources, any change in bone lead mobilization may mask the effect attributed toenvironmental interventions, such as decreasing lead from gasoline. However, since the half-life oflead in bone is on the order of decades, the contribution of this source�in the absence of anypathological condition�will remain constant over time and will not mask the effect of environmentalinterventions. Furthermore, several studies have shown that umbilical cord blood lead levelfluctuates according to maternal environmental exposures. For example, during 1979 to 1981umbilical cord blood lead levels among 11,837 deliveries recorded at the Boston Lying-In Hospitalin Massachusetts varied significantly as the sale of leaded gasoline declined (Rabinowitz andNeedleman 1983). In the same hospital, between 1980 and 1990, umbilical cord blood leadconcentrations were reported to decrease from 6.6 cg/dL to 1.19 cg/dL, a change similar to the76% decrease in blood lead levels measured in the United States general population between 1976and 1991 (Pirkle et al. 1994; Hu et al. 1996a). These observations support the hypothesis thatumbilical cord blood lead levels may be used as a sentinel marker to monitor the effects of phasinglead out from gasoline.
2.4 Monitoring Multiple Populations
It is important to target more than one group to compensate for confounding factors from otherpotential sources of lead. For example, children may be exposed through some unforeseen source inschool or at home; if these sources changed concomitant to the change in the lead content ofgasoline, this could mask the effect attributed to exposure from lead in gasoline. By monitoringchildren, persons occupationally exposed, and/or umbilical cord blood at time of delivery,confidence is increased that the effects of phasing out lead in gasoline will be detected in the generalpopulation.
The UK Blood Lead Monitoring Program, for example, targeted three different groups: adults in thegeneral population, occupationally exposed groups (police and taxi drivers), and children six- toseven-years old attending primary schools situated on busy roads or congested crossroads. Declinesin blood-lead concentrations were detected in all three groups; however, changes were moreapparent in the occupationally exposed groups and in children (Quinn and Delves 1987). For a listof additional studies that have evaluated blood lead levels in occupationally exposed adults, seeTable 2.
2.5 Case Study in Peru

14
As part of the activities related to removing lead from gasoline, the Peruvian government proposedthe implementation of a blood lead survey to evaluate current levels of lead exposure in Lima and toobtain baseline data to monitor changes in blood lead associated with the phase-out of lead. TheDirectorate of Environmental Health (DEH)�the environmental arm of the Ministry of Health�was to carry out the study. An initial assessment revealed the following:
` Not much is known about lead exposure in Lima. Of the two studies available, one reporteda mean blood lead level of 26.9 cg/dL among a sample of 80 adults, and the other reporteda mean blood lead level of 11.7 cg/dL in 40 young children.
` DEH laboratories measured blood lead by flame atomic absorption spectrophotometry; noexternal quality controls were used and a 5 ml blood samples was required.
` The available budget hampered the possibility of conducting a random population-basedsurvey of the entire Lima metropolitan area, or to update laboratory facilities to inlcudemodern graphite furnace atomic absorption spectrometry.
As a result of this assessment and after discussion with key stakeholders, evaluators decided tosample pregnant women and first-grade children in Lima. Occupational groups exposed to leadfrom gasoline were not considered because initial consultations showed that these groups weresomewhat reluctant to participate in the study, while school and hospital authorities wereenthusiastic about the study. The availability of new technology for blood lead leveldetermination�battery-powered, portable anodic striping voltammeters (LeadCare� portableinstruments)�resulted in a change in the method used to conduct the sampling. These portableinstruments are the size of a hand calculator, are simple to use, require neither manual calibrationnor refrigeration. DEH personnel received training in the use of these new instruments, whichwould allow them to obtain blood lead results within minutes, providing the opportunity to conducton-site counseling; and to obtain blood samples by a finger-stick procedure that minimized externallead contamination (See Appendix E for a full protocol). Results of a pilot test documented a muchhigher acceptance rate of this sampling method among children and parents. This also causedevaluators to modify the study design to include children aged six months to seven years. Inaddition, because these instruments simplified field work, the sample was expanded to include moredistricts from Lima and Callao, a neighboring independent constitutional Province, that shares alarge metropolitan area with Lima.Between July 1998 and January 1999, DEH personnel sampled 2,510 children aged six months tonine years (mean age of 4.5 years) and 814 women in early postpartum living in Lima and Callao.The study population was selected through a sampling scheme that included government-operatedschools, health centers, and public hospitals. Hospital-based recruitment (in five preselectedmaternity hospitals) was used as a strategy to increase the proportion of children aged 6 to 24months and to sample women delivering babies. The survey included 16 schools (day-care centersand primary schools) located in areas of intense vehicular activity in five districts of Lima and Callao.Potential sources of lead were investigated with a small questionnaire about the most commonsources of lead in the LAC region. Adverse health effects of lead exposure were evaluated usinginformation regarding school performance and physical growth. All participants receivedinformation and counseling regarding their blood lead levels and written information indicating howto reduce exposure to lead.

15
The geometric mean blood lead level for the total population sampled was 9.9 cg/dL. Of theparticipating children, 29% had high blood lead levels (above 10 cg/dL) and 9.4% had blood leadlevels higher than 20 cg/dL. Blood lead levels varied significantly by province. Compared withLima, where evaluators observed a mean blood lead level of 7.1 cg/dL, Callao had a significantlyhigher mean blood lead level of 15.2 cg/dL. Variation in blood lead levels became more apparentwhen mean values were tabulated by school location. High blood lead levels were concentrated atschools in close proximity to a storage area for mineral concentrates. An additional investigation isunderway to ascertain the impact of this storage area as a point source of lead exposure. Also,children reported to habitually put their hands in their mouths had higher blood lead levels.
Exposure to vehicular traffic was also associated with high blood lead levels. Children whose houseswere on streets with high traffic had a twofold increase in the risk of having high blood lead levels.High blood lead levels were inversely associated with height and school performance.
Pregnant women who participated in the study had a mean age of 25 years. Their mean blood leadlevel was 3.5 cg/dL, and 2.4% (n=21) had blood lead levels over 10 cg/dL. The variance in bloodlead levels at different recruitment hospitals reflected a positive trend, with higher mean blood leadlevels at hospitals located in districts with higher vehicular traffic.
Results from this study are important in several ways. They provide valuable information regardingpopulation blood lead levels and their determinants. The data also illustrate the application of aneasy-to-use sampling technology to assess blood lead levels. This method provides a cost-effectivealternative for countries that do not have the funds or technical expertise to develop laboratoryfacilities for blood lead testing based on atomic absorption. Results confirmed residents� ubiquitousexposure to lead and suggest that reducing the use of leaded gasoline will reduce exposure to leadand its adverse consequences for future generations. As expected, the study also uncoveredadditional sources of lead. These findings emphasize the importance of implementing acomprehensive strategy for lead control, as opposed to a strategy that relies solely on the eliminationof leaded gasoline to reduce exposure to lead. (This study is described in Hernández-Avila et al.1999.)

16
17
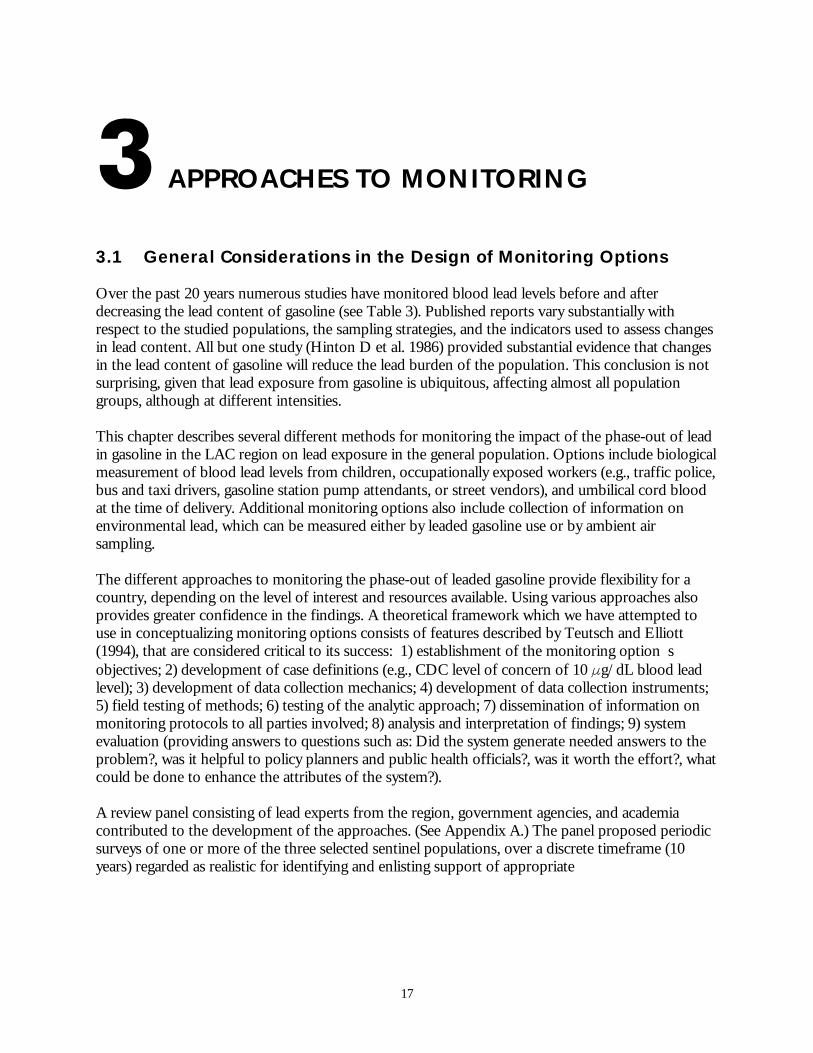
APPROACHES TO MONITORING
3.1 General Considerations in the Design of Monitoring Options
Over the past 20 years numerous studies have monitored blood lead levels before and afterdecreasing the lead content of gasoline (see Table 3). Published reports vary substantially withrespect to the studied populations, the sampling strategies, and the indicators used to assess changesin lead content. All but one study (Hinton D et al. 1986) provided substantial evidence that changesin the lead content of gasoline will reduce the lead burden of the population. This conclusion is notsurprising, given that lead exposure from gasoline is ubiquitous, affecting almost all populationgroups, although at different intensities.
This chapter describes several different methods for monitoring the impact of the phase-out of leadin gasoline in the LAC region on lead exposure in the general population. Options include biologicalmeasurement of blood lead levels from children, occupationally exposed workers (e.g., traffic police,bus and taxi drivers, gasoline station pump attendants, or street vendors), and umbilical cord bloodat the time of delivery. Additional monitoring options also include collection of information onenvironmental lead, which can be measured either by leaded gasoline use or by ambient airsampling.
The different approaches to monitoring the phase-out of leaded gasoline provide flexibility for acountry, depending on the level of interest and resources available. Using various approaches alsoprovides greater confidence in the findings. A theoretical framework which we have attempted touse in conceptualizing monitoring options consists of features described by Teutsch and Elliott(1994), that are considered critical to its success: 1) establishment of the monitoring option�sobjectives; 2) development of case definitions (e.g., CDC level of concern of 10 cg/dL blood leadlevel); 3) development of data collection mechanics; 4) development of data collection instruments;5) field testing of methods; 6) testing of the analytic approach; 7) dissemination of information onmonitoring protocols to all parties involved; 8) analysis and interpretation of findings; 9) systemevaluation (providing answers to questions such as: Did the system generate needed answers to theproblem?, was it helpful to policy planners and public health officials?, was it worth the effort?, whatcould be done to enhance the attributes of the system?).
A review panel consisting of lead experts from the region, government agencies, and academiacontributed to the development of the approaches. (See Appendix A.) The panel proposed periodicsurveys of one or more of the three selected sentinel populations, over a discrete timeframe (10years) regarded as realistic for identifying and enlisting support of appropriate

18
Table 3Summary of Studies Conducted before and after Reduction of Lead in Gasoline
Authors CountryYears
compared Study design Population studiedChange in lead in
gasoline/air
Change in meanblood lead level
(µg/dL)
Rabinowitz and Needleman[1983]
USA 1979-1981 Cross-sectional Delivering women 250*106 gal per month to75*106 gal per month
Decline of 2.8 cg/dL perchange of 108 g per monthin leaded petrol sales
Maravelias et al. [1998] Greece 1982-1996 Cross-sectional Children 3.21 to 0.4 cg/m3 -27.7 cg/dL
Hayes et al. [1994] USA 1968-1988 Cross-sectional 0.9 to 0.1 cg/m3 -18 cg/dL
Grobler [1992] South Africa 1984-1990 Cross-sectional Long distance runners 0.8 g/L to 0.4 g/L -38.9 cg/dL
Police -2.0 cg/dL
Children -1.5 cg/dL
Quinn and Delves [1989] England 1985-1986 Longitudinal andcross-sectional
General population
0.4 to 0.15 g/L
-1.0 cg/dL
Bono et al. [1995] Italy 1985-1994 Cross-sectional Adults, Blood donors 0.4 to 0.15 g/L -8.5 cg/dL
Wang et al. [1997] Canada 1982-1990 Cross-sectional Children 2.6 x 10⁹ to 1.9 x 10⁷ g oflead per year
1.03 cg/dL per L per year
Rothenberg et al. [1998] Mexico 1987-1993 Longitudinal Children from birth to 36months
Not reported 7.6 cg/dL
Weitlisbach et al. [1995] Switzerland 1984-1993 Cross-sectional Adults, general population 0.40 to 0.15 g/L 12.2 to 6.81 cg/dL
Adults (females) 11.5 to 6.8 cg/dLHinton et al. [1986] New Zealand 1978-1985 Cross-sectional
Preschool children
No Change
14.0 to 7.9 cg/dL
Taylor et al. [1995] Australia 1993-1979 Cross-sectional Children 3.3 cg/m3 to 0.96 cg/m3 11.1 to 5.7 cg/dL
Adults 11.9 to 6.3 cg/dLSchuhmacher et al. [1996] Tarragona,Spain
1990-1995 Cross-sectional
Children
0.40 to 0.15 g/L
8.5 to 4.2 cg/dL
Maresky and Grobler [1993] Capetown,South Africa
19841990
Cross-sectional Adults 0.83 g/L to 0.4 g/L 9.7 to 7.2 cg/dL

19
agencies and gathering useful data. However, the appropriate length of time will depend on howrapidly lead phase-out policies are implemented.
3.2 Biological Monitoring
Biologic markers of lead exposure that have been used in surveys of children and adults includeindicators of internal dose such as lead concentrations in blood, urine, feces, teeth (dentin), hair, andbone (Brody et al. 1994; Rabinowitz et al.1991; EPA 1986; Silbergeld 1991; Steenhout 1982);indicators of biochemical change including erythrocyte zinc protoporphyrin (ZPP) levels, whichcorrelate well with lead exposure, ALA-D (gamma-aminolevulinic acid dehydratase), UPC (urinarycoproporphyrin), hemoglobinemia, and stippled basophilic erythrocytes (Corey and Galvão 1989);neurological indicators such as electro-physiology (conduction velocity, evoked potential) andneuroconductivity (Howson et al. 1996); and behavioral indicators using neuropsychological andbehavioral parameters (e.g., Baghurst et al. 1992, Bellinger and Dietrich 1994, Needleman et al. 1996,Rice 1996, Ruff et al. 1996).
The Global Environmental Monitoring System (GEMS) of the United Nations EnvironmentProgram has selected human hair as one of the materials for worldwide biological monitoring.Human nails and animal hair and nails have also been used to detect a variety of trace metals,including lead (EPA 1979). However, blood lead is the most common indicator used and has beenthe basis for most of the studies that have established the cause-and-effect relationships betweenlead exposure and health impacts. Hence, the monitoring options presented in this report use bloodlead level as the biomarker of choice.
Biological (blood lead) and environmental (air lead) monitoring programs can use one or more ofthe following three options, based upon resource availability, logistics, and practicality. Theadvantages and disadvantages of each approach are discussed below and summarized in Table 4.Environmental lead sampling is also briefly discussed in this section and expanded upon in Chapter7. It is important to note that environmental lead sampling is meant to complement but not replacethe biological monitoring of human populations.
Option: Periodic Survey of Highly Exposed Occupational Populations
This approach would survey groups of workers (e.g., traffic police, bus or taxi drivers, streetvendors, or gasoline station pump attendants) highly exposed to automobile emissions by inhalationand/or ingestion of particulates.
The advantage of the occupational option is that it targets individuals in the population with highexposures to leaded gasoline, which can be compared to a similar group (age-matched) notoccupationally exposed (e.g., two cohorts of men aged 20-35). This approach minimizes theinfluence of other potential sources of lead exposure (confounders, i.e., other sources of exposurethat may change during the evaluation period), which might mask a drop in blood lead level as aresult of leaded gasoline elimination. By examining differences in blood lead levels of these twocohorts, it may be easier to evaluate the impact of reduced use of leaded gasoline and consequentimpact in th population at large.

20
Table 4Advantages and Disadvantages of Monitoring Options for Phase-out of Lead in Gasoline
Biological Monitoring
Advantages Disadvantages
OccupationalSurvey
- Occupationally exposed individuals are directly exposed on afrequent basis
- Choice of worker populations is available- Previously carried out in LAC region- Can compare to a control group- Minimizes confounding from other lead sources
- Requires cooperation of individuals and willingness ofemployers to participate
- Workers may potentially be exposed to other sourcesof lead
- May require new interagency agreements- Confidentiality of results would have to be addressed to
avoid discrimination against participants
Child Survey - Previously carried out in LAC region with good participationfrom parents and school authorities
- Can identify children with potentially high lead levels andassist with efforts to reduce elevated levels
- Sampling selected schools in an urban environment is moreefficient and provides better risk factor data
- School environment can be used for informationdissemination on health effects and prevention measures
- Important population for targeting public policymaking
- Requires cooperation of school and governmentauthorities
- Requires parental authorization and education aboutthe effects of lead on health and potential counselingfollow-up
- May be difficult to obtain blood samples from youngchildren
- Children surveyed may potentially be exposed to othersources of lead
Umbilical CordBlood Survey
- Women easily accessible in hospitals and willing to consentto sample taking
- The system can be run by hospital personnel- Processing of specimens in a timely fashion will permit
opportunity for counseling- Non-invasive procedure facilitates data collection- Information on sources of exposure and prevention
measures could be provided- Survey was previously conducted in LAC region
- Concerns about mobilization of lead from bone duringpregnancy (confounding; masking effects)
- Cord blood may not necessarily reflect current bloodexposure
- Survey administration requires additional expenses andtime commitment from hospital staff
- Population is representative only of females giving birthin hospitals and clinics
- It may be difficult to establish direct relationship of leadlevels with exposure levels
- Lifestyle changes during the last month of pregnancymay decrease environmental exposure
Environmental Monitoring

21
Advantages Disadvantages
Survey of LeadedGasoline Use
- Data collectible through government ministries and gasolinevendors
- Inexpensive to do- Can be enhanced with addition of country-specific data on
lead particulates in air
- Proxy or �indirect� measurement of lead in environment- Not informative about impact on health
Ambient AirSampling
- Direct measurement of lead particulates- Can use high or low-volume air samplers
- May be difficult to collect data near sentinel populationsor high traffic areas
- Requires more infrastructure and resources

22
A 1991 study in Quito, Ecuador, (Bossano and Oviedo 1996; Oviedo et al. 1996) found that acohort of female street vendors in their fertile years (N = 76, mean age 15.6 years, mean dailyexposure time at work 9.7 hours), who were highly exposed to the combustion products of leadedgasoline, among other airborne contaminants, had a 70% higher mean blood lead level than acomparable group of pregnant housewives (N = 83; working in the home) from three different partsof the capital city (i.e., a cross-section of housewives). The respective blood lead levels were 30.3cg/dL vs. 18.4 cg/dL in the two samples. This study suggests that such highly exposed workerpopulations are useful sentinels for leaded gasoline exposure.
There are potential challenges associated with targeting workers occupationally exposed to leadedgasoline. For example, the effort requires obtaining cooperation from employers as well asemployees (this is a similar issue to sampling schoolchildren or women in hospital for birth). Asurvey or sampling of occupational lead exposure could result in workers� requesting hazard pay oremployers� being concerned about inspections from government agencies and liability. Futhermore,many of these groups are not formally employed and have high job mobility making long termfollow-up difficult.
Option: Periodic survey of children
This approach monitors children aged six months to six years attending day care or school. Previousblood lead level studies of school-age children have been successfully carried out in the LAC regionwith good participation from parents and schools, e.g., in Mexico by Olaiz et al. (1996a) and inEcuador by Bossano and Oviedo (1996) and Oviedo et al. (1996). Information collected on school-age children monitors them further along the continuum of their development in contrast toyounger children. The collection of blood lead samples and risk factor data via questionnaires ismore efficient when done at several selected schools than at clinics dispersed throughout the citywhere children may be taken sporadically for well-care visits or immunizations.
The disadvantages of this approach are related to administrative and medical concerns. Samplingschool-age children at school requires cooperation from school systems, principals, and stateauthorities. Parental authorization must also be obtained, which necessitates careful education aboutthe rationale for the monitoring effort, awareness of the potential health effects of children�sexposure to lead, and, if warranted, potential follow-up actions for children with high blood leadlevels. It also may be more difficult to obtain blood specimens from younger children (1-3 years);however, phlebotomists appropriately trained in the collection of specimens from younger childrencan minimize the duration of discomfort (Schlenker et al. 1994).
Option: Periodic survey of umbilical cord blood lead levels from women at time of delivery
This approach relies on the collection of monitoring information from a sample of womendelivering babies at selected city hospitals. From a biological perspective, umbilical cord blood leadrepresents exposure to lead in a special cohort of the adult population (pregnant women). (Silbergeld1991, 1996.)Women who go to a hospital at the time of their delivery can be accessible for blood leadmonitoring, as has been shown in studies in Mexico City (Hernández-Avila et al. 1996), butinvestigators must be aware of confounding factors such as the effects of socioeconomic status onblood lead level (Farias et al. 1996).

23
A hospital-based monitoring system is run by professional hospital personnel, for whom training inspecimen collection techniques is made easier by virtue of their education and professionalrelationship to women at the time of delivery. Appropriately selected hospital staff can also serve themonitoring effort by disseminating information on the health effects of lead to mothers. If bloodlead levels are processed regularly, results can be made available in a timely fashion and counselingcan be provided for the mothers.
The use of umbilical cord lead as an indicator of women�s exposure to lead in gasoline iscomplicated by concerns about mobilization of lead from bone during pregnancy. The issue hasbeen raised by some researchers that cord blood, at the time of delivery, is representative of long-term storage of lead in bone released back into tissues and blood; thus cord blood lead may notnecessarily reflect current lead exposure (Silbergeld 1991, 1996). Researchers are currently debatingthe percentage of the contribution of mobilized (stored) lead to a woman�s cord blood lead level atthe time of delivery and confounding factors associated with mobilization of stored lead (e.g., dietarycalcium, reproductive history, coffee consumption, and use of indigenous lead-glazed pottery)(Rothenberg et al. 1994; Gulson et al. 1995; Hernández-Avila et al. 1996). Reports of the percentageof the contribution of stored lead to cord blood lead vary (Hernández-Avila et al. 1996; Rothenberget al. 1994; Silbergeld 1991) and are important for understanding the chronic nature of long-termlead exposure and accumulated body burdens of lead. However, studies of cord blood lead levelmeasurements conducted in the United States, Australia, and Mexico have shown declining trends incord blood lead levels consistent with declines in blood lead levels measured in the generalpopulation (McMichael et al. 1986, 1994; Hu et al. 1996a; Hernández-Avila et al. 1997; Pirkle et al.1994). This international experience bodes well for detecting similar declines in cord blood levels ofwomen throughout the LAC region. Although lead is mobilized from bone to maternal blood andconsequently to umbilical cord blood, most studies using umbilical cord blood lead levels as anoutcome measure have documented important declines in this biomarker in response to reductionsin the lead content of gasoline (see Rabinowitz and Needleman 1983).
3.3 Environmental Monitoring
The primary lead exposure route from gasoline is via airborne particulates which are either inhaled,deposited on foods and ingested (e.g., on leafy vegetables or fresh fruits that are eaten unwashed), oringested as dust on the fingers of toddlers and young children. Urban air monitoring information isavailable for a few LAC countries, which sometimes includes the lead fraction of particulates. Forexample, as a part of the WHO GEMS-AIR program, Venezuela collected data on lead particulateconcentrations in ambient air from four long-term sampling stations in Caracas and in two othercities in 1992-1993 (Rondon 1996). Data collection could be done on a periodic basis during thecourse of the multi-year lead monitoring program. Data on air lead concentrations would providevaluable supporting evidence for the expected relationship between reduced lead in gasoline andreduced lead levels in the highly exposed populations.

24
Option: Ambient air sampling
The specific methods recommended for ambient air sampling for lead particulates are found inSection 7.1; they include both high-volume and low-volume samplers. Generally, environmentalsampling of media such as ambient air should be conducted in environments with a high probabilityof substantial lead exposure (Howson et al., 1996). With respect to leaded gasoline, this refers tohigh traffic areas where workers are occupationally exposed or where residences and schools arelocated. If these locations are not practical, standard ambient air monitoring points (e.g., use ofexisting permanent air monitoring stations) would be acceptable. A recent survey conducted by thePan American Health Organization was summarized in Lacasaña et al. 1996. The purpose of thesurvey was to collect information on the magnitude of lead pollution in the Caribbean. Informationwas collected on production, export, and import of lead (tons/year), sources of airborne leademissions, information on studies determining blood lead levels, and rules and guidelines for controlof lead pollution. Several findings of the survey are noteworthy. First, the overall response rate was57% (16/28 countries responded); in Latin America the response rate was 72% (13/18), while in theCaribbean 30% of the countries responded. Second, lead content in gasoline varies from country tocountry (e.g., 1.31 g/L in Suriname to 0.05 g/L in Mexico). Third, only 36% of the countries in theLAC region have introduced unleaded gasoline into the market.
Respondents to the survey indicated that air lead levels have not been monitored on a continuousbasis in most countries of the region with the exception of Brazil and Mexico. In 1996 theAssociation of Latin American Oil Companies (ARPEL) undertook a survey to characterize airpollution in LAC countries. The focus of the survey was to collect information on lead aerosolfrom combustion of leaded gasoline, respirable particulate matter from diesel engines andmotorcycles, carbon monoxide in gasoline exhaust, and information on several other air pollutants. Information made available on the measurement of lead in soil, air, and blood was presented at theSeptember 1996 meeting of the National Focal Points in Santiago, Chile. A summary of availablecountry-specific information is provided in Table 5.
Option: Survey of leaded gasoline use
If the concentrations of lead in gasoline are known and the volumes of leaded gasoline sold in a cityare known, these data can be used to make a rough estimate of the changes in the amount of leadreleased into the environment (ambient air) over time in that city. Changes in the amount of leadadded to gasoline over a given period of time are often generated by the Ministry of Energy and/orthe producers and wholesale vendors of gasoline in a country. These data can be used by theMinistry of Energy, Environment, or Health to estimate changes in lead exposure.

25
Table 5Country-Specific Measurements of Lead in Soil, Air and Blood
Lead Measurement in Soil in Urban Areas Lead Measurement in Air in Urban Areas Lead Measurement in Blood
Country Yes/No Values Yes/No Values Yes/No Values
Anguilla No No No
Argentina No Yes Conducted by Greenpeace (No data provided) Yes Conducted by Greenpeace (No data provided)
Bahamas
Barbados No Yes No yet completed, requires more air monitoring equipment No
Belize
Bermuda No Yes Impact of leaded to unleaded gasoline conversion on Bermuda
Bolivia No No Yes Study of YPFB refinery worders over the last five years. 9.6% of workers analyzed hadblood lead levels of 30 cg/dL or higher.
Brazil N/R N/R N/R
Chile No No No
Colombia No No No
Costa Rica No Yes In some high density areas lead in air has been measured at 0.63 cg/m3 Yes Study of average population showed 17.09 cg/dL on ave. For workers in a battery plantthe average was 66 cg/dL. 57% of children had levels above 10 cg/dL.
Cuba
Dominica
Dominican Republic No No No
Ecuador
El Salvador N/R N/R N/R
Grand Cayman
Grenada
Guadeloupe
Guatemala No
Haiti No Partial A field study has been set up but due to a lack of money and manpower, ithas not been executed.
No
Honduras No Yes Very high lead in air levels were found in metropolitan areas. Yes In 1994-1995, school children were checked and 67% were below 3.2 cg/dL, 19% hadlevels as high as 4.9 cg/dL and less than 1% were as high as 5.3 cg/dL.
Jamaica Yes Study currently underway Yes Study currently underway. Yes Study currently underway.
Martinique, FWI
Mexico Yes Published in Enviro. Sci. Tech. Vol. 25,1702 (1992)
Yes Mexican bibliography about lead and health. Yes Report put out by World Health Organization.
Netherlands Antilles * No No No
Nicaragua N/R N/R N/R
Panama
Paraguay No No Yes OCTEL conducts blood test on refinery personnel.
Peru No Yes Study currently being developed. No
St. Lucia No No No
St. Kitts - Nevis
Suriname No No No
Trinidad & Tobago Yes High level of lead found in urban roadsidedust
Yes Preliminary study confirmed emission of organic lead in atmosphere wasfrom vehicle emissions.
Yes High lead levels in blood for occupationally exposed persons and low levels for averagerural populations. Average urban lead in blood levels were higher than average suburbanand rural levels.
Turks & Caicos

26
Uruguay No No No
Venezuela N/R Yes Lead in air study done in 8 major cities with high leaded gasolineconsumption.
Yes Study determined that in cities which are in compliance with lead in air reg�s, someindividuals have a slight excess of lead in blood related to health standards of 15 cg/dL.

27
In a recent survey of LAC countries conducted by ALCONSULT International Ltd. (1996), datafrom 11 of 21 LAC countries were reported on lead in air at the time lead was added to gasoline andafter lead was removed. Collection of additional country-specific air lead data would enhance thismonitoring option by including baseline and prospective data on the impact of the phase-out of leadin gasoline.
3.4 Regional Resources for Assessing Lead Exposure
Several institutions and laboratories in the LAC region are available to assist country ministries witheither field sampling or data analyses for environmental and biological lead specimens. The PanAmerican Health Organization (PAHO), based in Washington, D.C., is the primary internationalagency in the LAC region to address health issues posed by lead inthe ambient environment and blood lead concentrations in humans. Several other institutions thatcan help in various aspects of lead monitoring and analysis are listed in Table 6.
For a country with no available blood lead analytical laboratory, environmental sampling laboratory,or epidemiological capacity, several regional and national institutions can assist with monitoringefforts. Readers are encouraged to contact those organizations.
Numerous laboratories in the LAC region are capable of blood lead analysis. To ensure standardizedblood specimen analyses and to build upon currently existing laboratory capacity in the region,analysis should be conducted at a laboratory currently involved in the external QA/QC (proficiencytesting) program of the PAHO/FIOCRUZ network (see Table 6 for details). A list of laboratoriescapable of blood lead analysis in that network is found in Appendix B.
Laboratories in the LAC region can also participate in various external QA/QC (proficiency testing)in North America (e.g., the CDC PT and Blood Lead Laboratory Reference System [BLLRS]programs) at little to no cost (see Table 5 for details). A list of LAC and North Americanlaboratories currently involved in the U.S. CDC PT program for blood lead is provided in AppendixC. The blood lead laboratory analytical methods used by the U.S. CDC are found in CDC (1995).
Countries using the ambient air sampling option are encouraged to register and participate in theEnvironmental Lead Proficiency Analytical Testing (ELPAT) and Proficiency Analytical Testing(PAT) programs offered jointly by the CDC/NIOSH/ American Industrial Hygiene Association, oran equivalent program. There is little or no cost to participate in the PAT and ELPAT programs; seeTable 6 for details.
3.5 Issues for Consideration
An important aspect in carrying out these monitoring activities is that the options be implemented inthe context of existing programs and with current facilities in the LAC region. Monitoring should beincorporated into an existing health or environmental institution�s activities or within the context ofa university-based research group. Theinstitutional locus of monitoring should be flexible, accounting for differing capabilities fromcountry to country.
The intent behind the development of these monitoring options is to collect information as simplyas possible in order to examine the impact of phasing out lead in gasoline in the LAC region, those

28
undertaking blood lead monitoring programs need to be prepared for the discovery of importantsources of lead exposure other than leaded gasoline. As demonstrated by the case study in Peru,blood lead monitoring programs often reveal other sources of lead exposure. If these other sourcesof exposure are significant, from a public health point of view, follow up with study participants willbe required and, potentially, interventions to reduce these other sources of exposure will be needed.
Table 6Regional Resources Available for Environmental and Blood Lead Monitoring
Institute Services Available Person to Contact Point of Contact
CESTEH/ENSP/FIOCRUZ, FIOCRUZLaboratory, FundacãoOswaldo Cruz, EscolaNacional de SaúdePública, Ministerio daSaúde, Rio de Janeiro,Brasil
Assistance withQA/QC for blood leadanalysis, at FIOCRUZ(and also available inother memberlaboratories in thisPAHO network)
� guidelines� manuals� round robin QAexercise� intercalibration
PAHO/CESTEHNetwork Coordinator:Dr. Josino C. Moreira
Address: Rua Leopoldo Bulhões,1480 Manguinhos Cx. Postal 926Cep 21.04, Rio de Janiero, RJ,Brasil
Telephone: (55 21) 290-0484 or(55 21) 598-3789, ramal 2198Fax: (55 21) 280-8194 or(55 21) 270-3219Internet: [email protected]
Centro deInvestigaciones enSalud Poblacionel(CISP), InstitutoNacional de SaludPublica, Cuernavaca,Morelos, Mexico
Assistance inepidemiological dataanalysis
Dr. MauricioHernández-Avila,Director of CISP
Av. Universidad 655, Col. Sta.Maria Ahuacatitlan, 62508Cuernavaca, Morelos, Mexico
Telephone: (73) 17 53 91Fax: (73) 11 11 48Internet: [email protected]
Centro deInvestigacionesBRIMEX-II
Assistance inbiological &environmentalmonitoring
Dr. EduardoPalazuelos
The American British CowdrayMedical CenterSur No 166Mexico DF, 01120
Telephone: 525-230-8268Fax: 525-230-8269
BIREME/PAHO: LatinAmerican andCaribbean Center onHealth SciencesInformation, São Paulo,Brasil
PAHO Center forBibliographicInformation and PAHOdatabse
Dr. Abel LaertePacker, Systems andData Processing
Rua Botucatu, 862, VilaClementino CEP 04023-901, SãoPaulo SP, Brasil
Telephone: (55 11) 576-9800Fax: (55 11) 571-1919 or 575-8868Internet:[email protected]
CEPIS/PAHO: CentroPanamericano deIngenieria Sanitaria yCiencias del Ambiente,Lima, Peru, Division ofHealth andEnvironment, PAHO
Assistance withenvironmental leadsampling;environmental leadlaboratory analysis
Ing. Sergio A.Caporali, Director ofCEPIS
Los Pinos 259, Urb. Camacho,Lima 12, Peru; Casilla Postal4337, Lima 100, Peru
Telephone: (51 14) 371077Fax: (51 14) 378289Internet: [email protected]
GEMS/AIR Program Provides country-specific and regional
Dr. Dietrich Schwela Urban Environmental Health,WHO, 20 Avenue Appia, CH-1211

29
Institute Services Available Person to Contact Point of Contactdata on airparticulates (includinglead, wheremeasured); alsoassistance indevelopment of aGEMS/AIR monitoringprogram in a country
Geneva 27, Switzerland
Telephone: (41 22) 791-4261Fax: (41 22) 791-4127Internet: [email protected]
U.S. CDC/NIOSH/American IndustrialHygiene Association
PAT and ELPATPrograms: ProvideProficiency AnalyticalTesting forenvironmental lead atno cost.
Fred Grunder, PATCoordinator (airparticulates on filters)
Carl Bell, ELPATCoordinator (otherenvironmental leadmedia)
AIHA, 2700 Prosperity Avenue,Fairfax, Virginia 22031, USA
Telephone: (703) 849-8888Fax: (703) 207-3561Internet: [email protected]
U.S. CDC,Environmental HealthDivision, EnvironmentalHealth Laboratory,Atlanta, Georgia
Provides Blood LeadLaboratory ReferenceSystem (BLRRS) andProficiency Testing(PT) programs,laboratory technicalassistance & bloodlead referencematerials, withoutcharge.
Dr. Daniel C. PascalorDr. Robert L. Jones,Supervisory ResearchChemists
U.S. CDC, Environmental HealthDivision, Environmental HealthLaboratoryAttention: BLLRS and PTCoordinators,Mail Stop F-18,4770 Buford Highway,Atlanta, Georgia 30341-3724
Telephone: (770) 488-7985 or(770) 488-7991Fax: (770) 488-4097Internet: [email protected]@cehehl1.em.cdc. gov
U.S. CDC, FieldEpidemiology TrainingPrograms (FETP),Atlanta, Georgia
Provides technicalassistance inepidemiologicalanalysis of data.
(Local FETP officesexist in severalcountries in LACregion.)
Director, Division ofField Epidemiology,International Branch
U.S. CDC,Attention: Director, Division ofField Epidemiology, InternationalBranch
1600 Clifton Rd, NE,MS-C-08, Room 5104,Atlanta, Georgia 30333
Telephone: (770) 639-2231Fax: (404) 639-2230E-mail: [email protected]
Field Epidemiology Training Programs in the LAC Region
COLOMBIAServicio en deEpidemiologia Aplicada(Applied EpidemiologyService)
Fernando de la Hoz,MD, Director
Instituto Nacional de Salud,Avenida Eldorado y Carrera 50,Santafe de Bogotá, Colombia
Telephone: 57-1-2220577Fax: 57-1-2223294,57-1-2220194, 57-1-2223055,57-1-3151890E-mail:[email protected]
CAREC Director, CaribbeanEpi Center, Trinidad
1618 Jamaica Blvd., Port of Spain,Trinidad, West Indies

30
Institute Services Available Person to Contact Point of ContactTelephone: 809-622-4261Fax: 809-622-2792E-mail: [email protected]
BOLIVIA Antonio Gomez,Director LucioLantaron, Coordinator,Community and ChildHealth/DDM
Calle Giotia, Casilia No 14384, LaPaz, Bolivia
Telephone: 591-2-37-89-39,591-2-37-63-31Fax: 591-2-39-15-03E-mail: [email protected]
MEXICOEpidemiologia Aplicada(PREA)
Dr. Rodolfo MendezVargas, Director ofEpidemiologicSurveillance of Non-communicableDiseasesDra. Evangelina (Eva)Gonzales, DirectorEjecutivaDra. ElizabethAlvarado, Coordinator,PREaPaplo Kuri, Director,DGE
Dirección General deEpidemiologiaFCO De P. Miranda 177, 3er Piso,Col. Lomas de Plateros,Delegación Alvaro Obregon DF01480 Mexico
Telephone:525-651-6970/6288 (Mendez)525-593-3661 (Gonzales)525-588-7149 (Avilla)525-593-0824 (Kuri)Fax:525-651-8700 (Mendez)525-593-3661 (Gonzales)E-mail:[email protected]@epi.org.mx
PERUPrograma deEspecialización enEpidemiologia deCampo (PREC)
Sr. Dr. Mario ChuyChiu, MSPAugusto LopezRodrigues, MD, PhD
Oficina General de Epidemiologia,Minsterio de Salud, Jr CamiloCarrilo 402, Jesus Maria, Lima, 11-Peru
Augusto Lopez Rodriguez:Eduardo Bello 375, Urb SantaCatalina, Lima 13-Peru
Telephone: 51-1-433-5859,51-1-433-5428, 51-1-462-4377(home, Dr. Lopez)Fax: 51-1-4336140,51-14-330081E-mail: [email protected]

PART B: STUDY DESIGN AND PROTOCOLS

33
STUDY DESIGN FOR SURVEY OF
OCCUPATIONALLY EXPOSED WORKERS
4.1 Recruitment of the Study Population
Population groups that are highly exposed to lead from gasoline should experience substantialdeclines in blood lead levels when lead is reduced or removed from gasoline. Using this rationale,groups receiving high occupational exposure are appropriate for monitoring the impact of thephase-out of lead in gasoline. Because they have high exposure to leaded gasoline, these groups arealso likely to experience the largest changes, therefore maximizing the statistical power of theevaluation. Evidence can be strengthened by comparing changes observed in these groups to thosein nonexposed individuals (control group) from a similar socioeconomic level and with acomparable age and gender composition.
The first step is to identify groups that are occupationally exposed to automobile emissions orgasoline products (for example, traffic police, bus or taxi drivers, street vendors, shoe shiners, orgasoline station pump attendants). Initial interviews with employers or union leaders may help toassess the feasibility of the study and will facilitate field work and study participation. If possible,subjects should be selected at random from payroll, membership, or other lists. Because subjects willbe followed for 5 to 10 years, it is important to convey this information up front to ensure that thestudy groups contain highly motivated individuals who are more likely to participate fully in thestudy. Similarly, the study population should include permanent rather than temporary employees asthe latter are more likely to change jobs, making them ineligible to continue the study. Also, follow-up is more difficult with temporary employees, which may compromise the validity of the study.
Selecting the control group will be easier once the exposed group is selected and sampled. Forexample, if the occupational group includes traffic police aged 20 to 35, the nonexposed groupshould also include men and women from a similar socioeconomic level, aged 20 to 35 years whoare not traffic police. In addition, the control group should not have been exposed to significantambient atmospheric pollution or to lead from other occupational sources (e.g., radiator repairshops, battery smelting, and print shops). The age-gender distribution of groups can be madecomparable by using frequency or pair matching when the control group is recruited.
4.2 Sample Size and Follow-Up
The primary hypothesis to be tested is that individual blood lead levels will decrease significantlyover time during the phase-out of lead from gasoline. However, because policymakers and publichealth officials require feedback at shorter time intervals, we have proposed that sample sizes needto be adequate to detect estimated annual differences in blood lead levels. To estimate the requiredsample size, we used data from 179 subjects who participated in a blood lead survey in Madras, India(Potula and Hu 1996). In this study, 88 traffic police had a mean (SD) blood lead level of 11.2 cg/g

34
(8.8 cg/g). The estimated sample sizes to detect subsequent declines in blood lead levels rangedfrom 70 subjects to detect a decline of 3.0 cg/dL to 860 to detect a decline of 1.0 cg/dL (Table 7).The estimated difference to be detected between the first and second evaluations will depend on themagnitude of the decrease of the lead content in gasoline. For example, in England, significantdifferences were detected among police between 1985 and 1986 after the lead content of gasolinedecreased from 0.4 to 0.15 g/L (Quinn and Delves 1989). The loss of participants due to individualsmigrating or refusing to participate over time is difficult to foresee, but it is always safe to increasesample sizes by 20% or more, if budgetary conditions allow, to prevent bias or loss of statisticalpower originating from this problem. The required sample size will depend on the amount ofvariation in blood lead levels in the study population, local conditions and other characteristics ofthe population to be studied. Small pilot studies should be conducted to obtain information neededto estimate appropriate sample size requirements and to test field procedures.
Once the programmatic actions that are needed to phase-out lead from gasoline are begun, selectedsubjects should be reexamined annually as recommended by Quinn and Delves (1987) for the UKBlood Lead Monitoring Program. In some LAC countries serial blood lead concentrations havebeen found to vary significantly from season to season (Farias et al. 1997). To avoid any seasonaldistortion of results, it is important to conduct evaluations as close as possible to the same time ofyear as when the baseline evaluation took place.
Table 7Estimated Sample Sizes Needed to Detect Declines in Blood Lead Levels
Expected Decline inBlood Lead Levels
(ccccg/dL)Correlation between
MeasurementsSD of theDifference
EstimatedSample Size
1.0 0.30 10.4 8601.0 0.50 8.8 6101.5 0.30 10.4 3801.5 0.50 8.8 2702.0 0.30 10.4 2202.0 0.50 8.8 1603.0 0.30 10.4 1003.0 0.50 8.8 70
Calculations assume a mean (SD) blood lead level at baseline of 11.2 cg/dL (8.8) with a statisticalpower of 80% and a 95% confidence level.

35
4.3 Questionnaire Information
Brief questionnaires should be used to assess the following:
`Basic demographics and socioeconomic characteristics of the study population`Information regarding exposure to other sources of lead (for example, consumption of cannedfoods, cigarette smoking, wine consumption, use of lead-glazed ceramics, home remedies that maybe contaminated with lead, hobbies that may involve use of lead, area of residency, exposure to roadtraffic)`Information to assess exposure at the workplace (for example, number of working hours, jobcategory, job changes in recent months, hygiene practices at work, cleaning of work clothes, eatingand smoking in the workplace)`Information to follow up subjects and to track and locate those lost to follow-up.
In addition, detailed information including home address and telephone numbers at work and home(if available) should be obtained. Information regarding friends or family also should be collected tohelp locate subjects in case of loss to follow-up.
Because information may vary over time, results must take into account changes in any variableassociated with lead exposure. For example, if hygiene practices improve at the workplace during thestudy period, it may be difficult to distinguish the effects of reducing gasoline lead content fromthose obtained by improving hygiene practices. However, if information regarding changes in othersources of lead is available, this may be used to adjust results and obtain better estimates regardingthe effect of gasoline lead content reductions. Appendix D provides examples of the types ofquestions to include for occupationally exposed workers.
4.4 Data Analysis
The questionnaire information and blood lead results for each worker should be entered into adatabase to generate descriptive statistics. Database entry should include range and value checking inorder to control for digitization errors. Each subject should have a unique identification number.This number should be used to add new information collected for each subject during follow-upevaluations. For all analyses, lead levels should be transformed logarithmically to reduce asymmetry.The conversion of mean logs back to raw units provides a geometric mean level, which will be theprimary summary statistic.
Data analysis of baseline information for both the study group and the control group shouldevaluate the association between independent risk factors and blood lead levels (e.g., cigarettesmoking, diet, hobbies, location of worker�s home in relation to traffic or industrial sources of lead,hygiene habits at work, number of hours worked). Univariate statistics should be calculated andevaluated against blood lead level measurements. Tests using t-test or analysis of variance should beperformed. In addition, multivariate models could be constructed to include all potential predictors.For example, risk factors identified in the univariate analysis as important could be entered in astepwise regression analysis to to analyze simultaneously the effect of different risk factors, and todetermine those that contribute most significantly to workers� blood lead levels. The odds ratios orrelative risks of having a high blood lead level (higher than 25 µg/dL) could also be estimatedaccording to different variables. Multivariate modeling could be conducted by using logisticregression models.

36
To compare the first and second blood lead measurements, various approaches could be used.Performing a paired t-test between the first and second measurements is one example. Whilerelatively simple, however, this test will ignore important predictors of blood lead levels that mayhave changed over time and that could confound the observed differences in blood lead levels. It isrecommended that multivariate adjustment be done using statistical methods for longitudinal data.
4.5 Blood Sampling and Laboratory Analysis
The recommended procedure for blood collection in these groups is venipuncture rather than fingerstick. Given that occupationally exposed populations have a high level of contact withenvironmental lead, skin surface may be highly contaminated with lead particles that are difficult toeliminate by simple handwashing. Because finger stick procedures are highly sensitive tocontamination by skin lead particles, that technique is not recommended for this group. Thedifficulty of controlling lead contamination of the skin prick site can lead to a large number ofinvalid samples.
Either graphite furnace atomic absorption spectophotometry (GFAAS) or anodic strippingvoltametry (ASV) should be used to determine blood lead levels, whenever these measurementtechniques are available and working with the appropriate quality controls. However, if theseprocedures are not readily accessible, the new ASV-based portable technology (LeadCareTM portableinstruments) can be used. These battery-powered instruments, the size of a hand-held calculator, aresimple to use, require neither manual calibration nor refrigeration, can measure blood samplesobtained either by venipuncture or finger stick, and give blood lead results within minutes, providinga good opportunity to conduct on-site counseling.
Regardless of the method used to determine blood lead levels, maintenance of accurate blood leadmeasurements over the study period is key to obtaining valid results. To avoid or minimizelaboratory error in lead measurements over time, it is important to develop and maintain a programof external quality assurance/quality control (proficiency testing). In such a program, externalreference materials are inserted into the sample stream as true �blind� quality control samples.Several institutions offer this type of standardization program (see Table 6); the authors of thisreport recommend that laboratories join the program offered by the Environmental Health Divisionof the U.S. Centers for Disease Control and Prevention (CDC). Under that program, bovine bloodsamples are supplied free of charge by the Blood Lead Laboratory Reference System (BLLRS) tolaboratories doing blood lead analysis. These samples help laboratories standardize their blood leadmeasurements so that they can monitor and maintain consistent and accurate measurements overtime. Difficulties in implementing this program often include country-specific regulations regardingthe importation of bovine-based materials. The authors recommend that all regulations be verifiedand permits obtained before the study starts.
4.6 Counseling for High Blood Lead Levels
Study participants should be counseled regarding their blood lead levels and educated about how tokeep them low. It is important to know that occupational lead standards vary considerable fromcountry to country. Currently, the U.S. Occupational Safety and Health Administration (OSHA)protects workers by removing them from the workplace when blood lead levels exceed 50 cg/dL.In addition, the removed worker cannot be returned to a job with high levels of exposure until their

37
blood lead level is < 40 cg/dL. For this study, it is recommended that all workers whose blood leadlevels are above 25 cg/dL receive special counseling to provide information about how to reduceblood lead levels. Workers with levels above 40 cg/dL should be retested for confirmation and, ifpositive, should be investigated for additional sources of lead exposure and referred for medicalevaluation. Subjects who receive special counseling or treatment should be excluded or flagged insubsequent statistical analysis.
4.7 Reporting Results and Information Dissemination
Following the annual analysis of the data, a report should be prepared and sent to all ministriesparticipating in the monitoring program. The report should include mean blood lead levels as well asthe percentage of participants who are above certain levels deemed critical to public health. Actionlevels for occupationally exposed individuals could be set at 25 cg/dL (additional counseling) and40 cg/dL (consider changes in work place procedures to reduce exposure or removal fromworkplace. Creating a table that compares observed blood lead levels with those reported in othercountries may be of interest and will help readers to better understand the results. If the resultsuncover any additional risk factors for high blood lead levels, these should be reported as well.Because this report will probably reach a wide multidisciplinary audience, it is important not to usecomplex medical terminology. Preparing press releases on the results should also be considered.

39
STUDY DESIGN FOR SURVEY OF
SCHOOL-AGE CHILDREN
5.1 Recruitment of the Study Population
One of the primary goals of reducing lead in gasoline is to prevent children's exposure to lead.Monitoring blood lead changes in cross-sectional samples of young children will provide directinformation regarding health outcomes in this target population. In addition, because childhood leadpoisoning may result from various sources, studying this group could provide information aboutother important risk factors for elevated blood lead. This may help in identifying sources of lead inaddition to gasoline that could be targeted in a more comprehensive program to control leadexposure.
Recruitment of study participants should be the result of a multistage selection procedure. Forexample, in a first step, three to five districts with higher exposure to vehicular traffic could beselected at random. A list of schools from the selected districts should be obtained; school locationshould be plotted on a map to identify those situated in areas of high traffic, along highways, and incenter-city neighborhoods. From this list, 20 schools should be selected at random.
Once schools are selected, proper contacts should be initiated to obtain authorization for the studyto be conducted. Contacts should include authorities from the governmental agency responsible forschool coordination and local school authorities. Once school participation has been granted,meetings to explain details of the study should be scheduled with teachers and parents.
The authors recommend the study of school-age children because that population is accessible andeasily identified through the school system. Furthermore, the fact that children are grouped inschools and that schools can be selected according to exposure to environmental lead (i.e., at siteswithin high traffic districts) makes the study of this population cost effective. The studied samplesare also comparable over time. Children attending the same school will be comparable in terms ofsocioeconomic characteristics and other factors that may be related to lead exposure.
Younger children (6 months to 2 years of age) who are at a higher risk of exposure and of sufferingthe neurotoxic effects of lead may also be studied. Selection procedures to study this age group canbe based in random sampling or selection within health clinics or hospitals. See for example thecase study in Peru (described in Section 2.5). The final choice of the study population will dependon local facilities as well as the available budget.

40
5.2 Sample Size and Follow-Up
The primary hypothesis to be tested is that mean blood lead levels of successive cross-sectionalsamples of children of similar age, gender, and socioeconomic background will decrease significantlyover time as a result of the phase-out of lead from gasoline. However, because policymakers andpublic health officials may request feedback at shorter time intervals, the authors of this report haveestimated sample sizes needed to detect estimated annual differences in blood lead levels. Toestimate the required sample size, data from various studies have been used. One study was the U.S.National Health and Nutrition Examination Survey (Pirkle et al. 1994). Based on that study, aconservative prediction would be a reduction of about 1 cg/dL per year in the mean blood leadlevel. Other studies (Quinn and Delves 1987; Rothenberg et al. 1998) have documented largerdeclines: 1.5 cg/dL in the United Kingdom and 2.2 cg/dL in Mexico City, respectively. Accordingto published studies, sample sizes need to detect differences in a range of 1 to 2 cg/dL werecalculated. However, the expected value for the difference to be detected between the first andsecond cross-sectional samples will depend on how significantly lead in gasoline is decreased. Thestandard deviations (SD) of cross-sectional surveys in the literature reviewed vary widely. Samplesizes have been estimated for a low SD of 4.0 and a high SD of 8.0. Sample sizes range from 1,000to 70 children per group depending on the different assumptions used in the sample size calculations(Table 8). The required sample size will depend on the amount of variation in blood lead levels inthe study population, local conditions and other characteristics of the population to be studied.Small pilot studies should be conducted to obtain the information needed to estimate appropriatesample size requirements and to test field procedures.
Table 8Estimated Sample Sizes Needed to Detect Differences
in Blood Lead Levels between Two Populations
Expected Decline inBlood Lead Levels
(ccccg/dL)
Estimated StandardDeviation of Blood
Lead LevelsEstimated Sample
Size per Group1.0 8.0 10001.0 4.0 2501.5 8.0 4501.5 4.0 1202.0 8.0 2502.0 4.0 70
Calculations were made assuming varying SD, with a statistical power of 80%and a 95% confidence level.
Once the programmatic actions to phase-out lead from gasoline are begun, cross-sectional samplesshould be studied annually, as suggested by Quinn and Delves (1987) for the UK Blood LeadMonitoring Program. As mentioned, seasonal variations may confound results; therefore, it isimportant to conduct studies as close as possible to the same time of year when the first populationwas studied.

41
5.3 Questionnaire Information
Information relevant to the risk of lead exposure should be collected. The survey questionnaireshould include age, gender, weight and height, and if possible some information regarding schoolperformance of the child; residential location; industrial or commercial activities located near thechild�s residence that release lead into the air (e.g., gasoline stations, paint manufacturing industries,heavy metal smelters, battery manufacturers) and vehicular traffic in the street where his/herhousehold is located; the child�s diet and nutritional status; the use of lead-paint glazed pottery forfood storage and cooking in the home; the parent�s education, occupation, and hobbies; activities orbehaviors of the child which may cause exposure to lead (e.g., chewing lead-paint pencils, playing indirt). Information on the household use of lead-based paint may vary by country and region butshould also be considered in assessing potential sources of lead exposure.
A standardized questionnaire should be used to gather this core set of demographic, environmental,and behavioral data. This information will be useful for checking high outliers in the blood lead data.Unusually high lead concentrations will likely be associated with other risk factors such as potteryuse or secondary occupational exposure. These data could also be useful in multi-variate analyses ofthe determinants of elevated blood lead levels, especially with data pooled from several schools overseveral years. The collection and use of questionnaire data requires careful training of interviewers,validation of questionnaires, and other efforts to assure data quality. Additions to, but not deletionsfrom, the core set of questions can be made to adapt the survey to specific risk factors that may varyfrom country to country. Appendix D provides examples of the types of questions to include forchildren.
5.4 Data Analysis
The questionnaire information and blood lead results for each participant should be entered into adatabase to generate descriptive statistics. Database entry should include range and value checking inorder to control for digitization errors. Each subject should have a unique identification number.For all analyses, lead levels should be transformed logarithmically to reduce the asymetry of thedistribution. The conversion of means logs back to raw units provides a geometric mean level,which will be the primary summary statistic.
Data analysis of baseline information should evaluate the association between independent riskfactors and blood lead levels (e.g., children�s behaviors that may increase the risk of lead exposure,such as time spent outdoors; the deliberate consumption of earth, soil, or clay; chewing or suckingof pencils, crayons, or toys; or placing hands in their mouths and handwashing practices). Univariatestatistics should be calculated and evaluated against blood lead level measurements. Tests ofsignificance should be performed using t-test or analysis of variance. In addition multivariate modelscan be constructed to include all potential predictors. For example, those identified in the univariateanalysis as important can then be entered in a step-wise regression analysis to obtain the best modeland analyze simultaneously the effect of different variables and to determine which ones contributemost significantly to children�s blood lead levels. The odds ratios or relative risks of having a highblood lead level (higher than 10 ug/dL) could be estimated according to different variables.Multivariate models could be conducted by using logistic regression models.
The following points outline the data analysis to be performed over the course of the surveys ofschoolchildren:

42
1. Inspect the data at the time of collection to detect outliers and potential problems withsample collection and analysis.
2. Conduct linear trend analyses, using analysis of variance (ANOVA), over the first, third, andfifth years (and over the whole 10 years, when these data are available). This analysis willspecifically test whether or not there is a systematic trend in lead levels over the yearsstudied. Access to personal (desktop) computers with standard statistical software should beadequate for data analysis. (Epi-Info is commonly available in the LAC region. Otheroptions include SYSTAT or SAS.)
3. It may be useful to group the first three years and the last three years, then compare usingANOVA.
Statistical comparisons should be made by ANOVA; the primary independent variables are likely tobe residential location, hygiene behavior, and other sources of lead exposure. Evaluation of thedistribution of blood lead levels of the populations surveyed will provide important informationrelative to regulatory benchmarks established within countries in the LAC region and can be used toevaluate progress toward country-specific objectives for lead exposure.
5.5 Blood Sampling and Laboratory Analysis
A sample protocol for collection of blood specimens is provided in Appendix E. The recommendedprocedure for collection of blood specimens (finger stick) for children requires preparation of aclean room and facilities for hand washing. All samples should be collected in containers certified�lead-free� by manufacturer. Blood lead should be measured by anodic striping voltametry usingportable devices at the testing sites. These instruments(LeadCare� portable instruments) are the sizeof a hand calculator, are simple to use, and require neither manual calibration nor refrigeration andprovide blood lead results within minutes, thus providing an opportunity to conduct on-sitecounseling. When the results indicate a high value, for example over 30 cg/dL, the test should berepeated after a second hand washing. Values which are reconfirmed as high should be confirmedonce again with the sample obtained by venipuncture following procedure outlined in Appendix E.
Regardless of the method used to determine blood lead levels, maintenance of accurate blood leadmeasurements over the study period is key to obtaining valid results. To avoid or minimizelaboratory error in lead measurements over time, it is important to develop and maintain a programof external quality assurance/quality control (proficiency testing). In such a program, externalreference materials are inserted into the sample stream as true �blind� quality control samples.Several institutions offer this type of standardization program (see Table 6); the authors of thisreport recommend that laboratories join the program offered by the Environmental Health Divisionof the U.S. Centers for Disease Control and Prevention (CDC). Under that program, bovine bloodsamples are supplied free of charge by the Blood Lead Laboratory Reference System (BLLRS) tolaboratories doing blood lead analysis. These samples help laboratories standardize their blood leadmeasurements so that they can monitor and maintain consistent and accurate measurements overtime. Difficulties in implementing this program often include country-specific regulations regardingthe importation of bovine-based materials. The authors recommend that all regulations be verifiedand permits obtained before the study starts.
5.6 Counseling for High Blood Lead Levels

43
Parents of study participants should receive counseling regarding their child�s blood lead level aswell as educational information about how to reduce lead exposure. Current recommendations bythe American Academy of Pediatrics (Screening for Elevated Blood Lead Levels 1998) include thefollowing actions: if the blood test result is >70 cg/dL, the test should be repeated immediately;within 48 hours if the result is between 45 and 69 cg/dL; within 1 week if the result is between 20to 44 cg/dL; and within 1 month if the result is 10 to 19 cg/dL. These recommendations are cost-effective and work well in countries that have phased out lead from gasoline, because only arelatively low proportion of screened children are likely to require confirmation and becauseadditional point sources may be identified in children with high lead levels.
However, for LAC countries where leaded gasoline is still in use, these test result criteria may notwork efficiently; a large proportion of children are likely to have levels above the 10 cg/dL cut-offpoint, due solely to their exposure to lead derived from gasoline. Based on this, the followingmodifications are recommended: if the blood test result is >70 cg/dL, the test should be repeatedimmediately; within 48 hours if the result is between 45 and 69 cg/dL; within 1 week if the result isbetween 30 to 44 cg/dL; and within 1 month if the result is 20 to 29 cg/dL.
Treatment guidelines should be developed for children with high blood lead before the start of theproject. It is outside of the scope of this document to provide a review of the clinical issues relatedto lead intoxication. However, several key publications that provide a detailed review andrecomendations regarding the pharmacological treatment of lead intoxication are available:Committee on Drugs (1995); Sargent (1994); Liebelt and Shannon (1994); Glotzer (1994).
Medical treatment with some chelating agents is contraindicated if the intoxicated child will remainin contact with the original lead source or will return to a high lead environment. Several studieshave documented that children who were chelated and then returned to high lead environmentsrecover their original high blood lead levels within weeks, increasing the risk for acute lead toxicity.The current recommendation by the American Academy of Pediatrics is that children with bloodlead levels higher than 45 cg/dL receive chelation therapy and be removed from the lead source.Whenever possible the source should be identified by conducting a detailed environmentalinvestigation of cases with high blood lead levels (>30 cg/dL). Frequently children are exposed tolead by contact with contaminated dust or soil, due to their propensity to put into their mouthsfingers, toys, and other objects. Interventions to promote improved hygiene and handwashing willbe an important action to reduce lead exposure.
5.7 Reporting Results and Information Dissemination
Following the annual analysis of the data, a report should be prepared and sent to all ministriesparticipating in the monitoring program. The report should include mean blood lead levels as well asthe percentage of participants who are above certain levels that are of public health significance. Forchildren and young infants these cut-off points could be set at 10 cg/dL and 20 cg/dL. (The 20cg/dL level is used to flag those children requiring additional follow-up, while the 10 cg/dL value isused to flag those children who have levels over the limit of concern.) A table that presentsobserved blood lead levels along with those reported for other countries might help readers betterunderstand the results. When survey results uncover any additional risk factors for high blood leadlevels, these should also be reported. Because it is expected that the survey results will be of interestto a wide audience, it is important not to use complex medical terminology. Additionalconsiderations should be given to the preparation of a press release for the general population.

44
STUDY DESIGN FOR SURVEY OF
UMBILICAL CORD BLOOD
6.1 Recruitment of the Study Population
Lead is a well-recognized threat to the fetus. Fetal exposure may be evaluated by measuring bloodlead levels in maternal or umbilical cord blood samples. In large urban settings deliveries take placein well-organized maternity wards, making hospitals a cost-effective setting to obtain umbilical cordsamples. Furthermore, umbilical cord samples are easy to obtain and entail no discomfort to themother or infant.
Selection of study participants should be based on a systematic sample of deliveries taking placeduring a specific time period. The hospitals selected for the study should ensure representation ofdifferent ethnic and socioeconomic backgrounds. For example, as a first step, three to five largematernity hospitals that provide medical care for normal pregnancies (i.e., those withoutcomplications) should be identified. Hospitals that provide care to well defined populations shouldbe selected preferentially. The location of hospitals in the study should be plotted on a map toidentify the geographic area covered.
6.2 Sample Size and Follow-Up
The primary hypothesis to be tested is that the mean blood lead level of successive cross-sectionalsamples of umbilical cord blood at time of delivery for women of similar age and socioeconomicbackground will decrease significantly over time as a result of the phase-out of lead from gasoline.However, because policymakers and public health officials may need feedback at shorter timeintervals, sample sizes needed to detect estimated annual differences in blood lead levels have beencalculated. To this end, the authors have used data from studies in Mexico City, Mexico,(Hernández-Avila et al. 1997) and Lima, Peru (see case study in Chapter 3). The reported means(SDs) in these studies were 6.64 (3.65) and 3.76 (2.52) for Mexico City and Lima, respectively. Theauthors based the sample size calculations on a conservative reduction in mean blood lead of about1 cg/dL per year. However, the expected value for the difference to be detected between the firstand second cross-sectional samples will depend on the magnitude of the decrease of the leadcontent of gasoline. Samples sizes have been estimated for a low SD of 2.0 and a high SD of 4.0.Samples sizes range from 20 to 250 newborns per group, depending on the different assumptionsused in the sample size calculations (Table 9). The required sample size will depend on the amountof variation in cord blood levels in the study population, local conditions and other characteristics ofthe population to be studied. Small pilot studies should be conducted in order to obtain theinformation needed to estimate appropriate sample size requirements and to test field procedures.

45
Table 9Estimated Sample Sizes Needed to Detect Differences in
Umbilical Cord Blood Lead Levels between Two Populations
Expected Decline inBlood Lead Levels
(ccccg/dL)
Estimated StandardDeviation of Blood
Lead LevelsEstimated Sample
Size per Group
1.0 4.0 250
1.0 2.0 140
1.5 4.0 120
1.5 2.0 30
2.0 4.0 70
2.0 2.0 20Calculations were made assuming varying Standard Deviation, with astatistical power of 80% and a 95% confidence level.
Cross-sectional samples should be repeated on an annual basis once the programmatic actions tophase-out lead from gasoline are put into practice. As mentioned earlier, variations from season toseason may confound results. Therefore, as far as possible, repeated studies should be conducted atthe same time of the year.
6.3 Questionnaire Information
A brief risk-factor questionnaire concerning potential sources of exposure to lead should beadministered to the women giving birth. The questionnaire can be developed in collaboration withlocal health care workers and should include a core set of questions regarding potential sources oflead exposure, demographic information, and information on occupational and environmentalexposures, medical and reproductive history, and nutritional habits. Appendix D provides examplesof the types of questions to inlcude for pregnant women.
6.4 Data Analysis
The questionnaire information and umbilical cord blood lead results should be entered into adatabase to generate descriptive statistics. Database entry should include range and value checking tocontrol for digitization errors. Each subject should have a unique identification number and avariable indicating the year the survey was conducted.
Data analysis of baseline information should evaluate the association between independent riskfactors and blood lead levels (e.g., the mother�s cigarette smoking, diet, hobbies, home location inrelation to traffic or industrial sources of lead, time living in the city). Univariate statistics should becalculated and evaluated against blood lead level measurements. Tests of significance should beperformed using t-test or ANOVA.

46
In addition multivariate models could be constructed to include all potential predictors. Forexample, risk factors identified in the univariate analysis as important could then be entered in astepwise regression analysis to analyze simultaneously the effect of different risk factors, anddetermine which of them contribute most significantly to umbilical cord blood lead levels. The oddsratios or relative risks could also be estimated according to different risk factors. Multivariatemodeling could be conducted using logistic regression models.
For comparison of the first and second blood lead measurements, various approaches could beused. A simple one would be to perform a t-test between the first and second measurements.However, a t-test ignores other risk factors that may vary in the samples compared.
Given that the sample may have a broad geographical dispersion, additional analysis should be doneregarding location of residence. If possible, the address where each participant has lived for the lasttwo to three months should be identified on a map of the city. Geographical clustering of highumbilical cord lead levels may suggest the existence of point sources of lead exposure.
6.5 Blood Sampling and Laboratory Analysis
The recommended procedure for blood collection in these groups is puncture of the umbilical cord(see Appendix E for a complete protocol). All samples should be collected in containers certified bythe manufacturer to be lead free. Either graphite furnace atomic absorption spectophotometry(GFAAS) or anodic stripping voltametry (ASV) should be used to determine blood lead levels,whenever these measurement techniques are available and working with the appropriate qualitycontrols. However, if these procedures are not readily accessible the authors recommend the use ofnew ASV based portable technology (LeadCareTM portable instruments). These battery-poweredinstruments are the size of a hand calculator, simple to use, require neither manual calibration norrefrigeration, can process blood samples obtained either by venipuncture or by finger stick, and giveblood lead results within minutes, providing the opportunity to conduct on-site counseling.
Regardless of the method used to determine blood lead levels, maintenance of accurate blood leadmeasurements over the study period is key to obtaining valid results. To avoid or minimizelaboratory error in lead measurements over time, it is important to develop and maintain a programof external quality assurance/quality control (proficiency testing). In such a program, externalreference materials are inserted into the sample stream as true �blind� quality control samples.Several institutions offer this type of standardization program (see Table 6); the authors of thisreport recommend that laboratories join the program offered by the Environmental Health Divisionof the U.S. Centers for Disease Control and Prevention (CDC). Under that program, bovine bloodsamples are supplied free of charge by the Blood Lead Laboratory Reference System (BLLRS) tolaboratories doing blood lead analysis. These samples help laboratories standardize their blood leadmeasurements so that they can monitor and maintain consistent and accurate measurements overtime. Difficulties in implementing this program often include country-specific regulations regardingthe importation of bovine-based materials. The authors recommend that all regulations be verifiedand permits obtained before the study starts.
6.6 Counseling for High Blood Lead Levels
Study participants should receive counseling regarding their child�s estimated blood lead levels aswell as educational information about how to reduce lead exposure. Current recommendations from

47
the American Academy of Pediatrics (Screening for Elevated Blood Lead Levels 1998) include thefollowing actions: if the blood test result is >70 cg/dL, the test should be repeated immediately; ifthe result is between 45 and 69 cg/dL, the child should be retested within 48 hours; the child shouldbe retested within one week if the result is between 20 and 44 cg/dL and within one month if theresult is between 10 and 19 cg/dL. In Latin America, where leaded gasoline is still in use, thesecriteria for retesting may not work efficiently, because it is expected that a large proportion ofnewborns will have levels above the 10 cg/dL cut-off point, due to placental transfer of maternallead. Based on this expectation, the following modifications are recommended: if the blood testresult is >70 cg/dL, the test should be repeated immediately (in both the mother and the newborn);if the result is between 45 and 69 cg/dL, the infant and his/her mother should be retested within 48hours; if the result is between 30 and 44 cg/dL, the both (infant and mother) should be retestedwithin one week; and retesting should occur within one month if the result is between 20 and 29cg/dL.
For all newborns with levels above 30 cg/dL, further investigations should include a detailedenvironmental history and, if possible, a home visit to find out if there are additional point sourcesof lead exposure.
6.7 Reporting Results and Information Dissemination
Following the annual analysis of the data, a report should be prepared and sent to all ministriesparticipating in the monitoring program. The report should include mean blood lead levels as well asthe percentage of participants who are above certain levels considered to be of public healthsignificance. For newborns, the cut-off point could be set at 10 cg/dL. Additionally the reportshould include the proportion of children who have values above 20 µg/dL. A table that comparesblood lead levels found in the annual study with those reported by other countries may help readersunderstand the results. When survey results uncover any additional risk factors for high blood leadlevels these should be reported. Because it is expected that this report will reach a widemultidisciplinary audience, the document should not use complex medical terminology. Additionalconsideration should be given to the preparation of press releases for the general population.

48
AIR MONITORING FOR LEAD
Airborne lead particulates in ambient air represent a potential hazard to children and adults in theLAC region. The size and chemical composition of lead particles emitted vary according to theemission source. Lead sulfates and sulfides originate from mines. Fugitive dust becomes airbornefrom open mounds of ore concentrate and smelters. Lead halides or lead double salts are originatedfrom mobile sources (gasoline emissions). Both gasoline combustion and smelting processes emitsmall-size particles (less than 0.1 cm) due to the high temperatures of these processes. Lead particlesemitted by handling and mechanical processes (e.g., ore processing) are several times larger (i.e.,greater than 2 microns) than particles emitted by combustion or smelting sources. Larger particlesare removed from the air by deposition close to the source, while smaller-sized particles aretransported over long distances.
If the ministry reponsible for air monitoring has no experience in ambient air sampling, advice onthe appropriate and practical methods should be sought from one of the institutions offeringtechnical assistance (see Table 6 in Chapter 3)
7.1 Collection of Lead Particulates in Air Samples
The simplest method for collecting particulate lead samples in ambient air to monitor the phase-outof lead in gasoline is to rely on existing air particulate sampling methods and equipment used by therelevant ministry (e.g., Ministry of Environment).
Ambient air sampling is commonly done using high-volume or low-volume air samplers (forexample, dichotomous samplers, TSP samplers or PM10 samplers). However, high-volume samplersare still the recommended method for collecting lead ambient air samples. High-volume air samplerscapture 80 to 90% of the total mass of lead, and collect on average twice as much lead mass as PM10samplers. The PM10 sampler excludes particles larger than the respirable size, which makes a majordifference in sampling since exposure to lead occurs through inhalation and ingestion of particlesthat are too large to be inhaled. Therefore, the high-volume sampler provides a more completeassessment of exposure to ambient lead than the PM10 sampler. The high-volume sampler is simplerand less expensive to operate, and the results obtained may be easier to compare with measurementscollected in other parts of the world.
Sampling should be conducted at carefully selected sites. Sites to be considered include areas nearheavily trafficked city streets, work sites associated with the survey of occupationally exposedworkers, elementary school playgrounds, day-care facilities or neighborhoods of women surveyed attime of delivery. If possible, sites should be selected with the purpose of this study in mind;therefore, sites close to lead-emitting industries should be avoided. Within a few hundred meters ofany potential source, the particle size distribution of lead stabilizes and remains roughly constantthereafter with transport into remote environments. According to U.S. EPA (EPA 1997), leadsamplers should be placed to obtain a representative measurement of the lead concentration in the

49
area of concern. Because the sampling area will be of neighborhood-wide areas, the sampler inletshould be located 2 to 15 meters above ground level. Since nearby buildings can create downwashand turbulent effects, the distance between the sampler and any obstacles must be at least twice theheight that the obstacle protrudes above the sampler. There must be an unrestricted airflow in an arcof at least 270 degrees around the sampler for the season with the greatest pollutant concentration.The sampler should not be placed near any furnaces or incinerator flues. Any tree(s) that act asobstructions between the source of the lead emissions and the sampler should be at least 10 metersdistant.
Samplers for monitoring ambient air should be operated at a minimum schedule of once every 6days; the frequency may be increased to obtain a more complete database. A finer time resolutionthan 24-hours is not likely to provide useful information. The final sampling schedule will dependon budgetary issues, however, the minimum recommended schedule is one-in-six days over a 5 to 10year period.
Another sampling method that can be used is field-portable anodic stripping voltammetry (ASV). Aprotocol for this approach is found in the American Society for Testing and Materials (ASTM)Standard E 1775-96 (see Appendix F) published in 1996, and is also described by Ashley (1995,1998).
7.2 Laboratory Analysis of Lead Particulates in Air Samples
The reference method procedure for determining lead in suspended particulate matter collectedfrom ambient air requires that the lead be solubilized using extraction procedures involving nitricacid (HNO ) and hydrochloric acid (HCl), with subsequent analysis using atomic absorptionspectrometry. Individual filter samples or composites of as many as eight filter samples collectedover a consistent one-week, two-week, or one-month period during a calendar month may beanalyzed for lead content to derive a monthly average concentration. EPArecommends the use ofeight filters for compositing.
One protocol for sample preparation and analysis is found in ASTM Standard E 1613, Test Methodfor Analysis of Digested Samples for Lead by Inductively Coupled Plasma Atomic EmissionSpectrometry (ICP-AES), Flame Atomic Absorption (FAA), or Graphite Furnace AtomicAbsorption. Assistance with laboratory analysis of environmental samples and environmental leadproficiency testing is available; see Table 6 for details.
Special Methods: Source Determination
Highly sophisticated techniques such as lead isotopic analysis are designed to identify the probablesources of certain lead compounds in the environment. The lead isotope methodology is based onthe fact that lead consists of four natural stable isotopes which vary in relative abundance from onelead ore to another. Therefore, the relative abundance of these isotopes in any given lead particlesprovides a fingerprint of the lead from a particular source. Since the isotopic ratios remains constant,it is possible to measure differences in lead isotope ratios between different sources and to use thisinformation to evaluate the impact of potential sources of exposure (see Silbergeld 1996 for furtherdiscussions). The technique is used to distinguish lead originating from specific mines in certainregions of the world. According to Dr. E Silbergeld (personal communication, 1996), much of thelead in gasoline sold in the Americas comes from one particular mine in Australia, which has a

50
specific lead isotope ratio (i.e., isotopic composition); other lead mines in other sites in the worldhave different lead isotope ratios. The relative ratio of lead particulates derived from gasoline vs.lead smelters or other heavy industry was recently demonstrated in an air paticulates sourceapportionment study in Cairo, Egypt (Rodes et al. 1996).
With sufficient background information on lead sources, a few representative ambient air samplesmeasured by lead isotopic analysis could demonstrate the shift in the relative proportions(contributions) of lead from different sources (e.g., gasoline vs. other sources) in a country (see Teraet al. 1985)
7.3 Data Completeness and Reporting Requirements
In the United States, the current recommended value for ambient air lead is 1.5 cg/m3. A quarterlyaverage concentration of greater than 1.5 cg/m3 is considered to exceed the standard. At least 75%of the lead samples must be available for the quarterly average to be considered valid. In addition,the interval must be long enough to allow collection of sufficient valid samples for statisticalintegrity of the data.
7.4 Data Analysis
As a first step, the goal should be to identify climatic factors that influence lead levels. For exampleprevailing wind direction, height and magnitude of inversions (daytime and nocturnal), season of theyear (rainy vs. dry period, summer vs. winter). A recommended strategy is to examine the frequencydistribution of lead levels and then to conduct a time-series analysis with case studies for peakvalues. Graphical presentation of trends by time is useful for revealing the nature of any tendency.Graphical presentation of two or more variables plotted simultaneously against time may also beuseful for identifying relations between lead levels and other variables. Regression analysis can beused to further explore and quantify apparent relationships. Reporting should include the percentiledistribution of lead values per quarter. The proportion of time averages that exceed therecommended value of 1.5 cg/m3 should be reported.

51

52
REFERENCES
ALCONSULT International Ltd. [1996]. Study concerning the elimination of lead in gasoline inLatin America and the Caribbean. Calgary, Alberta, Canada. August.
AECLP/EDF (Alliance to End Childhood Lead Poisoning and Environmental Defense Fund)[1994]. The Global Dimensions of Lead Poisoning, Washington, D.C.: AECLP/EDF pp.52-54.
Aguilar-Madrid G, Piacitelli GM, Juarez-Perez CA, Vazquez-Grameix JH, Hu H, Hernández-AvilaM [1999]. Occupational exposure to inorganic lead in a printing plant in Mexico City. SaludPublica de Mexico. 41:42-54.
Al-Saleh I, Khalil MA, Taylor A [1995]. Lead, erythrocyte protoporphyrin, and hematologicalparameters in normal maternal and umbilical cord blood from subjects of the RiyadhRegion, Saudi Arabia. Arch Environ Health 50(1):66-73.
American Academy of Pediatrics. Screening for elevated blood lead levels [1998]. Pediatrics.101(6):1072-1078.
Annest JL [1983]. Trends in the blood lead levels of the U.S. population: The second national healthand nutrition examination survey (NHANES II) 1976-1980. Pp. 35-38 in Lead versusHealth, M. Rutter and RR Jones eds. New York: John Wiley & Sons.
Ashley K [1995]. Short Communication: Ultasonic extraction and field-portable anodic strippingvoltammetry of lead from environmental samples. Electroanalysis 7(12): 1189-1192.
Ashley K, Mapp KJ, Millson M [1998]. Ultrasonic extraction and field-portable anodic strippingvoltammetry for the determination of lead in workplace air samples. American IndustrialHygiene Association Journal. 59:671-9.
Baghurst PA, McMichael AJ, Wigg NR, Vimpani GV, Robertson EF [1995]. Exposure toenvironmental lead and visual motor integration at age 7 years: The Port Pirie cohort study.Epidemiology. 6(2):104-109.
Banks EC, Ferretti LE, Shucard DW [1997]. Effects of low level lead exposure on cognitivefunction in children: a review of behavioral, neuropsychological and biological evidence. Neurotoxicology. 18:237-81.
Bellinger D [1995]. Neuropsychologic function of children exposed to environmental lead[Editorial]. Epidemiology 6(2)101-103.
Bellinger DC, Needleman HL, Leviton A, Waternaux C, Rabinowitz MB [1984]. Early sensory-motor development and prenatal exposure to lead. Neurobehav. Toxicol Teratol 6:387-402.

53
Bellinger D, Leviton A, Waternaux C, Needleman H, Rabinowitz M [1987]. Longitudinal analyses ofprenatal and postnatal lead exposure and early cognitive development. N Engl J Med316(17):1037-1043.
Bellinger D, Dietrich KN [1994]. Low-level lead exposure and cognitive function in children.Pediatric Annals 23(11):600-5.
Bellinger D, Hu H, Title L, Needleman H [1994]. Attentional correlates of dentin and bone leadlevels in adolescents. Arch Environ Health 49:98-105.
Bentou-Maranditou A, Nakou S, Micheloyannis J [1988]. Neurobehavioral estimation of childrenwith life-long increased lead exposure. Arch Environ Health 43(6):392-395.
Bonilla CM, Mauss EA [1998]. A community-initiated study of blood lead levels of Nicaraguanchildren living near a battery factory. Am J Public Health 88:1843-1845.
Bono R, Pignata C, Scursatone E, Rovere R, Natale P, Gillig [1995]. Updating about reductions ofair and blood lead concentrations in Turin, Italy, following reductions in the lead content ofgasoline. Environ Res 70:30-34.
Bossano F and Oviedo C [1996]. Contaminacion por plomo. Quito: Comision Asesora Ambientalde la Presidencia de la Republica. 26 pp.
Brody DJ, Pirkle JL, Kramer RA, Flegal KM, Matte TD, Gunter EW, Paschal DC [1994]. Blood leadlevels in the US population. Phase 1 of the Third National Health and NutritionExamination Survey NHANES III, 1988 to 1991. JAMA 272(4):277-283.
Buchet JP, Roels H, Hubermont G, Lauwerys R [1978]. Placental transfer of lead, mercury,cadmium, and carbon monoxide in women. Enviro Res 15:494-503.
Calderón-Salinas JV, Hernández-Luna C, Valdez-Anaya B, Maldonado-Vega M, Lopez-Miranda A[1996]. Evolution of lead toxicity in a population of children. Hum Exp Toxicol 15(5):376-382.
CDC (Centers for Disease Control and Prevention) [1991]. Preventing Lead Poisoning in YoungChildren. US DHHS/CDC.
CDC [1995]. Analytic Methods for Blood Lead Measurements [Manual]. 48th National Meeting ofthe American Association for Clinical Chemistry Workshop #2213. Atlanta, Georgia:CDC/Wadsworth Center New York State Dept. of Health/Wisconsin State Laboratory ofHygiene. 29 July.
CDC [1997]. Update: Blood Lead Levels�United States, 1991-1994. Morbidity and Mortality WeeklyReport 46:7.
Clark AR [1977]. Placental transfer of lead and its effects on the newborn. Postgrad Med J 53:674-678.

54
Committee on Drugs [1995]. Treatment guidelines for lead exposure in children. Pediatrics. 96:155-160.
Contreras R [1990]. The case of Mexico City. Cited in Environmental Epidemiology: A Project forLatin America and the Caribbean. Finkelman J, Corey G, Calderon R eds. [1993]. PanAmerican Center for Human Ecology and Health, Environmental Protection Agency,International Program on Chemical Safety, Global Environmental Epidemiology Network,pp. 114-118.
Corey G, Galvão L [1989]. Serie Vigilancia 8 Plomo. Centro Panamericano de Ecología Humana ySalud Organización Panamericana de Salud Organización Mundial de la Salud, Toluca,Metepec, Mexico: PAHO/ECO.
Corzo G, Naveda R [1998].Occupational exposure to lead in production units in Maracaibo,Venezuela. Investigacion Clinica. 3:163-73.
Counter SA, Buchanan LH, Laurell G, Ortega F [1998]. Field screening of blood lead levels inremote Andean villages. Neurotoxicology. 19:871-7.
Damm D, Grandjean P, Lyngbye T, Trillingsgaard A, Hansen ON [1993]. Early lead exposure andneonatal jaundice: Relation to neurobehavioral performance at 15 years of age. Neuro andTeratol 15(3):173-181.
Driscoll W, Mushak P, Garfias J, Rothenberg SJ [1992]. Reducing lead in gasoline: Mexico�sexperience. Environ Sci Technol 26(9): 1702-1705.
EPA (US Environmental Protection Agency) [1986]. Air Quality Criteria for Lead. ResearchTriangle Park, NC: EPA Environmental Criteria Assessment Office, EPA-600/8-8-33/028af, vols. 1-4.
EPA (US Environmental Protection Agency) [1979]. Toxic trace metals in mammalian hair andnails. Environmental Monitoring Systems Laboratory, Las Vegas, NV EPA-600/4-79-049.
Farias P, Borja-Aburto VH, Rios C, Hertz-Picciotto I, Rojas-Lopez M, Chavez-Ayala R [1996].Blood lead levels in pregnant women of high and low socioeconomic status in Mexico City.Environ Health Perspec. 104(10):1070-4.
Fergusson DM, Horwood LJ, Lynskey MT [1993]. Early dentine lead levels and subsequentcognitive and behavioral development. J Child Psychol Psychiatr 34(2):215-227.
Finkelman J, Corey G, and Calderon R eds. [1993]. Environmental epidemiology: A project forLatin America and the Caribbean. Pan American Center for Human Ecology and Health,Environmental Protection Agency, International Program on Chemical Safety, GlobalEnvironmental Epidemiology Network, Toluca, Metepec, Mexico: PAHO/ECO.
Flindt MHL, King E, Walsh DB [1976]. Blood lead and erythrocyte δ-aminolevulinic aciddehydratase levels in Manchester taxi drivers. Brit J Ind Med 33:79-84.

55
Frenz P, Vega J, Marchetti N, Torres J, Kopplin E, Delgado I, Vega F [1997]. Chronic exposure toenvironmental lead in Chilean infants. Rev Med Chile. 125:1137-44.
Gittleman JL, Engelgau MM, Shaw J, Willie KK, Seligman PJ [1994]. Lead poisoning among batteryreclamation workers in Alabama. J Occup Envir. Med 36(5):526-532.
Glotzer DE [1994]. Management of childhood lead poisoning: Strategies for chelation. PediatricAnnals. 23:606-12.
Grandjean P, Lyngbye T, Hansen ON [1991]. Lessons from a Danish study on neuropsychologicalimpairment related to lea exposure. Environ Health Perspect 89:91-94.
Grobler SR, Maresky LS, Kotze TJ [1992]. Lead reduction of petrol and blood lead concentrationsof athletes Arch Environ Health 47:139-142.
Guidance for siting ambient air monitors around stationary lead sources [1997]. United States Officeof Air Quality EPA-454/R-92-009R. Environmental Protection Planning and Standards.
Gulson BL, Mahaffey KR, Jameson CW, Mizon KJ, Korsch MJ, Cameron MA, Eisman JA [1998]. Mobilization of lead from the skeleton during the postnatal period is larger than duringpregnancy. J LabClin Med 131:324-329.
Gulson BL, Jameson CW, Mahaffey KR, Mizon KJ, Korsch MJ, Vimpani [1997]. Pregnancy increases mobilization of lead from maternal skeleton. J LabClin Med 130:51-62.
Gulson BL, Mahaffey KR, Mizon KJ, Korsch MJ, Cameron MA [1995]. Contribution of tissue leadto blood lead in adult female subjects based on stable isotope methods. J Clin Med 125:703-712.
Hansen ON, Trillingsgaard A, Beese I, Lyngbye T, Grandjean P [1989]. A neuropsychological studyof children with elevated dentine lead levels: Assessment of the effect in differentsocioeconomic groups. Neurotoxicol Teratol 11(3):205-213.
Harris P [1972]. Lead levels in cord blood. Pediatrics 49:606-608.
Hayes EB, McElvaine MD, Orbach HG, Fernandez AM, Lyne S, Matte TD [1994]. Long-termtrends in blood lead levels among children in Chicago: Relationship to air lead levels.Pediatrics 93(2):195-200.
Hernández-Avila M, Gonzalez-Cossio C, Palazuelos E, Romieu I, Aro A, Fishbein E, Peterson KE,Hu H [1996]. Dietary and environmental determinants of blood and bone lead levels inlactating postpartum women living in Mexico City. Environ Health Perspect 104(10):1076-1082.
Hernández-Avila M, Sanin LH, Romieu I, Palazuelos E, Tapia-Conyer R, Olaiz G, Rojas R,Navarrete J [1997] Higher milk intake during pregnancy is associated with lower maternaland umbilical cord lead levels in postpartum women. Environ Res 74:116-121.

56
Hinton D, Coope P, Malpress WA, Janus ED [1986]. Trends in blood lead levels I Christchurch(NZ) and environs 1978-85. J Epidemiol Commun Health 40:244-248.
Howson CP, Hernández-Avila M, Rall DP eds. [1996]. Lead in the Americas: A Call for Action.Toluca, Mexico: IOM/NIPHM (Institute of Medicine of USA/ National Institute of PublicHealth of Mexico).
Hu H, Hashimoto D, Besser M [1996a]. Levels of lead in blood and bone of women giving birth in aBoston hospital. Arch Environ Health 51(1):52-58.
Hu H, Aro A, Payton M, Korrick S, Sparrow D, Weiss S, Rotnitzky A [1996b]. The relationship ofbone and blood lead to hypertension: The normative aging study. JAMA 275(15):1171-1176.
IPCS (International Program on Chemical Safety) [1995]. Environmental Health Criteria Document:Lead. Geneva: IPCS, WHO.
Jacoby E [1998]. Environmental lead is a problem in Lima, Peru. Environ Health Perpect.106:A170-71
Jimenez C, Romieu I, Palazuelos E, Muñoz I, Cortes M, Rivero A, Catan J [1993]. Factores deexposicion ambiental y concentraciones de plomo en sangre en ninos de la Cuidad deMexico. [Environmental exposure factors and concentrations of lead in blood in MexicoCity children.] Salud Publica Mexico 35:599-606.
Johnson NH, Ash KO, Nuttall KL, Ashwood ER [1997]. The adequacy of capillary specimens fordetermining whole blood lead. Ann Clin Laborat Sc. 27:179-84.
Jones RD, Commins BT, Cernik AA [1972]. Blood lead and carboxyheoglobin levels in LondonTaxi Drivers. Lancet II:302-303.
Kapaki E, Varelas PN, Syrigou AI, Spanaki MV, Andreadou E, Kakami AE, Papageorgiou CT[1998]. Blood lead levels of traffic- and gasoline-exposed professionals in the City of Athens.Arch Environ Health 53:287-291.
Khan MH, Khan I, Shah H, Rashid Q [1995]. Lead poisoning a hazard of traffic and industries inPakistan. J Envriron Pathol Toxicol Oncol 14:117-120.
Kim R, Rotnitzky A, Sparrow D, Weiss ST, Wager C, Hu H [1996]. A longitudinal study of low-levellead exposure and impairment of renal function. JAMA 275(15):1177-1181.
Lacasaña M, Romieu I, McConnell R, y Grupo de trabajo sobre plomo de la OPS [1996]. ElProblema de Exposicion al Plomo en America Latina y el Caribe, Serie Ambiental No. 16.Pan American Center for Human Ecology and Health, Environmental Protection Agency,International Program on Chemical Safety, Global Environmental Epidemiology Network,Toluca, Metepec, Mexico: PAHO/ECO. Toluca, Metepec, Mexico: PAHO/ECO.
Liebelt EL, Shannon MW [1994]. Oral chelators for childhood lead poisoning. Pediatric Annals.23:616-9.

57
Lopez-Carrillo L, Torres-Sanchez L, Garrido F, Papaqui-Hernández J, Palazuelos-Rendon E, Lopez-Cervantes M [1996]. Prevalence and determinants of lead intoxication in Mexican children oflow socioeconomic status. Environ Health Perspec. 104(11):1208-11
Lovei M [1995]. Why Lead Should be Removed From Gasoline, December 1995, EnvironmentDepartment, Dissemination Notes No. 32. Washington, DC: World Bank.
Lovei M [1996]. Phasing Out Lead from Gasoline: World-wide Experience and Policy Implications.Environment Dept. Paper No. 040, Pollution Management Series. Washington, D.C.: WorldBank.
Maravelias C, Athansalelis S, Dona A, Chatzioanou A, Priftis A, Koutselinis A [1998]. Reduction oflead pollution in Greece during the past two decades. Arch Environ Health 53:424-26.
Maresky LS, Grobler SR [1993]. Effect of the reduction of petrol lead on the blood lead levels ofSouth Africans. Science tot Environ 136:43-48.
Matte TD, Figueroa JP, Ostrowski S, Burr G, Jackson-Hunt L, Baker EL [1991]. Lead exposurefrom conventional and cottage lead smelting in Jamaica. Arch Environ. Contam Toxicol.21(1):65-71.
McMichael AJ, Baghurst PA, Vimpani GV, Wigg NR, Robertson EF, Tong S [1994]. Tooth leadlevels and IQ in school-age children: The Port Pirie cohort study. Am J Epidemiology140(6):489-499.
McMichael A, Vimpani G, Robertson EF, Baghurst PA, Clark PD [1986]. The Port Pirie cohortstudy: Maternal blood lead and pregnancy outcome. J Epidemiol Community Health 40:18-25.
Muñoz H, Romieu I, Palazuelos E, Mancilla-Sanchez T, Mensese-Gonzalez GF, Hernández-Avila M[1993]. Blood lead level and neurobehavioral development among children living in MexicoCity. Arch Environ Health 48(3):132-139.
NAS (National Academy of Sciences) [1993]. Measuring Lead Exposure in Infants, Children, andOther Sensitive Populations, Washington, D.C.: National Academy of Sciences Press.
Needleman HL [1988]. The persistent threat of lead: Medical and sociological issues. Curr ProblPediatr 18(12):697-744.
Needleman HL, Shell A, Bellinger DC, Leviton A, Allred EN [1990]. The long-term effects ofexposure to low doses of lead in childhood: An 11-year follow-up report. N Engl J Med306:367-372.
Needleman HL [1994]. Childhood lead poisoning: Man-made and eradicable. Current Opinion inNeurology 7(2):187-190.
Needleman HL, Riess JA, Tobin MJ, Biesecker GE, Greenhouse JB [1996]. Bone lead levels anddelinquent behavior. JAMA 275(5):363-369.

58
Needleman HL, Gastonis CA [1990]. Low-level lead exposure and the IQ of children: A meta-analysis of modern studies. JAMA 263(5):673-678.
Olaíz G, Fortoul TI, Rojas R, Doyer M, Palazuelos E, Tapia CR [1996a]. Risk factors for high levelsof lead in blood of schoolchildren in Mexico City. Arch Environ Health 51(2):122-126.
Olaíz G [1996b]. High blood lead levels in ceramic folk art workers in Michoacan, Mexico. ArchEnviron Health 52(1): 51-55.
Ordoñez BR, Ruiz Romero L, Mora IR [1976]. Epidemiological study of lead levels in the childpopulation and the household environment in Ciudad Juarez, Chihuahua, Mexico, ascompared to a foundry area in el Paso, Texas. Bol Ofic San Pan 80:303-17.
Oviedo JF, Bossano L, Calderon [1996]. Efectos de la contaminacion por plomo en Quito. RevistMedica Vozandes 9(1):5-10.
PAHO (Pan American Health Organization) [1990a]. Epidemiology and the future of the world.Epidemiologic Bulletin. 11(4):5 .
PAHO (Pan American Health Organization) [1990b]. Health Conditions in the Americas: EnvironmentalProblems Affecting Health. 1(524):1-16.
Payton M, Riggs KM, Spiro A 3rd, Weiss ST, Hu H [1998]. Relations of bone and blood lead tocognitive function: the VA Normative Aging Study. Neurotoxicology & Teratology.20(1):19-27.
Pirkle JL, Brody DJ, Gunter EW, Kramer RA, Paschal DC, Flegal KM, Matte TD [1994]. Thedecline in blood lead levels in the United States�the National Health and NutritionExamination Surveys (NHANES). JAMA 272(4):284-291.
Pocock SJ, Ashby D, Smith MA [1987]. Lead exposure and children�s intellectual performance. IntlJ Epidemiol 16(1):57-67.
Potula V, Hu H [1996]. Occupational and lifestyle determinants of blood lead levels among men inMadras, India. Int J Occup Environ Health 2 (2):1-4.
Quinn MJ, Delves HT [1987]. UK blood lead monitoring programme 1984-1987: Protocol andresults for 1984. Human Toxicol 6:459-474.
Quinn MJ, Delves HT [1989]. UK blood lead monitoring programme 1984-1987: Results for 1986.Human Toxicol 8:205-220.
Rabinowitz M, Needleman HL [1983]. Petroleum lead sales and umbilical cord blood lead levels inBoston, Massachusetts. Lancet 1:63.
Rabinowitz M, Wang JD, Soong WT [1991]. Dentine lead and child intelligence in Taiwan. ArchEnviron Health 46(6): 351-360.

59
Ramirez AV, Paucar JC, Medina JM [1997]. Blood lead in the inhabitants of 4 Peruvian localities.Pan Am J Public Health. 1(5):344-8.
Rice DC [1996]. Behavioral effects of lead: Commonalities between experimental and epidemiologicdata. Environ Health Perspect 104 (Supplement 2): 337-351.
Rodes CE, Nasralla MM, Lawless PA [1996]. An assessment and source apportionment of airborneparticulate matter in Cairo, Egypt. Vols. I and II. Activity Report No. 22. Arlington, Va.:Environmental Health Project.
Romieu I, Weitzenfeld H, Finkelman J [1990]. Urban air pollution in Latin America and theCaribbean: Health persepectives. Wld Hlth Statist Quart. 43:153-167.
Romieu I, Palazuelos E, Meneses F, Hernández-Avila M [1992]. Vehicular traffic as a determinant ofblood-lead levels in children: A pilot study in Mexico City. Arch Environ Hlth 47(4): 246-249.
Romieu I, Palazuelos E, Hernández-Avila M, Rios C, Muñoz I, Jimenez C, Cahero G [1994].Sources of lead exposure in Mexico City. Environ Health Perspect 102(4):384-389.
Romieu I, Carreon T, Lopez L, Palazuelos E, Rios C, Manuel Y, Hernández-Avila M [1995].Environmental urban lead exposure and blood lead levels in children of Mexico City.Environ Health Persect 103(11):1036-1040.
Romieu I and Lacasaña M [1996]. Prevalence of exposure and data quality of lead contamination inLatin America and the Caribbean. In Lead in the Americas. See Howson et al. eds. Toluca,Mexico: IOM/NIPHM (Institute of Medicine of USA/ National Institute of Public Healthof Mexico).
Rondon M [1996]. Implementacion del GEMS-AIRE in las Americas: Venezuela. Mexico:PAHO/WHO report 29 October.
Rothenberg SJ, Karchmer S, Schnass L, Perroni E, Zea F, Fernández-Alba F [1994]. Changes inserial blood lead levels during pregnancy. Environ Hlth Perspect 102(10): 876-880.
Rothenberg SJ, Karchmer S, Schnaas L, Perroni E, Zea F, Salinas V, Fernandez J [1996]. Maternalinfluences on cord blood lead levels. J Exp Asses Environ Epidemiol 6:211-227.
Rothenberg SJ, Schnaas L, Perroni E, Hernández RM, Karchmer S [1998]. Secular trend in bloodlead levels in a cohort of Mexico City children. Arch Environ Health. 53:231-5.
Ruff HA, Markowitz ME, Bijur PE, Rosen JF [1996]. Relationships among blood lead levels, irondeficiency, and cognitive development in two-year-old children. Environ Health Perspect104(2): 180-185.
Sargent JD [1994]. The role of nutrition in the prevention of lead poisoning in children. PediatricAnnals. 23:636-42.

60
Sargent JD, Dalton MA [1996]. Rethinking the threshold for an abnormal capillary blood leadscreening test. Arch Ped Adoles Med 150:1084-8
Schlenker TL, Fritz CJ, Mark D, Layde M, Linke G, Murphy A, Matte T [1994]. Screening forpediatric lead poisoning: Comparability of simultaneously drawn capillary and venous bloodsamples. JAMA 271(17):1346-1348.
Schuhmacher M, Belles M, Rico A, Domingo JL, Corbella J [1996]. Impact of Reduction of lead ingasoline on the blood and hair lead levels in the population of Farragona Province SPAIN1990-1995 Jsa tot environ 184:203-209.
Schutz A, Barregard L, Sallsten G, Wilske J, Manay N, Pereira L, Cousillas ZA [1997]. Blood lead inUruguayan children and possible sources of exposure. Environ Res. 74(1):17-23.
Schwartz J [1994]. Low level lead exposure and children�s IQ: A meta-analysis and search for athreshhold. Environ Res 65(1):42-55.
Schwartz J [1995]. Lead, blood pressure, and cardiovascular disease in men. Arch Environ Health50(1):31-37.
Sharp DS, Osterloh J, Becker CE et al. [1988]. Blood pressure and blood lead concentration in busdrivers. Environ Health Perpect 78:131-37
Silbergeld EK [1991]. Lead in bone: Implications for toxicology during pregnancy and lactation.Environ Health Perspect 91:63-70.
Silbergeld EK [1992]. Mechanisms of lead neurotoxicity, or looking beyond the lampost. FASEB J6(13)3201-3206.
Silbergeld EK [1996]. Lead poisoning: The implications of current biomedical knowledge for publicpolicy. MD Med J 45(3): 209-217.
Silva PA, Hughes P, Williams S, Faed JM [1988]. Blood lead, intelligence, reading attainment, andbehavior in eleven-year-old children in Dunedin, New Zealand. J Child Psychol Psychiatr29(1):43-52.
Steenhout A [1982]. Kinetics of lead storage in teeth and bones: An epidemiological approach. ArchEnviron Health 37(4):224-231.
Stiles KM, Bellinger DC [1993]. Neuropsychological correlates of low-level lead exposure in school-age children: A prospective study. Neurotoxicol Teratol 15(1):27-35.
Taylor, Roscoe, Bazelmans J, Golec R, Oakes S [1995]. Declining blood lead levels in Victorianchildren. Aust. J Public Health 19;455-459.
Tera O, Schwartzman DW, Watkings TR [1985]. Identification of gasoline lead in children's bloodusing isotopic analysis. Arch Environ Health 40(2): 120-123.

61
Teutsch SM, Churchill RE eds. [1994]. Principles and Practice of Public Health Surveillance. NY:Oxford University Press, pp. 18-28.
Troster EJ, Schwartzman S [1988]. Lead exposure in pregnant woman and their newborns in the cityof Sao Paulo, Brazil. Biomed Environ Sci 1(1):64-70.
Vahter M, Counter SA, Laurell G, Buchanan LH, Ortega F, Schutz A, Skerfving S [1997]. Extensivelead exposure in children living in an area with production of lead-glazed tiles in theEcuadorian Andes. Int Arch Occup Environ Health. 70(4):282-6.
Wang ST, Pizzolato S, Demshar HP, Smith LF [1997]. Decline in blood lead in Ontario childrencorrelated to decreasing consumption of leaded gasoline, 1983-1992. Clin Chem 43:1251-52.
Weitlisbach V, Rickenbach M, Berode M, Guillemin M [1995]. Time trend and determinants ofblood lead levels in a Swiss population over a transition period (1984-1993) from leaded tounleaded gasoline use. Environ Res 68:82-90.
Whelan EA, Piacitelli GM, Gerwel B, Schnorr TM, Mueller CA, Gittleman JL, Matte TD [1997].Elevated blood lead levels in children of construction workers. AJPH 87(8):1352-1355.

63
APPENDIX A: Members of EHP TechnicalReview Panel
Dr. Sherry Baron, ECO/PAHO, Pan American Center for Human Ecology and Health,Cuernavaca, Morelos, Mexico and Centers for Disease Control and Prevention, Atlanta, Georgia
Dr. John Borrazzo, Environmental Health Advisor, Office of Health and Nutrition, U.S. Agency forInternational Development, Washington, D.C.
Dr. Howard Frumpkin, Chair, Dept. Environmental and Occupational Health, School of PublicHealth, Emory University, Atlanta, Georgia
Dr. Luiz A.C. Galvão, Regional Advisor, Environmental Quality Program, Health and EnvironmentDivision, PAHO/WHO, Washington, D.C.
Dr. Tom Matte, National Center for Environmental Health, Office of the Director, Centers forDisease Control and Prevention, Atlanta, Georgia
Dr. Robert McConnell, Mount Sinai Hospital, New York
Dr. Carol Pertowski, National Center for Environmental Health, Surveillance and Programs Branch,Centers for Disease Control and Prevention, Atlanta, Georgia
Ing. Cor P.W. van der Sterren, Oil and Gas Division, Industry and Energy Department, WorldBank, Washington, D.C.

65
APPENDIX B: List of LAC LaboratoriesCurrently Enrolled in CDC PATProgram


71
APPENDIX C: List of LAC/PAHO Lab NetworkMembers

72


75
APPENDIX D: Sample Questionnaires
The sample questions presented in this appendix are not intended to be comprehensive. Theobjective is to illustrate, with some examples, the types of questions needed to assess risk factors forlead exposure for the target populations discussed in this document: occupationally exposedworkers, children and pregnant women. The precise wording and most appropriate questions wouldneed to be developed on a site-specific basis.

76
SAMPLE QUESTIONS FOR OCCUPATIONALLY EXPOSED POPULATIONS
I General Information
Participant Identification Number _________________
Interviewer code _______________________________
Date of interview _____/______/_____ (Month/Day/Year)
What is your date of birth? _____/______/___ (Month/Day/Year)
Current Address: ____________________________________________ (Number, Street, or Rural Route) ___________________________________________
____________________________________________ (City or Town, State, Zip Code)
Gender: 1. Male 2. Female
List two persons that we could call if we need to contact you?Person #1: Name
AddressTelephone
Person #2: NameAddressTelephone
Do you know how to read?1 Yes 2 No
Do you know how to write?1 Yes 2 No
Have you ever attended school?1 Yes 2 No

77
What is the highest level of school that you completed?Primary: 1st grade
2nd grade3rd grade4th grade5th grade6th grade
Secondary school (lower): 1st year2nd year3rd year
Secondary school (upper): 4th year5th year6th year
Other technical school (specify) _________________
University (# of years) ____________________
Postgraduate school (# of years)_____________
What is the principal source of drinking water at your home?1 Piped inside for family use only2 Piped outside the house for family use only3 Piped inside for all uses4 Bottled water5 A well or pond6 Water from government or private trucks7 Other (specify) ____________________
II Information Regarding Smoking
Have you ever smoked cigarettes? 1 Yes 2 No
Have you smoked at least as many as five packs of cigarettes, that is, 100 cigarettes during yourentire life? 1 Yes 2 No
Do you NOW smoke cigarettes? 1 Yes 2 No
How old were you when you started smoking cigarettes regularly? (age in years)_____
How much do you smoke on the average? (cigarettes/day)_______
Do you inhale the cigarette smoke? 1 Yes 2 No
Do you smoke at work? 1 Yes 2 NoWhen you smoke at work, how often do you wash your hands before smoking?
1 Often

78
2 Sometimes3 Rarely4 Never9 Unknown
During the last 30 days have you:1 Decreased the number of cigarettes you smoke at home?2 Increased the number of cigarettes you smoke at home?3 Decreased the number of cigarettes you smoke at work?4 Increased the number of cigarettes you smoke at work?
III Dietary Habits
Do you eat at your work place?
How often do you wash your hands before eating?1 Often2 Sometimes3 Rarely4 Never9 Unknown
Do you eat snacks at work? 1 Yes 2 No
How often do you wash your hands before eating snacks at work?1 Often2 Sometimes3 Rarely4 Never9 Unknown
IV Work Characteristics
What is your occupation?
When did you start working in this occupation?____ ______Year Month
Describe your job duties during the past month ____________________

79
Have your job duties changed in the last month?1 Yes (specify) ___________________2 No
Has the change in duties increased or decreased your exposure to vehicular fumes?1 Increased2 Decreased
How clean is your workspace area? 1 Very clean 2 Reasonably clean 3 Somewhat dusty or dirty 4 Very dusty or dirty
In a typical work situation this past month:How many days a week did you work? ________How many hours a day did you work? ________
On average, how much physical activity is involved in your work?1 Extensive (you are moving all the time)2 Moderate3 Mild4 None (you are sitting all the time)
Do you use special clothes (uniform) at work? 1 Yes 2 No
Who is responsible for the cleaning of your work clothes?1 You, at your home2 You, outside your house3 The company
V Exposure to Vehicular Traffic
How would you rank your overall exposure to road traffic?1 Very high2 High3 Medium4 Low5 None
In a typical day this past month:How much time did you spent outdoors in recreational activities? _______(hours)How much time did you spent using public transportation? _______(hours)

80
When you use public transportation are you exposed to vehicular traffic?1 No2 Yes, to low intensity traffic3 Yes, to medium intensity traffic4 Yes, to high intensity traffic
What type of transportation do you use more frequently?1 Your car2 Taxi3 Mini bus4 Bus5 Bicycle6 Walk most of the time
Which situation best describes the street where your home is located?1 Constant traffic2 Medium traffic3 Low traffic4 Almost no traffic
VI Exposure From Other Sources
Is your home is located near to an industrial zone? 1 Yes 2 No
Is your home is located near to any mining area or storage area for ores or concentrates?1 Yes 2 No
Is your home is located near to a smelter? 1 Yes 2 No
Have you had contact with gasoline in the last 30 days (For example did you use gasoline to cleanyou hands or any other objects?) 1 Yes 2 No
Before this job, did you worked in any of the following occupations:Lead smelter workerFoundry workerOil refinery workerPainterBattery plant workerChemical plant workerPaint pigment, zinc copper WorkerPlumberGlass worker
Production of lead-glazed ceramicsOther industries related to lead

81
Do you have any of the following habits? Bite or suck pencils at work
1 Almost every day 2 sometimes 3 almost never 9 UnknownBite your nails
1 Almost every day 2 sometimes 3 almost never 9 Unknown

82
SAMPLE QUESTIONS FOR CHILDREN
I General Information
Name ______________________________________
Participant Identification Number _______________________
Birth Date: _____/______/_____ (Month/Day/Year)
Current Address: ____________________________________________ (Number, Street, or Rural Route) ____________________________________________ (City or Town, State, Zip Code)
Gender: 1 Male 2 Female
II Exposure
In a typical sunny week this past month, did (child�s name) spend any time playing outside in areasaround the house such as the porch, sidewalk or street?
1 Yes2 No9 Unknown
How many days per week did (he/she) usually play there?1 One day2 Two days3 Three days4 Four days5 Five days6 Six days7 Everyday9 Unknown
This past month, how many hours a day did (he/she) usually spend on the porch, sidewalk or street? _________ (hours)

83
This past month did (child�s name) ever take a pacifier with (him/her) when (he/she) playedoutdoors?
1 Yes2 No9 Unknown
About how often did (he/she) do this?1 At least once per day2 At least once per week but not everyday3 A few times a month4 Once per month or less9 Unknown
This past month did (child�s name) ever take a baby bottle with (him/her) when (he/she) playedoutdoors?
1 Yes2 No9 Unknown
About how often did (he/she) do this?1 At least once per day2 At least once per week but not everyday3 A few times a month4 Once per month or less9 Unknown
This past month did (child�s name) ever eat food when (he/she) played outside?1 Yes2 No9 Unknown
About how often did (he/she) do this?1 At least once per day2 At least once per week but not everyday3 A few times a month4 Once per month or less9 Unknown
This past month when (child�s name) was inside at home, how often did (he/she) play or sit on thefloor?
1 Often2 Sometimes3 Almost never9 Unknown
About how many hours on an average day do you think (child�s name) usually sat or played on thefloor at home? _________(hours)

84
How often does (child�s name) suck (his/her thumb or fingers? Would you say often, sometimes,rarely, or never?
1 Often2 Sometimes3 Rarely4 Never9 Unknown
Have you ever seen (child�s name) eat dirt or sand?1 Yes2 No
Does (child�s name) have a favorite blanket or stuffed toy?1 Yes2 No9 Unknown
How often are (child�s name) hands washed before eating meals?1 Almost always2 sometimes3 almost never9 Unknown
How often are (his/her) hands washed after eating meals?1 Almost always2 sometimes3 almost never9 Unknown
How often are (child�s name) hands washed before eating snacks?1 Almost always2 sometimes3 almost never9 Unknown
How often are his/her hands washed after eating snacks?1 Almost always2 sometimes3 almost never9 Unknown

85
How often are (his/her) hands washed after playing outdoors?1 Almost always2 sometimes3 almost never9 Unknown
In the previous month, have you seen your child do the following?Eat dirt
1 Almost every day 2 sometimes 3 almost never 9 UnknownBite or suck pencils
1 Almost every day 2 sometimes 3 almost never 9 UnknownBite or suck clay
1 Almost every day 2 sometimes 3 almost never 9 UnknownBite or suck crayons
1 Almost every day 2 sometimes 3 almost never 9 UnknownBite or suck toys
1 Almost every day 2 sometimes 3 almost never 9 UnknownEat paint off the walls
1 Almost every day 2 sometimes 3 almost never 9 UnknownPut his/her hands in his/her mouth
1 Almost every day 2 sometimes 3 almost never 9 UnknownSuck his/her fingers
1 Almost every day 2 sometimes 3 almost never 9 UnknownBite his/her nails
1 Almost every day 2 sometimes 3 almost never 9 Unknown
When your child goes to school, what type of transportation does he/she use?1 Bus2 Taxi3 Private vehicle4 Bicycle5 Walks
If your child uses public transportation, how many minutes does he/she wait in the street?________ (minutes)
Which situation best describes the street where the home of (child�s name) is located?1 Street with constant traffic2 Street with medium traffic3 Street with low traffic4 Street with almost no traffic
Which situation best describes the street where the home of (child�s name) is located?1 Paved street2 Unpaved
Is the father of (child�s name) working in any of the following occupations?1 Lead smelter worker2 Foundry worker

86
3 Oil refinery worker4 Painter5 Battery plant worker6 Chemical plant worker7 Paint pigment, zinc, copper worker8 Plumber9 Glass worker
10 Production of lead-glazed ceramics11 Radiator repair shop12 other industries related to lead, (specify)_________________________
If yes, ask: Where are the father�s work clothes washed?1 At home2 At work
Do you or your husband do any of the following activities at home or in a place near home, such asin the backyard?
1 Plumbing2 Car battery repair3 Car battery recycling4 Radiator repair5 Use of gasoline6 Any other activity related to lead
If yes, ask: How often does (child�s name) play close to this area?1 Almost every day2 Sometimes3 Almost never 9 Unknown
Are his/her hands almost always, sometimes or almost never washed after eating snacks?
1 Almost always2 sometimes3 almost never9 Unknown

87
When the child plays outdoors? Are (his/her) hands almost always, sometimes or almost neverwashed after playing outdoors?
1 Almost always2 sometimes3 almost never9 Unknown
At bed time Are (his/her) hands almost always, sometimes or almost never washed after playingoutdoors?
1 Almost always2 sometimes3 almost never9 Unknown
In the previous month, have you seen in your child doing the following?
Eat dirt1 Almost every day 2 sometimes 3 almost never 9 Unknown
Bite or suck pencils1 Almost every day 2 sometimes 3 almost never 9 Unknown
Bite or suck clay1 Almost every day 2 sometimes 3 almost never 9 Unknown
Bit or suck crayons1 Almost every day 2 sometimes 3 almost never 9 Unknown
Bite or suck toys1 Almost every day 2 sometimes 3 almost never 9 Unknown
Eat pain of the walls1 Almost every day 2 sometimes 3 almost never 9 Unknown
Put his/her hands in his/her mouth1 Almost every day 2 sometimes 3 almost never 9 Unknown
Suck his/her fingers1 Almost every day 2 sometimes 3 almost never 9 Unknown
Bite his/her nails1 Almost every day 2 sometimes 3 almost never 9 Unknown

88
When your child goes to school what type of transportation does he/she uses?
1 Bus2 Taxi3 Private vehicle4 Bicycle5 Walks
Which situation describes better the street where the home of (child�s name) is located:
1 Street with constant traffic2 Street with medium traffic3 Street with low traffic4 Street with almost no traffic
Which situation describes better the street where the home of (child�s name) is located:
1 Paved street2 Unpaved
Is the father of (child�s name) working in any of the following occupations:
Lead smelter workerFoundry workerOil refinery workerPainterBattery plant workerChemical plant workerPaint pigment, zinc copper WorkerPlumberGlass workerProduction of lead-glazed ceramicsOther industries related to lead
If yes, ask who washed the clothes
Working clothes are washed at homeWorking clothes are washed at work

89
Do you or your husband do any of the following activities at home or in a place near home, forexample in the backyard?
PlumbingCar battery repairCar battery recyclingRadiator repairUse of gasolineAny other activity related to lead
If yes ask the following question:How often does (child�s name) plays close to this area?
1 Almost every day 2 sometimes 3 almost never 9 Unknown

91
APPENDIX E: Whole Blood Collection andProcessing
WHOLE BLOOD COLLECTION AND PROCESSING
NOTE: Universal Precautions- procedures to prevent exposure to HIV, hepatitis, etc., areASSUMED during all collection and handling of biological specimens. ALL specimens should beconsidered POTENTIALLY INFECTIOUS- see CDC Guidelines for specific recommendationsand procedures.
Whole blood collection procedure
1. Materials needed:
`Gauze sponges`Alcohol wipe`Band-Aid` 3 ml purple-top tube`21g 3/4� butterfly assembly with multiple sample Luer adapter, sterile`23g 3/4� butterfly assembly with multiple sample Luer adapter for children and difficultsticks`21g or 22g Vacutainer multiple sample needles`5cc plastic syringe for children`Preprinted labels`Tourniquet`Vacutainer holder and adapters for pediatric tubes (if children are going to be sampled)`Refrigerator`White storage boxes
2. Venipuncture procedure:
`Locate a suitable table and chair for blood collecting and lay out blood collection supplies`Locate the puncture site. Hold with 2 fingers on one side of the alcohol wipe so that only the otherside touches the puncture site. Wipe the area in a circular motion beginning with a narrow radiusand moving outward so as not to cross over the area already cleaned. Repeat with a second alcoholwipe.`Locate the vein and cleanse in manner previously described, then apply the tourniquet. If it isnecessary to feel the vein again, do so; but after you feel it, cleanse with alcohol prep again, and drywith a sterile gauze square. `Fix the vein by pressing down on the vein about 1 inch below the proposed point of entry into theskin and pull the skin taught.`Approach the vein in the same direction the vein is running, holding the needle so that it is at anapproximately 15 degree angle with the examinee�s arm.

92
`Push the needle, with bevel facing up, firmly and deliberately into the vein. Activate the vacuumcollection tube. If the needle is in the vein, blood will flow freely into the tube. If no blood entersthe tube, probe for the vein until entry is indicated by blood flowing into the tube. `For collection, loosen the tourniquet immediately after blood flow is established and release entirelyas the last tube fills. Collect 1 purple-top tube (3 ml).`If a syringe is required to obtain the blood, attach it to the appropriate size butterfly needle andwithdraw 2-3 mls blood. After withdrawing the needle from the arm, quickly change the needle onthe syringe and transfer the blood from the syringe by puncturing the top of the purple-top tubewith the new needle and allowing the vacuum to draw the blood into the tube. `Mix well with the anticoagulant. `When the needle is out of the arm, press gauze firmly on the puncture. Heavy pressure as theneedle is being withdrawn should be avoided because it may cause the sharp point of the needle tocut the vein. `Have the examinee raise his arm (not bend it) and continue to hold the gauze in place for severalminutes. This will help prevent hematomas.`Report to the physician any reaction experienced by the participant during the venipunctureprocedure.`Label all tubes with the preprinted labels provided, and use a ballpoint pen to add the datecollected and your initials to the label. The tubes should be affixed with the label showing theparticipant�s ID number (e.g. 92-0024-0001-B1). `Place a Band-Aid on the subject�s arm.
TECHNIQUE FOR CAPILLARY (FINGERSTICK) LEAD SAMPLING
NOTE: Universal Precautions- procedures to prevent exposure to HIV; hepatitis, etc., areASSUMED during all collection and handling of biological specimens. ALL specimens should beconsidered POTENTIALLY INFECTIOUS- see CDC Guidelines for specific recommendationsand procedures.
1. Materials needed per participant:
`Gauze sponges`Examination loves`Alcohol wipe`Band-Aid`Blood collection capillary tube`Lancing device with built-in needle protector`Preprinted labels`Appropriate waste containers
2. Finger stick procedure:
`Locate a suitable table and chair for blood collecting and lay out blood collection supplies`Thoroughly wash participant hands with soap and warm water. Warming the puncture sitewill increase blood flow`Wear examination globes`Select the middle or the ring finger and massage gently the fleshy part of the finger

93
`Clean the finger pad to be punctured with an alcohol swab; dry with a sterile gauze or acotton ball.`Puncture the finger or the heel in infants younger than 1 year`Grasp the finger and quickly puncture it with a sterile lancet`For the puncture, choose a spot near the fingertip and puncture the side of the finger nearthe tip.`Squeeze gently around the puncture site to obtain a large drop of blood. Wipe this firstdrop of blood off with a clean gauze or cotton ball`Do not let blood run down to the finger or onto the fingernail`Continue to grasp the finger, touch the tip of the collection container to the beaded drop ofblood, when the container is full cap or seal the container`Agitate the container to mix the anticoagulant through the blood`If collecting with capillary tubes, squeeze gently the finger while holding it down to form alarge drop of blood`Position the capillary with the tapered en towards the drop of blood.`Hold the capillary horizontally or with the end away from the finger slightly elevated. Fillthe capillary with blood to the indicator mark.`Wipe remaining blood from the finger. With clean gauze apply pressure until bleedingstops.`Do not let the blood sample in the capillary more than 5 minutes.`Label all tubes or collection control papers with the preprinted labels provided, and use aballpoint pen to add the date collected and your initials to the label. The tubes should beaffixed with the label showing the participant�s ID number (e.g. 92-0024-0001-B1). `Place a Band-Aid on the subject�s finger
Common causes of falsely high values include:
`Failure to wipe the first drop of blood`Failure to use examination gloves`Inadequate cleansing of child�s finger`Bubbles or gaps in collection tubes`Touching of the end of capillary or collection tubes
References:
`Screening for Elevated Blood Lead Levels. Pediatrics. 101(6):1072-1078.1998.`LeadCare Blood testing System User�s Guide, Rev E
PROCEDURE TO OBTAIN UMBILICAL CORD BLOOD SAMPLE
NOTE: Universal Precautions - procedures to prevent exposure to HIV, hepatitis, etc., areASSUMED during all collection and handling of biological specimens. ALL specimens should beconsidered POTENTIALLY INFECTIOUS - see CDC Guidelines for specific recommendationsand procedures.
1. Materials needed:

94
`Gauze sponges`Alcohol wipes`3 ml purple-top tube`21g 3/4� butterfly assembly with multiple sample Luer adapter, sterile`23g 3/4� butterfly assembly with multiple sample Luer adapter for children and difficultsticks`21g or 22g Vacutainer multiple sample needles`5cc plastic syringe for children`Preprinted labels`Tourniquet`Vacutainer holder and adapters`White storage boxes
2. Umbilical cord venipuncture procedure:
`Locate a suitable table and recipient to receive the placenta.`Inform the attending physician that you collect a sample of umbilical cord blood. This isimportant so that the cord will remain clamped when the placenta is extracted.`Locate the puncture site. Hold with 2 fingers on one side distal to the clamp site and closeto the placenta. Wipe and clean well the area in a circular motion beginning with a narrowradius and moving outward so as not to cross over the area already cleaned. Repeat with asecond alcohol wipe.`Locate the vein`Fix the vein by pulling the cord down on the vein about 1 inch below the root of theplacenta, locate a point of entry into the cord`You can apply a little pressure in the placenta to load the veins`Approach the vein in the same direction the vein is running, holding the needle so that it isat an approximately 15-degree angle with the cord.`Push the needle, with bevel facing up, firmly and deliberately into the vein. Activate thevacuum collection tube. If the needle is in the vein, blood will flow freely into the tube. Ifno blood enters the tube, probe for the vein until entry is indicated by blood flowing into thetube. `Collect 1 purple-top tube (3 ml).`If a syringe is required to obtain the blood, attach it to the appropriate size butterfly needleand withdraw 2-3 ml blood. After withdrawing the needle from the arm, quickly change theneedle on the syringe and transfer the blood from the syringe by puncturing the top of thepurple-top tube with the new needle and allowing the vacuum to draw the blood into thetube. `Mix well with the anticoagulant. `Discharge the placenta`Labels all tubes with the preprinted labels provided, and use a ballpoint pen to add the datecollected and your initials to the label. The tubes should be affixed with the label showingthe participant�s ID number (e.g. 92-0024-0001-B1).

96
Appendix F: Standard Guide for EvaluatingPerformance of On-SiteExtraction and Field-PortableElectrochemical orSpectrophotometric Analysis forLead (ASTM etc.)


102
Appendix G: Standard Practice for Collectionof Airborne Particulate Leadduring Abatement andConstruction Activities (ASTMStandard E 1553-93)

