activated dry sand filter - irc :: home help solve this problem, a study was carried out on the...
TRANSCRIPT
25089Ac
— ACTIVATED DRY SAND FILTER -
AS AN ALTERNATIVE TO REDUCETHE CONCENTRATION
OF Fe AND Mn IN WATER TREATMENT
1IBRARYINTERNAT!ONFOR COMMUNITY REFERENCE CENTRESANITATION ~IRc~WATER SUPPLY AN~
BY
ALGAMAR, KALIMARDIN
DR. ING, DEA, DIPL. S.E, IR. ITB
SENIOR LECTURERI TN-I TB CENTERINDONESIA
HEAD OF LABORATORYOF ENVIRONMENTALENGINEERING ITB
BANDUNG JULY 1989
LIBRARY, INTERNATIONAL REFERENCECE~~TREFOR COMMUNIIY WATER SUPPLYAND SAN~TATION(IRC)PC. Box 93190, 2509 AD The HagueTeL (070) 814911 ext. 1411142
LO:lhy) ~qc250—6804
ABSTRACT
The availability of water which are use for various purposes
such as for primary purpose, as-well as for other every day
activities can not be ignored from the human lives. People
has been trying to find water resources in numerous ways,
within groups or individually.
In a large community, The Water Supply Company/Drinking Water
Management Service have the responsibility to provide
drinking water that can be used savely. However, up until now
the capability of The Water Supply Interprise in Indonesia to
provide save drinking water are still limit~d. Thus there are
still a large number of people that have not yet receive
clean, high quality water. The sources of water that are
being used by the people not being served by The Water
Supply Company varies according to their environmental condi-
tion, such as surface water,, shallow groundwater, deep
groundwater or even the spring water.
In the urban area the usual source of water are groundwater
that comes from deep or shallow wells. The problems with the
quality of water from wells thatalways comes up are the high
contents of Iron and Manganese. That is because of the
goelogical condition of Indonesia with its many volcanic
mountains, so that latosol soil high in Iron and Manganese
~are commonly~found. This kind of ‘soil are the caused of high
content of Iron and Manganese in groundwater.
1
To help solve this problem, a study was carried out on the
possibility of using Activated Dry Sand Filter as an alterna-
tive treatment for Iron and Manganese. The results would
give us the information on the right methode to reduce the
concentration of Iron and Manganese in water efectively and
eficiently, so it could be generally applied.
INTRODUCTION
To be used savely water have to meet - certain
concerning their quality and quantity. By quality
that it has to undergo a certain treatment
appropriately. In choosing the right water
technique, the primary factor to look at is the
the raw water. Aside from that, other factors to
the simplicity of the system, its economic point
the easyness of its operation and maintenance.
criteria
it means
technique
treatment
quality of
consider is
of view and
A great number of Indonesian population have not yet had the
opportunity to receive drinking water facilities which are
representative, because the capacity of ~The Water Supply
Company~ to serve all the need is still limited. Thus to
provide for the need of drinking water people had been trying
to find water resouces individually, while their quality are
still questionable.
Water resources that generally used are ground water from
dug well or drilled well. The problem of this shallow ground
water is the high content of iron and manganese. Most of the
2
ground water sample which are analized in TL— ITB Laboratory
(Laboratory of Environmental Engineering—ITB) contained Iron
and Manganese higher in concentration that is allowed for
drinking water. Thus an alternative treatment for Iron and
Manganese that can be applied efectively and.ëficiently had
to be constructed.
IOBJECTIVE OF THE STUDY
The aim of this work paper is to develop a process and to
design an instrument that is usable and- applicable in
reducing the concentration of Iron and Manganese on water
resources that are used for domestic purposes.
The objective is to create a healthier community by
accustoming them to use clean and save water, and also help
the community, especially in the slum area to solve the
problem of providing drinking water with an eficient and
economical water management.
The study and research had been done in two locations, i.e
1. Research in the Laboratorium.
2. Field study , which was done in Sekelimus Village, sub-
district Batununggal, Bandung.
BACKGROUNDOF THE STUDY
The quality of groundwater depends on the composition of the
soil lining which are passed by that water. Soil lining in
Indonesia usually are products of volcanic stones sedimenta-
3
tion which contain high concentration of iron and manganese,
for example the latosol soil. Iron and Manganese dissolve
easily in water, that is why generally the groundwater in
Indonesia contain high enough concentration of Iron and
Manganese. -
Naturally Iron and Manganese can be found in the form of
Ferrous Bicarbonate, Ferrous Hidroxide, Ferrous Sulfate,
Organic Iron, Mangan Bicarbonate and Mangan Sulfate.
Fe and Mn in water could produce color, Ferrous Oxide could
produce red color in water and Manganese Oxide could change
the color of water to brownish black. The presence of iron
and manganese in water could caused health hazzard, produce
spots on clothes and other appliances. Beside that Fe and Mn
could also support the growth of microorganisms which could
reduce the pipe’s efectivity. -
In water, iron present in a soluble form, colorless and its
solubility would increase with the increase of soluble
Carbon Dioxide (C02). Water containing Ferrous Bicarbonate
when contacted with Oxygen would form white preàipitate,
which turned yellowish and then turned again to brownish red
precipitate of Ferrous Oxyde 7). -
THE PROCESSOF SEPARATING IRON FROMWATER
The process of reducting the concentration of iron from
water could be done in various way, i.e. 3,4,6,7):
4
— Aeration, Precipitation, Filtration.
— Na—Cation Exchanger, Water Softening Process.
- Hydrogen—Cation Exchanger.
— Lime Soda Water Softening.
- Two Stage Lime and Soda Na—Exchanger.
— Converting Manganese > Zeolith.
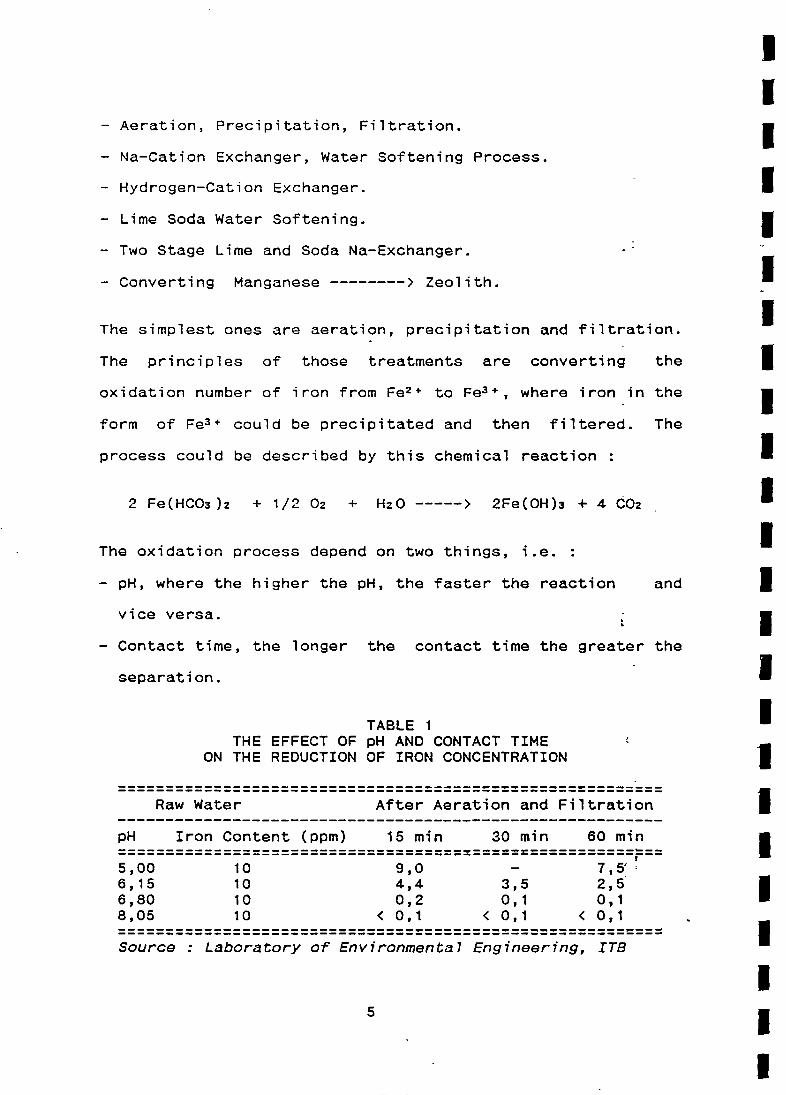
The simplest ones are aeration, precipitation and filtration.
The principles of those treatments are converting the
oxidation number of iron from Fe24 to Fe34’, where iron in the
form of Fe3’ could be precipitated and then filtered. The
process could be described by this chemical reaction
2 Fe(HCO3 )2 + 1/2 02 + HzO > 2Fe(OH)3 + 4 COz -
The oxidation process depend on two things, i.e. :
— pH, where the higher the pH, the faster the reaction and
vice versa.
— Contact time, the longer the contact time the greater the
separation.
TABLE ITHE EFFECT OF pH AND CONTACTTIME
ON THE REDUCTION OF IRON CONCENTRATION
Raw Water After Aeration and Filtration
pH Iron Content (ppm) 15 mm 30 mm 60 mm
5,00 10 9,0 — 7,5’6,15 10 4,4 3,5 2,56,80 10 0,2 0,1 0,18,05 10 < 0,1 < 0,1 < 0,1
Source : Laboratory of Environmental Engineering, ITB
5
THE PROCESSOF SEPARATING MANGANESEFROM WATER
The presence of manganese ions in ground water greatly
coincide with the kind and condition of the soil lining and
soil surface of the area. In nature we could find manganese
in compounding form such as : MnO, MnCo and MnSiO.
Methodes that can be applied to separate manganese from water
are as follow 3 ,4 ,6 ,7) :.
— Aeration, Precipitation, Filtration.
— Na-Cation Exchanger.
— Hydrogen Cation—Exchanger Process.
— Lime Soda Water Softening Process.
- Manganese Zeolite.
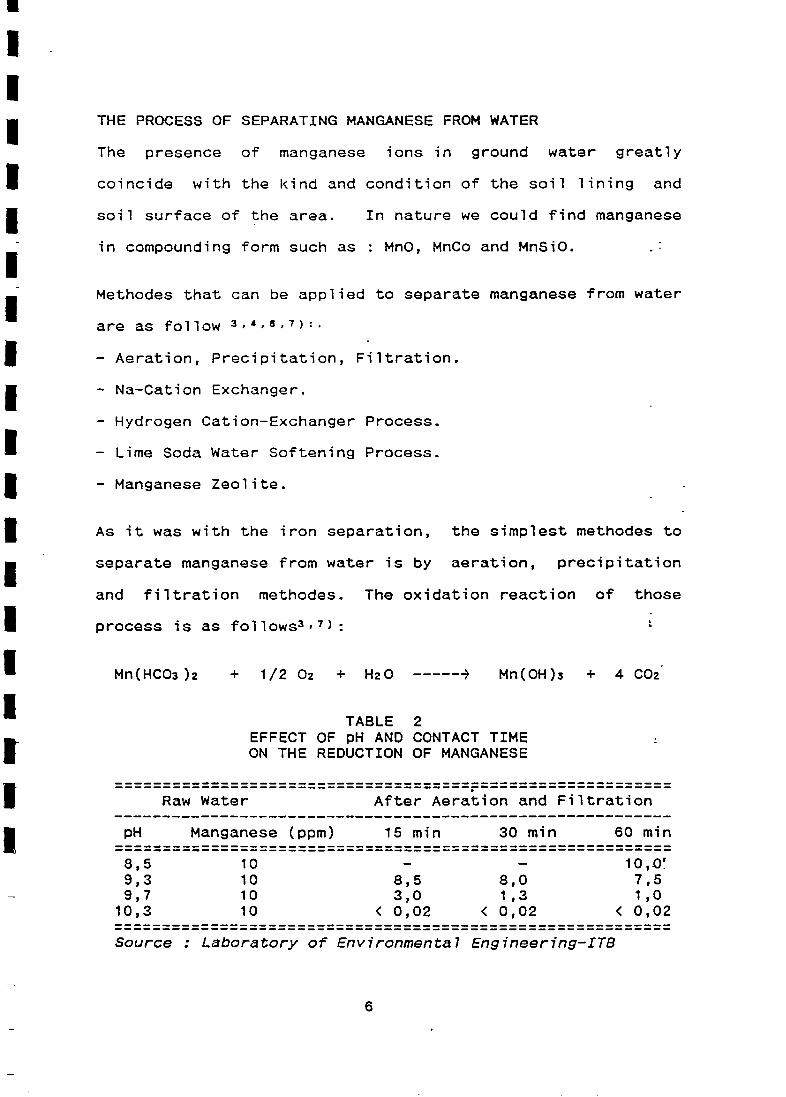
As it was with the iron separation, the simplest methodes to
separate manganese from water is by aeration, precipitation
and filtration methodes. The oxidation reaction of those
process is as follows3’7):
Mn(HCO3)z + 1/2 02 + HzO ~ Mn(OH)~ + 4 CO~
TABLE 2EFFECT OF pH AND CONTACTTIMEON THE REDUCTIONOF MANGANESE
Raw Water After Aeration and Filtration
pH Manganese (ppm) 15 mm 30 mm 60 mm
8,5 10 — — 10,0!9,3 10 8,5 8,0 7,59,7 10 3,0 1,3 1,0
10,3 10 < 0,02 < 0,02 < 0,02
Source : Laboratory of Environmental Engineering—ITB
6
AERATION PROCESS
The aeration process that describe here is the entering of
air which contain oxygen into the water. The oxygen which
entered into the water would then be used to oxydate the
solute Fe and Mn to the precipitate form. Aeration is a
process of gas transfer.5) This process are influenced by
several factors
— The original condition of the gas, which is generally
expressed in the form of spesific gas coeffisient or
coeffisient distribution of ko . ko C~/ Cg
Where : C~= Saturated concentration of gas in the gas
phase (g/m3)
C9 = Concentration of gas in gas phase (g/m
3)
saturated concentration of gas in the gas
is related to the partial pressure of the
phase. That condition is expressed in the
C~ = kh .
kh = The constant number of Henry
p = The partial pressure of the gas
temperature of water.
impuritical condition of the water.
concentration of the related gas.
In this aeration process, the most important factor is the
difusion fenomena. Difusion is a tendency of a substance, in
this case is air filled with oxygen, to extend itself all
over an empty space. The difusion of gas in the gas phase is
I
— The -
which
the gas
Law
Where
phase,
gas in
Henry’s
- The
- The
— The
7
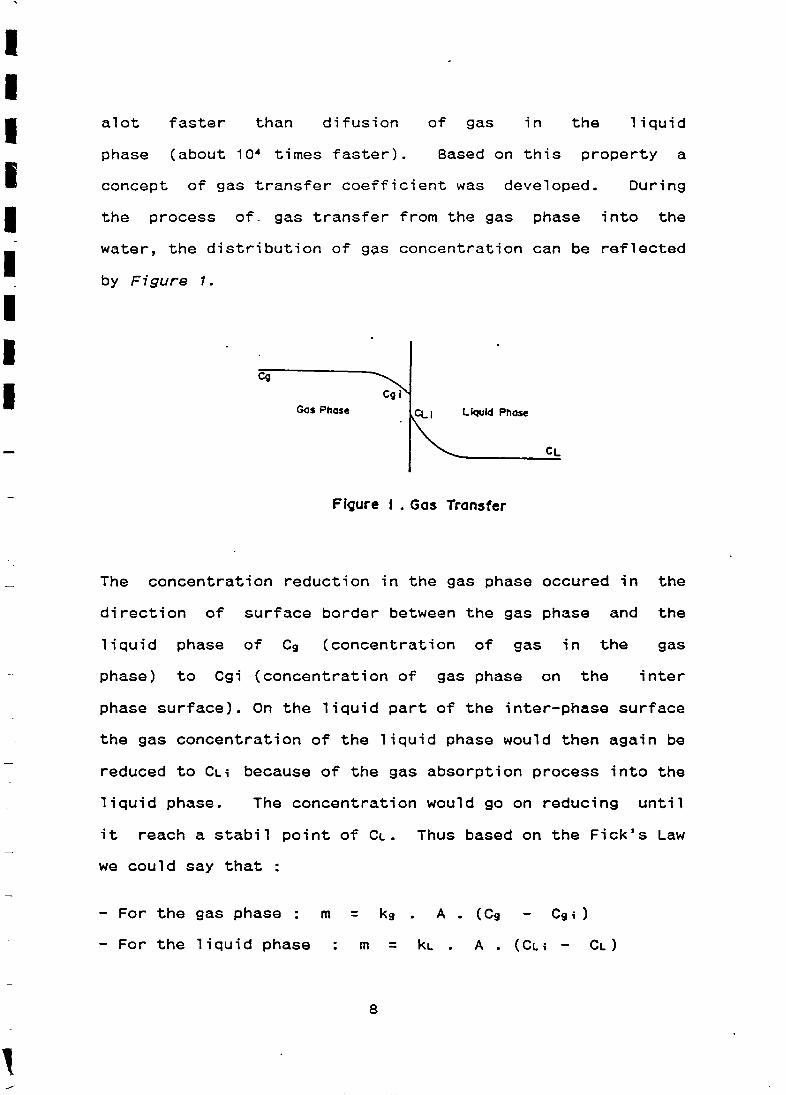
alot faster than difusion of gas in the liquid
phase (about 10’ times faster). Based on this property a
concept of gas transfer coefficient was developed. During
the process of. gas transfer from the gas phase into the
water, the distribution of g~s concentration can be reflected
by Figure 1.
Figure I . Gas Transfer
The concentration reduction in the gas phase occured in the
direction of surface border between the gas phase and the
liquid phase of C9 (concentration of gas in the gas
phase) to Cgi (concentration of gas phase on the inter
phase surface). On the liquid part of the inter—phase surface
the gas concentration of the liquid phase would then again be
reduced to Cii because of the gas absorption process into the
liquid phase. The concentration would go on reducing until
it reach a stabil point of Ci. Thus based on the Fick’s Law
we could say that
— For the gas phase : m = k9 . A . (C~ — Cii)
— For the liquid phase : m = ki . A . (Cii — Ci)
Cg
Gas Phase Liquid Phase
8
Where : m = mass that being transported per time unit
(g/sec)
kg = partial gas transfer coefficient for the
gas phase (m/sec)
kL. = partial gas transfer coefficient for the
liquid phase (m/sec)
A = the width of the inter phase surface
1+
kL k9
Combiningly, the total gas transfer coefficient KL
1= (sec/rn)
Kt.
The total mass transport
n = A . Ki. . (ko . C9 — CL) (g/sec)
FILTRATION
Filtration is a refining process. The media that could be
used as filters is the granular media such as silica sand,
anthracite grains, magnet ite grains, and granite sand.
Because of its granular property, the structure of the sand
filter consist of porous between each particle which enables
water to pass through, but would prevent other materials of
larger sizes than each porous of passing through. The soluble
Fe and Mn after being oxidized would become precipitate that
will be filtered on the sand filter.
IIIII1I
I9
The properties which influenced the capacity of the filter
media on the filtration process are the size and shape of
each particle and also the particle size distribution. On
the sand filter the term efective size (E) is recognized as
the size of particle on the 10 percentage of the smallest
size distribution, and the coefficient of nonuniformity (U)
which is the ratio of the particle’s size on the 60 percen-
tage distribution and the particle’s size on the 10
percentage distribution.
E = P-to and U = P60 / P-to
The sand that is used as the filter media could be activated
with the use of KMnO4 solutions. The KMnO4 activated sand
would then posses MnOz lining which could function as
autocatalysator and help in the oxidation process of soluble
Fe and Mn in water.
ACTIVATED DRY SAND FILTER
Activated dry sand filter is a filter which utilized
granular media and is operated in a certain way so that the
filter is not submerged in the water being filtered. In that
condition the activated dry sand filter is a system which
combined the aeration and filtration process on a sand filter
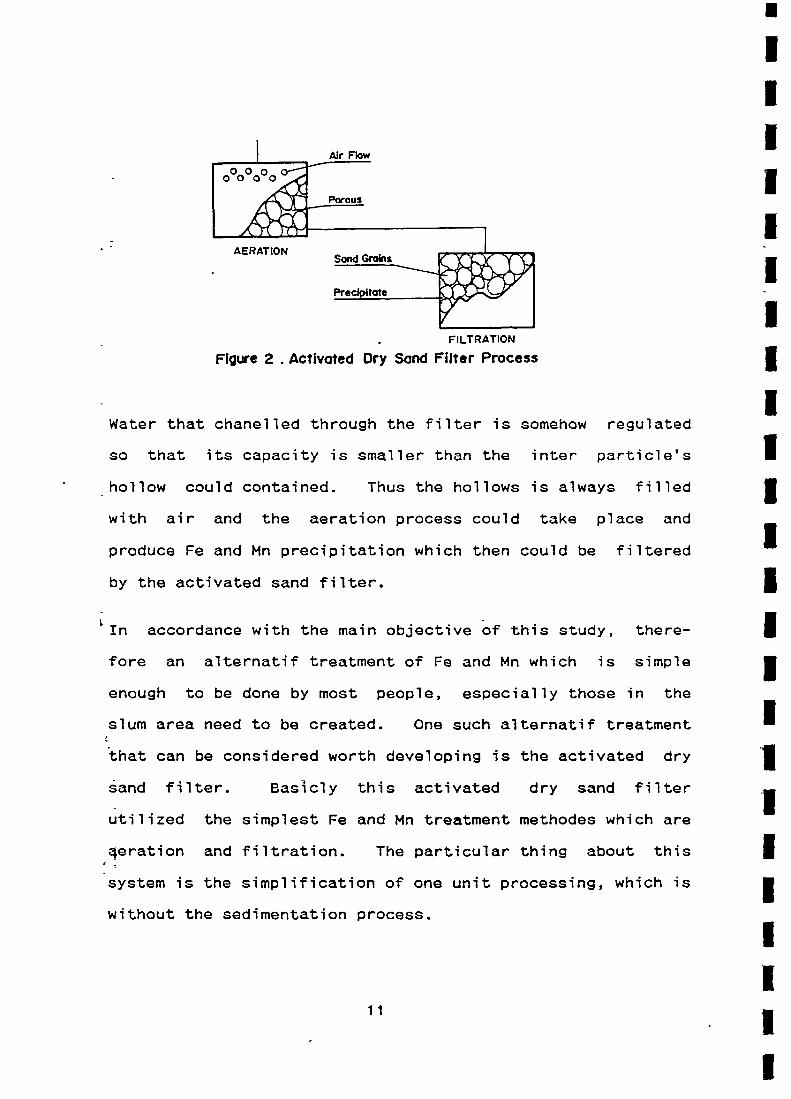
media. The basic principle of how the activated dry sand
filter works are as follows (Figure 2)
10
FILTRATION
FIgure 2 . Activated Dry Sand Filter Process I
Water that chanelled through the filter is somehow regulated
so that its capacity is smaller than the inter particle’s
hollow could contained. Thus the hollows is always filled
with air and the aeration process could take place and
produce Fe and Mn precipitation which then could be filtered
by the activated sand filter.
In accordance with the main objective of this study, there-
fore an alternatif treatment of Fe and Mn which is simple
enough to be done by most people, especially those in the
slum area need to be created. One such alternatif treatment
that can be considered worth developing is the activated dry
sand filter. Basicly this activated dry sand filter
utilized the simplest Fe and Mn treatment methodes which are
qeration and filtration. The particular thing about this
system is the simplification of one unit processing, which is
without the sedimentation process.
AERATION
11
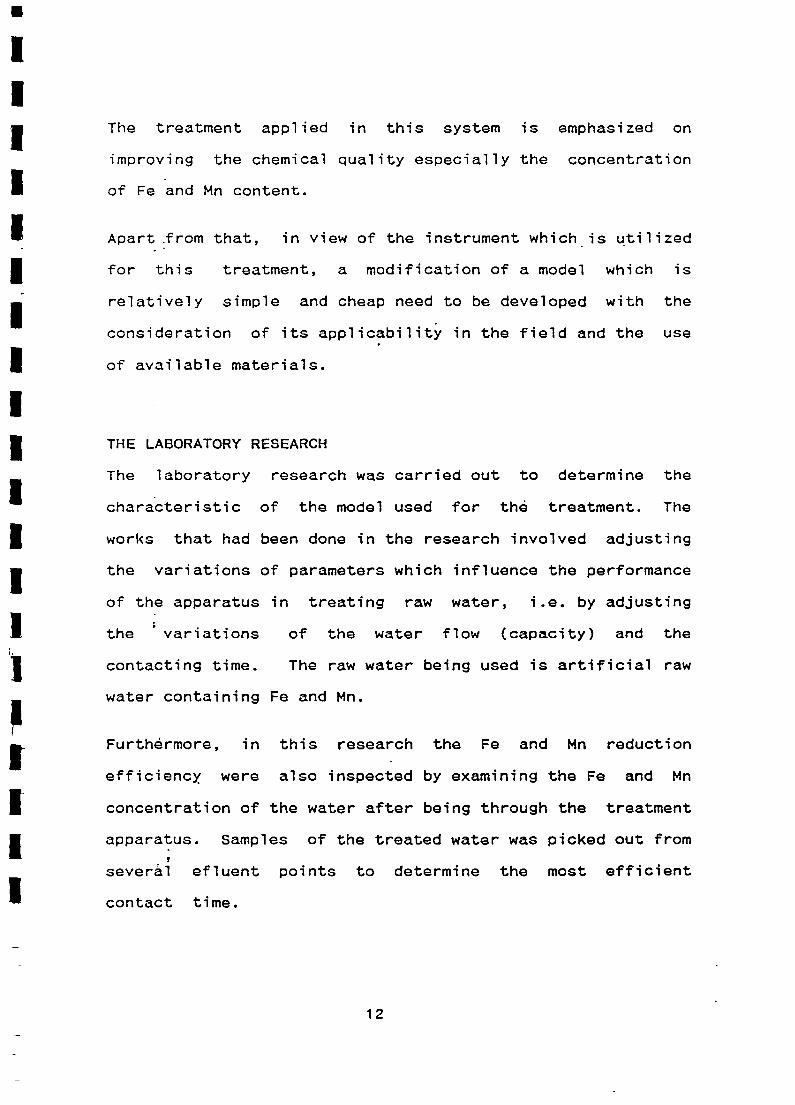
The treatment applied in this system is emphasized on
improving the chemical quality especially the concentration
of Fe and Mn content.
Apart :from that, in view of the instrument which is utilized
for this treatment, a modification of a model which is
relatively simple and cheap need to be developed with the
consideration of its applicability in the field and the use
of available materials.
THE LABORATORYRESEARCH
The laboratory research was carried out to determine the
characteristic of the model used for the treatment. The
works that had been done in the research involved adjusting
the variations of parameters which influence the performance
of the apparatus in treating raw water, i.e. by adjusting
the variations of the water flow (capacity) and the
contacting time. The raw water being used is artificial raw
water containing Fe and Mn.
Furthermore, in this research the Fe and Mn reduction
efficiency were also inspected by examining the Fe and Mn
concentration 0f the water after being through the treatment
apparatus. Samples of the treated water was picked out from
several efluent points to determine the most efficient
contact time.
12
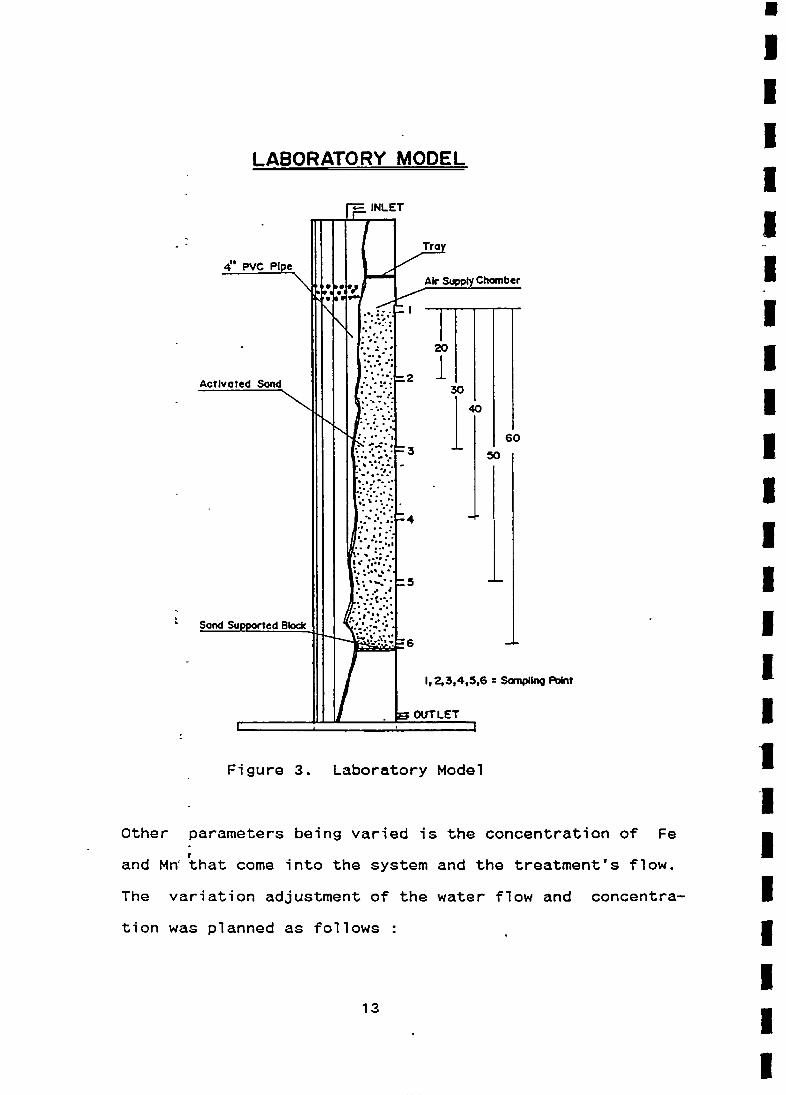
LABORATORY MODEL
Figure 3. Laboratory Model
1Other parameters being varied is the concentration of Fe
and Mn’ that come into the system and the treatment’s flow.
The variation adjustment of the water flow and concentra-
tion was planned as follows : -
INLET
Chamber
60
50
1,2,3,4,5,6 SamplIng POint
13
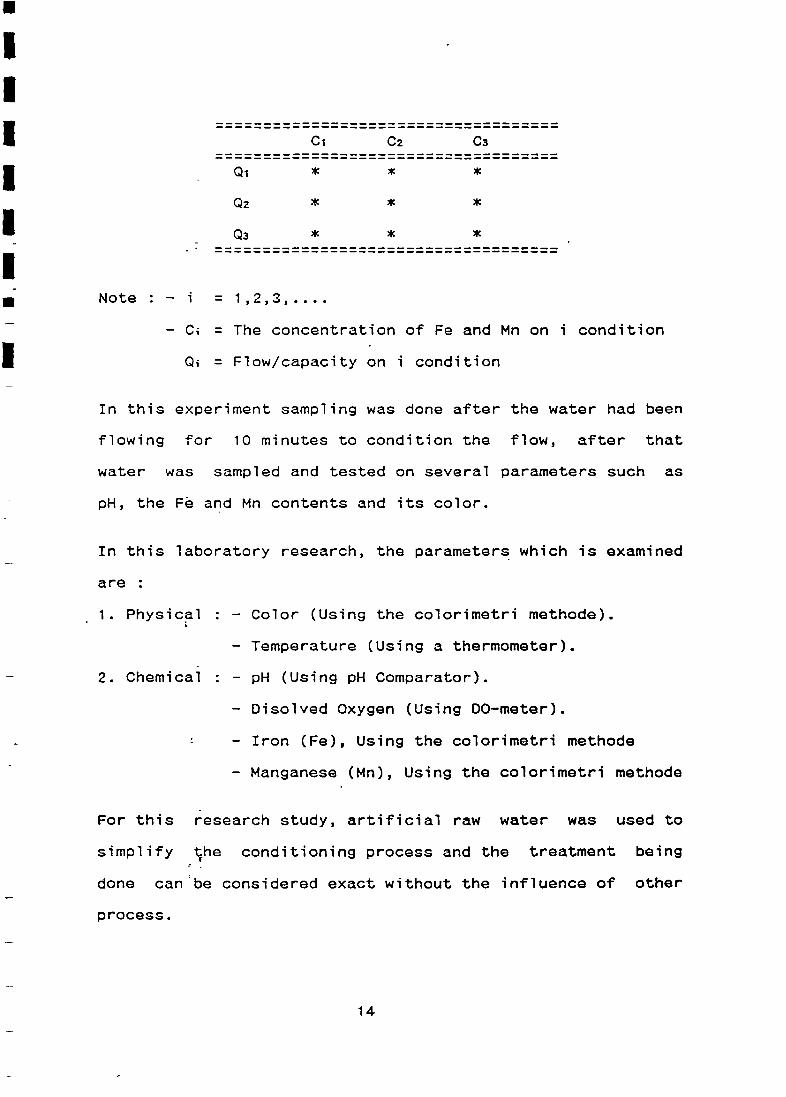
Ci C2 C3
Qi * *
Q2 *
Q~ * * *
Note : — i
— Ci
Qi
= 1,2,3
= The concentration of Fe and Mn on i condition
= Flow/capacity on i condition
In this experiment sampling was done after the water had been
flowing for 10 minutes to condition the flow, after that
water was sampled and tested on several parameters such as
pH, the Fe and Mn contents and its color.
In this laboratory research, the parameters which is examined
are
1. Physical
2. Chemical
— Color (Using the colorimetri methode).
— Temperature (Using a thermometer).
— pH (Using pH Comparator).
— Disolved Oxygen (Using DO—meter).
— Iron (Fe), Using the colorimetri methode
— Manganese (Mn), Using the colorimetri methode
For this research study, artificial raw water was used to
simplify ;he conditioning process and the treatment being
done canbe considered exact without the influence of other
process.
* *
14
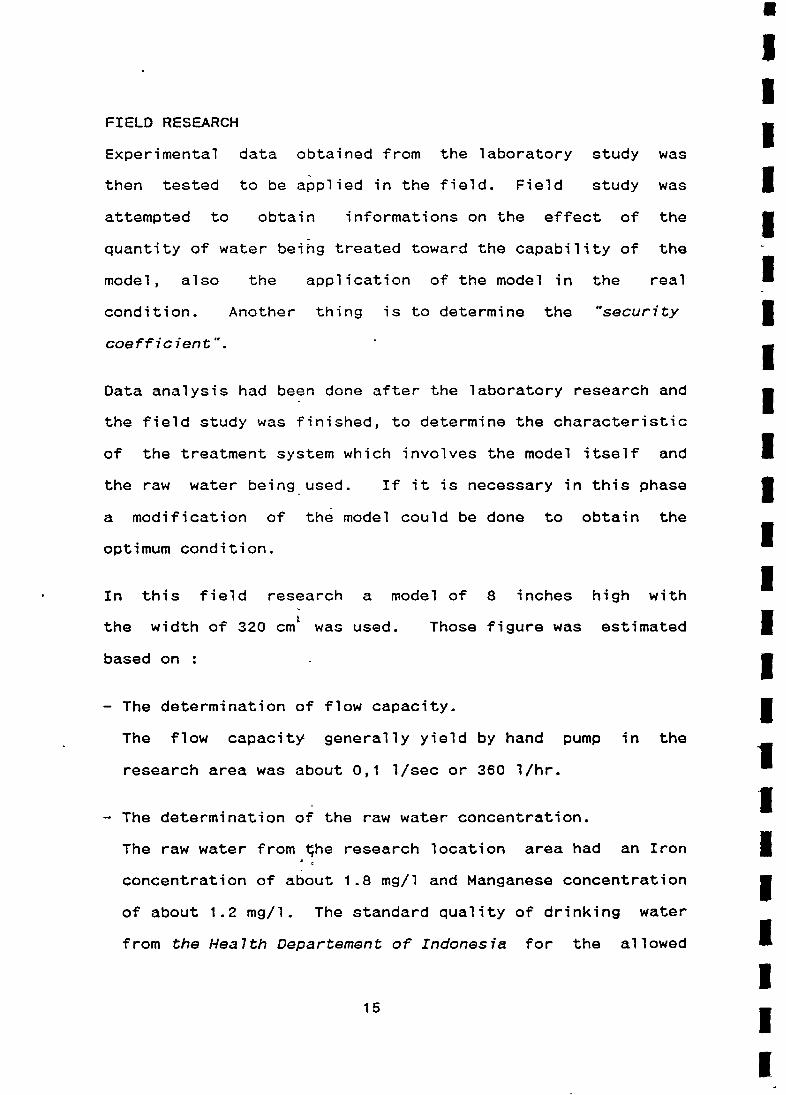
FIELD RESEARCH
Experimental data obtained from the laboratory study was
then tested to be applied in the field. Field study was
attempted to obtain informations on the effect of the
quantity of water being treated toward the capability of the
model, also the application of the model in the real
condition. Another thing is to determine the “security
coefficient~~.
Data analysis had been done after the laboratory research and
the field study was finished, to determine the characteristic
of the treatment system which involves the model itself and
the raw water being used. If it is necessary in this phase
a modification of the model could be done to obtain the
optimum condition.
In this field research a model of 8 inches high with
the width of 320 cm~ was used. Those figure was estimated
basedon: - I— The determination of flow capacity.
The flow capacity generally yield by hand pump in the
research area was about 0,1 1/sec or 360 1/hr.
— The determination of the raw water concentration.
The raw water from Ihe research location area had an Iron
concentration of about 1.8 mg/i and Manganese concentration
of about 1.2 mg/l. The standard quality of drinking water
from the Health Departement of Indonesia for the allowed
15
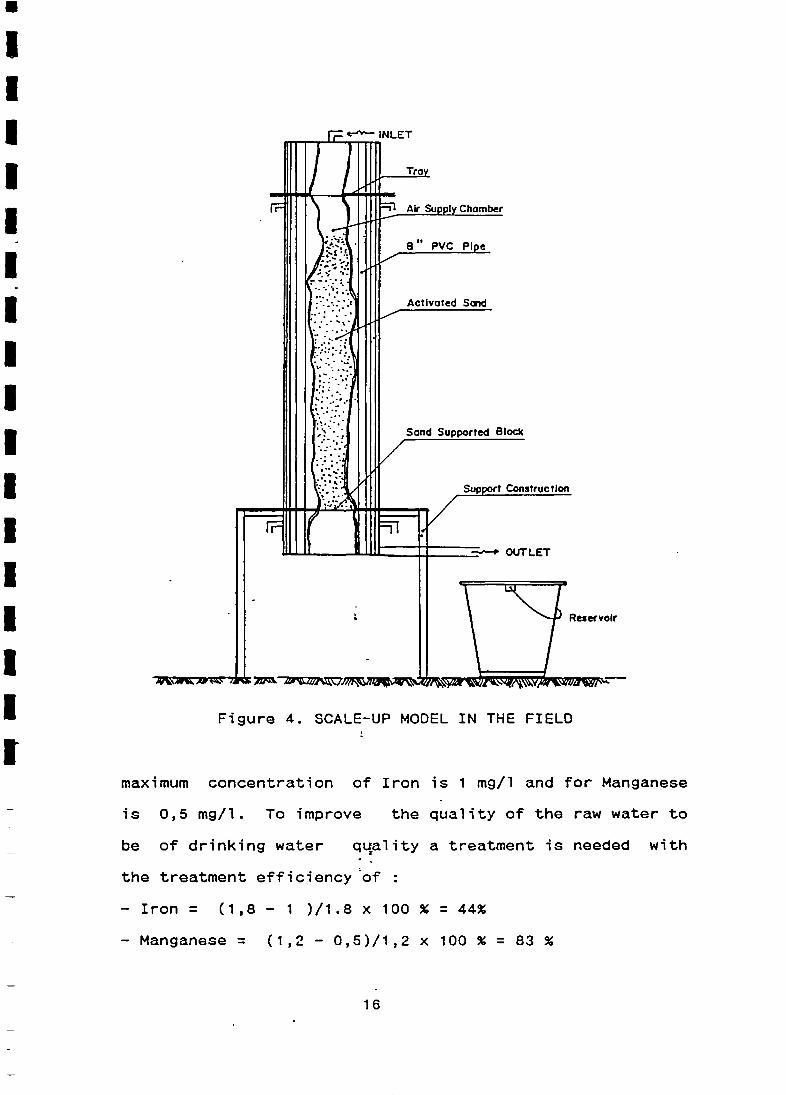
Figure 4. SCALE—UPMODEL IN THE FIELD
maximum concentration of Iron
is 0,5 mg/i. To improve the
be of drinking water q~ality
the treatment efficiency of
— Iron = (1,8 — 1 )/1.8 x 100 % = 44%
— Manganese = (1,2 — 0,5)/1,2 x 100 % = 83 %
Block
is 1 mg/l and for Manganese
quality of the raw water to
a treatment is needed with
16
The step to determine the dimension of the apparatus is
* Formating The Theoretical Dimension.
1. Determine the concentratfon of raw water
2. Determine the reduction efficiency of Fe and Mn needed
3. Estimate the desired thi.c~kness
4. By looking at the model characteristic graph the capa-
city (Q) can be determine from the area of 81 cm2
5. Determine the treatment-capacity.
6. The area of the surface needed can then also be calcu—
lated. - I* Formating The Real Dimension
The real dimension can be determine from the greatest
result of the theoretical dimension for the reduction of
Iron and Manganese, and multiply them by the “security” -
coefficient. I
* Example (For Field Study) :
A. Theoretical Diameter -
-Iron
1. The concentration of raw water = 1,8 mg/i
2. Efficiency = 44 % -
3. The estimated thickness = 80 cm
4. We get Q = larger than 60 l/hr, Assumed = 150 1/hr
5. The treatment capaclEy = 360 1/hr
6. The surface A = 360/150 X the research surface A
= 2,4 x A
17
- Manganese
1. The concentration raw water = 1,2 mg/l
2. Efficiency = 83 %
3. The estimated thickness = 80 cm
4. We got Q = alot largerthan 49 1/hr
Assumed 120 1/hr
5. The treatment capacity = 360 1/hr
6. The surface A = 360/120 x surface research of A
= 3xA
B. The Real Diameter
The largest area is for Manganese which is 3 times the
surface (A). The “security coefficient” have not been
looked at, if we took 1,25 as the “security coefficient”
therefore the surface area needed is 1,25 x 81 cm2 or
101,25 cm2 or with the diameter of 4,5 inch.
From the results of laboratory research and the calcula-
tion above the diameter used for that condition is 8
inches with the sand thickness of 80 cm.
One of the objective of this field research is to determine
the operating time (the distance between each washing or the
total amount of water that can be treated), where the
operating time of this model is ~long enough which is about 3
months.
The amount of water that can be treated can be calculated as
follows (Figure comes from datas)
18
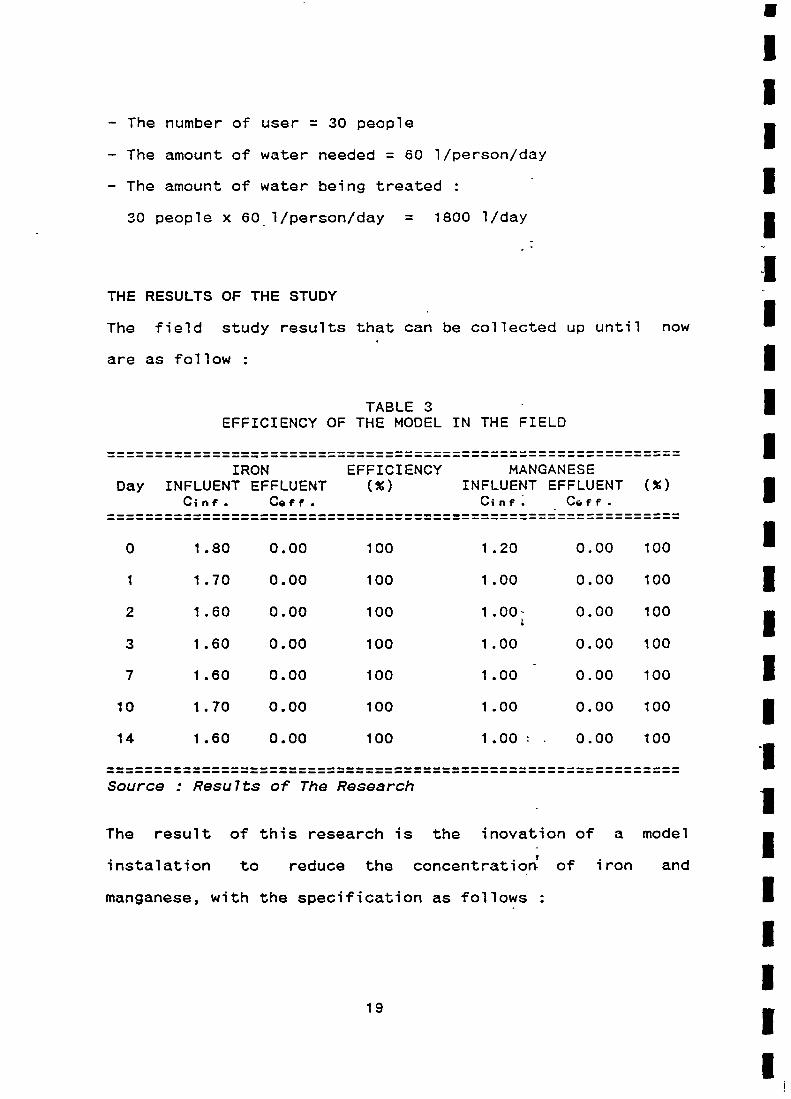
— The number of user = 30 people
— The amount of water needed = 60 1/person/day
— The amount of water being treated : -
30 people x 60 1/person/day = 1800 1/day
-- ITHE RESULTS OF THE STUDY
The field study results that can be collected up until now
are as follow : 1TABLE 3 -
EFFICIENCY OF THE MODEL IN THE FIELD
IRON EFFICIENCY MANGANESEDay INFLUENT EFFLUENT (%) INFLUENT EFFLUENT (%)
Cinq. C~cf. C~nc~ -
0 1.80 0.00 100 1.20 0.00 100
1 1.70 0.00 100 1.00 0.00 100
2 1.60 0.00 100 1.00- 0.00 100
3 1.60 0.00 100 1.00 0.00 100
7 1.60 0.00 100 1.00 - 0.00 100
10 1.70 0.00 100 1.00 0.00 100
14 1.60 0.00 100 1.00 - 0.00 100
Source : Results of The Research
The result of this research is the inovation of a model
instalation to reduce the concentration~ of iron and
manganese, with the specification as follows
19
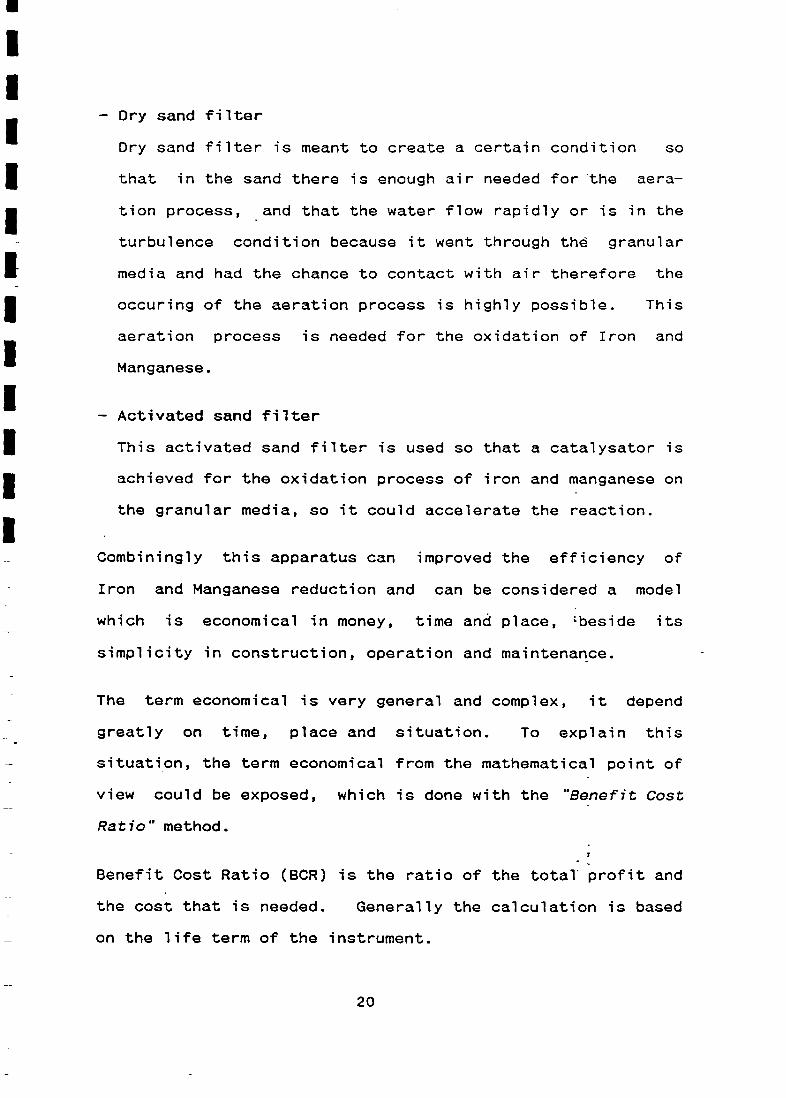
— Dry sand filter
Dry sand filter is meant to create a certain condition so
that in the sand there is enough air needed for the aera-
tion process, and that the water flow rapidly or is in the
turbulence condition because it went through th~ granular
media and had the chance to contact with air therefore the
occuring of the aeration process is highly possible. This
aeration process is needed for the oxidation of Iron and
Manganese.
— Activated sand filter
This activated sand filter is used so that a catalysator is
achieved for the oxidation process of iron and manganese on
the granular media, so it could accelerate the reaction.
Combiningly this apparatus can improved the efficiency of
Iron and Manganese reduction and can be considered a model
which is economical in money, time and place, ~beside its
simplicity in construction, operation and maintenance.
The term economical is very general and complex, it depend
greatly on time, place and situation. To explain this
situation, the term economical from the mathematical point of
view could be exposed, which is done with the “Benefit Cost
Ratio” method.
Benefit Cost Ratio (BCR) is the ratio of the total profit and
the cost that is needed. Generally the calculation is based
on the life term of the instrument.
20
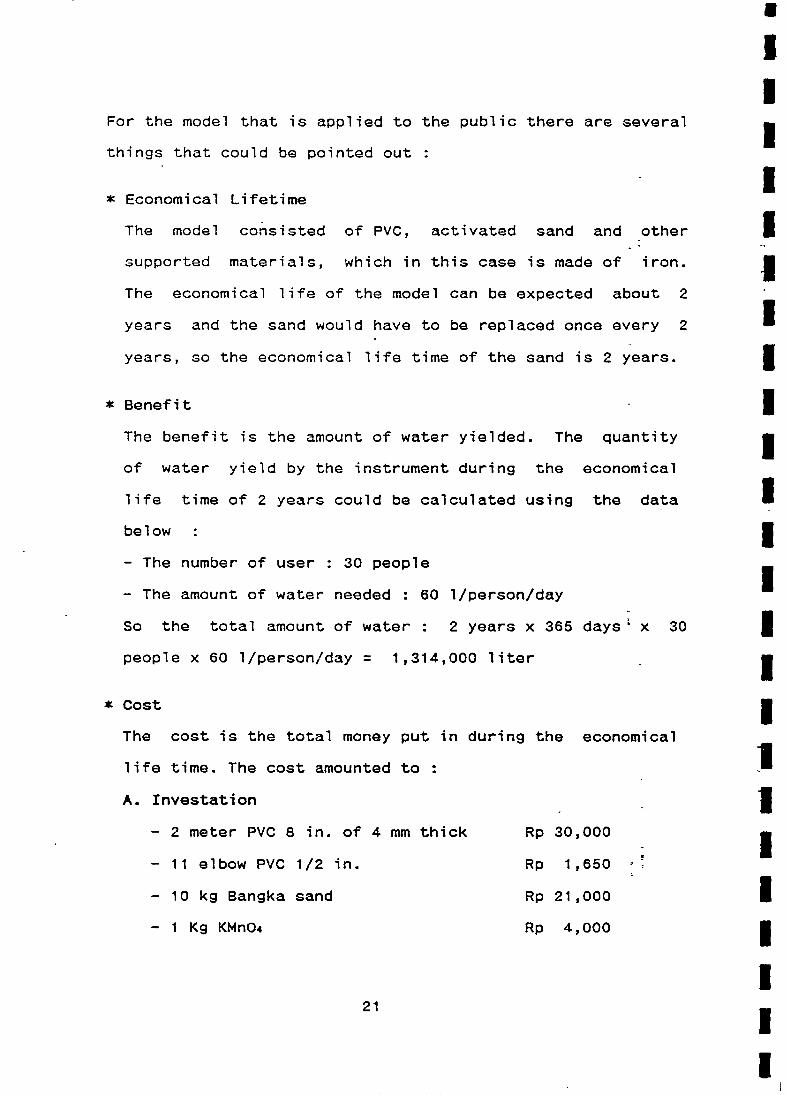
For the model that is applied to the public there are several
things that could be pointed out
* Economical Lifetime
The model consisted of PVC, activated sand and other
supported materials, which in this case is made of iron.
The economical life of the model can be expected about 2
years and the sand would have to be replaced once every 2
years, so the economical life time of the sand is 2 years.
* Benefit - IThe benefit is the amount of water yielded. The quantity
of water yield by the instrument during the economical
life time of 2 years could be calculated using the data
below : I— The number of user : 30 people
— The amount of water needed : 60 1/person/day
So the total amount of water : 2 years x 365 days x 30
people x 60 1/person/day 1,314,000 liter -
*Cost IThe cost is the total money put in during the economical
life time. The cost amounted to : -
A. Investation - - I— 2 meter PVC 8 in. of 4 mm thick Rp 30,000
— 11 elbow PVC 1/2 in. Rp 1,650 :‘
— 10 kg Bangka sand Rp 21,000
— 1 Kg KMnO4 Rp 4,000
21
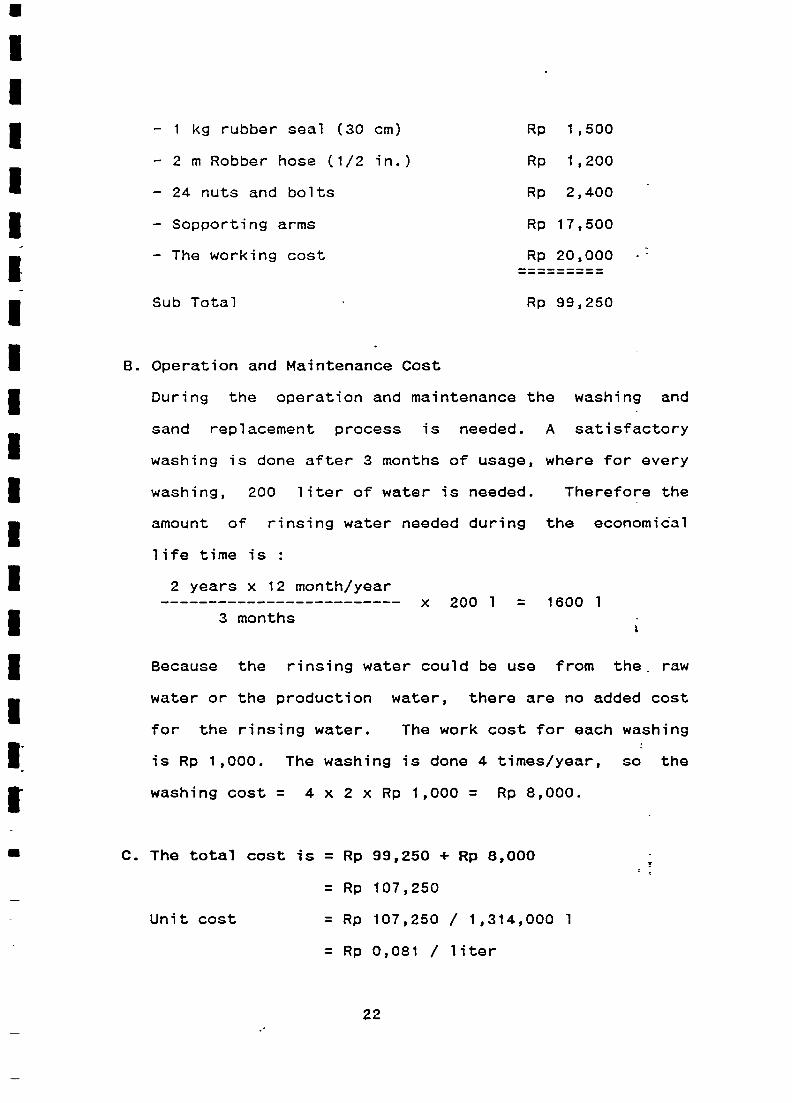
— 1 kg rubber seal (30 cm) Rp 1,500
— 2 m Robber hose (1/2 in.) Rp 1,200
— 24 nuts and bolts Rp 2,400 -
— Sopporting arms Rp 17,500
— The working cost Rp 20,000
Sub Total - Rp 99,250
B. Operation and Maintenance Cost
During the operation and maintenance the washing and
sand replacement process is needed. A satisfactory
washing -is done after 3 months of usage, where for every
washing, 200 liter of water is needed. Therefore the
amount of rinsing water needed during the economical
life time is
2 years x 12 month/yearx 200 1 = 1600 1
3 months -
Because the rinsing water could be use from the. raw
water or the production water, there are no added cost
for the rinsing water. The work cost for each washing
is Rp 1,000. The washing is done 4 times/year, so the
washing cost = 4 x 2 x Rp 1,000 = Rp 8,000.
99,250 + Rp 8,000
107,250
107,250 / 1,314,000 1
= Rp 0,081 / liter
C. The total cost is = Rp
Unit cost
= Rp
= Rp
22
a
II
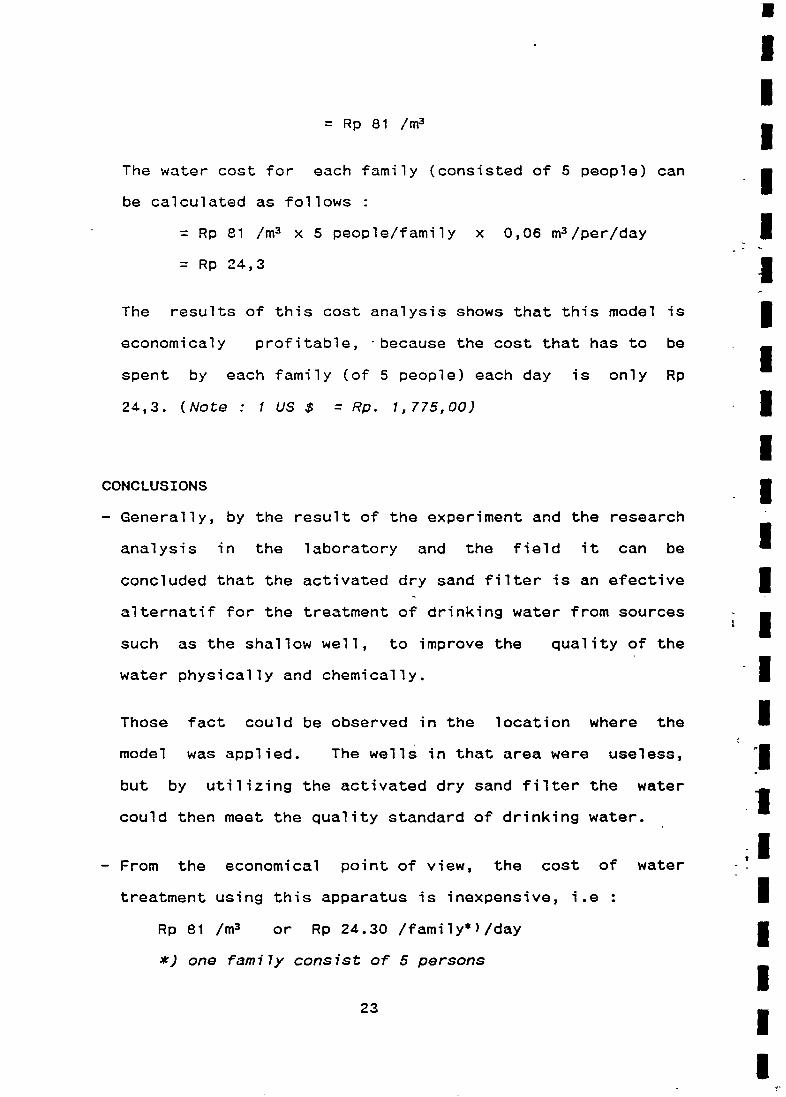
= Rp 81 /m3
The water cost for each family (consisted of 5 people) can -
be calculated as follows
= Rp 81 /m3 x 5 people/family x 0,06 m3/per/day - IRp24,3
The results of this cost analysis shows that this model is
economicaly profitable, -becausethe cost that has to be -
spent by each family (of 5 people) each day is only Rp
24,3. (Note 1 US $ = Rp. 1,775,00) -
ICONCLUSIONS - I— Generally, by the result of the experiment and the research -
analysis in the laboratory and the field it can be
concluded that the activated dry sand filter is an efective Ialternatif for the treatment of drinking water from sources Isuch as the shallow well, to improve the quality of the
water physically and chemically. - IThose fact could be observed in the location where the
model was applied. The wells in that area were useless,
but by utilizing the activated dry sand filter the water
could then meet the quality standard of drinking water. -
1— From the economical point of view, the cost of water
treatment using this apparatus is inexpensive, i.e : IRp 81 /m3 or Rp 24.30 /family*)/day I*) one fami7y consist of 5 persons
23 I
I
As a comparation the price of water from The Bandung Water
Supply Company PDAM in Bandung is Rp 140 /m3.
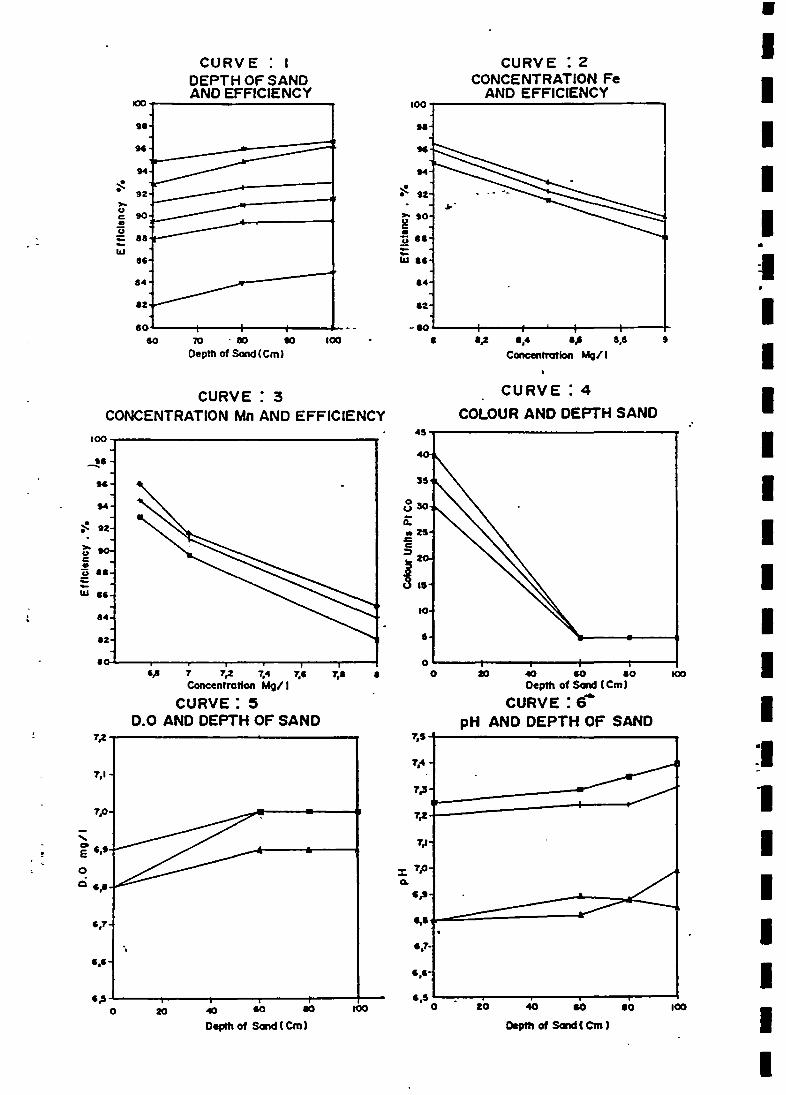
— The efficiency of the activated dry sand filter is depend
on
1. Loading, which are consisted of
* The concentration of raw water (Co)
* The flow capacity per unit processing area (Q/A)
2. The sand filter thickness (h)
In the water treatment process, the most important factors
are the raw water concentration and the quality standard
for drinking water, while efficiency is only a target.
Based on those facts, it can be conclude that for the
treatment of raw water the treatment efficiency does not
need to be 100 %, most importantly is that the quality
standard for drinking water is fulfilled. If the raw water
concentration is known, the efficiency of the treatment
could then be determine, based on the model’s
characteristics the flow capacity per unit processing area
for a certain thickness also could be determine. Eventually
the dimension of the model needed for the water treatment
with the desired capacity could be calculated.
— From the results of the study it was also concluded that
the activated dry sand filter could have an influenced on
* Raising the DO (Dissolved Oxygen)
* Raising the pH
* Reducing the color of water
24
RECOMMENDATIONS
Raw water found in nature varies greatly, and its quality
influenced the kind of treatment that needed to be done.
Before the activated dry sand filter could be applied
properly for the treatment of drinking water, first of all a
certain research on the quality of raw water need to be done.
Because not all kind of raw water could be effectively
treated, even though its iron and manganese content is high
enough. Several other components contained in the raw water
could reduce the effectivity of the activated dry sand
filter, those components are called “distrupting components”.
The distrupting componentsthat are commonly found are
a. Bicarbonate (HCO~)
The activated dry sand filter could effectively treated
raw water with a bicarbonate content lower than 500 mg/l.
For raw water with a bicarbonate content higher than 500
mg/l, a pre treatment is neededwhich is in the form of
adding in chlorine. The amount of chlorine needed to be
added is equals to its Chlor Binding Ability (CBA).
Therefore an analysis of the raw water’s CBA needed to be
done.
b. Manganese organic
Manganese organic is the manganese ion which reacted with
organical compounds and form a bond. Natural water which
is usually contain manganese organic is water from swamp
coastal region. To treat raw water containing manganese
25
organic a pre—treatment unit is needed to eliminate the
organic matter. Treatment unit which is generally applied
to eliminate organic matter is chlorination with the use
of chlorine. -
The reduction of iron and manganese is closely related to the
acidity (pH). The reduction process will proceed effectively
in the pH higher than 8. From the experiment it can be shown
that on the pH of about 7 (6,6 — 6,8) the activated dry sand
filter is relatively effective in reducing the iron and
manganese content.
To ensure the safety of drinking water, beside considering
the physical and chemical quality, its bacteriological
quality also needed to be considered. The improvement of
bacteriological quality generally could be done with the
simplest methode, which is by boiling it first before
drinking.
oo00000o
26
Is
‘S
94
• 92
Uc 90UU= 88Iii
8S
84
$2
60 70 -80
Depth of Sond(Cm)
IIIIIIIII1IIIIII
CURVE :DEPTH OF SANDAND EFFICIENCY
CURVE : 2CONCENTRATION Fe
AND EFFICIENCY
4
14
.
• 92
10
-; Is
(LI $8
.4
$2
-$010 100 -
CURVE : 3CONCENTRATION Mn AND EFFICIENCY
100
18
$ 1,2 54 5,6 8,8 9
Concentration Mg/ I
- cuRvE:4
COLOUR AND DEPTH SAND
0Ua.
C
IUC0U
Ui
E
0
CURVE: 5D.O AND DEPTH OF SAND
0 10 40 60 50
Depth of Sand (Cm)CURVE :
pH AND DEPTH OF SAND
‘Co
7.4
7.3
7,2
7.’
= 7~00~
5,1
S’s
10 50
D.pthof Sand(Cm)
“~0•4 50 50 100
Ospth of SandCCm)
— — — — — — . ‘~ — — — — — — — — — — U—,— — — — — U
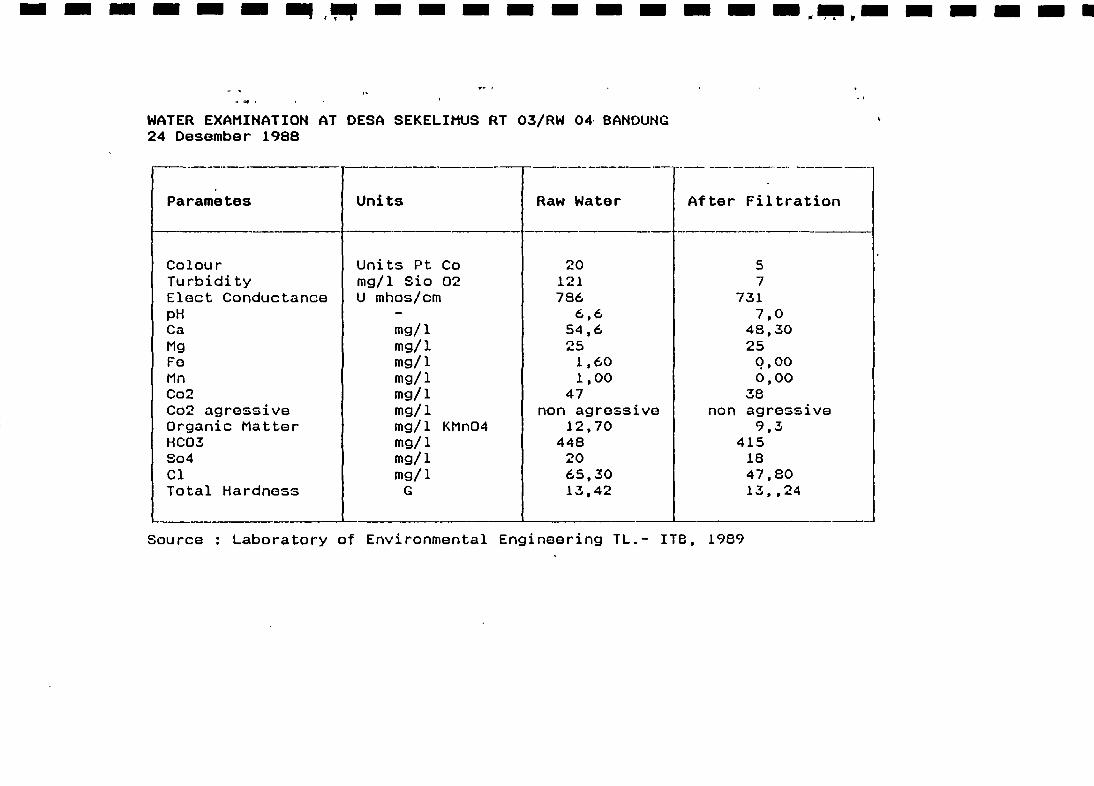
WATER EXAMINATION AT DESA SEKELIM(JS RI 03/RW 04 BANDUNG24 Desember 1988
Units
Units Pt Comg/i Sio 02U mhos/cm
mg/img/img/img/img/img/img/i KMnO4mg/img/img/iG
20121786
6,654,6
1,601,00
47non agressive
12,70448
2065,3013,42
57
7317,0
48,3025
9,000,00
38non agressive
9,3415
1847,8013, ,24
Parametes Raw Water After Fiitration
ColourTurbidityElect ConductancepHCaMgFeMnCo2Co2 agrossiveOrganic MatterHCO38o4CiTotal Hardness
Source : Laboratory of Environmental Engineering IL.- 116, 1989
REFERENCES
1. Al—Layla, M. Anis., Water Supply Engineering Design, Ann
Arbor Science Publishers. Inc, 1978.
2. :Am~i~ Water Works Association., Water quality - and
treatment, 3’~ ed, Mc Graw—Hill Book Co., New York, 1971.
3. Degremont., Water Treatment Handbook,4th ed, Taylor and
Carlisle, New York, 1973.
4. Fair, G.M, J.C. Geyer, D.A Okun., Water and Wastewater
- Engineering, Vol. 2, John Willey & Sons, Inc. USA, Toppan
Company, LTD, Japan, 1968.
5. Poppel., Aeration and Gas Transfer, Deift University of
- Technology, Nederland, 1978.
6. Reynold, Tom 0., Unit Operation and Processes in
Environmental Engineering, Brooks/Cole Engineering
Division, Wadsworth, Inc., Belmont, Calofornia, 1982.
~•: Rich, L.G., Unit Processes of Sanitary Engineering, John
Willey and Sons, New York, 1961.
8. Rich,L.G., Unit Processes of Sanitary Engineering, John
Willey and Sons, New York, 1963.
9. Sawyer, C.N., Chemistry for Sanitary Engineering, Mc Graw
Hill, New York, 1960.
100000000