abstract: the importance of branding fast moving consumer
TRANSCRIPT
UNIVERSITY OF THE WESTERN CAPE
FACULTY OF
ECONOMIC AND MANAGEMENT SCIENCES
THE IMPACT OF UTILITARIAN and HEDONIC NEEDS
SATISFACTION ON BRAND TRUST, BRAND AFFECT AND
BRAND LOYALTY FOR SELECTED FAST MOVING CONSUMER
GOODS IN SOUTH AFRICA
BY
ASHRAF ADAMS
(Student Number: 2725534)
Mini-thesis prepared under the supervision of Dr Helen Inseng Duh and submitted in
partial fulfilment of the requirements for the Degree of Master of Commerce in
Business Management in the School of Business and Finance of the Faculty of
Economic and Management Sciences at the University of Western Cape.
Cape Town, Republic of South Africa
June 2016

EMS (M. BUS. ADMIN. DEGREE) JUNE 2016 i
KEY WORDS
FMCG
Brand trust
Brand affect
Consumer satisfaction
Utilitarian and hedonic values
Behavioural and attitudinal brand loyalty
Western Cape
South Africa

EMS (M. BUS. ADMIN. DEGREE) JUNE 2016 ii
ABSTRACT
The concept of brand loyalty highlights the importance of brands in marketing strategy
development because it leads to a stream of benefits for the company (lower marketing
costs, less price sensitivity, greater market share and greater profits). Questions thus
arise about how brand loyalty is achieved, especially for low involvement product
categories classified as fast moving consumer goods (FMCGs).
Models of how brand loyalty is built have been tested and most agree that brand loyalty
is linked to satisfying customer needs. Knowledge about the type of needs (utilitarian
and hedonic) is however, not usually determined. How the different types of needs first
influence brand trust and brand affect, before affecting consumer satisfaction, also
requires investigation.
This study therefore tested how brand building efforts for some selected FMCG brands
in South Africa impact on brand loyalty, as well as the extent to which utilitarian and
hedonic need satisfaction leads to brand trust and brand affect for these low
involvement products. The study also examined the extent to which brand trust and
affect influence consumer satisfaction, examined as drivers of attitudinal and
behavioural brand loyalty.
Quantitative research methods were used to collect and analyse the data, appropriate
because of the nature of the research (testing relationships between multi-variables),
and the fact that standardised instruments were available to test the proven and valid
variables.
Data was collected from 272 White, Indian, Coloured and Black South Africans living
in Cape Town. The respondents were sampled from malls in Nyanga (targeting Black
consumers, most of whom represent lower income consumers), Mitchell’s Plain
(targeting middle income Coloured and Black consumers), and Canal Walk (targeting
high income White, Coloured, Indian and Black consumers), all of which either have
SPAR, Pick n Pay or Shoprite/Checkers retailers that sell FMCGs. Structural equation
modelling was the main data analysis method for this multivariate investigation.

EMS (M. BUS. ADMIN. DEGREE) JUNE 2016 iii
The results revealed that, unlike studies which suggest that consumers enjoy mainly
utilitarian benefits from FMCGs, both utilitarian and hedonic needs of consumers in the
Western Cape of South Africa are being satisfied for the selected branded FMCG
categories in this study. The results also indicate that consumers develop behavioural
and attitudinal loyalty to FMCG brands, even though they fall in the low involvement
product category. Both brand loyalty types were found to be driven by consumer
satisfaction, which originated from brand trust and found to be outcomes of utilitarian
and hedonic values associated with FMCG brands. While utilitarian values drive brand
trust, hedonic values impacted on both brand trust and brand affect.
This study’s results mean that FMCG brands provide functional, instrumental and
practical benefits (utilitarian values), as well as aesthetic, experiential and enjoyment-
related benefits (hedonic values). The results also showed that consumers tend to rely
on the ability of the brands to perform its stated function (brand trust). Brand trust leads
to consumer satisfaction, which in turn leads consumers to purchase the same brand
repeatedly over time (behavioural loyalty) and to commit to and emotionally connect to
the brands (attitudinal loyalty).
This study differs from most other investigations in that it uncovers drivers of brand
loyalty for low-involvement products and brands classified as FMCGs. Retailers and
FMCG brand owners will be interested to know that they can adapt their brand
communication and advertising strategies to appeal to both functional benefits and
emotional security of their branded FMCG products. This strategy can build trust in the
brands, which strongly predicts satisfaction, which in turn can strongly secure
attitudinal brand loyalty and a greater likelihood of repurchasing of the brand in the
future.

EMS (M. BUS. ADMIN. DEGREE) JUNE 2016 iv
PLAGIARISM DECLARATION
1. I declare that this research mini-thesis has been completed under the guidance
and instruction of Dr Helen Inseng Duh of the University of Witwatersrand,
Gauteng, South Africa, and that the mini-thesis may not be submitted, in whole
or in part, in order to obtain another degree, other than M.Com (Business
Management) at U.W.C.
2. I hereby declare that I know what plagiarism entails, namely to use another’s
work and to present it as my own without attributing the sources in the correct
way.
3. I know that plagiarism is a punishable offence because it constitutes theft and
fraud.
4. I understand the plagiarism policy of the Faculty of Economic and Management
Sciences of the University of the Western Cape.
5. I declare that all the work presented by me in every aspect of the course, is my
own, and where I have made use of another’s work, I have attributed the source
in the correct way.
Ashraf Adams
June 2016

EMS (M. BUS. ADMIN. DEGREE) JUNE 2016 v
DATA DECLARATION
I hereby declare that the data collected to conduct this research was acquired through
mall intercepts from the Nyanga Junction Mall (on the outskirts of Nyanga, Cape
Town), Westgate Mall and Promenade Mall (in Mitchell’s Plain, Cape Town), the
Canal Walk Mall (in Century City, Cape Town) as well some pilot data acquired from
students at staff at the University of Western Cape. I acknowledge that I am fully aware
that any use of the data, other than for the purpose of research, is strictly prohibited and
that the respondents have been guaranteed confidentiality.
Ashraf Adams
June 2016

EMS (M. BUS. ADMIN. DEGREE) JUNE 2016 vi
DEDICATION
The highest glory and thanks to only The Almighty for the strength, guidance,
perseverance and knowledge bestowed on me to start and complete my Masters. I
would also like to thank my family and friends who contributed to my success,
especially my parents, wife and sons who supported and encouraged me through thick
and thin.

EMS (M. BUS. ADMIN. DEGREE) JUNE 2016 vii
ACKNOWLEDGEMENTS
To my supervisor, Dr Helen Inseng Duh: Thank you for continuous support, guidance
and encouragement throughout my studies, as well as theoretical marketing insights and
knowledge. All your contributions are unequivocally appreciated.
I would like to thank Mrs. Lisa Mavundla for being the fieldworker who assisted with
the data collection, especially in cases where her Xhosa and Zulu language skills were
required for accurate data acquisition. I would also like to thank the management and
staff of the Pick n Pay, Shoprite, Checkers and Spar stores where the pre-tested and
final data was collected, for allowing me access to their stores, and for their assistance.
Special thanks to OSMOZ CONSULTING for assisting me in my data analyses.
Finally, I would like to thank all the teaching staff from the University of the Western
Cape who, with passion and patience, continuously broaden and expand my knowledge
in all matters relating to business, finance, and management.

EMS (M. BUS. ADMIN. DEGREE) JUNE 2016 viii
TABLE OF CONTENTS
KEY WORDS ................................................................................................................. I
ABSTRACT ................................................................................................................... II
PLAGIARISM DECLARATION .............................................................................. IV
DATA DECLARATION ............................................................................................... V
DEDICATION ............................................................................................................. VI
ACKNOWLEDGEMENTS ....................................................................................... VII
LIST OF ABBREVIATIONS .................................................................................. XVI
1. INTRODUCTION .................................................................................................. 1
1.1 Introduction ........................................................................................................ 1
1.2 Research Problem ............................................................................................... 2
1.3 Objectives of the Study ...................................................................................... 4
1.4 Description of the Main Concepts of this Study .............................................. 4
1.4.1 Utilitarian value (of a brand) ............................................................................ 4
1.4.2 Hedonic value (of a brand) ............................................................................... 5
1.4.3 Brand trust ........................................................................................................ 5
1.4.4 Brand affect ...................................................................................................... 6
1.4.5 Consumer satisfaction ...................................................................................... 6
1.4.6 The conceptualisation of brand loyalty ............................................................ 7
1.5 Conceptual Model of this Study ........................................................................ 9
1.6 Research Methodology ..................................................................................... 10

EMS (M. BUS. ADMIN. DEGREE) JUNE 2016 ix
1.6.1. Sampling frame, size and method .................................................................. 10
1.6.2. Method of data analyses ................................................................................. 11
1.7 Study Significance ............................................................................................ 11
1.8 Limitations of the Study ................................................................................... 12
1.9 Organisation of the mini-thesis ....................................................................... 12
2. THE FAST MOVING CONSUMER GOODS (FMCG) MARKET ............... 14
2.1 Introduction ...................................................................................................... 14
2.2 Definitions and Characteristics of FMCG ..................................................... 14
2.3 The Global FMCG Industry ............................................................................ 16
2.4 The FMCG Market in Africa .......................................................................... 17
2.5 The FMCG Market in South Africa ............................................................... 19
2.6 Growth Drivers in the FMCG Market ........................................................... 22
2.6.1 Population size................................................................................................ 22
2.6.2 Spending power .............................................................................................. 22
2.6.3 Population density .......................................................................................... 23
2.6.4 Infrastructure development ............................................................................. 24
2.6.5 Downstream industry effectiveness ................................................................ 24
2.6.6 Policy and business legislature ....................................................................... 25
2.7 Key Success Strategies in the FMCG Industry .............................................. 25
2.7.1 Focussing on country clusters ........................................................................ 26
2.7.2 Localising the product offering ...................................................................... 26
2.7.3 Making communication media relevant ......................................................... 26
2.7.4 Creative supply chain usage ........................................................................... 27

EMS (M. BUS. ADMIN. DEGREE) JUNE 2016 x
2.8 Reported Values / Benefits consumers get from FMCGs ............................. 27
2.8.1 Prevention goals and utilitarian benefits vs Promotion goals and hedonic
benefits ....................................................................................................................... 28
2.8.2 Utilitarian benefits and confidence/security vs hedonic benefits and
excitement/cheerfulness ............................................................................................. 29
2.8.3. Utilitarian benefits and satisfaction; hedonic benefits and delight ................. 29
2.8.4. Prevention goals and anger; promotion goals and dissatisfaction .................. 29
2.8.5 Categories of utilitarian and hedonic shopping motivations .......................... 30
2.9 Conclusion ......................................................................................................... 32
3. DRIVERS OF BRAND LOYALTY ................................................................... 33
3.1 Introduction ...................................................................................................... 33
3.2 Definition and Conceptualisation of Brand Loyalty ..................................... 33
3.2.1 Definitions of Brand Loyalty.......................................................................... 34
3.2.2 Philosophical viewpoints of brand loyalty ..................................................... 36
3.3 Brand Benefits leading to Brand Loyalty ....................................................... 40
3.4.1 Functional ....................................................................................................... 40
3.4.2 Symbolic ......................................................................................................... 40
3.4.3 Experiential..................................................................................................... 41
3.4 Benefits of Brand Loyalty ................................................................................ 42
3.4.1 Reduced marketing costs and its affects ......................................................... 42
3.4.2 Strategic barrier to entry for competitors ....................................................... 43
3.4.3 Trade leverage ................................................................................................ 43
3.4.4 Attracting new consumers .............................................................................. 43
3.4.5 Time to respond to competitive threats .......................................................... 43
3.4.6 Higher revenue and profitability for the brand owner .................................... 44
3.4.7 Higher sales volume ....................................................................................... 44
3.4.8 Premium price ability ..................................................................................... 44
3.4.9 Retain rather than seeking new consumers .................................................... 44

EMS (M. BUS. ADMIN. DEGREE) JUNE 2016 xi
3.4.10 Creating positive brand perceptions ............................................................... 45
3.4.11 Increased usage ............................................................................................... 45
3.4.12 Reducing ongoing expenses ........................................................................... 45
3.5 Drivers of Brand Loyalty ................................................................................. 46
3.6 Brand Loyalty Models ...................................................................................... 52
3.6.1 Chitturi et al.’s (2008) model ......................................................................... 52
3.6.2 Chaudhuri and Holbrook’s (2001) model....................................................... 53
3.6.3 Musa’s (2005) model ...................................................................................... 55
3.6.4 Moolla and Bisschoff’s (2013) model ............................................................ 55
3.6.5 This study’s conceptual model ....................................................................... 57
3.7 Conclusion ......................................................................................................... 65
4. RESEARCH METHODOLOGY ........................................................................ 66
4.1 Introduction ...................................................................................................... 66
4.2 Research Objectives and Question.................................................................. 66
4.3 Research design ................................................................................................ 67
4.3.1 Exploratory research ....................................................................................... 67
4.3.2 Descriptive research ....................................................................................... 68
4.3.3 Causal research ............................................................................................... 68
4.4 Research Method .............................................................................................. 69
4.5 Sampling Technique and Procedure ............................................................... 71
4.5.1 Target population............................................................................................ 72
4.5.2 Sample frame .................................................................................................. 72
4.5.3 Sample size ..................................................................................................... 73
4.6 Data Collection.................................................................................................. 73
4.6.1 Survey questionnaire development ................................................................. 74

EMS (M. BUS. ADMIN. DEGREE) JUNE 2016 xii
4.6.2 Data collection procedure ............................................................................... 75
4.6.3 Pilot study ....................................................................................................... 76
4.6.4 Questionnaire for the main study ................................................................... 78
4.7 Data Analysis .................................................................................................... 81
4.7.1 Descriptive statistics ....................................................................................... 81
4.7.2 Structural equation modeling (SEM).............................................................. 82
4.8 Ethical Considerations ..................................................................................... 83
4.9 Conclusion ......................................................................................................... 83
5. RESULTS, DISCUSSIONS, CONCLUSIONS AND RECOMMENDATIONS
................................................................................................................................ 84
5.1 Introduction ...................................................................................................... 84
5.2 Descriptive Statistics ........................................................................................ 84
5.2.1. Socio-demographic data of the respondents ................................................... 84
5.2.2. Descriptive statistics on the mean and reliability of constructs ..................... 86
5.2.3. Correlation between the constructs ................................................................ 87
5.3.1. Confirmatory Factor Analysis (CFA) to test goodness-of-fit (GOF) ............. 88
5.3.2. SEM path modelling and hypotheses testing.................................................. 91
5.4 Discussion of the Results .................................................................................. 95
5.4.1 Do consumers receive hedonic values from FMCGs? ................................... 95
5.4.2 Can consumers be loyal to FMCGs? .............................................................. 96
5.4.3 Relationship between utilitarian brand value (BUV) and brand trust (CBT)
Change your Index/ Contents accordingly ................................................................. 97
5.4.4 Relationship between hedonic value (BHV) and brand trust (CBT) .............. 97
5.4.5 Relationship between hedonic value (BHV) and brand affect (CBA) ........... 98
5.4.6 Relationship between brand trust (CBT) and consumer satisfaction (CSAT) 98
5.4.7 Relationship between consumer satisfaction (CSAT) and behavioural loyalty
(BBL) ........................................................................................................................ 99

EMS (M. BUS. ADMIN. DEGREE) JUNE 2016 xiii
5.4.8 Relationship between consumer satisfaction (CSAT) and attitudinal loyalty
(ABL) ...................................................................................................................... 100
5.5 Conclusions, Implications and Recommendations ...................................... 100
5.5.1 Conclusions .................................................................................................. 100
5.5.2 Theoretical and Practical Implications of the study ..................................... 102
5.5.3 Limitation and Recommended Areas for Further Research ......................... 104
REFERENCES ........................................................................................................... 106
APPENDIX A: FULL QUESTIONAIRE USED IN THIS STUDY ...................... 122
APPENDIX B: PROOFREADING CERTIFICATION ......................................... 132
EMS (M. BUS. ADMIN. DEGREE) JUNE 2016 xiv
List of Figures and Tables
List of Figures
Figure 1.1: The conceptual model of this study Figure 2.1: 2010 household FMCG
Spend ($bn) for 39 African countries
Figure 2.2: 2010 household FMCG spending according to product categories across
39 African countries
Figure 2.3: Total penetration of retailers servicing South African consumers
Figure 2.4: 2010 household FMCG spending by income group for 39 African
countries
Figure 3.1: Chitturi et al.’s (2008) model
Figure 3.2: Chaudhuri and Holbrook’s (2001) model of brand loyalty and brand
performance
Figure 3.3: Musa’s (2005) model of brand loyalty
Figure 3.4: Moolla and Bisschoff’s (2013, p. 5) brand loyalty model
Figure 3.5: This study’s conceptual model
Figure 4.1: Types of primary research designs, according to Kotler and Keller (2006,
p. 104)
Figure 4.2: Zikmund et al.’s (2010, p. 63) research process
Figure 4.3: FMCG brands investigated in this study
Figure 4.4: Pictograms as Likert infographic animated face scales used in the pilot
study
Figure 4.5: Sources and operationalisation of this study’s scale
Figure 5.1: SEM results of hypotheses testing
Figure 5.2: Summary of hypotheses testing using SEM and path resultant β-
correlations

EMS (M. BUS. ADMIN. DEGREE) JUNE 2016 xv
List of Tables
Table 3.1: Moolla’s (2010) brand loyalty drivers from his review of three decades
of research
Table 3.2: Reported drivers of brand loyalty
Table 3.3: Explanatory power of FMCG brand loyalty drivers
Table 4.1: Comparison between qualitative and quantitative research methods
Table 4.2: Questionnaire scales and their origins
Table 5.1: Socio-demographic data of respondents
Table 5.2: Mean, standard deviation and reliability results of constructs
Table 5.3: Bivariate correlation results
Table 5.4: GOF indices for SEM model fit measurement
Table 5.5: Summary of SEM results of hypotheses testing

EMS (M. BUS. ADMIN. DEGREE) JUNE 2016 xvi
List of Abbreviations
ABL: Attitudinal brand loyalty
BBL: Behavioural brand loyalty
BHV: Brand hedonic values
BUV: Brand utilitarian values
CBA: Consumer brand affect
CBT: Consumer brand trust
CFA: Confirmatory factor analysis
CFI: Comparative fit index
CSAT: Consumer satisfaction
FMCG: Fast moving consumer goods
GOF: Goodness-of-fit
GTC: Groceries, toiletries and confectionary
RMR: Root mean square residual
RMSEA: Root mean square error of approximation
SEM: Structured Equation Modelling

EMS (M. BUS. ADMIN. DEGREE) JUNE 2016 1
1. INTRODUCTION
1.1 Introduction
The benefits of building and maintaining customer brand loyalty (e.g. lower marketing
cost, positive word of mouth, resistance to competitor’s offerings and resultant increased
profitability) has been recognized for more than five decades (Zineldin et al., 2014:1), but
there are still questions as to how and whether brand loyalty is built with different product
categories (Drennan et al., 2015:48). Most models (see for e.g., Chaudhuri and Holbrook’s,
2001; Chitturi et al., 2008; Oliver’s 1999 models) posit that brand loyalty can be achieved
by satisfying customer needs. Recent reports are however showing that the relationship
between customer satisfaction and brand loyalty is not that straightforward and simple
(Chitturi et al., 2008:48; Thurn and Gustafsson, 2012:45; Zineldin et al., 2014:4).
Customer satisfaction, Chitturi et al. (2008:48) report, does not necessarily translate into
customer loyalty because consumers seek more than just being satisfied. They want to be
delighted, and this depends on marketers’ knowledge of the specific consumption goals or
benefits consumers seek to satisfy or enjoy (do Vale and Duarte, 2013:30).
The consumption goals, which may either be utilitarian (functional, practical or
instrumental benefits of product consumption) or hedonic (pleasure and enjoyment-related
benefits of product consumption) benefits satisfaction (Chitturi et al., 2008:61), differ
depending on the product categories (do Vale and Duarte, 2013) or on whether the type of
product is durable or non-durable goods. For the consumption of durable consumer goods
such as laptop, cars and cell phones, Chitturi et al. (2008) found that it was the hedonic
benefits and not merely the utilitarian needs satisfaction consumers gained from these
products. These delighted consumers and positively affected the two (i.e., repurchase and
word-of-mouth) key measures of loyalty.
Chitturi et al. (2008:61) concluded that when product designers and marketers strive to
build customer loyalty, they should put more focus on hedonic needs satisfaction than on

EMS (M. BUS. ADMIN. DEGREE) JUNE 2016 2
utilitarian needs provisions since hedonic need satisfaction generates more emotional and
affective outcomes. Will this suggestion be applicable to non-durable fast moving
consumer goods (FMCGs), which is viewed as everyday low-priced and low-risk
consumer products that require very little thought when purchasing (Ullah and Prince,
2012:8)?
In addition to examining the extent to which consumers derive the usual utilitarian benefits
from the purchase and use of FMCGs, this study seeks to investigate whether consumers
also get hedonic benefits and how these benefits drive brand trust, brand affect, satisfaction
and brand loyalty. This chapter starts by stating the research problem and objectives of the
study. The chapter then describes the main concepts of this study. Thereafter, the research
methodology will be introduced. This chapter concludes with a discussion on the
contribution this study will make in the field of marketing and brand management.
1.2 Research Problem
The marketplace has become unpredictable because of increased competitive pressure and
a heightened difficulty in building and sustaining loyal customers. Marketers are therefore
putting brand loyalty development and sustenance at the heart of their brand building
activities (Fournier and Yao, 1997). The management of consumer brand loyalty however
depends on marketer’s ability to measure, understand, and leverage brand loyalty, which
according to Fournier and Yao (1997), should be guided by conceptual and empirical
research relevant to understanding how and why brand loyalty exist. Despite its strategic
managerial importance, Chaudhuri and Holbrook (2001) regrettably noted that there are
still conceptual and empirical research gaps in the study of brand loyalty. This is especially
so in the retail industry (Zineldin et al., 2014).
According to Dick and Basu (1994:99), brand loyalty “is striving for theoretical legitimacy
and practical significance” away from the ongoing measurement orientation. In the FMCG

EMS (M. BUS. ADMIN. DEGREE) JUNE 2016 3
sector, Lacey (2007:327) noted that empirical studies on how variables interact to create
customer commitment and ultimate loyalty is lacking. Even though FMCGs are an
important consumer product category for a unique brand management programme, Moolla
and Bisschoff (2013) noted that there was no existing theoretical and empirical framework
to test brand loyalty drivers for FMCGs.
Mano and Oliver’s (1993) theoretical and empirical model provides a framework that
delineates the evaluative (utilitarian and hedonic) and the affective (pleasantness and
arousal) dimensions that drive consumer satisfaction but did not examine how satisfaction
in turn affect customer loyalty.
Chaudhuri and Holbrook (2001) tested the effect of utilitarian and hedonic values on brand
loyalty through the impact of brand trust and brand affect, but failed to assess how
consumer satisfaction is first affected before brand loyalty is developed. Chitturi et al.’s
(2008) model examined how customer loyalty is developed through utilitarian and hedonic
benefits and different types of satisfaction enjoyed, but used durable consumer goods. To
guarantee brand loyalty, Aviv (2002) noted that there has to be considerations of the
importance consumers assign to different product types attributes. That importance or the
attributes they value is not only product type-specific but is also culture specific (Lim and
Ang, 2008:226).

EMS (M. BUS. ADMIN. DEGREE) JUNE 2016 4
1.3 Objectives of the Study
This study aims to survey consumers from different income and racial groups in the
Western Cape of South Africa, to investigate 1) whether in addition to utilitarian values,
consumers receive hedonic values from FMCGs brands, 2) whether consumers can be loyal
to FMCGs brands, and 3) how the utilitarian and hedonic values or benefits they enjoy
from some selected FMCG brands affect their brand trust, brand affect, satisfaction with
the brand, and how that satisfaction in turn affect behavioural and attitudinal brand loyalty.
The aim of the study is driven by 1) the research problem stated above, 2) Steenkamp and
Burgess’ (2002) call that U.S and European models be tested in emerging markets, and 3)
Chaudhuri and Holbrook’s (2001) claim that product category characteristics affect the
type of brand evaluation consumers make and the ultimate brand loyalty and performance.
1.4 Description of the Main Concepts of this Study
This section defines and describes the key concepts used in this study.
1.4.1 Utilitarian value (of a brand)
Chaudhuri and Holbrook (2001:85) define utilitarian value of a brand as “the ability of a
brand to perform functions in the everyday life of a consumer”. This is akin to the
functional, instrumental and practical benefits of a brand’s consumption offer (Chitturi et
al., 2008:49). Utilitarian value was described by do Vale and Duarte (2013:30) as
consumption experiences that tend to be “fundamentally functional, instrumental, sensible
or practical, a kind of experience that is usually associated to a simple justification and to a
set of needs that demand a clear solution”. They further state that utilitarian intention to
buy a product has a cognitive and extrinsic motivation. Examples of products that have
utilitarian attributes are ink cartridge and medicines.

EMS (M. BUS. ADMIN. DEGREE) JUNE 2016 5
1.4.2 Hedonic value (of a brand)
A hedonic value is the pleasure potential of a product class to a consumer (Chaudhuri and
Holbrook, 2001: 85). It refers to the aesthetic, experiential and enjoyment-related benefits
of a brand’s consumption offer (Chitturi et al., 2008:49). According to do Vale and Duarte
(2013:30), purchases or choices grounded on hedonic dimensions are experiences “often
described as entertaining, pleasant, exciting, spontaneous and sensory” and “generally has
an intrinsic motivation leading to an inherent reward that is sought after, in the form of a
higher order goal”.
While some product category (e.g., medicines and ink cartridge) may provide exclusively
utilitarian values, others may provide both utilitarian and hedonic values. For example, a
consumer may purchase a cellular phone for either its utilitarian value of receiving calls or
sending text messages and emails or for its hedonic value of stylish and modern designs.
For product categories that provide both utilitarian and hedonic values, do Vale and Duarte
(2013) report that, consumers’ attitudes and their levels of satisfaction are driven by the
relative weight of both utilitarian and hedonic values they get from the products.
Product classification according to utilitarian and hedonic values is important to not only
understand why and when different products and services are chosen, but it is especially
important to FMCGs, which lack a consistent classification. Classification according to
utilitarian and hedonic values are also important to FMCG retailers which are increasingly
motivated to provide differential treatment, layout and promotional activities to their
various product categories (do Vale and Duarte, 2013).
1.4.3 Brand trust
Liu et al. (2011:72) describe brand trust as “the belief held by the customer that the
supplier will provide the service or product that meets the customer’s needs”. Brand trust is
also described as the potential of the average consumer to rely on the ability of the brand to
perform its stated function whilst having the security in his/her interaction with the brand,
based on the perceptions that the brand is reliable and responsible for the interests and

EMS (M. BUS. ADMIN. DEGREE) JUNE 2016 6
welfare of the consumer (Delgado-Ballester, 2011:11; Chaudhuri and Holbrook, 2001:82;
Delgado-Ballester and Munuera-Aleman, 1999:1241). Considering that trust reduces the
perceived risk in a supplier–customer exchange relationship, and enhances seller-buyer
cooperation, it is suggested that it contributes to behavioural loyalty, such as repeat
purchasing and positive word of mouth (Nyanga, 2015:1). Describing commitment as “an
effort to maintain a valued relationship” and trust as a “partners’ confidence in the other
partner´s reliability and integrity”, Thurn and Gustafsson (2012:30) reported that
commitment and trust were popular drivers of seller-buyer relationship research.
1.4.4 Brand affect
Brand affect is a brand's potential to elicit a positive emotional response in the average
consumer as a result of its use and is positively affected by the hedonic values and
negatively affected by utilitarian values that consumers hold of products (Chaudhuri and
Holbrook, 2001:82). Moolla and Bisschoff (2013:6) found that, in the FMCG industry,
brand affect had a strong impact on brand loyalty while brand trust was found to be a
weaker predictor of brand loyalty. They did not however specify whether the loyalty was
behavioural or attitudinal. Deng et al. (2010:90) suggested that brand affect and trust were
important predictors of brand satisfaction.
1.4.5 Consumer satisfaction
Customer satisfaction is defined as “a person’s feelings of pleasure or disappointment that
result from comparing a product’s perceived performance to expectations.” (Kotler and
Keller, 2012:82). According to Oliver (1999:34), customer satisfaction is the consumer's
fulfilment response and a judgment that a product or service feature (or the product or
service itself) provided a pleasurable level of consumption-related fulfilment, including
levels of under- or over-fulfilment Aaker (2012) posit that customers will be willing to
stick to a brand and stay loyal to it, if they are satisfied with the brand. He therefore
suggests a direct relationship between brand satisfaction and loyalty.

EMS (M. BUS. ADMIN. DEGREE) JUNE 2016 7
1.4.6 The conceptualisation of brand loyalty
Brand loyalty can be conceptualised under opposing philosophical views. There is the
stochastic versus deterministic view and the behaviourist versus attitudinal view of brand
loyalty (Fournier and Yao, 1997).
1.4.6.1. The stochastic versus deterministic perspectives of brand loyalty
The stochastic viewpoint is based on a theory put forward by Kuehn, Ehrenberg and Bass
(Sharma, 1981:364), which assumes that consumers repeat brand purchases can be
predicted from a known purchase frequency or probability distribution. Thus, since the
level of repeat purchase can be measured from basic variables, it is believed to be stable
over a given brand penetration and purchase frequency (Knox and Walker, 2001:113).
Bass (1974:2) considers this view to be stochastic since a varied number of market
variables affect behaviour, and their impact occurs in unpredictable frequencies.
The deterministic view conversely holds that for a given brand and type of consumer,
repeat purchase behaviour is not easily predictable because it is impacted by some
determined number of independent variables. Considering the multi-variables that cause
behaviour, Jacoby and Chestnut (1978) question this view.
1.4.6.2. The behaviourist versus attitudinal perspectives of brand loyalty
Concerned about the operationalisation of brand loyalty, the behaviourists consider brand
loyalty a behavioural construct. This theory states that the number of times consumers
repurchase a specific brand in a given time period after experiencing it, can be measured
(Fournier and Yao, 1997:452). Jacoby and Chestnut (1978) however argue that this view
lacks explanatory capacity. Considering that brand loyalty is a complex construct, they
propose that it should be measured by the embodiment of both behavioural and attitudinal
measures, namely psychological commitment such as brand preference and insistences
resulting from cognitive processes. The attitudinal component, Dick and Basu (1994:111)
contend, creates avenues for explaining brand loyalty.

EMS (M. BUS. ADMIN. DEGREE) JUNE 2016 8
Knox and Walker (2001:113) note that the differing perspectives of brand loyalty are
creating difficulties in interpreting much of the ongoing brand loyalty studies. It has also
resulted in different modelling of brand loyalty determinants, especially as repeat purchase,
brand commitment and brand loyalty are interchangeably used. Knox and Walker (2001)
however suggest that Jacoby and Chestnuts’ (1978) conceptualisation and definition of
brand loyalty be considered because it provides a more embodying view of the brand
loyalty construct.
Jacoby and Chestnuts (1978:80) define brand loyalty as:
the biased (i.e., non-random), behavioural response (i.e., purchase), expressed over time,
by some decision-making unit, with respect to one or more alternative brands out of a set of
such brands, which is a function of psychological (decision making, evaluative) processes
resulting in brand commitment.
Since this definition of brand loyalty stresses the preference (biased), purchase frequency
(over time) and the attitudinal (psychological) nature of brand loyalty, it is viewed as a
composite definition and appropriate because it also considers consumer responses over a
set of brands rather than just a single brand. Viewing brand loyalty in two dimensions,
Oliver (1999:34) defines brand loyalty as “a deeply held commitment to re-buy a preferred
product or service consistently in the future, thereby causing repetitive purchasing of the
same brand or brand set despite situational influences and marketing efforts being able to
cause switching behaviour”.
Chaudhuri and Holbrook (2001), Bandyopadhyay and Martell (2007), Keller (2009,) and
Nam et al. (2011) also interpret brand loyalty according to behavioural and attitudinal
dimensions. Chaudhuri and Holbrook (2001:82) define behavioural loyalty as “the
propensity of consumers to purchase the same brand repeatedly over time”, and attitudinal
loyalty as “the degree of dispositional commitment in terms of some unique values
associated with the brand”. This study measures brand loyalty in terms of these two
dimensions and examines the antecedents which predict both behavioural and attitudinal
loyalties.

EMS (M. BUS. ADMIN. DEGREE) JUNE 2016 9
The dependent (i.e., utilitarian and hedonic values, brand trust and affect, and brand
satisfaction) and independent (behavioural and attitudinal loyalty) variables of this study
were developed into a conceptual model.
1.5 Conceptual Model of this Study
Chapter 3 discusses the theoretical perspectives of brand loyalty and some identified gaps
in previous models of brand loyalty which guided the development of the conceptual
model in this study. The model of the relationships between variables is presented in
Figure 1.1.
Figure 1.1: The conceptual model of this study - adapted from Chitturi et al.’s (2008)
and Chaudhuri and Holbrook’s (2001) models
This study’s model was tested using the research methods introduced in the next section.
Utilitarian
value
Hedonic
value
Behavioural
Brand
Loyalty
Attitudinal
Brand
Loyalty
Consumer
Satisfaction
Brand trust
Brand affect
EMS (M. BUS. ADMIN. DEGREE) JUNE 2016 10
1.6 Research Methodology
Quantitative research methods were used to collect and analyse this study’s data.
Quantitative methods were appropriate because of the nature of the research (testing
relationships between multiple variables) and the fact that standardised instruments which
have been tested and proven reliable and valid, were available to test this study’s variables.
Questionnaires were used to collect data and were self-administered through mall intercept
at big malls in Cape Town, Western Cape, South Africa.
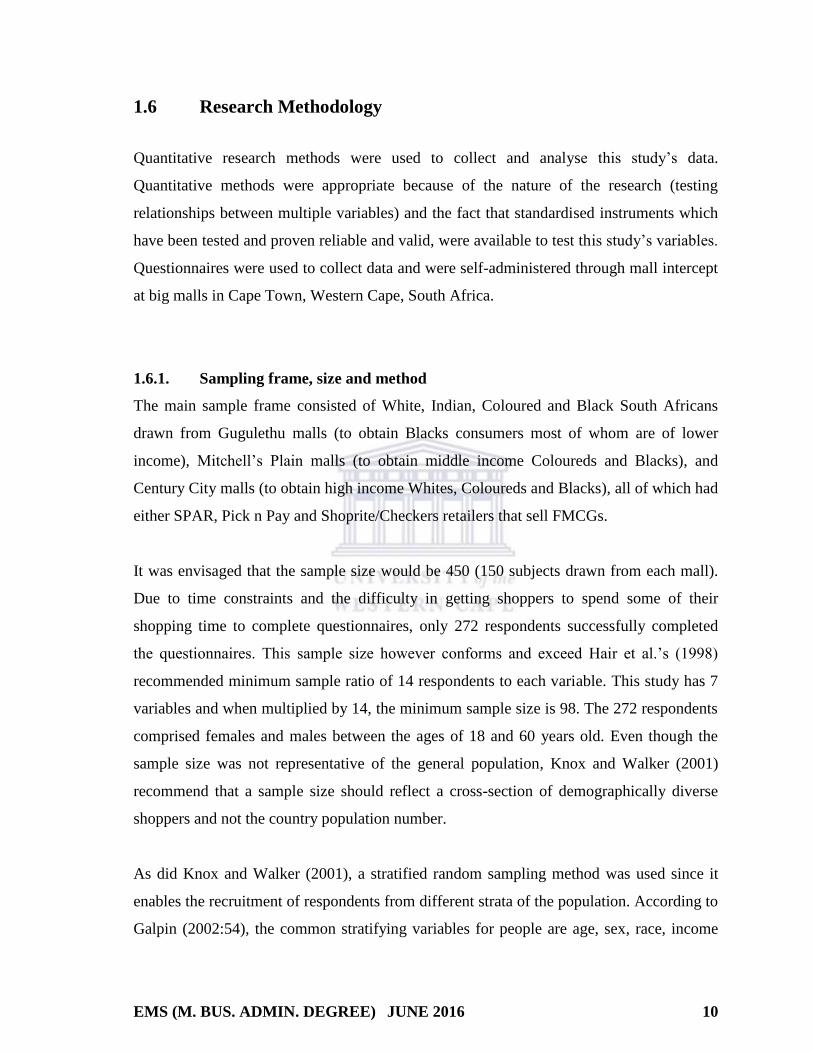
1.6.1. Sampling frame, size and method
The main sample frame consisted of White, Indian, Coloured and Black South Africans
drawn from Gugulethu malls (to obtain Blacks consumers most of whom are of lower
income), Mitchell’s Plain malls (to obtain middle income Coloureds and Blacks), and
Century City malls (to obtain high income Whites, Coloureds and Blacks), all of which had
either SPAR, Pick n Pay and Shoprite/Checkers retailers that sell FMCGs.
It was envisaged that the sample size would be 450 (150 subjects drawn from each mall).
Due to time constraints and the difficulty in getting shoppers to spend some of their
shopping time to complete questionnaires, only 272 respondents successfully completed
the questionnaires. This sample size however conforms and exceed Hair et al.’s (1998)
recommended minimum sample ratio of 14 respondents to each variable. This study has 7
variables and when multiplied by 14, the minimum sample size is 98. The 272 respondents
comprised females and males between the ages of 18 and 60 years old. Even though the
sample size was not representative of the general population, Knox and Walker (2001)
recommend that a sample size should reflect a cross-section of demographically diverse
shoppers and not the country population number.
As did Knox and Walker (2001), a stratified random sampling method was used since it
enables the recruitment of respondents from different strata of the population. According to
Galpin (2002:54), the common stratifying variables for people are age, sex, race, income

EMS (M. BUS. ADMIN. DEGREE) JUNE 2016 11
group, occupation, and education. Thus, as mentioned above, segments of different races
and income levels were surveyed.
1.6.2. Method of data analyses
Structural equation modelling was the preferred data analyses method because of the
multivariate nature of the study. Specifically and in line with the Chaudhuri and Holbrook
(2001) data analytical method, path analyses were conducted. Hair et al. (1998:582)
describe path analysis as “a method based on specifying relationships in a series of
regression-like equations”. The data analyses started with descriptive statistics of the actual
sample structure obtained and of the reliability coefficients of the scored items.
1.7 Study Significance
This study will contribute to the theoretical field of marketing and brand management by
determining whether in addition to utilitarian value, South African consumers also receive
hedonic value and develop emotional attachment (brand affect) to low-involvement brands
like FMCG brands. Even though they hold more utilitarian value, do Vale and Duarte
(2013:30) found that Portuguese consumers hold some hedonic value for a number of
FMCGs. Unlike utilitarian need satisfaction, Chitturi et al. (2008:57) suggest that hedonic
need satisfaction is more likely to build customer loyalty, since it generates more
emotional and affective outcomes.
This study will also contribute to knowledge by determining whether South African
consumers develop loyalty to FMCG brands which are mostly sold in a transactional
marketing setting as opposed to relational marketing setting. Asking the question as to
whether loyalty exists within the Swedish FMCGs market, Thurn and Gustafsson
(2012:31) found that the loyalty level is low because the customers chase quality products
and services for low prices.

EMS (M. BUS. ADMIN. DEGREE) JUNE 2016 12
Practically, this study will assist marketers of the selected FMCG brands to understand the
type of value consumers get from brands and the performance of their brands in terms of
brand satisfaction, brand loyalty and the factors influencing performance.
1.8 Limitations of the Study
The study is limited to factors that affect satisfaction (not dissatisfaction) and loyalty (not
disloyalty) especially since completely different sets of variables affect dissatisfaction and
disloyalty (Chitturi et al., 2008; Knox and Walker, 2001). The study is also limited by the
fact that it was conducted only in Cape Town, the second largest city in South Africa. Even
though Cape Town is a socio-economically diverse city, the inclusion of Johannesburg, the
largest socio-economic city of the country, would have enriched the validity of the study.
1.9 Organisation of the mini-thesis
Chapter 1 – The introduction
This chapter introduces the research problem, objectives, concepts, conceptual model of
the study, methodology to test the model, and how the study is organised.
Chapter 2 - The nature and contribution of the FMCG industry
In this chapter FMCG is defined and classified. The chapter describes the characteristics of
FMCG products and discuss the role players and economic contribution of the FMCG
sector in South Africa. Considering the nature of FMCGs, the chapter predicts the type of
values consumers may derive and whether they are likely to develop brand loyalty.
EMS (M. BUS. ADMIN. DEGREE) JUNE 2016 13
Chapter 3 – Drivers of brand loyalty
This chapter reviews previous studies on the drivers of brand loyalty to assess whether and
how brand loyalty has been explained in the FMCG industry. It also assesses the extent to
which brand loyalty of various products has been studied in emerging markets such as
South Africa.
Chapter 4 - Research methodology
This chapter discusses the research methods used to collect and analyse the data. The
chapter also includes a description of the sampling technique adopted and the composition
of the sample. It starts by recapping the research problem and formulating the hypotheses
that were tested.
Chapter 5 – Results, presentation, discussions, conclusions and recommendations
This chapter presents and discusses the results of the empirical investigation against the
background of the conceptual model tested, plus the research objectives. It also concludes
the theoretical and empirical findings of the study and discusses the theoretical and
practical contributions of this study. The chapter ends with suggestions for further
research.

EMS (M. BUS. ADMIN. DEGREE) JUNE 2016 14
2. THE FAST MOVING CONSUMER GOODS (FMCG) MARKET
2.1 Introduction
This chapter defines and examines the characteristics of FMCG products. It also examines
global, African and South African FMCG markets and discusses the role players of the
FMCG sector in South Africa. Factors that drive growth in the African FMCG market are
also examined. Considering the nature of FMCGs, the chapter predicts the type of values
consumers may derive and whether they are likely to develop brand loyalty for FMCGs.
2.2 Definitions and Characteristics of FMCG
FMCGs are products which are consumed by most consumers on a daily basis or at regular
intervals (Vaishnani, 2011:2). Kotler and Armstrong (2011:374) define FMCGs as low
value items that are frequently sold by retailers. Joghee and Pillai (2013:9) refer to FMCGs
as convenient and low involvement products, whereas Fouladivanda et al. (2013:946),
view FMCGs as those retail goods that are generally replaced or fully used up over a short
period of days, weeks, or months, and within one year. They contrast it with durable goods
which are generally replaced over a period of several years. FMCGs are usually purchased
on a small-scale with consumer decisions heavily influenced by advertising and
promotions by manufacturers (Mbuyazi, 2012:15).

EMS (M. BUS. ADMIN. DEGREE) JUNE 2016 15
The FMCG market can be divided into four major consumer categories, namely food,
toiletries, household and health categories (Nayyab, et. al., 2011:804). Some of the main
characteristics of FMCGs can be summarised as follows (Tiwari, 2012:168):
Frequent purchasing by the consumer.
Low consumer involvement with little or no product involvement. Products with
strong brand loyalty are exceptions to this rule.
Low pricing strategy by the marketer.
High volume targets expected.
Low margin contributions to the marketed product basket offering.
Extensive distribution networks.
High stock turnover.
FMCGs have a short shelf life, either as a result of high consumer demand or because the
product deteriorates rapidly. Some FMCGs such as meat, fruits and vegetables, dairy
products and baked goods, are highly perishable. Other goods such as alcohol, toiletries,
pre-packaged foods, soft drinks and cleaning products have high turnover rates (Tiwari,
2012:168).
The FMCG industry primarily deals with the production, distribution and marketing of
consumer packaged goods (Mohan and Sequeira, 2012:2; Qasim and Agarwal, 2015:2041)
and is often referred to as a “low margin – high volume” industry from a retailer
perspective (KPMG, 2015:1; Mohan and Sequeira, 2012:2). Price competition between
retailers can be intense within FMCG product categories, especially as they are often near-
identical. To boost profitability, companies use marketing and other techniques to establish
loyalty to some FMCG categories (for example drinks, milk, bread, meat, vegetables, soap,
soup, maize meal, beans, cool drinks, paper products, pharmaceuticals, packaged food
products, household products). These activities enable companies to charge higher prices.
Another important characteristic of the FMCG sector is that it generally does well in an
economic downturn, with consumers being more willing to cut back on luxury products
and channel their spending into essentials such as FMCGs.

EMS (M. BUS. ADMIN. DEGREE) JUNE 2016 16
The competition among FMCG manufacturers is growing, probably due to increased
investment in the FMCG industry. India for example, has seen a remarkable growth; their
FMCG industry is regarded as one of the largest in the world with total market size in
excess of US$20.1 billion annually. The FMCG industry growth in India is driven by the
availability of key raw materials, the presence of cheap labour, a well-established
distribution network, intense competition between organised and unorganised segments,
and low operational costs. The FMCG industry is also regarded as one of the largest
sectors in New Zealand and accounts for 5% of Gross Domestic Product (Vaishnani,
2011:2; Qasim and Agarwal, 2015:2042).
2.3 The Global FMCG Industry
In the past, very little attention was paid to FMCGs as there was a common belief that its
margins were too low for the investment and effort required (Moolla, 2010:137). Success
in the Indian market, however, soon drew marketers’ attention to the potential of this
industry. Siag and Choudhary (2015:1) state that FMCG Industry is projected to grow by
12% and reach a size of US$43 billion by 2013, and US$74 billion by 2018 in India. A
booming Indian population, particularly the middle class and rural segments, presents an
opportunity to marketers of branded products to convert ordinary consumers into branded
FMCG product consumers (Qasim and Agarwal, 2015:2042). The FMCG industry is also
growing elsewhere, especially in the United States, where it is by far the largest sector of
the economy. Some of the most well-known global FMCG companies are Sara Lee, Nestlé,
Reckitt Benckiser, Unilever, Procter and Gamble, Coca-Cola, Carlsberg, Kleenex, General
Mills, Pepsi, Mars, Nirma, Dabur, and Himani (Vaishnani, 2011:3; David, 2013:2).

EMS (M. BUS. ADMIN. DEGREE) JUNE 2016 17
The extensive range of consumable goods offered by the FMCG industry involves a huge
amount of money, while the contest among FMCG manufacturers is continuously
intensifying. Consumers are presented with hundreds of brands on a daily basis and are
therefore, spoilt for choice (Pillay, 2007:2). The objective of most marketers of FMCGs is
to maximise the wealth of their shareholders by increasing turnover through innovative
marketing campaigns. Top FMCG global companies are characterised by their ability to
produce items in highest demand by consumers and, at the same time, develop loyalty and
trust towards their brands. The branding of FMCGs has become an integral part of
attracting and retaining consumers globally. David and Govender (2014:163) state that the
branding of FMCGs involves positioning a product correctly and ensuring that the brand is
well communicated. Regular market research is also needed whilst preserving the heritage
of the brand.
2.4 The FMCG Market in Africa
The KPMG 2015 Sector Report provided a World Bank 2010 report on household FMCGs
spending in Africa (See Figure 1). The World Bank’s Global Consumption Database
indicates that the total household expenditure on FMCG goods, based on a sample of 39
African countries, reached almost US$240bn in 2010 (KPMG, 2015: 5). The report further
highlights that household FMCG expenditure was highest in Nigeria (US$41.7bn),
followed by Egypt (US$27.6bn), South Africa (US$23bn), Morocco (US$20.1bn) and
Ethiopia (US$19.2bn).

EMS (M. BUS. ADMIN. DEGREE) JUNE 2016 18
Figure 2.1: 2010 household FMCG Spending ($bn) for 39 African countries
Source: KPMG (2015, p. 2)
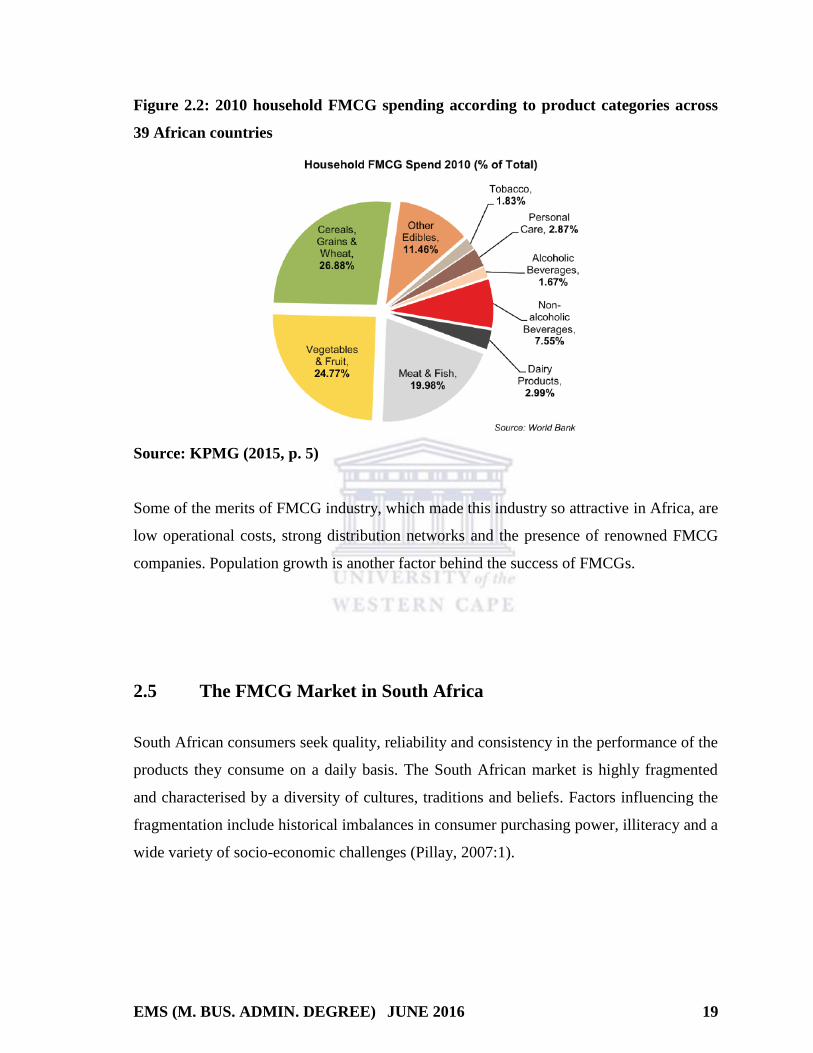
The World Bank’s data suggests that cereals, grains and wheat represented the largest
share of household spending on FMCG products, reaching US$64.5bn in 2010. Beverages
accounted for a much smaller share of total household spending on FMCG goods in Africa.
In nominal value terms, household spending on beverages reached US$22.1bn in 2010,
with $18.1bn of this being spent on non-alcoholic beverages. Dairy (3%), personal care
(2.9%) and tobacco (1.8%) represented fairly small shares of household expenditure on
FMCG goods in Africa during 2010.
EMS (M. BUS. ADMIN. DEGREE) JUNE 2016 19
Figure 2.2: 2010 household FMCG spending according to product categories across
39 African countries
Source: KPMG (2015, p. 5)
Some of the merits of FMCG industry, which made this industry so attractive in Africa, are
low operational costs, strong distribution networks and the presence of renowned FMCG
companies. Population growth is another factor behind the success of FMCGs.
2.5 The FMCG Market in South Africa
South African consumers seek quality, reliability and consistency in the performance of the
products they consume on a daily basis. The South African market is highly fragmented
and characterised by a diversity of cultures, traditions and beliefs. Factors influencing the
fragmentation include historical imbalances in consumer purchasing power, illiteracy and a
wide variety of socio-economic challenges (Pillay, 2007:1).

EMS (M. BUS. ADMIN. DEGREE) JUNE 2016 20
Steenkamp (2010:25) state that the FMCG market in South Africa was worth about ZAR
350 Billion in 2009, and mainly driven by Massmart, Metcash, Shoprite Checkers group,
Pick ‘n Pay group, Spar group, New Clicks and Woolworths. These retailers and
wholesalers sell directly to the public in the South African market and are mainly supplied
by multi-nationals such as Nestlé, Parmalat, Coca Cola, Simba/PepsiCo, Kellogg’s and
Unilever. Some of the biggest South African suppliers are Tiger Brands, Pioneer Foods,
AVI Limited and Clover.
There are a huge number of categories in the South African FMCG industry but groceries,
toiletries and confectionary (GTC) contribute a significant amount (Steenkamp, 2010:25).
The Gauteng GTC market is the biggest of all the regions. Gauteng also shows the highest
growth year-on-year. FMCG in South Africa saw a 1% drop in value growth in 2012 as a
result of price deflation due to price decreases from market leaders in order to stimulate
sales volumes after the economic downturn. Consumer spending also dropped as a result of
the resultant economic crisis (David, 2013:38).
The supermarket sector in South Africa has however continued to grow, with a share of the
food retail market reaching a worth of ~ ZAR 356.9 billion for the 2014 financial year
(Trade Intelligence Corporate Comparative Performance Report, 2015). Four major
companies account for 97 % of sales in the South African formal food retail sector. In
2012, Shoprite Checkers controlled around 38 % of the formal food retail market, followed
by Pick n Pay at 31 %, Spar with 20 %, and Woolworths with 8 % (Battersby and Peyton,
2014:155). Collectively these retail groups have stores located throughout South Africa
and cater for the needs of the vast majority of South African consumers. The stores stock a
wide variety of fast moving goods purchased by South African consumers (Pillay, 2007:2).
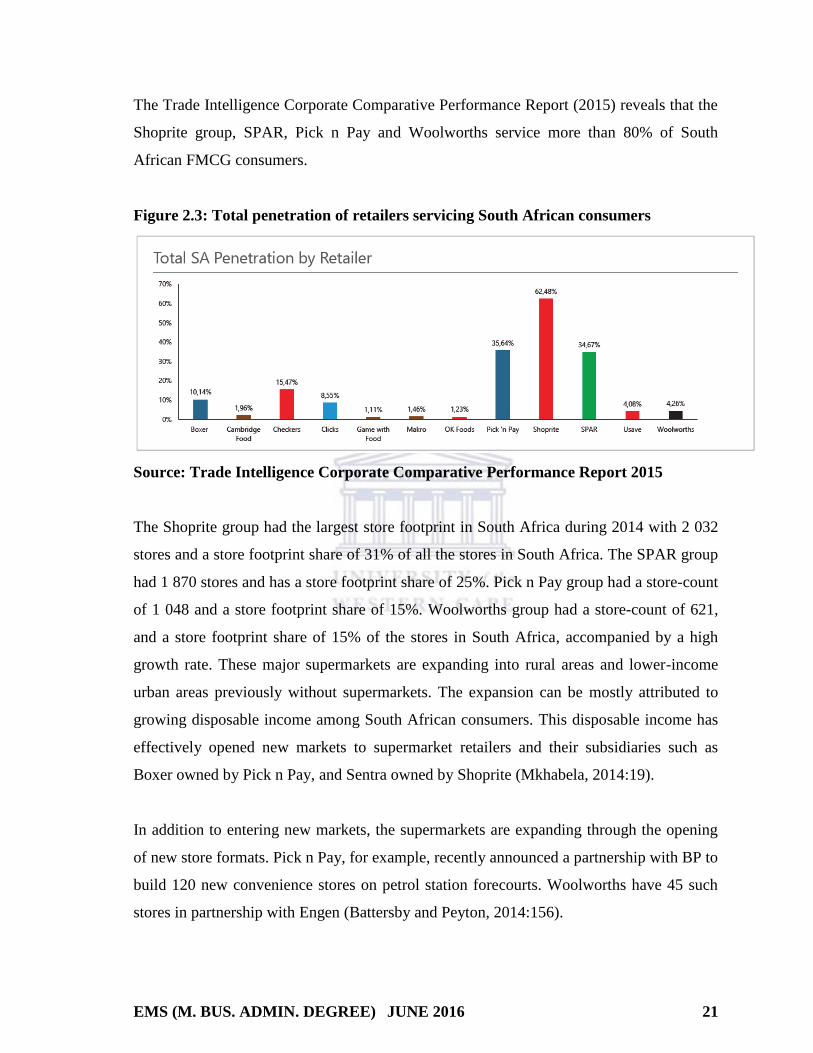
Figure 2.4 show the degree to which various retailers service the South African market.
The figure shows that Shoprite dominated the South African market with a 62.48%
penetration level in the 2014 financial year.
EMS (M. BUS. ADMIN. DEGREE) JUNE 2016 21
The Trade Intelligence Corporate Comparative Performance Report (2015) reveals that the
Shoprite group, SPAR, Pick n Pay and Woolworths service more than 80% of South
African FMCG consumers.
Figure 2.3: Total penetration of retailers servicing South African consumers
Source: Trade Intelligence Corporate Comparative Performance Report 2015
The Shoprite group had the largest store footprint in South Africa during 2014 with 2 032
stores and a store footprint share of 31% of all the stores in South Africa. The SPAR group
had 1 870 stores and has a store footprint share of 25%. Pick n Pay group had a store-count
of 1 048 and a store footprint share of 15%. Woolworths group had a store-count of 621,
and a store footprint share of 15% of the stores in South Africa, accompanied by a high
growth rate. These major supermarkets are expanding into rural areas and lower-income
urban areas previously without supermarkets. The expansion can be mostly attributed to
growing disposable income among South African consumers. This disposable income has
effectively opened new markets to supermarket retailers and their subsidiaries such as
Boxer owned by Pick n Pay, and Sentra owned by Shoprite (Mkhabela, 2014:19).
In addition to entering new markets, the supermarkets are expanding through the opening
of new store formats. Pick n Pay, for example, recently announced a partnership with BP to
build 120 new convenience stores on petrol station forecourts. Woolworths have 45 such
stores in partnership with Engen (Battersby and Peyton, 2014:156).

EMS (M. BUS. ADMIN. DEGREE) JUNE 2016 22
The South African retailers also operate out of the country. Shoprite for example, opened
its first non-South African store in 1995 and by the end of 2012, had 131 non-South
African supermarkets in 16 African countries (Battersby and Peyton, 2014:156).
2.6 Growth Drivers in the FMCG Market
Key drivers of growth in the FMCG industry, according to KPMG (2015:3); Nayyab, et al.,
(2011:807), and Siag and Choudhary (2015:2), especially across Africa include the
following:
2.6.1 Population size
In addition to income per person which informs the types of FMCG products to be offered
to a specific market, FMCGs offerings are also dependent on population size. The
consumer spending trend in FMCGs is monitored to secure maximum retailer benefit from
the biggest segments of the population (Nayyab, et. al., 2011:807).
2.6.2 Spending power
The KPMG 2015 sector report on FMCGs in Africa distinguishes between four household
consumption segments for multilateral organisations. The segments are classified
according to income thresholds, as follows:
(i) Lowest – below US$2.97 per capita a day
(ii) Low – between US$2.97 and US$8.44 per capita a day
(iii) Middle – between US$8.44 and US$23.03 per capita a day
(iv) Higher – above US$23.03 per capita a day
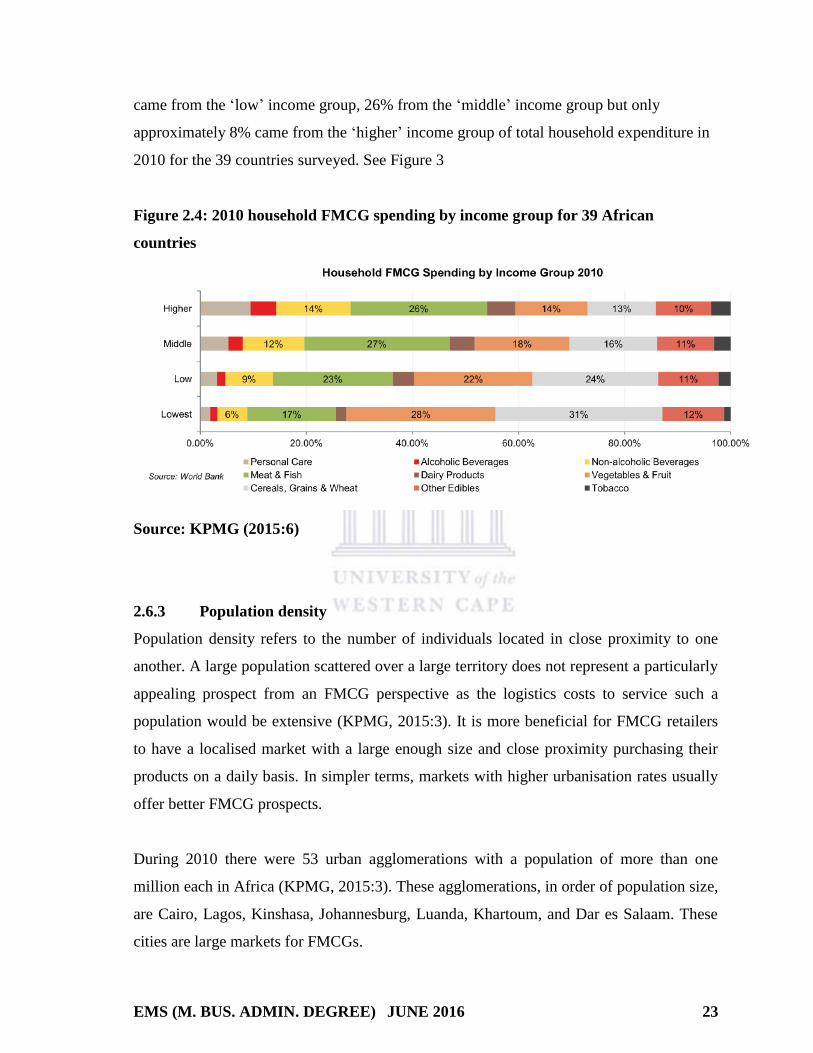
While one would expect the highest spending on FMCGs to come from the higher income
level, the KPMG (2015) sector report surprisingly shows that the highest (about 59%) of
2010 household spending was accounted for by the ‘lowest’ income group. A total of 44%
EMS (M. BUS. ADMIN. DEGREE) JUNE 2016 23
came from the ‘low’ income group, 26% from the ‘middle’ income group but only
approximately 8% came from the ‘higher’ income group of total household expenditure in
2010 for the 39 countries surveyed. See Figure 3
Figure 2.4: 2010 household FMCG spending by income group for 39 African
countries
Source: KPMG (2015:6)
2.6.3 Population density
Population density refers to the number of individuals located in close proximity to one
another. A large population scattered over a large territory does not represent a particularly
appealing prospect from an FMCG perspective as the logistics costs to service such a
population would be extensive (KPMG, 2015:3). It is more beneficial for FMCG retailers
to have a localised market with a large enough size and close proximity purchasing their
products on a daily basis. In simpler terms, markets with higher urbanisation rates usually
offer better FMCG prospects.
During 2010 there were 53 urban agglomerations with a population of more than one
million each in Africa (KPMG, 2015:3). These agglomerations, in order of population size,
are Cairo, Lagos, Kinshasa, Johannesburg, Luanda, Khartoum, and Dar es Salaam. These
cities are large markets for FMCGs.

EMS (M. BUS. ADMIN. DEGREE) JUNE 2016 24
2.6.4 Infrastructure development
A lack of quality infrastructures remains a key constraint to higher levels of foreign direct
investment in a number of African countries. Weak infrastructures, with special reference
to electricity supplies and road networks adversely impact on FMCG sector in a particular
country (Siag and Choudhary, 2015:2).
Roads account for 80% of goods and 90% of passenger transport on the African continent.
Yet few of Africa’s roads are paved, and less than half of rural Africans have access to all-
season roads. According to the World Bank, only 18 African countries had a capital stock
of more than US$5bn in 2013, with South Africa being in this fortunate group (Siag and
Choudhary, 2015:2).
2.6.5 Downstream industry effectiveness
A large number of firms in the FMCG sector depend on downstream domestic industries
such as manufacturing, agro-processing and agriculture to deliver quality products in high
volumes to FMCG consumers. Certain FMCG products have by nature very short shelf-
lives, especially certain foods and dairy products. It is often necessary for retailers to rely
on local supply chains to ensure that product wastage is kept to a minimum (KPMG,
2015:3; Nayyab, et. al., 2011:807).
Downstream industries do not always exhibit the necessary degree of efficiency and
flexibility required to keep customers satisfied while simultaneously driving financial gains
on the bottom line. As a result, many FMCG retailers opt to vertically integrate businesses
where possible, for example by buying a stake in a local packaging store or establishing a
wholly-owned manufacturing plant in close proximity to the local market they are aiming
to service. In some cases, the costs associated with establishing an effectively functioning
supply chain may outweigh the benefits on the sales side, resulting in some firms
potentially not investing despite market possibilities exhibiting adequate FMCG demand
potential.

EMS (M. BUS. ADMIN. DEGREE) JUNE 2016 25
2.6.6 Policy and business legislature
Economic policies and legislation in relation to foreign direct investment, trade barriers,
property and labour also represent key determinants of FMCG sector growth. A country’s
economic policies, quality of institutions and prevailing legislation have a big influence on
FMCG markets and the business environment. Regulatory trade barriers which simply aim
to protect inefficient local producers can be harmful to the economy. Even slight changes
to input costs could have major implications in the FMCG landscape, potentially resulting
in a loss of market share (Nayyab, et. al., 2011:807).
Property and labour laws also impact on the business environment. Labour laws and the
power of unions bear significant influence on the productivity, flexibility and cost of
labour in a country. FMCG retailers relying on local supply chains could thus be directly
influenced by these factors. Legislation and incentive schemes pertaining to foreign direct
investment might also make certain markets more attractive from an investment point of
view.
2.7 Key Success Strategies in the FMCG Industry
The KPMG (2015:8) report identified certain strategies that likely drive companies to
succeed in Sub-Saharan Africa. The strategies which characterise successful firms are:
effective marketing to attract consumers, establishing brand loyalty, and refining supply
chains to ensure appropriate pricing and commercial viability. These strategies are
discussed below.
EMS (M. BUS. ADMIN. DEGREE) JUNE 2016 26
2.7.1 Focussing on country clusters
FMCG retailers are advised to focus on country clusters (i.e. a region that contains more
than one viable market) rather than on individual countries. Another strategy is to focus on
regions with cultural similarities, supported by political stability and good quality road
infrastructures across borders (Siag and Choudhary, 2015:4). Typical viable FMCG
clusters identified were West Africa (Nigeria, Ghana and Ivory Coast), Southern Africa
(South Africa, Namibia, Botswana and Angola), and East Africa (Kenya, Ethiopia, Uganda
and Tanzania).
2.7.2 Localising the product offering
FMCG retailers should ensure that they are properly informed about the needs and
lifestyles of consumers in targeted African countries. This should influence their decisions
about products, pricing and marketing, and their strategies should be supported by
appropriate research (Siag and Choudhary, 2015:4). It was reported that African consumers
were brand and quality conscious but affordability remained a key consideration with
purchasing decisions. Unilever understood this principle when the company sought to
lower prices and improve affordability by reducing pack sizes and thus allowing them to
target low income households. FMCG retailers are also advised to target multiple price
points thereby spreading the risk over affluent and lower income households whilst relying
on consumers who buy FMCG products daily (Srivastava and Sharma, 2013:192).
2.7.3 Making communication media relevant
Brand awareness is improved by retailers who leverage appropriate communication
strategies. FMCG companies are advised to resist the automatic use of traditional “above-
the-line broadcast media” and instead to apply more resources to physical and digital
marketing. Coca-Cola understood this concept and resorted to supplying fridges to local
retail outlets. Nestlé also demonstrated this by using local entertainers to market the
company’s products (KPMG, 2015:8).

EMS (M. BUS. ADMIN. DEGREE) JUNE 2016 27
2.7.4 Creative supply chain usage
FMCG retailers are advised to carefully consider supply chain models in Africa.
Companies should be mindful of import tariffs when importing products. They should also
be mindful of the fact that products are often delayed at ports (Siag and Choudhary,
2015:4). Incentives are often found for FMCG manufacturers who consider sourcing in-
market, for example, Unilever investing in South African manufacturing sites.
There is a trend among consumers to demand more from the FMCG brands which are
traditionally consumed. Consumers also seek more convenience products; products with
packaging that keep products fresher for longer and which offer protection for its contents,
advertising that keeps them aware of new product developments, and distribution that
keeps products within arm’s length of consumer desires. All parties involved in the
marketing and distribution of FMCGs needed to be aware of these and other consumer
demands to supply suitable market offerings.
The values and benefits consumers obtain from FMCGs are also important. The next
section discusses these values and benefits.
2.8 Reported Values / Benefits consumers get from FMCGs
Chaudhuri and Holbrook (2001:85) report that consumers could enjoy utilitarian and
hedonic benefits from the consumption of FMCGs. Hedonic values are the pleasure
potential of a product class and utilitarian values are the ability of products to perform
functions in the everyday life of a consumer (Zeeman, 2013:51).
Chitturi, et al. (2008:49) view utilitarian benefits as the functional, instrumental and
practical benefits of consumption offerings, whilst hedonic benefits are aesthetic,
experiential, and enjoyment-related. Consumers mostly tend to attach greater weight to
utilitarian dimensions as opposed to hedonic dimensions, unless they believe they have

EMS (M. BUS. ADMIN. DEGREE) JUNE 2016 28
“earned the right to indulge”. The consumption of a product’s superior hedonic benefits
evokes greater promotion emotions of cheerfulness and excitement, whereas the
consumption of superior utilitarian benefits evokes greater prevention emotions of
confidence and security (Chitturi, et al., 2008:49).
Most consumer decision-making processes are heavily influenced by the utilitarian vs.
hedonic properties of the products or services they acquire (Dhar and Wertenbroch,
2000:62). Attitudes and levels of satisfaction specifically tend to be associated to the
relative weight of both these dimensions (Mano and Oliver, 1993:451). For FMCGs, do
Vale and Duarte (2013:30) found that consumers tend to more likely value utilitarian
benefits. The utilitarian and hedonic benefits of consumer products could satisfy the
following consumption goals:
2.8.1 Prevention goals and utilitarian benefits vs Promotion goals and hedonic
benefits
Prevention goals are those that ought to be met, such as “behaving in a safe and secure
manner” and “being responsible.” Fulfilment of prevention goals in the context of product
consumption eliminate or significantly reduce the probability of painful experiences.
Consumers thus experience positive emotions which result from the fulfilment of
prevention goals.
Promotion goals are those that a person aspires to meet, such as “looking cool” or “being
sophisticated.” Fulfilment of promotion goals in the context of product consumption
significantly increase the probability of a pleasurable experience, thus enabling consumers
to experience emotions that result from the fulfilment of promotion goals (Chitturi, et al.,
2008:50).

EMS (M. BUS. ADMIN. DEGREE) JUNE 2016 29
2.8.2 Utilitarian benefits and confidence/security vs hedonic benefits and
excitement/cheerfulness
It has been shown that utilitarian benefits are perceived as being closer to necessities or
needs that helped to fulfil prevention goals (Chitturi, et. al., 2008:50). If prevention goals
are however not fulfilled, customers experience increased pain in the form of negative
feelings. On the other end of the spectrum, the “aspire-to-meet” nature of promotion goals
increases customers’ focus on the hedonic benefits of a product. The non-fulfilment of
promotion goals is perceived as a loss of pleasure rather than an increase in pain. This is
due to hedonic benefits being perceived as closer to the luxuries or wants that promotion
goals fulfil.
2.8.3. Utilitarian benefits and satisfaction; hedonic benefits and delight
Utilitarian benefits fulfil prevention goals and alleviated pain, whilst hedonic benefits fulfil
promotion goals and enhance pleasure. However, to delight customers, it is not sufficient
simply to avoid pain by meeting prevention goals. It is important that the fulfilment of
prevention goals by the consumption of utilitarian benefits be complemented with the
enhancement of pleasure by the consumption of hedonic benefits that fulfil promotion
goals (Jones, et al., 2006:975).
2.8.4. Prevention goals and anger; promotion goals and dissatisfaction
Failure to meet utilitarian expectations typically leads to anger; whilst the failure to meet
hedonic expectations merely led to dissatisfaction. Consumers consider the fulfilment of
utilitarian expectations a necessity. When a product fails to meet a necessity (i.e., utilitarian
expectation), consumers are likely to experience intense negative emotions that are high in
arousal. In contrast, failure to meet hedonic expectations and aspire-to-meet promotion
goals are likely to evoke low arousal feelings of sadness and disappointment, which leads
to dissatisfaction (Chitturi, et al., 2008:52). Consumers approach shopping for FMCGs
having utilitarian and hedonic shopping motivations, with prevention and promotion goals
in-mind (Zeeman, 2013:57).

EMS (M. BUS. ADMIN. DEGREE) JUNE 2016 30
2.8.5 Categories of utilitarian and hedonic shopping motivations
Zeeman (2013:57) summarises the categories of utilitarian shopping motivations as
follows:
(i) Achievement
Consumers with utilitarian motivations evaluate a shopping experience with reference to
the achievement of the planned shopping goal (Zeeman, 2013:57). Jones et al. (2006:974)
state that the acquisition of products is important to these consumers as they are typically
non-emotional consumers, focused on completing a specific task.
(ii) Efficiency
The motivation of efficiency is a typical situation whereby a consumer strives to swiftly
satisfy projected needs. A retail store typically offers convenience when there is a
reduction in time spent by the consumer to acquire a product, accompanied with
maximised shopping opportunities (Zeeman, 2013:58).
For hedonic shopping motivations, Zeeman (2013:36) provides the following categories:
(i) Gratification shopping
Evans et al. (2009:25, cited in Zeeman, 2013:36) describe gratification shopping as
consumers using shopping to treat themselves, to get rid of stress, or to lighten a foul
mood. Wagner and Rudolph (2010, cited in Zeeman, 2013:36) remarks that consumers
motivated by gratification wish to treat themselves to achieve an outcome of feeling special
and positive.

EMS (M. BUS. ADMIN. DEGREE) JUNE 2016 31
(ii) Adventure shopping
Zeeman (2013:36) defines adventure shopping as consumer shopping in order to have a
feeling of being in another universe and to feel a sense of adventure or stimulation.
Consumers who wish to attain sensory stimulation along with expressing their own identity
are motivated by other adventure shoppers.
(iii) Idea shopping
Zeeman (2013:37) categorises idea shoppers as consumers who attempt to keep up with
new fashions and trends and trying to find new products and innovations. These consumers
want to be knowledgeable about current developments, new products, and new ways to use
a product.
(iv) Social shopping
Zeeman (2013:37) defines social shoppers as consumers who seek opportunities to interact
or socialise with other individuals with interests similar to their own. Hedonic shoppers
typically view shopping with friends and family as a social excursion (Assael, 2004:51,
cited in Zeeman 2013:37).
(v) Role shopping
Zeeman (2013:38) defines role shoppers as consumers who attain pleasure when shopping
for others, for example gift shopping.
(vi) Value shopping
Value shoppers are consumers who connected emotionally with targeted brands and
products whilst enjoying the process of negotiating with sales people for the purpose of
obtaining a bargain. When these consumers receive a better discount, they feel ingenious
about their shopping (Zeeman, 2013:55).
Irrespective of the type of value consumers seek, the level of shopping values obtained
affect the level of satisfaction, which in turn affect loyalty attitudes and other outcomes.

EMS (M. BUS. ADMIN. DEGREE) JUNE 2016 32
Other variables such as trust, the flexibility of the supplier, the age of the relationship, or
switching costs could moderate these relationships (Jones, et al., 2006:977).
Radder (2002), cited in a Matarid, Youssef and Alsoud (2014:155) study, found that brand
loyalty exists within selected South African FMCG segments where a brand has become a
consumer’s preferred choice and where there is a deeply held commitment to re-buying the
particular brand or service. Latently loyal consumers typically exhibit low patronage levels
but high emotional attachment to providers (Radder, van Eyk and Swiegelaar, 2015:103).
By viewing brands as assets, companies are better able to put their brand building
expenditures in context with the value that the brands deliver through attained brand
loyalty (David, 2013:21). The bond connecting a consumer to a brand is critical as it results
in behaviours that cultivate brand profitability and create brand loyalty (Schiffman and
Kanuk, 2007:239, cited in David, 2013:21).
Chaston (cited in Zineldin, et al., 2014:2) argue that the high volume sales nature of the
FMCG market is associated with large numbers of customers and low profit margins,
making the establishment of long-term relationships expensive. Research however shows
that loyalty can be built by focusing on trust and commitment.
2.9 Conclusion
The nature of the FMCG market with high volume sales, large numbers of customers and
low profit margins, makes it very expensive to retain and establish long-term relationships
with consumers. Since consumers enjoy some benefits from the consumption of FMCGs,
marketers and retailers should understand the benefits consumers gain from them. With
this knowledge, marketers can use relationship management tools such as the developing
of trust and commitment strategies to develop loyalty to their products. Loyalty
programmes and loyalty cards can further aid this strategy (Zineldin et al., 2014:3).
EMS (M. BUS. ADMIN. DEGREE) JUNE 2016 33
3. DRIVERS OF BRAND LOYALTY
3.1 Introduction
Chapter 2 examined the nature, contribution and marketing of FMCG products. It also
delved into the question of whether consumers can build brand trust, brand affect and
brand satisfaction with FMCGs, which are reported to be drivers of brand loyalty. This
chapter examines the concept and drivers of brand loyalty. It starts by discussing the two
philosophical viewpoints of brand loyalty, namely the stochastic vs deterministic
perspectives, and the behaviourist vs the attitudinal perspectives. The chapter thereafter
highlights the benefits of building and maintaining brand loyalty. It reviews reported
drivers of brand loyalty and concludes with a proposed model for this study, which aims at
examining and explaining brand loyalty to FMCGs in South Africa.
3.2 Definition and Conceptualisation of Brand Loyalty
Before defining brand loyalty, it is important to understand what a brand is. Kotler and
Keller (2006:274) define a brand as:
a product or service that adds dimensions that differentiate it in some way from other
products or services designed to satisfy the same need. These differences may be
functional, rational, or tangible—related to product performance of the brand. They may
also be more symbolic, emotional or intangible—related to what the brand represents.
These qualities of a brand can “add to or subtract from the value provided by a product or
service to a firm and/or to that firm’s customers”, thus creating brand equity (Aaker,
1996:103-104). Amongst the factors contributing to brand equity, brand loyalty is a major

EMS (M. BUS. ADMIN. DEGREE) JUNE 2016 34
factor since it embraces or is an important mediator between other factors and brand equity
(Khan and Mahmood, 2012:33). What then is brand loyalty?
3.2.1 Definitions of Brand Loyalty
Loyalty is one of the most researched topics (Moolla and Bisschoff, 2013) and defined in
various ways (see Moisescu, 2014; Moolla, 2010; and Pillay, 2007 for the various
definitions). For example, Jacoby and Kyner (1973:2) define brand loyalty as the biased
behavioural response expressed over time by some decision making unit with respect to
one or more alternative brands out of a set of such brands. They describe brand loyalty as a
function of psychological decision making & as an evaluative processes. Along the same
line of thinking, brand loyalty is defined by Oliver (1999:34) as a deeply held commitment
to rebuy a preferred product or service consistently in the future, thereby causing repetitive
purchasing of the same brand or brand set despite situational influences and marketing
efforts being able to cause switching behaviour.
The most elaborate and commonly referenced definition of brand loyalty is presented by
Jacoby and Kyner (1973), and is appropriate in this study because the FMCG industry
consists of many alternative brands. Whether or not the biased repurchase of a particular
FMCG brand over time is a function of some psychological processes as the definition
suggests, is one of the questions this study aims to answer.
Since Day (1969) suggested a composite definition of loyalty, researchers (Jacoby and
Kyner, 1973; Dick and Basu, 1994; Assael, 1998, Jensen and Hansen, 2006) have viewed
loyalty in terms of two dimensions – behavioural and attitudinal. The crux of this
composite definition is the addition of psychological processes This means that repeat
purchase is not merely an arbitrary response, but the result of some preceding factors (for
example psychological, emotional or situational factors). Dick and Basu (1994) point out
that even a relatively important repeat purchase may not reflect true loyalty to a product
but may merely result from situational conditions such as brands stocked by the retailer.

EMS (M. BUS. ADMIN. DEGREE) JUNE 2016 35
This position is further supported by Hofmeyr and Rice (2000:87), who postulate that it is
possible for a brand to be loyally bought without commitment, especially:
by force of circumstances; when consumers cannot buy the brand they want,
resulting in them loyally purchasing the second or third best brand, or
by choice; when consumers do not care what they buy, resulting in them loyally
purchasing the market-leading brand by default.
Mellens et al. (1996:509-511) suggest the following six requirements to achieve brand
loyalty:
1) Biased behavioural response: This implies that there is most likely a systematic
tendency to buy a certain brand or group of brands.
2) Actual purchase of the brand: Brand loyalty is not possible unless the actual
purchase of the brand occurs.
3) Expressed over time: An incidental bias towards a brand does not guarantee
brand loyalty. Some consistency is needed during a certain time span of brand
purchases. One should not only consider the number of times a specific brand is
purchased during that period, but also the purchase pattern over successive
purchase occasions.
4) Decision-making unit: Brand loyalty is defined by the purchase pattern of a
decision-making unit which may be an individual, a household or a firm. The
decision unit does not have to be the actual purchaser.
5) Selection of brands: One or more brands are selected out of a set of brands. This
condition implies that consumers may actually be loyal to more than one brand,
a phenomenon observed by other researchers, especially for low involvement
goods where the consumer often does not evaluate brands on a continuous scale
but classifies them discretely as acceptable or unacceptable.
6) Function of a psychological process: Brand loyalty is a function of psychological
(decision-making, evaluative) processes. Brands are chosen according to internal
criteria resulting in a commitment towards the brand which is an essential
element of the brand (Moolla, 2010).

EMS (M. BUS. ADMIN. DEGREE) JUNE 2016 36
According to Moolla (2010), brand loyalty is built over time through a collection of
positive experiences that requires consistent effort and attention to detail. Loyal customers
are repeat customers who choose a brand or company without even considering other
options. They buy more, they buy more regularly, and they frequently recommend the
brand to others.
3.2.2 Philosophical viewpoints of brand loyalty
Fournier and Yao (1997:451) identify three fundamental viewpoints that split loyalty
researchers:
(i) The stochastic versus deterministic / purposive nature of repeat purchasers.
(ii) The behavioural versus the attitudinal / hybrid attitudinal-behavioural
operationalisation of the brand loyalty concept.
(iii) The psychological (cognitive) versus anthropological / sociological (emotional)
research orientations.
Most brand loyalty research is mainly conceptualized under the first two opposing
philosophical views, i.e., the stochastic versus deterministic view of repeat purchases, and
the behaviourist versus attitudinal view of brand loyalty operationalisation (Fournier and
Yao, 1997).
3.2.2.1 Stochastic versus deterministic nature of repeat purchases
The stochastic group typically focuses on aggregate repeat purchase patterns (Fournier and
Yao, 1997). Brand loyalty from a stochastic / coincidence approach is considered
equivalent to repeat purchasing and not grounded on isolated factors which determines this
behaviour. It is thus impossible to detect antecedents of stochastic repeat purchases,
resulting in companies gaining no understanding of how to build brand loyalty according to
this approach (Uncles, Dowling and Hammond, 2003:297). According to Sharma (1981)
the stochastic viewpoint is held by many contributors: Kuehn (1962, cited in Sharma,
1981:364), Ehrenberg (1959, cited in Sharma, 1981:364), and Bass (1974:19). The crux of
the theory is that consumers repeat purchase brands in random fashion which can be

EMS (M. BUS. ADMIN. DEGREE) JUNE 2016 37
predicted by assessing the known purchase frequency or probability distribution (Knox and
Walker, 2001:112) via basic variables. The theory of stochastic preference implies that
deterministic predictions of individual behaviour would achieve very limited success
because, “even if behaviour is caused, the bulk of the explanation lies in a multitude of
variables which occur with unpredictable frequency” (Knox and Walker, 2001:113).
The stochastic approach seems useful for explaining consumer purchase behaviour of fast-
moving consumer goods, for example, detergents and toothpaste (Kabiraj and Shanmugan,
2011:287; Jensen and Hansen, 2006:442). There is however evidence to show that, even
for frequently purchased consumer goods, the purchase decisions are rarely made on a
purely arbitrary basis.
The deterministic group typically focuses on a theoretical explanation of loyalty as a biased
expression of individual preference (Jacoby and Chestnut, 1978:80). Unlike the stochastic
view which holds that loyalty is predicted by a multitude of variables, the deterministic
view holds that for a given brand and type of consumer, repeat purchase behaviour is
impacted by some determined number of independent variables. Jensen and Hansen
(2006:442) for example state that, by examining relative attitude as an antecedent of repeat
purchasing, a determinist approach to brand loyalty is assumed. This means that, from a
determinist approach, brand loyalty is predicted by a limited number of causes or
independent variables for a given brand and set of consumers. Causal research carried out
by the deterministic school has however met with only partial success (Knox and Walker,
2001:113), because the repeat purchase nature of brand loyalty could be due to multivariate
factors (Maheshwari, Lodorfos and Jacobsen, 2014:16). The message here is that the
concept of brand loyalty is complex and may require psychological (commitment)
measures, behavioural measures, or a composite of the two measures.

EMS (M. BUS. ADMIN. DEGREE) JUNE 2016 38
3.2.2.2 Behavioural versus attitudinal operationalisation of the loyalty concept
Behaviourists consider brand loyalty a behavioural construct. They believe that the number
of times consumers repurchase a specific brand, in a given time period after experiencing
it, can be measured (Fournier and Yao, 1997). Rundle-Thiele and Mackay (2001:532)
however call for a distinction between brand loyalty and repeat purchasing. Behavioural
measurements are seen as inadequate for good representations of future behaviour and
have been criticised for a lack of conceptual basis and a narrow view of what is in fact a
dynamic and complex aspect of consumer behaviour (Bloemer and Kasper, 1995:314;
Suhartanto, 2011:9).
Attitudinal loyalty is based on stated preferences, commitments or purchase intentions
(Mellens Dekimpe and Steenkamp, 1996:513; Rundle-Thiele and Mackay, 2001:532).
Kwong and Candinegara (2014:91) provide three measurement variables for attitudinal
loyalty, namely:
(i) Relative attitude - when consumers evaluate a product or service relative to the
degree of differentiation it offers from alternatives.
(ii) Willingness to recommend - when the consumers recommend or share their good
experience toward the product or service with other consumers.
(iii) Altruism - when consumers express their willingness to assist the company or other
consumers in the effective delivery of a product or service.
Mellens, Dekimpe and Steenkamp (1996:512) note that attitudinal measures can
distinguish brand loyalty from repeat buying as the measures are based on commitment of
purchase intentions with emphasis on the cognitive element of brand loyalty. Attitudinal
measures also give insight into the motivations for consumer behavioural choices which
are less likely to be influenced by random / stochastic short run fluctuations. Suhartanto et
al. (2011:9) however highlight that the attitudinal approach is criticised for its lack of
predicting power of actual purchase behaviour. They further report that measuring only one
facet of brand loyalty may result in measuring spurious attitudes, i.e. unstable attitudes that
do not fully explain subsequent behaviour.
EMS (M. BUS. ADMIN. DEGREE) JUNE 2016 39
Oliver (1999:35) and Nyanga (2015:8) argue that consumers become loyal at each
attitudinal phase relating to different elements of the attitudinal development structure.
Specifically, consumers are theorised to become loyal in a cognitive sense first, and later in
an affective sense, later again in a conative manner, and finally in a behavioural manner,
which is described as action-inertia.
(i) Cognitive is used to describe the weakest phase of loyalty based on factual
information about the company or product’s attributes and performance; it is
when the customer is still easily persuaded by competitor communication
(Oliver, 1999:35).
(ii) In the affective phase, the customer has developed a positive attitude and some
emotional attachment after using the product for some time, but is still
vulnerable to competing brands (Oliver, 1999:35).
(iii) Real loyalty to a brand begins in the third phase of conative loyalty, when the
customer has formed a strong desire to repurchase the brand.
(iv) The consumer then gets to the mature phase of action loyalty, possessing both
the intention and motivation to repurchase the brand (Oliver, 1999:35; Nyanga,
2015:8).
Considering that brand loyalty is a complex construct, Mellens Dekimpe and Steenkamp
(1996:513) propose that it should be measured by a composite embodiment of both
behavioural and attitudinal measures. Dick and Basu (1994:111) contend that the
composite behavioural and attitudinal measurements of loyalty create better avenues for
explaining brand loyalty. They see brand loyalty as a favourable attitude towards a brand
over other competing brands and repeated patronage. Chaudhuri and Holbrook (2001:143)
also examine two linking aspects of brand loyalty, namely purchase loyalty and attitudinal
loyalty. A loyal customer is viewed as one who buys only one brand in a particular
category over time and has a strong positive attitude towards the brand (Nyanga, 2015:8;
Bandyopadhyay and Martell, 2007; Brijball, 1993:364). Keller (2013:120) also views
brand loyalty in the two dimensions of behavioural and attitudinal loyalty. He describes
these dimensions in terms of how often and how much customers purchase a brand as well
as how they see a brand as something special, loveable, and a favourite.

EMS (M. BUS. ADMIN. DEGREE) JUNE 2016 40
3.3 Brand Benefits leading to Brand Loyalty
Consumer brand knowledge can be defined in terms of the personal meaning a brand has,
stored in consumer memory. It relates to the cognitive representation of the brand (Keller,
2003:596). Different kinds of information may become linked to a brand, including the
benefits (value and meaning) that consumers attach to the brand’s product attributes. The
existing literature (Huang et al., 2015:3; Keller, 2003:596; Park et al., 1986:136) proposes
three categories of brand benefits, namely functional, symbolic and experiential benefits
derived from purchase or consumption (Keller, 2003:596).
Park et al. (1986:135) report that the long-term success of a brand depends on marketers'
abilities to select a brand meaning or benefit prior to market entry. They operationalise the
meaning in the form of an image and propose that this image is maintained over time. A
firm-selected brand meaning is derived from basic consumer needs, namely functional,
symbolic, and experiential, which are discussed below.
3.4.1 Functional
Functional benefits can be defined as those that motivate the search for products that solve
consumption-related problems (Huang et al., 2015:3). It is linked to product attributes of a
consistent and reliable quality. A brand with a functional concept is designed to solve
externally generated consumption needs.
3.4.2 Symbolic
Symbolic benefits are defined as the desires for products that fulfil internally generated
needs based on self-enhancement, occupying a role position, attaining a group
membership, or ego-identification (Huang et al., 2015:3). They correspond to non-product
attributes and relate to intrinsic needs for emotional enjoyment, self-expression and social

EMS (M. BUS. ADMIN. DEGREE) JUNE 2016 41
approval. A brand based on a symbolic concept is designed to associate the individual with
a desired group, role, or self-image.
3.4.3 Experiential
Experiential benefits are defined as desires for products that provide sensory pleasure,
variety, and/or cognitive stimulation. It relates to what customers feel when they use the
product or service, assuring that their experiential needs such as sensory, variety and
cognitive stimulation are satisfied.
It is common practice for researchers to assign products to one of these three benefit
categories on the basis of product class membership (for instance lawnmowers are
typically seen as functional products, cars are seen as symbolic, and food is experiential). It
should however be noted that the terms functional, symbolic and experiential refer to the
image created in a brand and not a product class (Park et al., 1986:136). A brand is a
cluster of functional and emotional values which offers a mixture of symbolic, functional
and sensory benefits to consumers (Park et al., 1986). Consumers have a regular
relationship with a brand as it serves these important roles (Langer, 1997), and are willing
to pay a premium for their brands of choice (Davis, 2002). Brand loyalty and brand equity
will be enhanced whilst brand parity will be combatted if brand owners and managers
clearly understand and communicate the needs satisfied by their brands and develop
appropriate brand strategies (Fournier, 1998). Despite the importance of knowing the
benefits which various FMCG brands provide, knowledge of the benefits is still lacking.
EMS (M. BUS. ADMIN. DEGREE) JUNE 2016 42
3.4 Benefits of Brand Loyalty
A major objective of any marketing strategy is to motivate the process of consumer
repurchasing a brand offering (Knox and Walker, 2001:112). Repeat purchasing is
important to marketing management since the action of retaining customers often requires
less marketing resources than recruiting new customers, thus making it economically
desirable. There are however three salient factors which contribute to the difficulty of
retaining customers (see Knox and Walker, 2001:112):
(i) Understanding repeat purchase behaviour requires behavioural data. Collecting
such self-report survey data is often expensive, especially in the FMCG arena.
(ii) The terms ‘repeat purchase’, ‘brand commitment’ and ‘brand loyalty’ have been
used interchangeably in research, resulting in differing reference points.
(iii) Having two opposing thoughts on the nature of repeat purchase results in
assumptions about differences in dependent variables.
If these complications in brand loyalty research can be addressed, the results would yield a
better understanding of brand loyalty and consumers, and make it possible to best leverage
the benefits of this interaction. Some of these benefits are detailed below:
3.4.1 Reduced marketing costs and its affects
Tuominen (1999:74) reports that the most important results of brand loyalty are reduced
marketing costs which lead to greater presence for a brand in the market place. This leads
to greater brand awareness with resultant positive word-of-mouth testimonials by
consumers to their networks, allowing a brand to better defend itself against competition
and generate greater revenues (Chaudhuri and Holbrook, 2001:85; Bandyopadhyay and
Martell, 2007:37).
EMS (M. BUS. ADMIN. DEGREE) JUNE 2016 43
3.4.2 Strategic barrier to entry for competitors
Significant resources are required for a brand to enter a market since existing customers
must be convinced to try the new brand as opposed to tried-and-trusted brands which they
are loyal to (Dick and Basu, 1994:107). The difficulty of entering the market, and
competing with a brand whose loyalty has been established, automatically reduces the
profit potential for the new entrant (Phiri, 2007:20).
3.4.3 Trade leverage
Brands with higher brand loyalty and equity result in preferred shelf-space in
supermarkets. Brand loyalty thus leads to trade leverage and supermarket support.
Consumers treat these supermarkets as destination shops, resulting in higher revenue for
both supermarkets and brands (Terblanche, 2002:71).
3.4.4 Attracting new consumers
A new consumer to a brand will experience risk and uncertainty in purchasing the brand. A
satisfied consumer base can reduce uncertainty and risk as it provides proof that a brand is
accepted, successful and enduring. A customer base can also provide brand awareness.
Seeing a brand on the supermarket shelf, in action or being used by an acquaintance, can
generate brand awareness which can attract new consumers (Rundle-Thiele and Mackay,
2001:530).
3.4.5 Time to respond to competitive threats
Having customers that are loyal to a brand creates breathing space for a brand
manufacturer when the new brand has entered the market (Dick and Basu, 1994:107). The
brand loyalty exhibited by consumers allows an organisation the time needed to assess the
benefits of the new brand, allowing an existing brand to be updated or to neutralise the
attack from the new brand (Tuominen, 1999:75).

EMS (M. BUS. ADMIN. DEGREE) JUNE 2016 44
3.4.6 Higher revenue and profitability for the brand owner
Moolla (2010:93) reports that loyal customers tend to buy more types and volume of
products / services from their preferred brand, resulting in enhanced revenue and
profitability over the life of the relationship.
3.4.7 Higher sales volume
Reducing customer loss through harvesting brand loyalty can dramatically improve
business growth. Brand loyalty leads to consistent and improved sales since the same brand
is purchased repeatedly (Moolla, 2010:93).
3.4.8 Premium price ability
As brand loyalty increases, consumers tend to be less sensitive to price changes (Dick and
Basu, 1994:107). Consumers are thus willing to pay more for a preferred brand because
they perceive value in the brand which other alternatives do not provide (Aaker, 1996:145).
3.4.9 Retain rather than seeking new consumers
Brand loyalists are willing to search for their favourite brand, resulting in less sensitivity to
promotions from competing brands. This phenomenon leads to lower costs for advertising,
marketing and distribution (Moolla, 2010:93). Some research shows that it can cost four to
six times as much to attract new customers compared to what it costs to retain existing
consumers (Moolla and Bisschoff, 2012:71).
EMS (M. BUS. ADMIN. DEGREE) JUNE 2016 45
3.4.10 Creating positive brand perceptions
Most consumers accept the brand premise that a price premium is an indicator of quality.
Gregg and Walczak (2010:119) postulate that the price and quality of a product are two of
the most important strategic variables in the marketing mix. Understanding the price-
quality interdependence is valuable for the positioning of a brand in the hearts and mind of
consumers (Dick and Basu, 1994:108). Aaker (1996:149) shows that perceived quality is
the single most-important contributor to a company‘s return on investment (ROI).
3.4.11 Increased usage
Perceived quality, resulting in repeat buying and the brand loyalty it attracts, has been
shown to positively affect customer usage. Consumers tend to continue buying brands that
reward them with a good experience (Aaker, 1996:149).
3.4.12 Reducing ongoing expenses
Moolla (2010:194) reports that loyalty can be a strategy for reducing ongoing expense (the
loyalty effect). A company that retains customers is one that could reduce its investment in
customer replacement (Ambler et al., 2002:18, cited in Moolla and Bisschoff, 2012:73).
With the heightened difficulty in building and sustaining loyal customers because of
increased competition, marketers are putting brand loyalty development and sustenance at
the heart of their brand building activities (Fournier and Yao, 1997). The management of
consumer brand loyalty however depends on a marketer’s ability to measure, understand,
and leverage brand loyalty, which according to Fournier and Yao (1997), should be guided
by conceptual and empirical research relevant to understanding how and why such loyalty
exists. Chaudhuri and Holbrook (2001) note that there are still conceptual and empirical
research gaps in the study of brand loyalty, despite its managerial importance. The next
section reviews previous conceptual and empirical research which has examined the
drivers of loyalty, especially brand loyalty.

EMS (M. BUS. ADMIN. DEGREE) JUNE 2016 46
3.5 Drivers of Brand Loyalty
Researchers have uncovered several drivers of brand loyalty through studies which
examine loyalty from behavioural, attitudinal and multi-dimensional perspectives. Moolla
(2010:126) has reviewed approximately three decades of research on the drivers of brand
loyalty. Table 3.1 provides a list of 26 possible brand loyalty drivers identified by Moolla.
Table 3.1: Moolla’s (2010) brand loyalty drivers from his review of three decades of
research
Source: Moolla (2010:126)
A further review of the latest studies, including those in South Africa on brand loyalty
drivers in various industries, was conducted. A summary of the updated studies on brand
loyalty drivers is presented in Table 3.2.

EMS (M. BUS. ADMIN. DEGREE) JUNE 2016 47
Table 3.2: Reported drivers of brand loyalty
Author(s) Year Brand Loyalty drivers Country and
Industry/product
category
Nyanga,
M.G.H.
(page 77)
2015 Perceived quality, durability, brand
experience, brand trust, price /
affordability), positive word-of-
mouth, guarantee, satisfaction,
fashionable, relevance, status,
reliability, availability, social
acceptance, brand name.
Low income earners in
Gauteng, South Africa.
Products studied are
consumables or
groceries, durable
goods and branded
services.
Lourens,
A.P.L. (p.
20)
2014 Customer satisfaction, switching
costs, brand trust, relationship
proneness, involvement, perceived
value, commitment, repeat
purchase, brand affect, brand
relevance, brand performance,
culture.
Studied branded
groundnuts in Gauteng
and North-West
provinces in South
Africa
Laubser, L. 2014 Price, product quality and
performance.
Studied FMCGs within
the ageing population in
the Western Cape of
South Africa.
Basson S. (p.
55)
2014 Switching costs, brand trust,
involvement, perceived value,
commitment, repeat purchase,
brand affect, brand relevance,
culture.
Studied pet food brand
(Eukanuba) distributed
in South Africa.
Simay A.E.
(p. 68)
2013 Consumer satisfaction, consumer
trust.
Hungarian mobile
telecommunications
market.
Thurn E. and 2012 Relationship marketing, Total FMCG market in

EMS (M. BUS. ADMIN. DEGREE) JUNE 2016 48
Gustafsson
D. (p. 50)
quality, customer satisfaction.
Växjö, Sweden.
Ramona L.G.
(p. 29)
2012 Quality, value, satisfaction, trust,
risk perception, switching costs,
variety search, knowledge about the
brand (price, benefits), brand
identity (image, credibility, equity),
situational features (location,
environment, customers and store
schedule, state of mind before
purchase), consumer characteristics
(age, education, gender, income).
FMCG and durable
goods in the alba
county of Romania.
Ismail R.,
Boye C.L.
and Muth A.
2012 (p. 16)
2012 Brand experience, brand
satisfaction, brand trust.
Study conducted in
Växjö, Sweden
regarding the retail
industry in general.
Forsido,
M.Z. (p. 8)
2012 Brand image, brand experience,
customer satisfaction, brand
quality, brand switching cost,
customer product involvement.
Sweden for
smartphones.
du Plooy, H.
(p. 28)
2012 Customer satisfaction; brand trust;
switching costs; involvement;
commitment; perceived value;
repeat purchase; brand affect;
relationship proneness; brand
relevance; brand performance and
culture.
Studied pharmaceutical
industry with
participants from
various provinces
included Gauteng,
Kwazulu-Natal, North
West, Free State,
Limpopo, Mpumalanga
and the Eastern Cape,
South Africa
Moolla, A.I. 2012b Customer satisfaction; switching Studied the FMCG
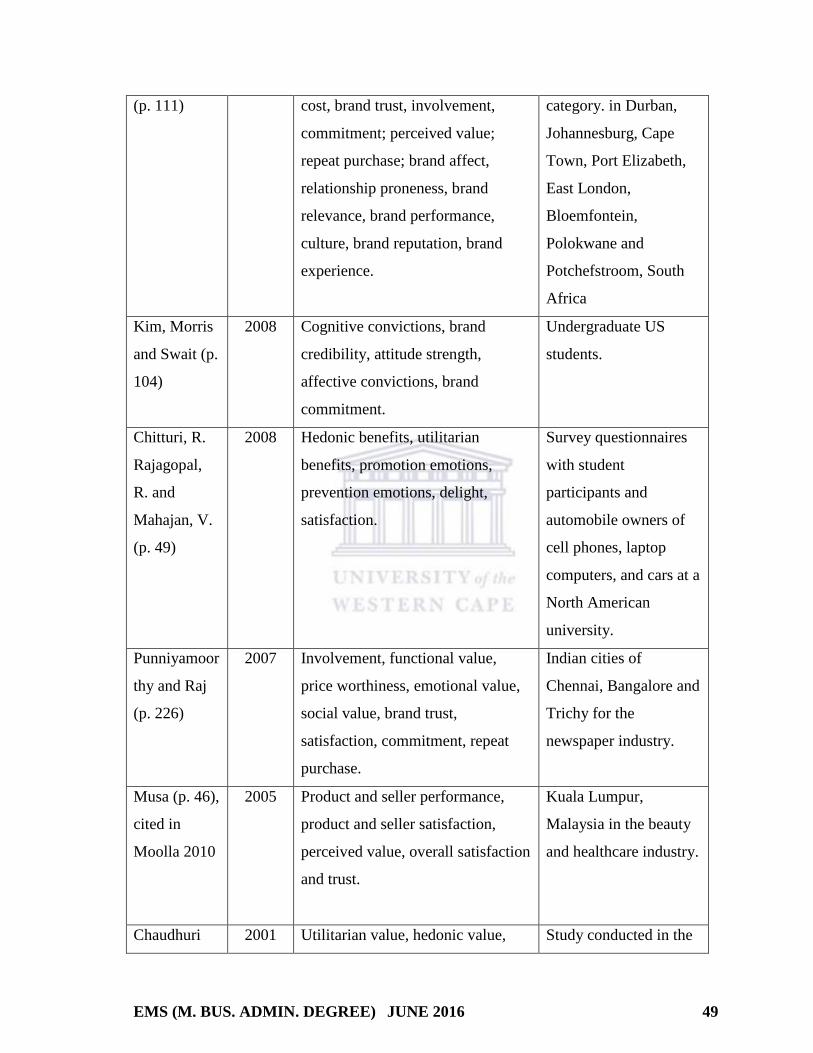
EMS (M. BUS. ADMIN. DEGREE) JUNE 2016 49
(p. 111) cost, brand trust, involvement,
commitment; perceived value;
repeat purchase; brand affect,
relationship proneness, brand
relevance, brand performance,
culture, brand reputation, brand
experience.
category. in Durban,
Johannesburg, Cape
Town, Port Elizabeth,
East London,
Bloemfontein,
Polokwane and
Potchefstroom, South
Africa
Kim, Morris
and Swait (p.
104)
2008 Cognitive convictions, brand
credibility, attitude strength,
affective convictions, brand
commitment.
Undergraduate US
students.
Chitturi, R.
Rajagopal,
R. and
Mahajan, V.
(p. 49)
2008 Hedonic benefits, utilitarian
benefits, promotion emotions,
prevention emotions, delight,
satisfaction.
Survey questionnaires
with student
participants and
automobile owners of
cell phones, laptop
computers, and cars at a
North American
university.
Punniyamoor
thy and Raj
(p. 226)
2007 Involvement, functional value,
price worthiness, emotional value,
social value, brand trust,
satisfaction, commitment, repeat
purchase.
Indian cities of
Chennai, Bangalore and
Trichy for the
newspaper industry.
Musa (p. 46),
cited in
Moolla 2010
2005 Product and seller performance,
product and seller satisfaction,
perceived value, overall satisfaction
and trust.
Kuala Lumpur,
Malaysia in the beauty
and healthcare industry.
Chaudhuri 2001 Utilitarian value, hedonic value, Study conducted in the
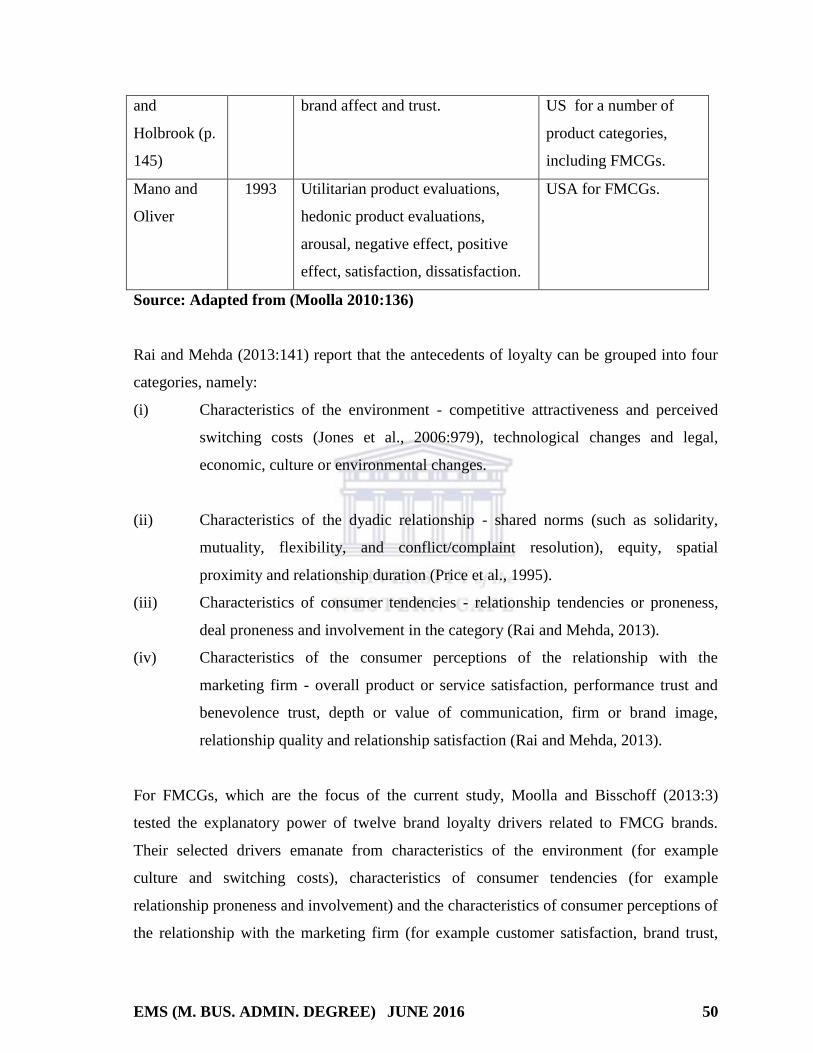
EMS (M. BUS. ADMIN. DEGREE) JUNE 2016 50
and
Holbrook (p.
145)
brand affect and trust.
US for a number of
product categories,
including FMCGs.
Mano and
Oliver
1993 Utilitarian product evaluations,
hedonic product evaluations,
arousal, negative effect, positive
effect, satisfaction, dissatisfaction.
USA for FMCGs.
Source: Adapted from (Moolla 2010:136)
Rai and Mehda (2013:141) report that the antecedents of loyalty can be grouped into four
categories, namely:
(i) Characteristics of the environment - competitive attractiveness and perceived
switching costs (Jones et al., 2006:979), technological changes and legal,
economic, culture or environmental changes.
(ii) Characteristics of the dyadic relationship - shared norms (such as solidarity,
mutuality, flexibility, and conflict/complaint resolution), equity, spatial
proximity and relationship duration (Price et al., 1995).
(iii) Characteristics of consumer tendencies - relationship tendencies or proneness,
deal proneness and involvement in the category (Rai and Mehda, 2013).
(iv) Characteristics of the consumer perceptions of the relationship with the
marketing firm - overall product or service satisfaction, performance trust and
benevolence trust, depth or value of communication, firm or brand image,
relationship quality and relationship satisfaction (Rai and Mehda, 2013).
For FMCGs, which are the focus of the current study, Moolla and Bisschoff (2013:3)
tested the explanatory power of twelve brand loyalty drivers related to FMCG brands.
Their selected drivers emanate from characteristics of the environment (for example
culture and switching costs), characteristics of consumer tendencies (for example
relationship proneness and involvement) and the characteristics of consumer perceptions of
the relationship with the marketing firm (for example customer satisfaction, brand trust,
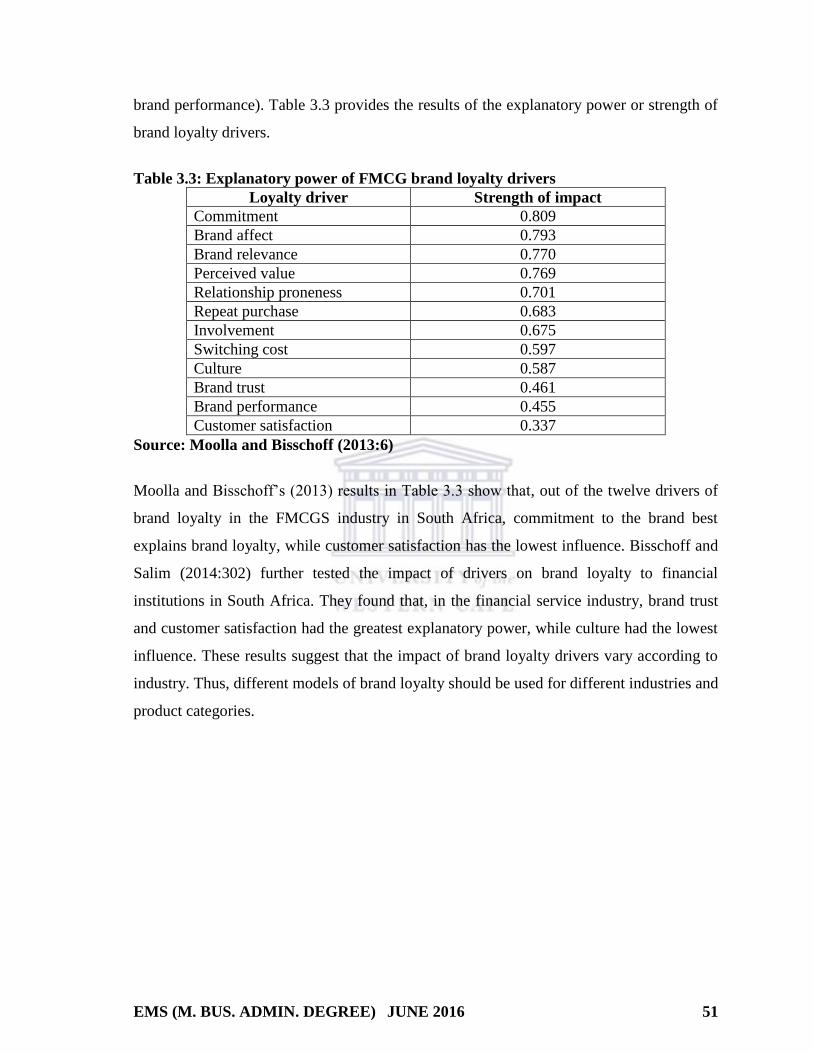
EMS (M. BUS. ADMIN. DEGREE) JUNE 2016 51
brand performance). Table 3.3 provides the results of the explanatory power or strength of
brand loyalty drivers.
Table 3.3: Explanatory power of FMCG brand loyalty drivers
Loyalty driver Strength of impact
Commitment 0.809
Brand affect 0.793
Brand relevance 0.770
Perceived value 0.769
Relationship proneness 0.701
Repeat purchase 0.683
Involvement 0.675
Switching cost 0.597
Culture 0.587
Brand trust 0.461
Brand performance 0.455
Customer satisfaction 0.337
Source: Moolla and Bisschoff (2013:6)
Moolla and Bisschoff’s (2013) results in Table 3.3 show that, out of the twelve drivers of
brand loyalty in the FMCGS industry in South Africa, commitment to the brand best
explains brand loyalty, while customer satisfaction has the lowest influence. Bisschoff and
Salim (2014:302) further tested the impact of drivers on brand loyalty to financial
institutions in South Africa. They found that, in the financial service industry, brand trust
and customer satisfaction had the greatest explanatory power, while culture had the lowest
influence. These results suggest that the impact of brand loyalty drivers vary according to
industry. Thus, different models of brand loyalty should be used for different industries and
product categories.

EMS (M. BUS. ADMIN. DEGREE) JUNE 2016 52
3.6 Brand Loyalty Models
The previous section presented tables of general drivers of brand loyalty in various
industries. The models and constructs differ according to the product category investigated
and the socio-cultural context of the study. This section presents a previous conceptual
model which has been used to explain brand loyalty and which can guide the development
of this study’s conceptual model.
3.6.1 Chitturi et al.’s (2008) model
Figure 3.1: Chitturi et al.’s (2008) model
Source: Chitturi et al. (2008:49)
Chitturi et al. (2008) examined how hedonic versus utilitarian product benefits lead to
customer satisfaction versus delight and loyalty. They found that the type and intensity of
the emotional experience arising from the consumption of hedonic benefits are different
from those of utilitarian benefits. This difference in emotional experience resulted in
EMS (M. BUS. ADMIN. DEGREE) JUNE 2016 53

EMS (M. BUS. ADMIN. DEGREE) JUNE 2016 54
Figure 3.2: Chaudhuri and Holbrook’s (2001) model of brand loyalty and brand
performance.
Source: Chaudhuri and Holbrook (2001:83)
Even though Chaudhuri and Holbrook (2001:82) define brand trust as “the willingness of
the average consumer to rely on the ability of a brand to perform its stated function”, and
brand affect as “a brands potential to elicit a positive emotional response in the average
consumer as a result of its use”, they did not test how these two constructs impact on
satisfaction before they affect brand loyalty. Moreover they did not separate the results of
the variable relationships for different product categories. It was thus not clear how the
results of the relationships apply to the FMCGs category. This study fills this gap by
examining brand satisfaction as one of the drivers of brand loyalty and focuses on FMCGs
brands, especially since Musa (2005) suggests a relationship between satisfaction and both
attitudinal and behavioural loyalty.

EMS (M. BUS. ADMIN. DEGREE) JUNE 2016 55
3.6.3 Musa’s (2005) model
Musa (2005:46) proposes that perceived value from both direct seller performance and
product performance (which can be the utilitarian value) leads to direct seller and product
satisfaction, and that overall satisfaction leads to both behavioural and attitudinal loyalty.
Musa (2005) also proposed that trust moderates the satisfaction-loyalty relationship. Even
though he did not empirically test this model, he suggests that there are cause-and-effect
drivers of both attitudinal and behavioural loyalties. Unlike Chaudhuri and Holbrook’s
(2001) model, Musa (2005) suggests a satisfaction-loyalty relationship, even though he
does not emphasise the importance of affect, which Chaudhuri and Holbrook (2001) and
Moolla and Bisschoff (2013) found to be an important driver of brand loyalty.
Figure 3.3: Musa (2005) model of brand loyalty
Source: Musa (2005:47)
3.6.4 Moolla and Bisschoff’s (2013) model
Reviewing three decades of previous studies on the drivers of brand loyalty, Moolla and
Bisschoff (2013:1) could not find a study which focuses on FMCGs. In their review, they
identify twelve important drivers and examine how these twelve factors influence brand
loyalty in the FMCG industry as depicted in Figure 3.4. Their results reveal that, even
though all twelve factors are significant drivers of brand loyalty, brand commitment, brand
effect, brand relevance, perceived value and relationship proneness have the greatest
impact on brand loyalty. Customer satisfaction, brand performance and brand trust
however have the least impact on brand loyalty. Even though Moolla and Bisschoff (2013)

EMS (M. BUS. ADMIN. DEGREE) JUNE 2016 56
examined the impact of a wide range of brand loyalty drivers, they did not test how these
factors inter-relate to impact on brand loyalty. Moreover they did not examine the two
dimensions (behavioural and attitudinal) of brand loyalty. The current study not only views
brand loyalty in two dimensions, but also examines how some of Moolla and Bisschoff’s
(2013) variables (for example brand trust and affect) predict brand satisfaction before both
brand loyalties are explained.
Figure 3.4: Moolla and Bisschoff’s (2013:5) brand loyalty model
Source: Moolla and Bisschoff (2013:5); Moolla (2010:144)
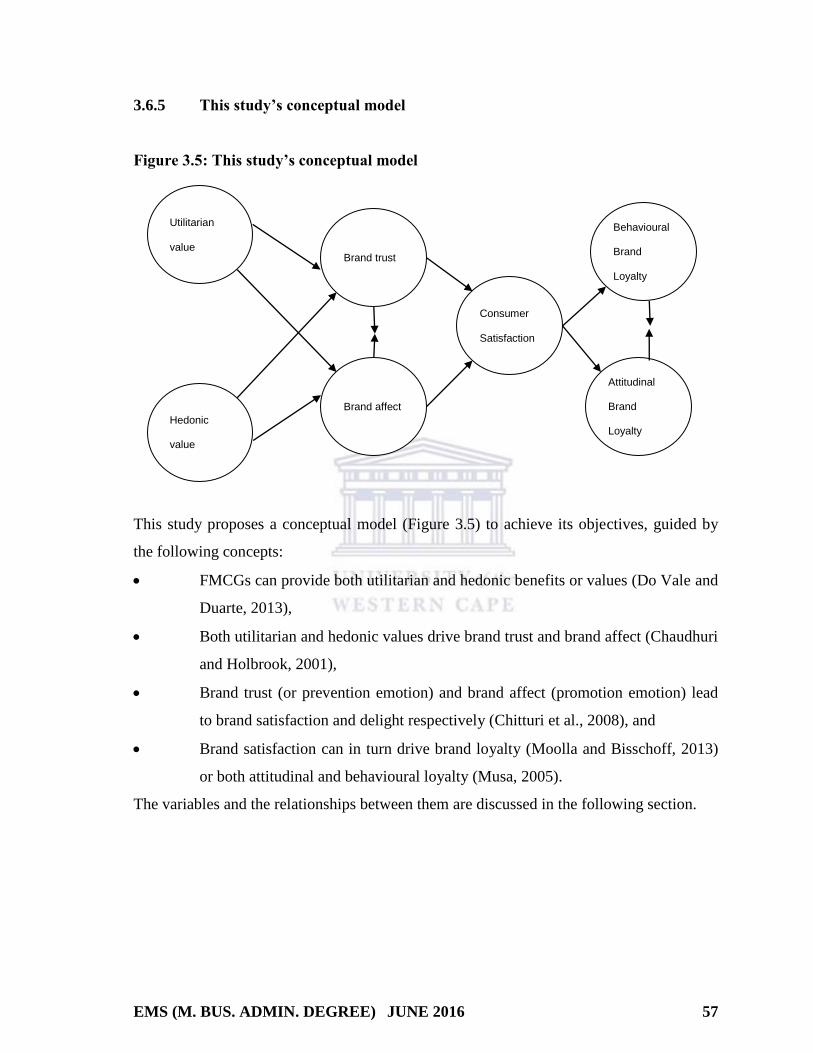
EMS (M. BUS. ADMIN. DEGREE) JUNE 2016 57
3.6.5 This study’s conceptual model
Figure 3.5: This study’s conceptual model
This study proposes a conceptual model (Figure 3.5) to achieve its objectives, guided by
the following concepts:
FMCGs can provide both utilitarian and hedonic benefits or values (Do Vale and
Duarte, 2013),
Both utilitarian and hedonic values drive brand trust and brand affect (Chaudhuri
and Holbrook, 2001),
Brand trust (or prevention emotion) and brand affect (promotion emotion) lead
to brand satisfaction and delight respectively (Chitturi et al., 2008), and
Brand satisfaction can in turn drive brand loyalty (Moolla and Bisschoff, 2013)
or both attitudinal and behavioural loyalty (Musa, 2005).
The variables and the relationships between them are discussed in the following section.
Utilitarian
value
Hedonic
value
Behavioural
Brand
Loyalty
Attitudinal
Brand
Loyalty
Consumer
Satisfaction
Brand trust
Brand affect

EMS (M. BUS. ADMIN. DEGREE) JUNE 2016 58
3.6.5.1 Utilitarian and hedonic values
Utilitarian benefits refer to” functional, instrumental, and practical benefits of consumption
offerings”; whilst hedonic benefits refer to “aesthetic, experiential, and enjoyment-related
benefits” (Okada, 2005:44; Chitturi et al., 2008:49). Hedonic consumption generally has an
intrinsic motivation, leading to an inherent reward that is sought after, whilst utilitarian
consumption tends to have an extrinsic motivation that does not comprise a reward in itself
but accomplishes more pleasurable and emotional goals (Dhar and Wertenbroch, 2000:69;
Do Vale and Duarte, 2013:30).
Consumers experience both utilitarian and hedonic values while shopping (Zeeman,
2013:32). Zeeman (2013:2) also reports that consumers’ utilitarian and hedonic shopping
motivations significantly predict and influence their behaviour and is therefore important
for retailers and marketers to understand in order to gain maximum financial benefit. A
consumer may perceive a shopping experience as valuable when planned goals are
achieved, which is known as the utilitarian value. However, when a shopping experience is
valued because a consumer is having fun and enjoys the shopping trip, then the consumer
is motivated by hedonic value (Zeeman, 2013:33).
(i) Utilitarian consumption needs
Utilitarian consumption experiences tend to be described as more functional, instrumental,
sensible or practical and are usually associated to a simple justification, or satisfying needs
that demand a clear solution (Do Vale and Duarte, 2013:30; Okada, 2005:44). A consumer
with utilitarian shopping motivations wants to attain a useful benefit or fulfil an economic
need during the shopping trip (Zeeman, 2013:32). According to Hawkins and
Mothersbaugh (2010:414), utilitarian consumers see shopping as an effort. They are
therefore of the opinion that, when marketing to obtain the interest of utilitarian consumers,
the function and the value of the product or service should be highlighted.
Zeeman (2013:33) highlights two categories of utilitarian shopping motivation - efficiency
and achievement. Efficiency refers to “the consumers’ shopping need to save time and
resources” whilst achievement refers to “the consumer shopping need to achieve a specific

EMS (M. BUS. ADMIN. DEGREE) JUNE 2016 59
goal”. The suggestion is that with utilitarian shopping, success only occurs when a specific
product, planned for at the outset of the shopping trip, is found. A shopping trip initiated
from a mission or task represents utilitarian motivation. The mission is completed when the
economic need is satisfied or the useful benefit is obtained. The driving force of a
utilitarian shopping is thus necessity (Zeeman, 2013:3).
(ii) Hedonic consumption needs
Do Vale and Duarte (2013) report that hedonic consumption needs were conceptually
introduced more than twenty years ago in a seminal work by Holbrook and Hirschman
(1982), and are often described as entertaining, pleasant, exciting, spontaneous and
sensory. Hedonic consumption at elevated levels may eventually be associated with
feelings of guilt due to its pleasurable nature. Many academic works refer to hedonic
consumption as designating those facets of consumer behaviour that relate to the
multisensory, fantasy and emotive aspects of a customer’s experience with products.
Zeeman (2013:36) argues that hedonic shopping motivations can be divided into
gratification shopping, adventure shopping, idea shopping, social shopping, role shopping
and value shopping.
Gratification shopping is “consumers using shopping to treat themselves, to get rid
of stress, or to lighten a foul mood”.
Adventure shopping is “a consumer shopping to have a feeling of being in another
universe and to feel a sense of adventure or stimulation”.
Idea shopping is “consumers attempting to keep up with new fashions and trends
and trying to find new products and innovations as idea shoppers”.
Social shopping is “consumers seeking opportunities to interact or socialise with
other individuals with interests similar to their own or bond with friends and
family”.
Role shopping is “consumers attaining pleasure when shopping for others”.
Value shopping is “consumers connecting emotionally and enjoying the process of
negotiating with sales people for the purpose of obtaining a bargain”.

EMS (M. BUS. ADMIN. DEGREE) JUNE 2016 60
Viewing hedonic shopping as hedonism, Kaul (2007:83) suggests that it pertains to
experience-based aspects of consumption. Consumers driven by hedonism, according to
Hoyer and Stokburger-Sauer (2012:7), search for products and services that provide the
satisfaction of feeling good.
(iii) Choice of utilitarian versus hedonic benefits
The choice of whether utilitarian or hedonic or both consumption goals are being satisfied
depends on the type of product category, whether durable or non-durable goods are
consumed, and culture (Aviv, 2002; Lim and Ang, 2008; Chitturi et al., 2008; Do Vale and
Duarte, 2013). For FMCGs, for example, Do Vale and Duarte (2013) found that consumers
act more on utilitarian than hedonic values.
For the consumption of durable consumer goods such as laptops, cars and cell phones,
Chitturi et al. (2008:48) found that customers derive hedonic benefits, not only utilitarian
needs satisfaction, from these products. They delight consumers and positively affect the
two key measures of loyalty, namely repurchase and word-of-mouth promotion. The
feelings of cheerfulness and excitement that arise from the fulfilment of promotion goals
by hedonic benefits are high-arousal feelings (Chitturi et al., 2008:52; Mano and Oliver,
1993:452).
Regarding cultural differences, Lim and Ang (2008) suggest that consumers in Shanghai,
China are culturally conditioned towards utilitarian consumption as opposed to
Singaporean consumers who are culturally conditioned towards hedonic consumption.
They found that Shanghai consumers view brands of utilitarian products as more
sophisticated, competent, exciting, and sincere than hedonic products, unlike Singaporean
consumers, who prefer the hedonic benefits of products.
Utilitarian benefits generally fulfil prevention goals and alleviate pain whilst hedonic
benefits fulfil promotion goals and enhance pleasure. However, to delight customers, it is
not sufficient to simply avoid pain by meeting prevention goals. Delight is best achieved
by fulfilling prevention goals through the consumption of utilitarian benefits,
complemented by the enhancement of pleasure through the consumption of hedonic

EMS (M. BUS. ADMIN. DEGREE) JUNE 2016 61
benefits that fulfil promotion goals (Chitturi et al., 2008:51). Attitudes and levels of
satisfaction tend to be associated to the relative weight of both these dimensions (Mano
and Oliver, 1993:453). The levels of intensity of the emotional experience from hedonic
benefits differ from utilitarian benefits, ultimately leading to different levels of customer
delight, satisfaction and loyalty. Utilitarian and hedonic values, Chaudhuri and Holbrook
(2001) suggest, lead to brand trust and brand affect. Thus,
H1: Utilitarian value is positively related to both (a) brand trust and (b) brand
affect.
H2: Hedonic value is positively related to both (a) brand trust and (b) brand
affect.
3.6.5.2 Brand Trust
Veloutsou (2015:407) asserts that trust exists when one party has confidence in a partner’s
reliability and integrity. Trust, he continues, is delicate and subjective; it is based on
consumer beliefs rather than hard facts. Consumers trust brands which they feel to be
secure and reliable and believe that these brands act in their best interests (Delgado-
Ballester, Munuera-Alemán and Yagüe-Guillén, 2003:37).
Chaudhuri and Holbrook (2001:37) and Matzler Grabner-Krauter and Bidmon (2006:77)
view brand trust “as the willingness of the average consumer to rely on the ability of the
brand to perform its stated function”. Delgado-Ballester (2011:14) identifies two
dimensions of brand trust, namely:
(i) Reliability: Relates to the technical or competence-based ability / willingness
projected by the brand to keep promises and satisfy consumers' needs.
(ii) Good intentions of the brand / dependability: Relates to concern for consumers'
interests and welfare projected by the brand.
Brand trust development is a long-term process and a trustworthy brand needs to show that
it cares about customer expectations, fulfilling promises and valuing customers (Kiyani et
al., 2012: 491).
EMS (M. BUS. ADMIN. DEGREE) JUNE 2016 62
Fournier and Yao (1997) state that marketers should understand the trust factors in the
relationship. Baumann, Hamin and Chong (2014:29) report that “the ultimate goal of
marketing is to generate an intense bond between the consumer and the brand, and the
main ingredient of this bond is trust”. They add that “trust lies at the heart of the marketing
concept”.
Trust appears to be essential in the process of building and maintaining relationships with
brands and to build partnerships with consumers (Veloutsou, 2015:409; Yoo and Bai,
2013:167). A stable brand personality and consistency in goods or service attributes will
reduce emotional risk for purchasers and increases brand credibility (Veloutsou,
2015:407). This can result in the development of trust and satisfaction, especially when
customers believe that the brand supports their needs. Kiyani et al. (2012:491) suggest that
trust plays an important role in customer repeat purchase decisions and long term consumer
satisfaction. Thus,
H3: Brand is positively related to consumer satisfaction.
3.6.5.3 Brand Affect
Chaudhuri et al. (2002:37) define brand affect as the “potential in a brand to elicit a
positive emotional response in the average consumer as a result of its use”. Perceived
differences in brands in terms of quality and reliability lead to a higher perception of the
brand when selected from that product category, which in-turn leads to greater
commitment to that chosen brand, greater brand trust, and / or greater brand affect
(Chaudhuri and Holbrook, 2002:38).
Moolla and Bisschoff (2012:79) declare that brand affect is normally characterised by two
independent dimensions, namely positive and negative. It can be generally stated that
people strive to experience positive and avoid negative effect (Moolla, 2010:133). There is
thus a positive relationship between positive affect experienced in a retail context and
willingness to buy. Brand affect is seen as affective commitment especially where a
customer experiences a favourable attitude towards brands that they purchase regularly.

EMS (M. BUS. ADMIN. DEGREE) JUNE 2016 63
Customers therefore can be said to form a satisfaction judgement of the brand and can
substantiate why they became loyal to the brand (Basson, 2014:41). Basson (2014:41)
further reports that brand affect serves as a predictor of consumer behaviour, while hedonic
value and personality traits are seen as two drivers of brand affect. Mano and Oliver (1993)
assert that affect is an antecedent to, and necessary for, satisfaction. In a retail setting
where there are large assortments and choice overload, Spassova and Isen (2013) suggest
that positive affect shifts people's attention from the difficulty of the choice task and
provide satisfaction. Thus,
H4: Brand affect positively affects consumer satisfaction.
3.6.5.4 Consumer Satisfaction
Customer satisfaction depends on a product’s perceived performance relative to a buyer’s
expectations (Mazibuko, 2010:13). If the product’s performance falls short of expectations,
the customer is dissatisfied. If performance matches expectations, the customer is satisfied.
If performance exceeds expectations, the customer is highly satisfied or delighted (Kotler
and Armstrong, 2010:37). Schiffman and Kanuk (2010:29) affirm that customer
satisfaction “is the individual consumer’s perception of the performance of the product or
service in relation to his or her expectations”.
Thurn and Gustafsson (2012:40) report that the benefits of high customer satisfaction are
decreased price elasticity, increased customer loyalty, decreased future transactions costs,
reduced charges imposed on attracting new customers, and improved reputation for the
company. Punniyamoorthy and Raj (2007:225) declare that customer satisfaction helps to
explain post-purchase behaviours, including complaining, word-of-mouth, repurchasing
intention and product usage.
Product satisfaction is characterised by an attitude-like post-consumption evaluative
judgment. Both affect and cognitive product attributes are posited to influence satisfaction
simultaneously (Mano and Oliver, 1993:454). Customer satisfaction is deemed to be one of
the most important determinants of customer loyalty (Dick and Basu, 1994:104; Oliver,
1999:33).

EMS (M. BUS. ADMIN. DEGREE) JUNE 2016 64
Customer satisfaction, Chitturi et al. (2008:48) report, does not necessarily translate into
customer loyalty because consumers seek more than just being satisfied. Although a
customer is satisfied, the creation of customer loyalty differs among products, industries
and situations (Zineldin et al., 2014:2). Sahin, Zehir and Kitapçı (2011:1290) see
satisfaction as a proxy or an antecedent of loyalty. Brand satisfaction is relative to each
brand's position in the market at any given time (Moolla, 2010:128). According to Kiyani
(2012:497), brand satisfaction is the most commonly used variable to measure brand
loyalty, especially as an increase in satisfaction generally leads to an increase in loyalty.
Musa (2005) proposes that customer satisfaction leads to both behavioural and attitudinal
loyalty. Thus,
H5: Customer satisfaction is positively related to (a) behavioural brand loyalty
and (b) attitudinal brand loyalty.
3.6.5.5 Behavioural loyalty and attitudinal loyalty
This research reviewed the behavioural and attitudinal nature of brand loyalty, including
the definitions, various researchers’ views on each of the loyalties and the ways in which
these concepts differ.
The crux of the composite nature of brand loyalty is the psychological process whereby
repeat purchase, which characterise behavioural loyalty, is not merely an arbitrary response
but the result of some proceeding psychological, emotional and situational factors. It is
argued that both the behavioural and attitudinal characteristics of consumers are necessary
in measuring brand loyalty to get a full picture of the concept (Nyanga, 2015:8; Yoo and
Bai, 2013:167; Bandyopadhyay and Martel, 2007; Dick and Basu, 1994; Jacoby and
Kyner, 1973; Oliver, 1999). This study therefore not only investigates whether both
behavioural and attitudinal loyalties are developed for FMCGs, but also proposes a
conceptual model which attempts to explain both loyalties.

EMS (M. BUS. ADMIN. DEGREE) JUNE 2016 65
3.7 Conclusion
This chapter discussed the drivers of brand loyalty. It explored the benefits of building and
maintaining brand loyalty. The two philosophical viewpoints, namely the stochastic vs
deterministic perspectives of brand loyalty, and the behaviourist vs the attitudinal
perspectives of brand loyalty were discussed. The chapter also reviewed various studies
which have investigated the drivers of brand loyalty. The chapter presented important
brand loyalty models which guided the development of this study’s model. The chapter
ended by presenting this study’s conceptual model and discussing the variables in the
model and the relationships that exist between the variables of the model. The next chapter
discusses the methodology used to test the study’s proposed model.

EMS (M. BUS. ADMIN. DEGREE) JUNE 2016 66
4. RESEARCH METHODOLOGY
4.1 Introduction
Chapter 3 reviewed studies and models which examined the drivers of brand loyalty. This
study’s conceptual model was developed based on these reviews. This chapter discusses
the methods used to test the study’s conceptual model. It specifically discusses the research
methods used to collect and analyse the data, describing the sampling technique and the
composition of the sample. It starts by recapping the research objectives.
4.2 Research Objectives and Question
As stated in Chapter 1, this study aimed to achieve the following research objectives:
(i) To investigate whether, in addition to the utilitarian benefits consumers enjoy
from the consumption of FMCGs, they also enjoy hedonic benefits.
(ii) To investigate whether consumers can be loyal to FMCGs.
(iii) To examine how the utilitarian and hedonic benefits consumers enjoy from some
selected FMCG brands affect their brand trust, brand affect and satisfaction with
the brand, and how this satisfaction in turn affects behavioural and attitudinal
brand loyalty.
Considering these objectives, the main research question to be answered was:
How do utilitarian benefits, hedonic benefits, brand trust, brand affect and brand
satisfaction of selected FMCG brands in South Africa affect the brand loyalties of Western
Cape consumers?
The next section discusses the research design deemed to be appropriate for the answering
of this question.

EMS (M. BUS. ADMIN. DEGREE) JUNE 2016 67
4.3 Research design
Sekaran (2003:29) views a research design as a framework for conducting market research.
Such a framework guides the collection, analyses and reporting of information needed to
structure and solve a research problem or answer a research question. Sekaran (2003:29)
further states that a research design is set up to decide on issues such as how to collect data,
analyse and interpret the data, and provide answers to problems or questions. Marketing
research can be broadly classified into three types of research designs, namely exploratory,
descriptive or causal (Kotler and Keller, 2006:104). These different types are used to
address different types of research objectives.
Figure 4.1: Types of primary research designs, according to Kotler and Keller
(2006:104)
Source: Kotler and Keller (2006:104)
4.3.1 Exploratory research
This type of research design emphasises the discovery of ideas and insights, and often
seeks to generate possible explanations for new or ambiguous occurrences whilst
attempting to eliminate impractical ideas (Kotler and Keller, 2006). It often represents the
initial step of the research process and helps to narrow and refine the research questions.

EMS (M. BUS. ADMIN. DEGREE) JUNE 2016 68
4.3.2 Descriptive research
This design marks the midpoint of a knowledge spectrum between exploratory and causal
or explanatory designs. It provides a detailed account of a social setting or a situation
(Kotler and Keller, 2006). Descriptive design is used when a study aims to describe a
market phenomenon (Malhotra, 2012).
4.3.3 Causal research
This design focuses on identifying cause-and-effect relationships via experimental testing.
It is the most robust research type and relies on inferences of probabilistic relationships
between variables (Kotler and Keller, 2006).
Considering that this study aims at describing a market phenomenon of how utilitarian
benefits, hedonic benefits, brand trust, brand affect and brand satisfaction of selected
FMCG brands in South Africa affect the brand loyalty of Western Cape consumers,
descriptive design is most appropriate methodology for this study.
The descriptive study was executed following Zikmund et al.’s (2010:63) research process
as presented in Figure 4.2. According to the process, studies which are not exploratory start
with the setting of objectives, followed by selecting a research design, all of which was
reported in sections 4.2 and 4.3. The next step was the selection of a data collection method
and analytical approach, addressed in section 4.4.
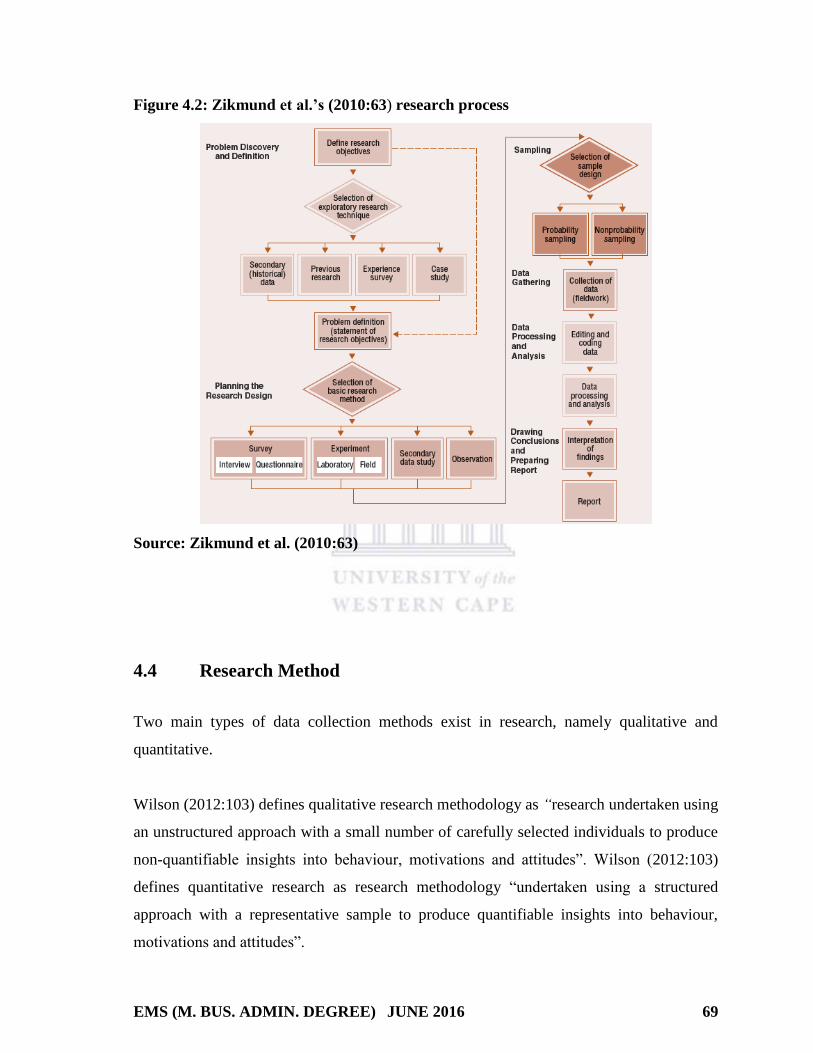
EMS (M. BUS. ADMIN. DEGREE) JUNE 2016 69
Figure 4.2: Zikmund et al.’s (2010:63) research process
Source: Zikmund et al. (2010:63)
4.4 Research Method
Two main types of data collection methods exist in research, namely qualitative and
quantitative.
Wilson (2012:103) defines qualitative research methodology as “research undertaken using
an unstructured approach with a small number of carefully selected individuals to produce
non-quantifiable insights into behaviour, motivations and attitudes”. Wilson (2012:103)
defines quantitative research as research methodology “undertaken using a structured
approach with a representative sample to produce quantifiable insights into behaviour,
motivations and attitudes”.

EMS (M. BUS. ADMIN. DEGREE) JUNE 2016 70
Mbuyazi (2012:127) differentiates between quantitative and qualitative research methods
as presented in Table 4.1.
Table 4.1: Comparison between qualitative and quantitative research methods
Qualitative methods Quantitative methods
Provides depth of understanding Measures level of occurrence
Studies motivations Studies actions
Asks “why?” Asks “how many?” and “how often?”
Enables discovery Provides proof
Is exploratory Is definitive
Allows insights into the behavior and trends Measures levels of actions and trends
Interprets Describes
Source: Mbuyazi (2012:127)
Sekaran (2003:5) reports that quantitative research can be further sub-classified into
inferential, experimental and simulation research approaches:
The inferential quantitative research approach aims to form a data base from
which to infer the characteristics of or relationships in a population. This usually
involves research surveys where a sample of population is studied or observed to
determine its characteristics, which is then used to infer that the population may
have the same characteristics.
The experimental quantitative research approach is characterised by greater
control over the research environment with some variables being manipulated to
observe their effect on other variables.
The simulation quantitative research approach involves the construction of an
artificial environment within which relevant information and data can be
generated. This permits observation of the dynamic behaviour of a system under
controlled conditions.

EMS (M. BUS. ADMIN. DEGREE) JUNE 2016 71
Considering the nature, namely testing relationships between multi-variables, of this
study’s research problem and questions, quantitative research methods were used to collect
and analyse the data.
A survey method using questionnaires was specifically designed to collect data. Surveys
provide a quick, inexpensive, efficient and accurate means of assessing information about a
population. Most surveys attempt to portray representative cross-sections of particular
target populations (Zikmund et. al., 2010:186).
For this study, cross-sectional data was collected using self-administered questionnaires.
The instruments were tested and proved to be reliable and valid to test the study’s
variables. The data was collected through mall intercepts at significantly big malls
identified in Cape Town, which is in the Western Cape province of South Africa.
4.5 Sampling Technique and Procedure
A common goal of survey research is to collect data representative of a population. Kothari
(2004:158) defines a sample population as “an aggregate of items possessing a common
trait or traits.” In other words, a sample population is a complete group of items about
which knowledge is sought. Sampling involves any procedure that draws conclusions
based on measurements of a portion of the population. The researcher uses information
gathered from a survey to generalise findings from a drawn sample back to the population
(Zikmund et al., 2010).

EMS (M. BUS. ADMIN. DEGREE) JUNE 2016 72
4.5.1 Target population
A target population is the group of people to which a study wishes to generalise its
findings. It must be carefully defined so that the proper sources from which the data is
collected can be identified (Zikmund et al., 2010:406). For this study, the target population
is all the purchasers and consumers of FMCG brands in South Africa, capable of reporting
the benefits, brand trust, brand affect, brand satisfaction and brand loyalty to selected
FMCG brands.
4.5.2 Sample frame
A sample frame is a set of source materials from which a sample is selected. It can also be
defined as members of the target population that are to be surveyed. In a household survey,
more than one set of materials may be necessary and typically drawn from area frames, or
may be selected either from an area or a list frame (Zikmund et al., 2010:406). See
subsections below on area and list of frames.
It is good practice to make sure that members from each stratum or distinct group are fairly
represented in a sample frame which represents a population. For a stratified sample, the
population is divided into strata and a random sample is drawn from each stratum. The
number chosen from each stratum has to be in the right mix (Waters, 2011:89). For this
study, as per Knox and Walker (2001), a stratified random sampling method was used
since it enabled the recruitment of respondents from different strata of the population.
According to Galpin (2002:54), the common stratifying variables for people are age, sex,
race, income group, occupation, and education.
This study’s main sample frame consisted of White, Indian, Coloured and Black South
African shopping centre patrons. They were selected from Nyanga (to obtain Blacks
patrons, most of whom are lower income consumers), Mitchell’s Plain (to obtain middle
income Coloureds and Blacks patrons), and Century City (to obtain high income Whites,
Coloureds and Black patrons). The strata were more specifically confined to the shopping
malls in these areas (i.e. Nyanga Junction on the outskirts of Nyanga, Westgate Mall and

EMS (M. BUS. ADMIN. DEGREE) JUNE 2016 73
Promenade Mall in Mitchell’s Plain, and Canal Walk in Century City), all of which had
either SPAR, Pick n Pay and Shoprite/Checkers retailers which sold FMCGs. The reason
for focusing on these big retailers, as explained in Chapter 2, is because various sources
indicate that at least 80% of all South Africans purchase some FMCGs from these large,
formal retailers. This means that a planned random mall-intercept sample in these stores
was expected to yield a well distributed, randomised sample.
4.5.3 Sample size
In a quantitative survey design, determining the sample size and dealing with non-response
bias is essential (Hair et al., 1998). For this study, it was envisaged that the targeted sample
size would be 450 consumers, based on 150 respondents being sought from the three
targeted shopping malls in the Western Cape, South Africa. Due to the difficulty of
collecting data through mall intercepts, data was however only collected from 272
respondents. According to Hair et al.’s (1998) rule of thumb, the sample size of 272 was
adequate as the number of respondents should represent a ratio of 14 observations per
variable studied for multivariate analyses. This study had seven variables and when
multiplied with the recommended 14 observations, a suggested minimum sample size of 98
was obtained. For structural equation modelling (SEM) however, Hoe (2008) recommends
that a sample size of about 200 respondents would provide credible data. Thus the sample
size of 272 for this study was adequate to conduct SEM.
4.6 Data Collection
As previously indicated, this study employed a quantitative method with a survey
questionnaire to gather data from respondents via mall intercepts at three malls in the
Western Cape.

EMS (M. BUS. ADMIN. DEGREE) JUNE 2016 74
4.6.1 Survey questionnaire development
Previously tested scales from seminal authors on the subject, such as Mano and Oliver
(1983), Chaudhuri and Holbrook (2001) and Chitturi et al. (2008) were used as instruments
for data collection. The instruments were adapted to selected branded FMCG categories,
such as washing powder, soap, juice, milk, and breakfast cereals brands as indicated in
Figure 4.3.
Figure 4.3: FMCG brands investigated in this study
Examples of washing powder brands in South African stores
Examples of soap brands in South African stores
Examples of juice brands in South African stores
Examples of milk brands in South African stores

EMS (M. BUS. ADMIN. DEGREE) JUNE 2016 75
Examples of breakfast cereal brands in South African stores
The first section of the survey questionnaire consisted of an introduction to the survey,
clearly stating what the aim of the research study was, along with ethical and confidential
declarations assuring respondents of anonymity and confidentiality. This section was
followed by a personal data section where aspects like gender, age, race, education
approximations and living area descriptions were sought, without the requirement that the
respondent’s identity be declared.
The rest of the sections contained statements that measured utilitarian and hedonic values,
brand affect, brand trust, brand satisfaction and behavioural and attitudinal loyalties.
Respondents were asked to rate the degree to which they agreed or disagreed to a five-
point Likert scale scoring from 1 (strongly disagree) to 5 (strongly agree).
4.6.2 Data collection procedure
In addition to the researcher who collected data from the mall intercept at malls in the
Century City and Mitchell’s Plain regions, a Xhosa speaking marketing student was trained
as a fieldworker to collect data from the Nyanga region where English is a second
language. The trained Xhosa speaking fieldworker was there to provide clarity to any
questions in Xhosa. The researcher and the fieldworker had a training session before the
data collection started to set ground rules for the questionnaire administration. The rules
included aspects such as how the mall shoppers would be approached, and when and how
the respondents would be assisted in completing the questionnaire should it become
apparent that help was required. Other principles included having integrity and being open
EMS (M. BUS. ADMIN. DEGREE) JUNE 2016 76
with the respondents, maintaining patience, tact and respect for the respondents, and being
accurate and honest in administering the surveys.
Since the respondents were incentivised with juice packages to participate in the survey,
the fieldworker was also trained on how the reward could be presented without influencing
any responses. According to Zikmund et al. (2010), incentives should be provided after
survey participation to prevent the gift’s influence on responses.
The targeted respondents were both male and female respondents, of all races, from all
socio-economic backgrounds between the ages of 18 and 60 years old, who have just been
patrons (consumers or customers) of FMCG products. The targeted respondents were
intercepted as they left the check-out tills of the retailers.
Data was collected on Saturdays and Sundays over a two month period and not just
focussing on month-end days, to prevent the effect of month-end price promotions which
could affect purchase behaviour and responses from patrons.
4.6.3 Pilot study
The first designed questionnaire took into consideration the fact that shopping mall patrons
might struggle to understand the response style typically used in marketing questionnaires.
Infographics like pictograms or animated face scales were thus used to guide responses as
indicated in Figure 4.4 below. This concept was tested with ten patrons whose first
language was not English as well as additional ten responses form students and staff from
the University of Western Cape. It was surprising to find that the infographics were even
more confusing to these respondents than a typical Likert scale. The format was
consequently replaced with a traditional Likert scale.

EMS (M. BUS. ADMIN. DEGREE) JUNE 2016 77
Figure 4.4: Pictograms as Likert infographic animated face scales used in the pilot
study
Source: Researcher’s own survey questionnaire development
A traditional 5-point Likert interval scale was then pilot tested with 20 BCom Honours
students and staff members from the University of Western Cape who were likely
customers of FMCGs. A small, 200mL juice was displayed as a covered mystery reward to
the respondents of the survey to prevent influencing their responses when considering
brand loyalty to juice brands. Two survey quality questions were also added at the end of
the survey to assess how well the survey was perceived by the respondents.
The standard deviation in the pilot study data showed acceptable variations or dispersions
from the average or mean results, indicating that the data points tended to be very close to
the mean. Skewness was evaluated as a measure of the asymmetry of the probability
distribution of the variables. A Cronbach alpha was also evaluated as a measure of internal
consistency. For most of the constructs, the Cronbach alphas were above the 0.7 level,
indicating that the internal consistency was acceptable as measures of the constructs. All
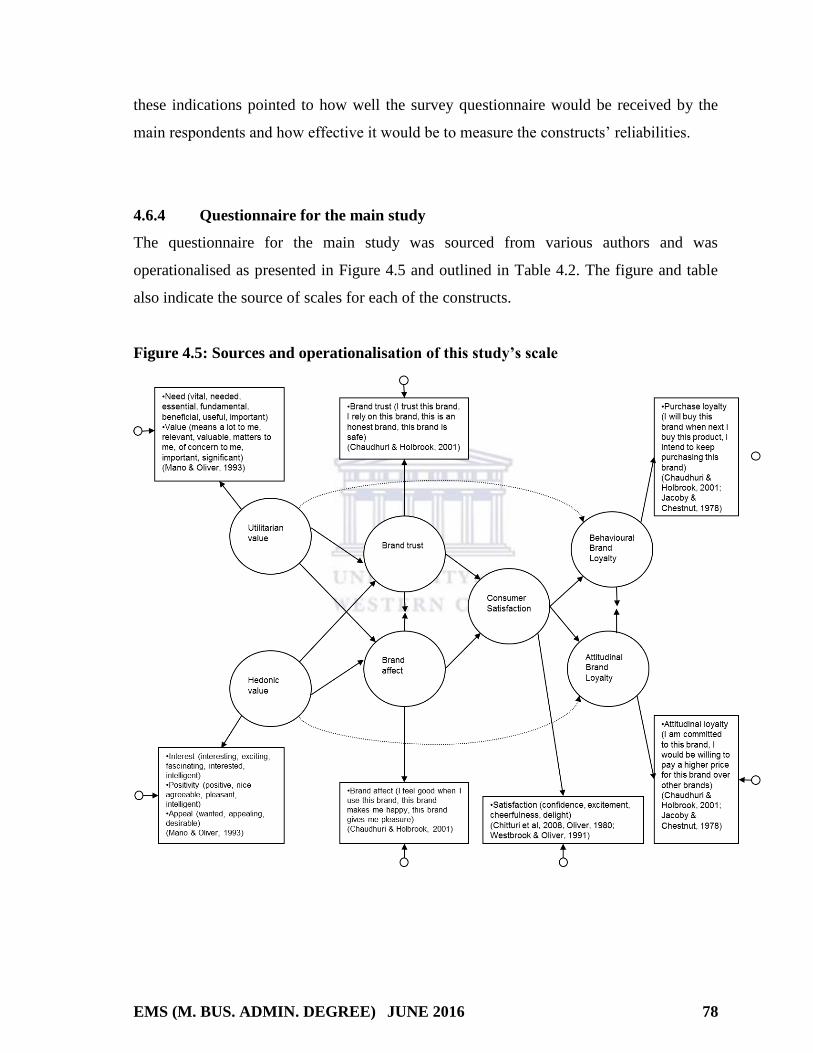
EMS (M. BUS. ADMIN. DEGREE) JUNE 2016 78
these indications pointed to how well the survey questionnaire would be received by the
main respondents and how effective it would be to measure the constructs’ reliabilities.
4.6.4 Questionnaire for the main study
The questionnaire for the main study was sourced from various authors and was
operationalised as presented in Figure 4.5 and outlined in Table 4.2. The figure and table
also indicate the source of scales for each of the constructs.
Figure 4.5: Sources and operationalisation of this study’s scale

EMS (M. BUS. ADMIN. DEGREE) JUNE 2016 79
Table 4.2: Questionnaire scales and their origins
Dimension Code Item Source
Utilitarian
value
B1 When I buy FMCG products, such as those shown
above, I need brand names as a guide to choose.
Mano and
Oliver
(1993)
B2 The brand names of FMCG products, such as those
shown above, indicate that the products will work better
than unbranded versions.
B3 Any of the brands, such as those shown above, will be
beneficial to me in terms of performance when I buy
FMCG products.
B4 The brands of FMCG products, such as those shown
above, are not a guarantee of better performance.
B5 The brands of FMCG products, such as those shown
above, are important to me because they perform their
functions.
B6 I trust the brands of FMCG products, such as those
shown above.
B7 I would buy the brands of FMCG products, such as those
shown above, because the value they offer is important to
me.
B8 Brands, such as those shown above, are more reliable in
their performance compared to FMCG products without
brand names.
Hedonic
value
C1 I think the brands of FMCG products, such as those
shown above, are interesting when one chooses these
products.
Mano and
Oliver
(1993)
C2 I think the sight of brands of FMCG products, such as
those shown above, is exciting.
C3 I think the brands of FMCG products, such as those
shown above, are brilliant.
C4 I like the fact that brands of FMCG products, such as
those shown above, can better perform their jobs.
C5 I think the brands of FMCG products, such as those
shown above, look more pleasant than un- branded
products.
C6 I think the brands of FMCG products, such as those
shown above, are more attractive than un-branded
products.
C7 FMCG products with brand names, as shown above, are
more likable when compared to those without brand
names.
Consumer
brand
satisfaction
D1 The brands of FMCG products, such as those shown
above, make me happy when shopping for these types of
products.
Chitturi et
al. (2008);
Oliver
(1980);
Westbrook D2 The brands of FMCG products, such as those shown
above, satisfy my needs.

EMS (M. BUS. ADMIN. DEGREE) JUNE 2016 80
D3 I am excited when I use brands of FMCG products, such
as those shown above.
and Oliver
(1991)
D4 I am confident in brands of FMCG products, such as
those shown above.
D5 I trust / feel secure in brands of FMCG products, such as
those shown above.
D6 I get pleasantly surprised when using brands of FMCG
products, such as those shown above.
D7 I sometimes feel worried when using the brands of
FMCG products, such as those shown above.
D8 I am sometimes disappointed with brands of FMCG
products, such as those shown above.
Behavioural
brand loyalty
E1 My next shopping trip for FMCG products will contain
branded FMCG products, such as those shown above. Chaudhuri
and
Holbrook
(2001);
Jacoby and
Chestnut
(1978)
E2 I will continue to buy branded FMCG products, such as
those shown above when.
E3 Any of the brands of FMCG products, such as those
shown above, will always be on my list when I shop for
these types of products.
Attitudinal
brand loyalty
F1 I am committed to using any of the brands of FMCG
products, such as those shown above.
Chaudhuri
and
Holbrook
(2001);
Jacoby an
Chestnut
(1978)
F2 When I shop for FMCG products, I am willing to pay a
bit more for any of the brands as shown above.
F3 I will not be happy when I shop for FMCG products and
do not find any of the brands as shown above.
Brand trust
G1 When I shop for FMCG products, I trust the brands as
shown above. Chaudhuri
and
Holbrook
(2001)
Jacoby and
Chestnut
(1978)
G2 When I shop for FMCG products, I depend on brands as
shown above.
G3 I see honesty and reliability in the brands of FMCG
products, such as those shown above.
G4 I see safety and peace of mind in the brands of FMCG
products, such as those shown above.
Brand affect
H1 I feel good when I use any of the brands of FMCG
products, such as those shown above.
Chaudhuri
and
Holbrook
(2001);
Jacoby and
Chestnut
(1978)
H2 I feel happy when I use any of the brands of FMCG
products, such as those shown above.
H3 I am pleased when I use brands of FMCG products,
such as those shown above.
Survey
quality
I1 I found this survey experience pleasant. N/A
I2 This survey length was okay.
The reliability of this study’s main scales was tested and the results are presented in
chapter 5.

EMS (M. BUS. ADMIN. DEGREE) JUNE 2016 81
4.7 Data Analysis
The data captured from the questionnaire represents raw data which needs to be converted
into intelligence through analysis (Zikmund et al., 2010). The analyses in this study started
with applying descriptive statistics.
4.7.1 Descriptive statistics
Zikmund et al. (2010:486) describe descriptive statistics as an elementary transformation
of data in a way that describes the basic characteristics of the data such as central tendency,
distribution and variability. Zikmund et al. (2010) further state that descriptive statistics are
very effective for simplifying and articulating vast amounts of data and can also provide
the researcher with an opportunity to determine the frequency of variables and the effect
different variables have on one another. The descriptive statistics applied in this study
included sample descriptions of the demographic information including age, education,
race and residential classifications supplied by the respondents.
Descriptive statistics were also applied to assess the reliability of the measuring instrument
using Cronbach alpha coefficients. Cronbach alpha is a measure of internal consistency; in
other words, how closely related a set of items are as a group. A "high" alpha coefficient of
α ≥ 0.7 is often used as evidence that the items measure an underlying or latent construct
(Sekaran, 2003).
Before conducting the main analysis to test the conceptual model, correlation analysis was
conducted. Correlation measures the strength of an association between the constructs in a
conceptual model before structural equation modeling (SEM) is conducted.

EMS (M. BUS. ADMIN. DEGREE) JUNE 2016 82
4.7.2 Structural equation modeling (SEM)
SEM is a methodology for representing, estimating, and testing a network of relationships
between variables, potentially as measured variables and latent constructs (Suhr, 2006:1).
SEM is a multivariate and dependence technique used for hypothesis testing and involves
distinctions between independent and dependent variables. It specifies measurement errors
in the statistical analysis.
SEM is a flexible and comprehensive methodology which offers no default model and
places few limitations on what types of relations can be investigated and specified (Suhr,
2006:1). Model specification in SEM requires researchers to support hypotheses with
theory. SEM resolves problems of multicollinearity as multiple measures are required to
describe a latent construct / unobserved variable, thereby preventing multicollinearity from
occurring as the unobserved variables represent distinct latent constructs. SEM is a graphic
representation which is a convenient and powerful way to present complex relationships. A
pictorial diagram represents a model, visually transformed into a set of equations. The set
of equations are simultaneously solved to test model fit and estimate parameters
(Iacobucci, 2009:673).
For this investigation, SEM was employed to test the study’s conceptual model which
portrayed relationships between utilitarian and hedonic brand values, brand trust, brand
affect, consumer brand satisfaction, and behavioural and attitudinal brand loyalties. SEM
was conducted using an AMOS programme. The results are presented in Chapter 5.

EMS (M. BUS. ADMIN. DEGREE) JUNE 2016 83
4.8 Ethical Considerations
Ethical considerations pertaining to this research included, but were not limited to, the
citing of quotations, referencing of sources and guaranteeing the confidentiality of
respondents. The participants were assured of their right to participate, and that they could
withdraw from the study at any time should they feel uncomfortable. All data sources were
acknowledged to respect the intellectual property rights of other authors and to avoid
plagiarism.
4.9 Conclusion
This chapter recapped the objectives of this study and discussed the research methodology
along with the data collection and analysis techniques. It concluded by identifying the
ethical considerations in conducting the research. The results of the analyses are presented
in Chapter 5.
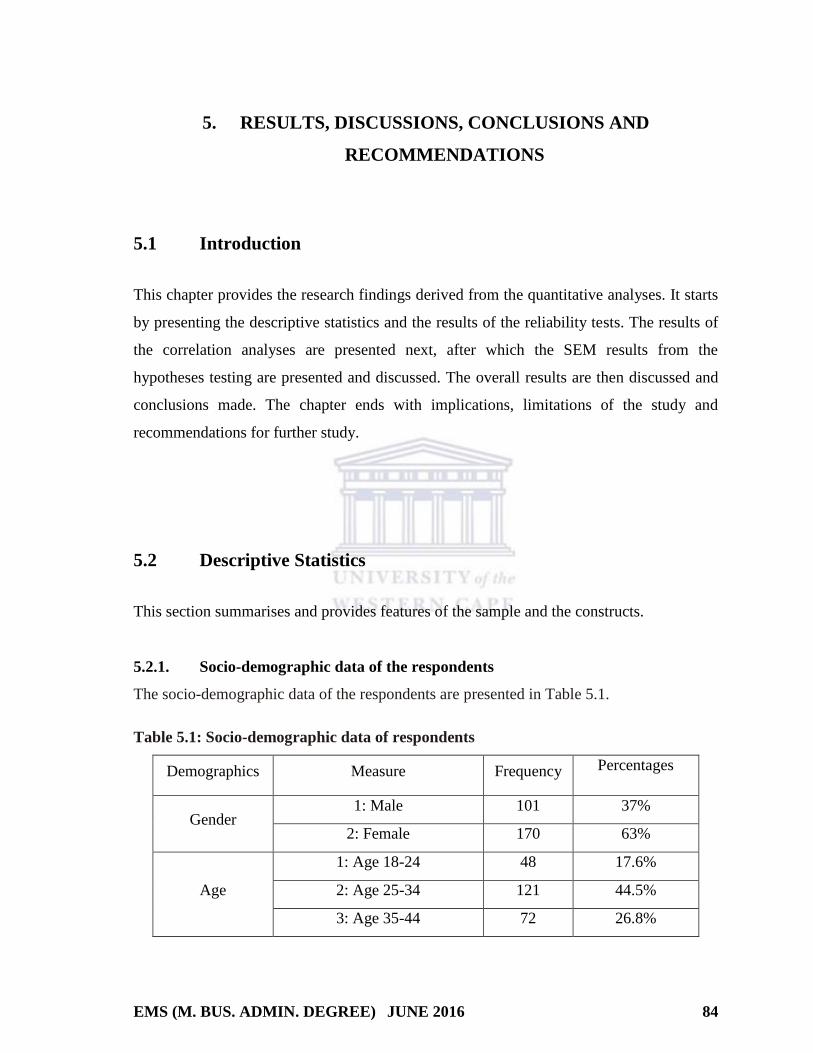
EMS (M. BUS. ADMIN. DEGREE) JUNE 2016 84
5. RESULTS, DISCUSSIONS, CONCLUSIONS AND
RECOMMENDATIONS
5.1 Introduction
This chapter provides the research findings derived from the quantitative analyses. It starts
by presenting the descriptive statistics and the results of the reliability tests. The results of
the correlation analyses are presented next, after which the SEM results from the
hypotheses testing are presented and discussed. The overall results are then discussed and
conclusions made. The chapter ends with implications, limitations of the study and
recommendations for further study.
5.2 Descriptive Statistics
This section summarises and provides features of the sample and the constructs.
5.2.1. Socio-demographic data of the respondents
The socio-demographic data of the respondents are presented in Table 5.1.
Table 5.1: Socio-demographic data of respondents
Demographics Measure Frequency Percentages
Gender 1: Male 101 37%
2: Female 170 63%
Age
1: Age 18-24 48 17.6%
2: Age 25-34 121 44.5%
3: Age 35-44 72 26.8%

EMS (M. BUS. ADMIN. DEGREE) JUNE 2016 85
4: Age 45-54 25 9.2%
5: Age 55-64 4 1.5%
6: Age 65 or over 1 0.4%
Population
Group
1: African 75 27.6%
2: White 21 7.7%
3: Indian 18 6.6%
4: Coloured 155 57.4%
5: Other 2 0.7%
Education
1: Attended Primary School 3 1.1%
2: Attended High School 142 52.6%
3: Diploma 69 25.7%
4: Undergraduate Degree 19 7.0%
5: Postgraduate Degree 37 13.6%
Marital Status
1: Married 128 47.4%
2: Single, Never Married 123 45.2%
3: Separated or Divorced 18 6.6%
4: Widowed 2 0.7%
Residence
1: Rural Settlement 11 4%
2: Village / Town 45 16.9%
3: City / Metropolitan Area 187 69.5%
4: Other 25 9.6%
Table 5.1 shows that 71.3% of the respondents were between the ages of 25-44. People in
this age group are usually in the workforce, are assumed to be shoppers who understand
the drivers of their brand satisfaction and loyalty and, as Martins (2007:172) report,
account for about 64.1% of FMCG expenditure in South Africa. This population group is a
reflection of the racial composition of people in the Western Cape of South Africa, where
the Coloured population group constitutes the majority, followed by Africans. The high
percentage (63%) of female respondents can be attributed to the fact that more females in
South Africa shop for grocery and FMCGs. It is encouraging to note that up to 98.9 % of
the respondents have obtained at least a high school certificate, and therefore should have
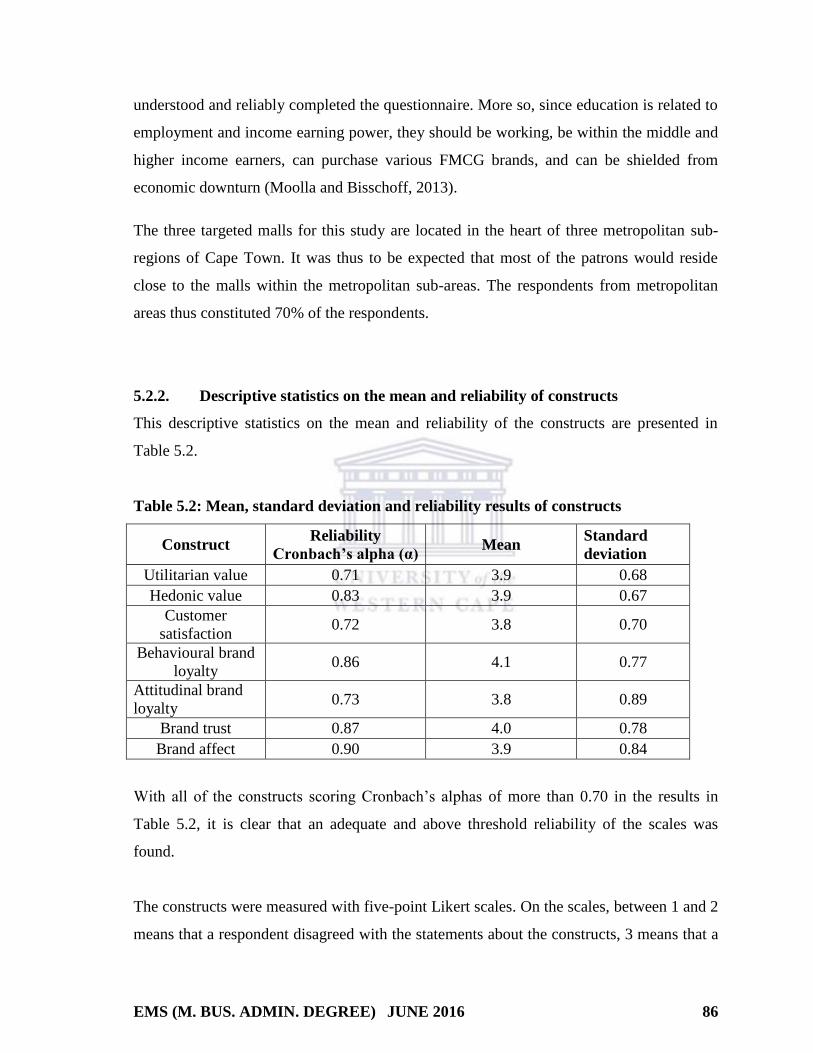
EMS (M. BUS. ADMIN. DEGREE) JUNE 2016 86
understood and reliably completed the questionnaire. More so, since education is related to
employment and income earning power, they should be working, be within the middle and
higher income earners, can purchase various FMCG brands, and can be shielded from
economic downturn (Moolla and Bisschoff, 2013).
The three targeted malls for this study are located in the heart of three metropolitan sub-
regions of Cape Town. It was thus to be expected that most of the patrons would reside
close to the malls within the metropolitan sub-areas. The respondents from metropolitan
areas thus constituted 70% of the respondents.
5.2.2. Descriptive statistics on the mean and reliability of constructs
This descriptive statistics on the mean and reliability of the constructs are presented in
Table 5.2.
Table 5.2: Mean, standard deviation and reliability results of constructs
Construct Reliability
Cronbach’s alpha (α) Mean
Standard
deviation
Utilitarian value 0.71 3.9 0.68
Hedonic value 0.83 3.9 0.67
Customer
satisfaction 0.72 3.8 0.70
Behavioural brand
loyalty 0.86 4.1 0.77
Attitudinal brand
loyalty 0.73 3.8 0.89
Brand trust 0.87 4.0 0.78
Brand affect 0.90 3.9 0.84
With all of the constructs scoring Cronbach’s alphas of more than 0.70 in the results in
Table 5.2, it is clear that an adequate and above threshold reliability of the scales was
found.
The constructs were measured with five-point Likert scales. On the scales, between 1 and 2
means that a respondent disagreed with the statements about the constructs, 3 means that a

EMS (M. BUS. ADMIN. DEGREE) JUNE 2016 87
respondent was neutral, and between 4 and 5 means that a respondent agreed and strongly
agreed with the statements.
The mean scores in Table 5.2 therefore show that the respondents equally enjoy utilitarian
(M = 3.9) and hedonic (M = 3.9) benefits or values from their consumption of FMCG
brands. They agreed that they trust (M = 4.0), are affectionate towards (M = 3.9), and
satisfied (M =3.8) with FMCG brands. All these results guaranteed behavioural (M =4.1)
and attitudinal (M =3.8) loyalties to FMCG brands. The next section reports on the results
of the correlations between the constructs.
5.2.3. Correlation between the constructs
The coding for the seven constructs was as follows:
a) Utilitarian benefits (BUV)
b) Hedonic benefits (BHV)
c) Brand trust (CBT)
d) Brand affect (CBA)
e) Brand satisfaction (CSAT)
f) Behaviour brand loyalty ( BBL)
g) Attitudinal brand loyalty (ABL)
The results of the correlations between the constructs are presented in Table 5.3
Table 5.3: Bivariate correlation results
Pearsons Correlations (β)
Pearsons correlation
(β) BUV BHV CSAT CBT CBA BBL ABL
BUV 1
BHV 0.658** 1

EMS (M. BUS. ADMIN. DEGREE) JUNE 2016 88
CSAT 0.555** 0.691** 1
CBT 0.623** 0.599** 0.716** 1
CBA 0.482** 0.594** 0.693** 0.755** 1
BBL 0.610** 0.593** 0.568** 0.707** 0.611** 1
ABL 0.562** 0.544** 0.662** 0.717** 0.657** 0.666** 1
** = All Correlations are positive and significant at < 0.01 level.
In addition to testing how much the constructs were related, a confirmatory factor analysis
(CFA) was conducted with SEM to test goodness-of-fit to the data. The results are
presented in the next section.
5.3 Structural Equation Modelling to Test the Conceptual Model
SEM was conducted with Amos version 22 to test the conceptual model in Figure 3.5. The
test started by assessing goodness-of-fit to the data conducting CFA.
5.3.1. Confirmatory Factor Analysis (CFA) to test goodness-of-fit (GOF)
The objective of CFA is to test whether a data fits a hypothesised measurement model.
Parameters are estimated and compared with the sample covariance matrix. GOF statistics
are then used to project whether the model is appropriate or needs further revision. A
variety of GOF indices pertaining to SEM are available. Kenny (2010) notes that fit is the
ability of a model to reproduce the data, usually illustrated as the variance-covariance
matrix. A good-fitting measurement model is required before interpreting the causal paths
of a structural model. It should however be noted that a good-fitting model is not
necessarily a valid model, and vice versa.
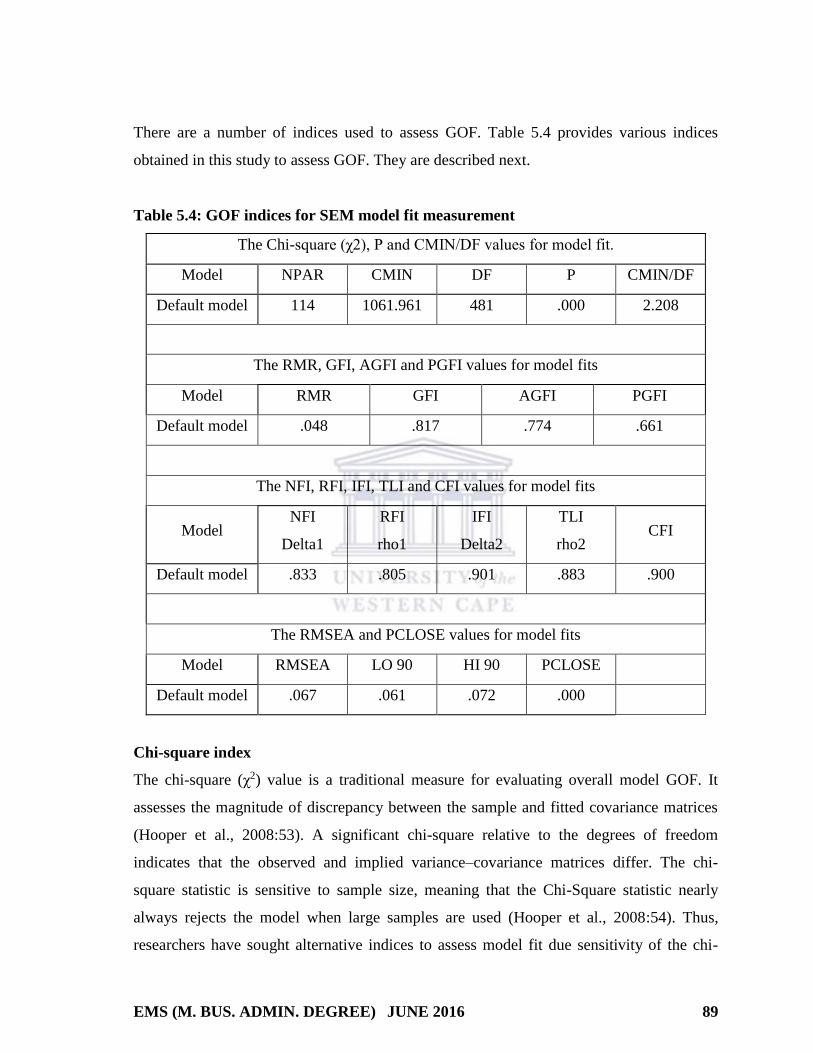
EMS (M. BUS. ADMIN. DEGREE) JUNE 2016 89
There are a number of indices used to assess GOF. Table 5.4 provides various indices
obtained in this study to assess GOF. They are described next.
Table 5.4: GOF indices for SEM model fit measurement
The Chi-square (χ2), P and CMIN/DF values for model fit.
Model NPAR CMIN DF P CMIN/DF
Default model 114 1061.961 481 .000 2.208
The RMR, GFI, AGFI and PGFI values for model fits
Model RMR GFI AGFI PGFI
Default model .048 .817 .774 .661
The NFI, RFI, IFI, TLI and CFI values for model fits
Model NFI
Delta1
RFI
rho1
IFI
Delta2
TLI
rho2 CFI
Default model .833 .805 .901 .883 .900
The RMSEA and PCLOSE values for model fits
Model RMSEA LO 90 HI 90 PCLOSE
Default model .067 .061 .072 .000
Chi-square index
The chi-square (χ2) value is a traditional measure for evaluating overall model GOF. It
assesses the magnitude of discrepancy between the sample and fitted covariance matrices
(Hooper et al., 2008:53). A significant chi-square relative to the degrees of freedom
indicates that the observed and implied variance–covariance matrices differ. The chi-
square statistic is sensitive to sample size, meaning that the Chi-Square statistic nearly
always rejects the model when large samples are used (Hooper et al., 2008:54). Thus,
researchers have sought alternative indices to assess model fit due sensitivity of the chi-

EMS (M. BUS. ADMIN. DEGREE) JUNE 2016 90
square to sample size. One of the alternatives is Wheaton et al.’s (1977) relative/normed
chi-square (CMIN/df), because it minimises sample size sensitivity. A good
relative/normed chi-square (CMIN/df) has to be less than 5. The relative/normed chi-
square (CMIN/df) for this study’s model was 2.208. This proposed model thus satisfies
Wheaton et al.’s (1977) recommended relative/normed chi-square (CMIN/df) range for
model fit.
Root mean square residual (RMR) index
The RMR is the square root of the difference between the residuals of the sample
covariance matrix and the hypothesized covariance model (Hooper et al., 2008:54). The
range of the RMR is calculated based on the scales of each indicator which, for this study,
was a range from 1 – 5. A popular cutoff value for this index is 0.05 or less. For this study,
RMR was acceptable with the obtained value of 0.048.
Goodness-of-fit index (GFI)
The GFI calculates the proportion of variance that is accounted for by the estimated
population covariance (Hooper et al. 2008, p. 55). This model fit measure considers the
variances and covariances accounted for by the model. Its statistic ranges from 0 to 1 with
a historic optimal level being GFI > 0.85. This study’s model produced a lower GFI score
of 0.817. The GFI index has however been criticised for sample sensitivity. So other GOF
indices should also be assessed for the test of model fit.
Comparative fit index (CFI)
The CFI provides a more appropriate GOF indication, even when sample sizes are small. It
assumes that all latent variables are uncorrelated (null / independence model) and
compares the sample covariance matrix with this null model. The CFI values range
between 0.0 and 1.0 with values closer to 1.0 indicating a good fit. The CFI index is
included in all SEM programmes and is one of the most popularly reported GOF indices
due to being one of the measures least affected by sample size. A cut-off criterion for CFI
≥ 0.90 was historically advanced as a desired measure of fit (Hooper et al., 2008). This
study’s model resulted in a CFI of 0.900 which complies with the desired guideline.

EMS (M. BUS. ADMIN. DEGREE) JUNE 2016 91
Root mean square error of approximation (RMSEA)
RMSEA indicates how well the model estimates would fit the population’s covariance
matrix. It is viewed as ‘one of the most powerful fit indices’ due to its sensitivity to the
number of estimated parameters in the model. This means that RMSEA favours parsimony
as it chooses the model with the lesser number of parameters. RMSEA values above 0.10
indicate a poor fit, values between 0.08 to 0.10 provides a mediocre fit and values below
0.08 show a good fit. This study’s observed model had a RMSEA value of 0.067 which is
thus indicative of a good fit of the model.
5.3.2. SEM path modelling and hypotheses testing
Having shown that the model fairly fits the data, this section provides results of testing the
hypothesised relationships in Figure 3.5. The resultant structural model in Figure 5.1 has
BUV → CBA and CBA → CSAT relationships removed, because they were not
significant in an initial model testing. The removal of these relationships improved the
explanatory power of the model.

EMS (M. BUS. ADMIN. DEGREE) JUNE 2016 92
Figure 5.1: SEM results of hypotheses testing
5.3.2.1 Relationship between utilitarian value (BUV), brand trust (CBT) and
Brand Affect (CBA)
H1 proposed that utilitarian value is positively related to both (a) brand trust and
(b) brand affect.
The structural model results in Figure 5.1 indicate that 69% of the variance of consumer
brand trust was explained by the model. The utilitarian value consumers enjoy from FMCG
brands positively contributed 27% to brand trust with (β=.27, ρ<.001). This means that,
when utilitarian value increases by 1 unit, brand trust will increase by 0.27 units as well.
As aforementioned, the relationship between utilitarian value and brand affect was not
significant and was deleted from the model to improve the explanatory power of the model.

EMS (M. BUS. ADMIN. DEGREE) JUNE 2016 93
5.3.2.2 Relationship between hedonic value (BHV), brand trust (CBT) and brand
affect (CBA)
H2 proposed that hedonic value is positively related to both (a) brand trust and
(b) brand affect.
The structural model results in Figure 5.1 indicate that 69% of the variance of consumer
brand trust was explained by the model. The hedonic value consumers enjoy from FMCG
brands positively contributed 60% to explaining the brand trust variance with (β=.60,
ρ<.001). This means that, when hedonic value increases by 1 unit, brand trust increases by
0.60 units.
The model explained 46% of the variance of consumer brand affect, with hedonic value
positively contributing 68% of this variance with (β=.68, ρ<.001). This means that, when
hedonic value increases by 1 unit, consumer brand affect increases by 0.68 units as well.
5.3.2.3 Relationship between brand trust (CBT) and Consumer satisfaction
(CSAT)
H3 proposed that brand trust is positively related to consumer satisfaction
The structural model results in Figure 5.1 indicate that 99% of the variance of consumer
satisfaction was explained by the model. Brand trust positively contributed to 99% of the
customer satisfaction variance with (β=.99, ρ<.001). This means that, when consumer
brand trust of FMCG increases by 1 unit, consumer satisfaction increases by 0.99 units as
well.
5.3.2.4 Relationship between brand affect (CBA) and Consumer satisfaction
(CSAT)
H4 hypothesized that brand affect positively affects consumer satisfaction
This relationship was deleted from the model since it was not significant. It had to be
removed to improve the explanatory power of the model.
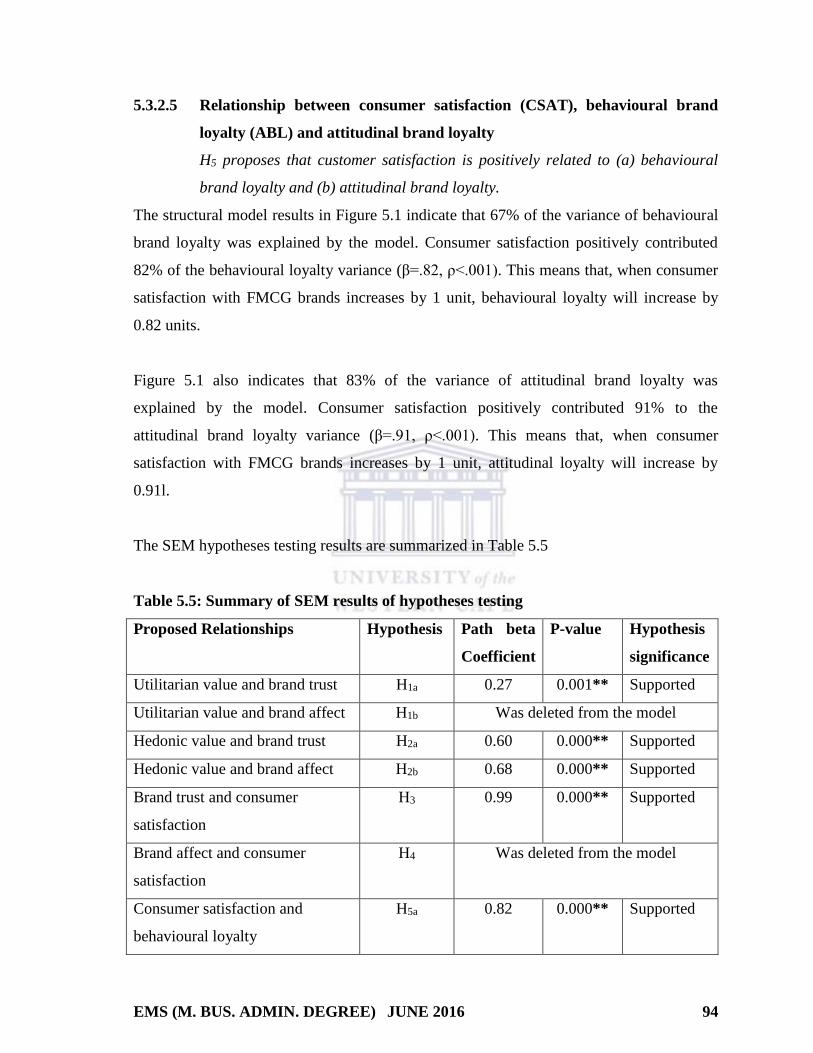
EMS (M. BUS. ADMIN. DEGREE) JUNE 2016 94
5.3.2.5 Relationship between consumer satisfaction (CSAT), behavioural brand
loyalty (ABL) and attitudinal brand loyalty
H5 proposes that customer satisfaction is positively related to (a) behavioural
brand loyalty and (b) attitudinal brand loyalty.
The structural model results in Figure 5.1 indicate that 67% of the variance of behavioural
brand loyalty was explained by the model. Consumer satisfaction positively contributed
82% of the behavioural loyalty variance (β=.82, ρ<.001). This means that, when consumer
satisfaction with FMCG brands increases by 1 unit, behavioural loyalty will increase by
0.82 units.
Figure 5.1 also indicates that 83% of the variance of attitudinal brand loyalty was
explained by the model. Consumer satisfaction positively contributed 91% to the
attitudinal brand loyalty variance (β=.91, ρ<.001). This means that, when consumer
satisfaction with FMCG brands increases by 1 unit, attitudinal loyalty will increase by
0.91l.
The SEM hypotheses testing results are summarized in Table 5.5
Table 5.5: Summary of SEM results of hypotheses testing
Proposed Relationships Hypothesis Path beta
Coefficient
P-value Hypothesis
significance
Utilitarian value and brand trust H1a 0.27 0.001** Supported
Utilitarian value and brand affect H1b Was deleted from the model
Hedonic value and brand trust H2a 0.60 0.000** Supported
Hedonic value and brand affect H2b 0.68 0.000** Supported
Brand trust and consumer
satisfaction
H3 0.99 0.000** Supported
Brand affect and consumer
satisfaction
H4 Was deleted from the model
Consumer satisfaction and
behavioural loyalty
H5a 0.82 0.000** Supported

EMS (M. BUS. ADMIN. DEGREE) JUNE 2016 95
Consumer satisfaction and
attitudinal loyalty
H5b 0.91 0.000** Supported
**significant at the 0.01 level
5.4 Discussion of the Results
The objectives of this study were to assess whether, in addition to utilitarian values,
consumers derive hedonic values from FMCGs. The study also assessed whether
consumers can be loyal to FMCGs, and how the utilitarian and hedonic values they hold
for some selected FMCG brands affect their brand trust, brand affect and satisfaction with
the brand. The assessment included a determination of how satisfaction in turn affects
behavioural and attitudinal brand loyalty. The findings of this study can be compared with
comparable findings like Chitturi et al. (2008), Chaudhuri and Holbrook (2001), Musa
(2005) and Moolla and Bisschoff (2013) who have conducted related studies.
5.4.1 Do consumers receive hedonic values from FMCGs?
Considering that FMCGs are low value items that are frequently sold by retailers (Kotler
and Armstrong, 2011:374) and are convenient and low involvement products (Joghee and
Pillai, 2013:9), it was questioned whether consumers enjoy hedonic benefits from FMCGs.
Unlike Do Vale and Duarte (2013) who found that FMCGs hold more utilitarian value over
hedonic value in Portugal, this study shows that, compared to utilitarian value, consumers
in South Africa equally enjoy hedonic benefits from FMCGs with (M = 3.9 for hedonic
value and M = 3.9 for utilitarian value). This finding is supported by Negm, Sahn and
Tantawi’s (2012:63) findings, which revealed that consumers in Egypt enjoy both hedonic
(perceived enjoyment and prestige) and utilitarian (perceived usefulness and importance)
benefits. Additional support for the presence of both hedonic and utilitarian shopper
benefits were found by Olsen and Skallerud (2011:537), specifically with hedonic
shopping values being positively related to personal interactions, accessibility, and product

EMS (M. BUS. ADMIN. DEGREE) JUNE 2016 96
value whilst utilitarian shopping values were positively related to physical aspects and
product assortment for two major Norwegian consumer goods retail chains. Mano and
Oliver (1993:463) also support the finding that both hedonic and utilitarian shopper
benefits are experienced by aroused, low-involvement / FMCG at an American, mid-
western American university, albeit both to a modest degree.
5.4.2 Can consumers be loyal to FMCGs?
Jacoby and Chestnuts (1978: 80) define brand loyalty as
the biased (i.e., non-random), behavioural response (i.e., purchase), expressed over time,
by some decision-making unit, with respect to one or more alternative brands out of a set of
such brands, which is a function of psychological (decision making, evaluative) processes
resulting in brand commitment.
Considering that the definition of brand loyalty stresses preference (biased), purchase
frequency (over time) and attitude (psychological), and considers consumer response over
a set of brands rather than just a single brand, it was questioned whether consumers would
develop both behavioural and attitudinal loyalty to FMCG brands which are low
involvement products (Joghee and Pillai, 2013,) and are generally replaced over a short
period of time (Fouladivanda et al. 2013:946). This study found that South African
consumers have developed both behavioural (M = 4.1) and attitudinal (M = 3.8) loyalty
towards the FMCG brands they buy. Chaudhuri and Holbrook (2001: 90) confirmed, in a
study performed across a variety of categories (including FMCGs) consumed in the
U.S.A., that both purchase loyalty and attitudinal loyalty influence outcomes-related
aspects like market share and relative price, albeit through the moderating effects of brand
trust and brand affect. This was also confirmed by Knox and Walker’s (2001:120) results
which showed that, among four consumer purchasing styles ('loyals', 'habituals', 'variety
seekers' and 'switchers') in the U.K., there were some consumers who were behaviourally
(labelled ‘habitual’) and attitudinally (labelled ‘loyals’) loyal to the grocery brands they
bought. In India, Mishra, Kesharwani and Das (2016:19) found that consumers loyal to
EMS (M. BUS. ADMIN. DEGREE) JUNE 2016 97
FMCG brands are mostly the risk adverse consumers but when they eventually trust a
brand, they behaviourally and attitudinally stick to it. In Sweden, Zineldin et al. (2014:6)
found that consumers can be loyal to FMCG brands but best price and quality has a strong
influencing role in this market.
5.4.3 Relationship between utilitarian brand value (BUV) and brand trust (CBT)
Change your Index/ Contents accordingly
Chaudhuri and Holbrook’s (2001:88) study with university students in the U.S.A. found a
relationship between utilitarian value and brand trust, albeit as a control variable to the
product-category effect. This study found a strong, positive relationship between utilitarian
value consumers enjoy in FMCG brands and brand trust. This finding is supported by
Matzler et al. (2006:85) who concluded that hedonic and utilitarian product values
contribute to brand trust in the retail category in two Austrian cities which contained low
involvement consumer categories, making it similar to the FMCG category.
These results suggest that there might be some benefit in campaigns that draw on the
functional properties of a branded FMCG product. As an example, branded washing
powders and soaps can illustrate how it can be trusted to wash and clean clothes. Another
example would be how juice, milk and cereal branded products can be trusted to be
nutritious.
5.4.4 Relationship between hedonic value (BHV) and brand trust (CBT)
The findings of this investigation support a strong positive relationship between the
hedonic value consumers enjoy in FMCG brands, and brand trust. This finding is supported
by Matzler et al. (2006:85) who, as previously indicated, concluded that hedonic and
utilitarian product values contribute to brand trust the retail category in two Austrian cities
which contained low involvement consumer categories, making it similar to the FMCG
category. With respondents from the U.S.A, Chaudhuri and Holbrook (2001:88) study with
university students found a relationship between hedonic value and brand trust, albeit as a

EMS (M. BUS. ADMIN. DEGREE) JUNE 2016 98
control variable to the product-category effect. This was also the conclusion Kuikka and
Laukkanen (2012:534) came to in their investigation of chocolate consumers in Finland
regarding the role of hedonic value in brand loyalty, finding that the effect was weaker
than expected.
The results obtained from this study shows that campaigns for branded FMCG products
that draw on consumers’ emotional connections, will build the trust which consumers have
in the products. Branded washing powders, soaps, milk, juices and cereals can therefore
illustrate the health, security and pride that the consumers would derive from the brands, so
as to build trust in the brands over long usage periods.
5.4.5 Relationship between hedonic value (BHV) and brand affect (CBA)
The findings of this investigation support a strong positive relationship between the
hedonic value which consumers enjoy in FMCG brands, and brand affect. This finding is
in agreement with a study conducted by Chaudhuri and Holbrook (2001:89) with
university students in the U.S.A. which found that hedonic value received from FMCG
brands was significantly and positively related to brand affect. They view brand affect as a
brand's potential to elicit a positive emotional response in the average consumer as a result
of its use, and is positively affected by the hedonic values that consumers hold of products.
The marketers of branded washing powders, soaps, milk, juices and cereals in South Africa
can therefore benefit from this finding by illustrating the delight which consumers
experience in interacting with the brands in their marketing campaigns.
5.4.6 Relationship between brand trust (CBT) and consumer satisfaction (CSAT)
The findings of this investigation indicate that there is a positive relationship between
brand trust and consumer satisfaction in FMCG brands. This happens to be the strongest of
all the variable interactions considered in this study. Brand trust is shown to contribute
99% in the explanation of the consumer satisfaction variable. This finding is in agreement

EMS (M. BUS. ADMIN. DEGREE) JUNE 2016 99
with a study conducted in Sweden by Ismail et al. (2012:42) which indicates that brand
satisfaction has a strong correlation with brand trust. This finding also agrees with a study
performed by Kiyani et al. (2012:497).
Marketers of branded washing powders, soaps, milk, juices and cereals can have a
communication strategy which illustrates that these trusted brands keep customers
satisfied, thereby ensuring that more consumers stay brand loyal.
5.4.7 Relationship between consumer satisfaction (CSAT) and behavioural
loyalty (BBL)
The findings of this investigation indicate that there is a strong, positive relationship
between consumer satisfaction and behavioural brand loyalty for FMCG brands. Consumer
satisfaction is shown to contribute 82% in the explanation of the behavioural brand loyalty
variable. This finding is in agreement with a study conducted by Chitturi et al. (2008:61) in
the U.S.A. with a focus on student customer satisfaction and delight with laptops and
cellphones, with their repurchase intentions being a measure of behavioural loyalty. For
FMCG brands, Zineldin et al. (2014:6) found that brand loyalty is also highly driven by
consumer satisfaction and linked to behavioural loyalty for the FMCG retail sector in
Sweden.
The results obtained by this study show that it is viable to invest in marketing campaigns
for branded FMCG products which access the pool of satisfied customers of the brand, and
to draw on them to repeat purchase the branded product, based on consumer satisfaction
with the product performance. Branded washing powders, soaps, milk, juices and cereals
could utilise a database of satisfied brand consumers and perform sales promotions and
activities that will get these consumers to repurchase the brand and make it part of their
routine FMCG shopping behaviour.

EMS (M. BUS. ADMIN. DEGREE) JUNE 2016 100
5.4.8 Relationship between consumer satisfaction (CSAT) and attitudinal loyalty
(ABL)
The findings of this investigation indicate that there is a strong, positive relationship
between consumer satisfaction and attitudinal brand loyalty for FMCG brands. Consumer
satisfaction is shown to contribute 91% in the explanation of attitudinal brand loyalty. This
finding supports Anselmsson and Bondesson’s (2015:68) results from Sweden across
brands for 10 of the largest FMCG categories which found that consumer satisfaction was
highly correlated with attitudinal loyalty.
The results obtained in this study shows that it is viable to invest in marketing campaigns
for branded FMCG products that accesses the collection of satisfied customers of the brand
and draws on their satisfaction and delight to convert them into committed ‘loyals’.
5.5 Conclusions, Implications and Recommendations
This section draws conclusions from the findings obtained from testing the postulated
hypotheses. The theoretical and practical contributions of the study are presented next and
the study ends with limitations of the study and recommendations for further study.
5.5.1 Conclusions
This study showed that consumers enjoy utilitarian benefits in addition to hedonic benefits
from FMCG brands and can develop loyalty to these brands. The study also investigated
the factors which drive loyalty to FMCGs. The specific research questions were: How do
the utilitarian and hedonic values which consumers hold of selected branded FMCG
categories affect their brand trust and brand affect? How do brand trust and affect drive
consumer satisfaction which, in turn, impact on behavioural and attitudinal brand loyalty?
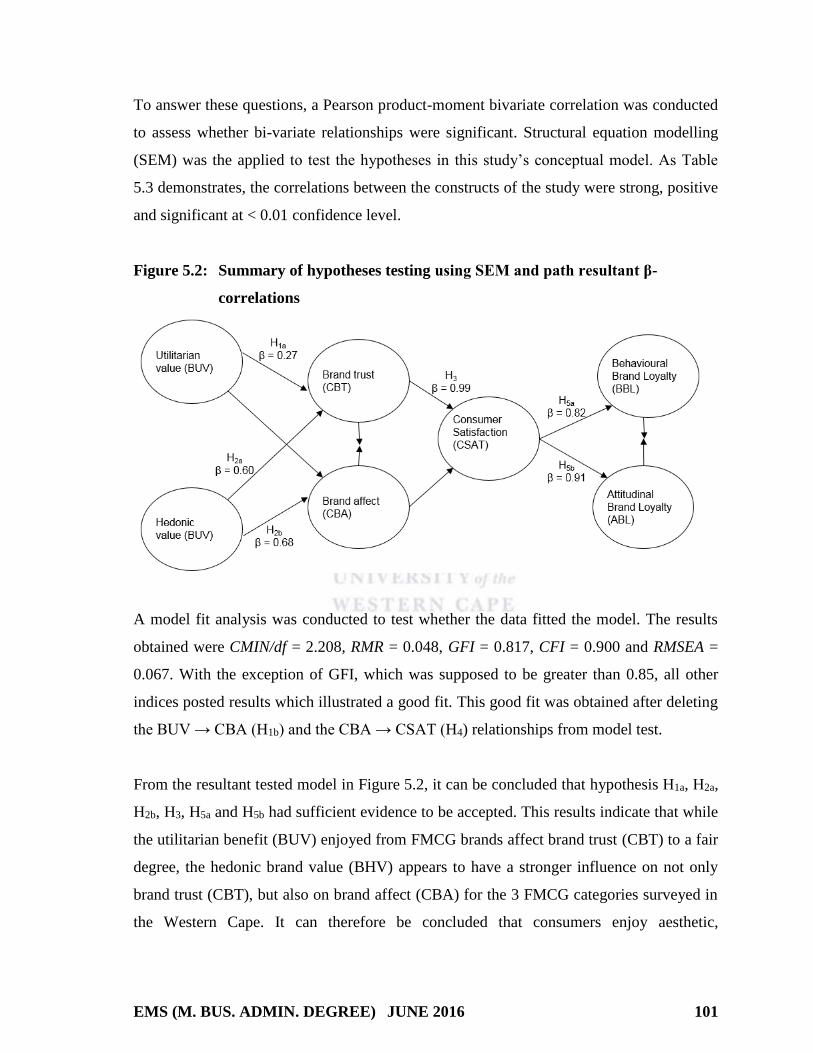
EMS (M. BUS. ADMIN. DEGREE) JUNE 2016 101
To answer these questions, a Pearson product-moment bivariate correlation was conducted
to assess whether bi-variate relationships were significant. Structural equation modelling
(SEM) was the applied to test the hypotheses in this study’s conceptual model. As Table
5.3 demonstrates, the correlations between the constructs of the study were strong, positive
and significant at < 0.01 confidence level.
Figure 5.2: Summary of hypotheses testing using SEM and path resultant β-
correlations
A model fit analysis was conducted to test whether the data fitted the model. The results
obtained were CMIN/df = 2.208, RMR = 0.048, GFI = 0.817, CFI = 0.900 and RMSEA =
0.067. With the exception of GFI, which was supposed to be greater than 0.85, all other
indices posted results which illustrated a good fit. This good fit was obtained after deleting
the BUV → CBA (H1b) and the CBA → CSAT (H4) relationships from model test.
From the resultant tested model in Figure 5.2, it can be concluded that hypothesis H1a, H2a,
H2b, H3, H5a and H5b had sufficient evidence to be accepted. This results indicate that while
the utilitarian benefit (BUV) enjoyed from FMCG brands affect brand trust (CBT) to a fair
degree, the hedonic brand value (BHV) appears to have a stronger influence on not only
brand trust (CBT), but also on brand affect (CBA) for the 3 FMCG categories surveyed in
the Western Cape. It can therefore be concluded that consumers enjoy aesthetic,

EMS (M. BUS. ADMIN. DEGREE) JUNE 2016 102
experiential and enjoyment-related benefits from the FMCG brands they purchase and
consume. They will most likely trust and develop emotional connections to the FMCG
brands they interact with within these three categories. Consumers’ reliance on the brand’s
abilities to always perform its stated functions (brand trust) is however what strongly
drives consumer satisfaction.
The SEM results in Figure 5.2 also indicate that consumer satisfaction (CSAT) strongly
affect both attitudinal brand loyalty (β = 0.91) and behavioural brand loyalty (β = 0.82) for
the three FMCG categories surveyed in the Western Cape. This means that if consumers
are satisfied with the FMCG brands they buy and consume, they would have the propensity
to repeatedly purchase the same brand over time (behavioural loyalty), as well as have a
high degree of dispositional commitment emanating from some unique values associated
with the brand (attitudinal loyalty). These findings have theoretical and practical
implications which is discussed below.
5.5.2 Theoretical and Practical Implications of the study
Theoretically this study will contribute to the field of marketing, consumer behaviour and
brand management. Due to the heightened difficulty in building and sustaining loyal
customers, marketers are putting brand loyalty development and sustenance at the heart of
their brand building activities (Fournier and Yao, 1997). The management of consumer
brand loyalty however depends on marketers’ abilities to measure and understand brand
loyalty. Most previous studies on brand loyalty have focused on understanding the drivers
of brand loyalty for high-involvement or durable consumer products and brands. Very
limited studies on brand loyalty drivers for low-involvement products and brands, such as
FMCG brands were therefore available. The available studies on drivers of FMCG brand
loyalty have mostly examined how brand trust and affect directly impact on loyalty (see for
example Chaudhuri and Holbrook, 2001; Mishra et al., 2016). They ignore the fact that
consumers will need to be satisfied with all aspects of a brand before they become loyal.

EMS (M. BUS. ADMIN. DEGREE) JUNE 2016 103
This study contributes to knowledge by not only expanding the understanding of brand
loyalty in low-involvement product categories, but also by showing that both behavioural
and attitudinal loyalty will be enhanced when FMCG consumers are satisfied with their
trusted brands. Despite the notion that consumers mostly enjoy utilitarian benefits from
FMCG brands, this study revealed that FMCG consumers can equally develop emotional
attachment (brand affect and attitudinal loyalty) towards low-involvement brands like
FMCG brands.
This study’s findings have implications for marketing practitioners, who may be under-
estimating the importance of building consumer trust and satisfaction for low-involvement
brands such as FMCG brands. The common notion and practice in the FMCG industry is
that consumers chase price discounts and can be kept loyal through relationship marketing
mechanisms like offering loyalty cards. While Zineldin et al. (2014) found that FMCG
consumers stay loyal to retailers who continue to offer them price discounts and quality
products, they also found that the use of loyalty cards does not drive loyalty and that most
consumers want a relationship with the brand.
The current study concludes that consumers may seek a relationship with FMCG brands
which provide them not only utilitarian benefits but also brands that elicit hedonic benefits.
This means that marketers could adapt their brand communication and advertising
strategies to utilise both the functional benefits and emotional security that the branded
FMCG products portray. The current study shows that this strategy will build brand trust
which strongly influences satisfaction. This interaction can strongly secure attitudinal
brand loyalty from consumers and a greater likelihood of repurchasing the brand in the
future. As with Zineldin et al. (2014) who concluded that the overall loyalty of FMCG
brands in their Swedish study were strongly influenced by psychological or altitudinal
loyalty, this study also demonstrated the same traits for the three FMCG categories
investigated. This fact would have remained unsubstantiated if it was not for the nature of
this study.
EMS (M. BUS. ADMIN. DEGREE) JUNE 2016 104
While this study makes important theoretical and practical contributions, the results have
been cautiously generalised because of the limitations discussed in the next section.
5.5.3 Limitation and Recommended Areas for Further Research
This investigation was limited by ring-fencing the contributions from Chaudhuri and
Holbrook (2001) and Chitturi et al. (2008), who suggest that utilitarian value, hedonic
value, brand trust, brand affect and customer satisfaction are drivers of attitudinal and
behavioural brand loyalty. While these models provide useful insights, they are however
not comprehensive enough to understand the formation of brand loyalty in the FMCG
product category in South Africa. For example, unlike this study which examined five
drivers, Moolla and Bisschoff’s (2013) brand loyalty model related to FMCG brands
suggest twelve drivers of brand loyalty. They however do not show how these drivers lead
to consumer satisfaction which the current study revealed to be a strong determinant of
both attitudinal and behavioural loyalty.
In order to better understand the drivers of brand loyalty in the FMCG industry, it is
recommended that this study’s model be expanded to include the additional brand loyalty
drivers of Moolla and Bisschoff’s (2013). In addition to empirically testing the expanded
model with quantitative methods, qualitative methods can also be used to obtain deeper
insights into the emotional drivers of brand loyalty to FMCG brands.
This investigation was limited to a survey conducted in the metropolitan and suburban
regions of the Western Cape in South Africa as this was most accessible and within the
budget of the researcher. It is recommended that future investigations should expand the
sampling frame to include a more representative sample of the rural communities as well
as other provinces of South Africa. Moreover, this investigation was limited to data from
272 respondents which means that the findings should be cautiously generalised to all
South African consumers. Larger sample sizes should be used to replicate the study. The
scope of this study can also be further expanded by considering private label brands, and
investigating whether brand trust and customer satisfaction continue to play a pivotal role

EMS (M. BUS. ADMIN. DEGREE) JUNE 2016 105
for these brands, considering that previous research identify price as the ultimate driver for
repeat purchases of private label brands.
Despite the limitations of this study, it provides important hints to FMCG brand owners
and marketers in terms of ideas on how to position their brands to consumers with more
poignant communication strategies. These can provide consumers with the right brand
triggers to ensure that they remain brand loyal in their repurchase behaviours and attitudes.
It will also be useful to retailers who might automatically treat FMCG categories as
utilitarian destination categories as opposed to categories with some hedonic
characteristics. Retailers can use this insight to make more emotional purchase appeals to
consumers by utilising opportunities like investing in in-store, below-the-line marketing
support which might positively affect sales to their customers.
EMS (M. BUS. ADMIN. DEGREE) JUNE 2016 106
References
Aaker, D. (2012). Building strong brands. New York: The Free Press.
Aaker, D.A. (1996). Measuring Brand Equity Across Products and Markets. California
Management Review, Spring 1996, 38 (3): 102-120.
Anselmsson, J. and Bondesson, N. (2015). Brand value chain in practise; the relationship
between mindset and market performance metrics: A study of the Swedish market for
FMCG. Journal of Retailing and Consumer Services, 25(2015): 58-70.
Aviv, S. (2002). Determinants of Fashion Attributes’ Importance: An Israeli Study,
Journal of International Consumer Marketing, 15(2): 43-61.
Bandyopadhyay S. and Martell, M. (2007). Does attitudinal loyalty influence behavioural
loyalty? A theoretical and empirical study. Journal of Retailing and Consumer Services,
14: 35-44.
Bass, F.M. (1974). The Theory of Stochastic Preferences and Brand Switching. Journal of
Marketing Research, XI (February 1974): 1-20.
Basson, S. (2014). Measuring the effect of loyalty programmes on a leading pet food
brand, Mini-dissertation submitted in partial fulfilment of the requirements for the degree
Master in Business Administration at the Potchefstroom Campus of the North-West
University. Potchefstroom campus: North-West University, South Africa. Available at
http://dspace.nwu.ac.za/handle/10394/14217. [Accessed 26 October 2015].
Battersby, J. and Peyton, S. (2014). The Geography of Supermarkets in Cape Town:
Supermarket Expansion and Food Access. Urban Forum [ejournal], 25: 153-164,
Available at http://www.afsun.org/wp-content/uploads/2014/05/Battersby-and-Peyton-
Offpirnt.pdf. [Accessed 23 November 2015].
Baumann, C., Hamin, H. and Chong, A. (2014). The role of brand exposure and experience
on brand recall – Product durables vis-à-vis FMCG. Journal of Retailing and Consumer
Services, 23: 21-31.
EMS (M. BUS. ADMIN. DEGREE) JUNE 2016 107
Bisschoff, C.A. and Salim, S. (2014). A Model to Measure the Brand Loyalty of Financial
Institutions. Mediterranean Journal of Social Sciences, 5(23): 302-309.
Bloemer, J.M.M. and Kasper, J.D.P. (1995). The complex relationship between consumer
satisfaction and brand loyalty. Journal of Economic Psychology, 7: 152-160. Available at
viewed http://svn2.assembla.com/svn/speciale/resourcer/. [Accessed 18 October 2011].
Brijball, S. (1993). A study of the attitudinal and Behavioural dimensions of Indian
consumers to brand loyalty, submitted in fulfilment of the requirement for the degree of
Masters of Administration (Industrial Psychology). Durban: Faculty of Commerce and
Administration at the University of Durban-Westville, South Africa. Available at
http://researchspace.ukzn.ac.za/xmlui/handle/10413/7849. [Accessed 12 October 2015].
Chaudhuri, A. and Holbrook, M.B. (2002). Product-class effects on brand commitments
and brand outcomes: The role of brand trust and brand affect. Brand Management, 10(1):
33-58.
Chaudhuri, A., and Holbrook, M.B. (2001). The Chain of Effects from Brand Trust and
Brand Affect to Brand Performance: The Role of Brand Loyalty. Journal of Marketing, 65:
81-93.
Chitturi, R., Raghunathan, R. and Mahajan, V. (2008). Delight by Design: The Role of
Hedonic Versus Utilitarian Benefits. Journal of Marketing, 72: 48-63.
do Vale, R.C. and Duarte, J. (2013). Classification of FMCG Product Macro-Categories on
the Utilitarian vs. Hedonic Dimensions. Laboratório de Psicologia [ejournal], 11(1): 29-
36, Available at http://publicacoes.ispa.pt/index.php/lp/article/download/702/688.
[Accessed 05 November 2015].
David, E.M. (2013). Re-Branding Fast Moving Consumer Goods: The Case of Nestlé
South Africa, a dissertation submitted in fulfilment of the requirements for the degree of
Master of Commerce at The School of Management, IT and Governance, College of Law
and Management Studies. Kwazulu-Natal: University of Kwazulu-Natal, South Africa.
Available at http://researchspace.ukzn.ac.za/xmlui/handle/10413/10880. [Accessed 23
November 2015].
EMS (M. BUS. ADMIN. DEGREE) JUNE 2016 108
Davis, S. (2002). Brand Asset Management: How businesses can profit from the power of
brand. Journal of Consumer Marketing, 19(4): 351-358.
David, E.M. and Govender, K.K. (2014). Re-Branding Fast Moving Consumer Goods in an
International Company in South Africa. Journal of Economics, 5(2): 153-164, Available at
http://www.krepublishers.com/02-Journals/JE/JE-05-0-000-14-Web/JE-05-2-000-14-Abst-
PDF/JE-5-2-153-14-179-Govender-K-K/JE-5-2-153-14-179-Govender-K-K-Tx[3].pdf.
[Accessed 23 November 2015].
Day, G.S. (1969). A two-dimensional concept of brand loyalty. Journal of Advertising
Research, 9(3): 29-35.
Delgado-Ballester, E. (2011). Development and validation of a brand trust scale,
ResearchGate. 3-58. Available at
http://citeseerx.ist.psu.edu/viewdoc/download?doi=10.1.1.201.5789&rep=rep1&type=pdf.
[Accessed 18 August 2015].
Delgado-Ballester, E., Luis Munuera-Alemán, J. and Yagüe-Guillén, M.J. (2003).
Development and validation of a brand trust scale. International Journal of Market
Research, 45(Quarter 1): 35-53.
Dhar, R. and Wertenbroch, K. (2000). Consumer Choice between Hedonic and Utilitarian
Goods. Journal of Marketing Research, 37(1), February 2000: 60-71.
Delgado-Ballester, E. (2011). Development and validation of a brand trust scale.
ResearchGate. Available at
http://citeseerx.ist.psu.edu/viewdoc/download?doi=10.1.1.201.5789&rep=rep1&type=pdf.
[Accessed 18 August 2015].
Delgado-Ballester, E. and Munuera-Alemán, J.L. (1999). Brand trust in the context of
consumer loyalty. European Journal of Marketing, 35(11/12): 1238-1258.
Deng, Z., Lu, Y., Wei, K. K., & Zhang, J. (2010). Understanding customer satisfaction and
loyalty: An empirical study of mobile instant messages in China. International Journal of
Information Management, 30(4): 289-300.

EMS (M. BUS. ADMIN. DEGREE) JUNE 2016 109
Dick, A.S. & Basu, K. (1994). Customer Loyalty: toward an Integrated Conceptual
Framework. Journal of the Academy of Marketing Science, 22(2): 99-113.
Drennan, J. et al. (2015). Examining the role of wine brand love on brand loyalty: a multi-
country comparison. International Journal of Hospitality Management, 49: 47-55.
du Plooy, H. (2012). Measuring brand loyalty in the Pharmaceutical industry of South
Africa, Mini- dissertation submitted in partial fulfilment of the requirements for the degree
Masters in Business Administration. Potchefstroom Business School: Potchefstroom
Campus of the North-West University, South Africa. Available at
http://dspace.nwu.ac.za/handle/10394/8685. [Accessed 03 November 2015].
Forsido, M.Z. (2012). Brand loyalty in Smartphone, Masters Thesis. Uppsala: Universitet,
Uppsala, Sweden. Available at http://www.diva-
portal.org/smash/get/diva2:545415/fulltext02. [Accessed 03 November 2015].
Fouladivanda, F. et al. (2013). The effect of Brand Equity on Consumer Buying Behavior
in term of FMCG in Iran. INTERDISCIPLINARY JOURNAL OF CONTEMPORARY
RESEARCH IN BUSINESS [ejournal], 4(9): 51-68. Available at http://journal-
archieves27.webs.com/945-957.pdf. [Accessed 12 October 2015].
Fournier, S. and Yao, J.L. (1997). Reviving Brand Loyalty: A Reconceptualization within
the Framework of Consumer-Brand Relationships. International Journal of Research in
Marketing, 14: 451-472.
Galpin, J. (2002). Statistical research design and Analysis (STATS511). University of the
Witwatersrand School of Statistical and Actuarial Science, 2002 Publication.
Hooper, D., Coughlan, J. and Mullen, M.R. (2008). Structural Equation Modelling:
Guidelines for Determining Model Fit. Electronic Journal of Business Research Methods
[ejournal], 6(11): 53-60.
Lacey, R. (2007). Relationship drivers of Customer Commitment, Journal of Marketing
Theory & Practice, Fall2007, 15(4): 315-333.

EMS (M. BUS. ADMIN. DEGREE) JUNE 2016 110
Liu, C. T., Guo, Y. M., and Lee, C. H. (2011). The effects of relationship quality and
switching barriers on customer loyalty. International Journal of Information Management,
31(1): 71-79.
Hair, J.F.J., Anderson, R. E., Tatham, R.L. and Black, W.C. (1998). Multivariate Data
Analysis (5th International Edition). Prentice-Hall International Inc.
Hawkins, D.I. and Mothersbaugh, D.L. (2010). Consumer Behavior: Building Marketing
Strategy, Eleventh edition. New York: McGraw-Hill Irwin.
Hofmeyr, J. and Rice, B. (2000). Commitment-Led Marketing. Chichester: John Wiley &
Sons Ltd.
Hoyer, D.H. and Stokburger-Sauer, N.E. (2012). The role of aesthetic taste in consumer
behavior. Journal of the Academy of Marketing Science, 40: 167-180.
Huang, S-M. et al. (2015). The influence of brand benefits on brand loyalty: Intermediate
mechanisms. Australian Journal of Management, pp. 1-20. Available at
http://aum.sagepub.com. [Accessed 25 October 2015].
Ismail, R., Boye, C.L. and Muth, A. (2012). Customer Brand Relationship - An empirical
study of customers’ perception of brand experience, brand satisfaction, brand trust and
how they affect brand loyalty, Bachelor thesis, Spring 2012. Växjö: Linnaeus University –
School of Business and Economics, Växjö, Sweden. Available at http://www.diva-
portal.org/smash/get/diva2:530408/FULLTEXT01.pdf. [Accessed 03 November 2015].
Iacobucci, D. (2009). Everything you always wanted to know about SEM (structural
equations modelling) but were afraid to ask. Journal of Consumer Psychology [ejournal],
19: 673-680. Available at
http://resource.owen.vanderbilt.edu/facultyadmin/data/research/2388full.pdf. [Accessed 16
February 2016].
Jacoby, J. and Chestnut, R. W. (1978). Brand Loyalty Measurement and Management.
New York: Wiley.
Jacoby, J. and Kyner, D. (1973). Brand loyalty vs repeat purchasing behaviour. Journal of
Marketing Research, 10(1): 1-9.

EMS (M. BUS. ADMIN. DEGREE) JUNE 2016 111
Jensen, M. and Hansen, J.T. (2006). An empirical examination of brand loyalty. Journal of
Product & Brand Management, 15(7): 442-449. Available at
http://dx.doi.org/10.1108/10610420610712829. [Accessed 18 October 2015].
Joghee, S. and Pillai, P.K. (2013). Brand Influence on Buying FMCG Products in UAE:
An empirical Study. European Journal of Business and Management, 5(25): 9-16.
Jones, M.A., Reynolds, K. and Arnold, M.J. (2006). Hedonic and utilitarian shopping
value: Investigating differential effects on retail outcomes. Journal of Business Research,
59: 974-981.
Kabiraj, S. and Shanmugan, J. (2011). Development of a conceptual framework for brand
loyalty: A Euro-Mediterranean perspective. Brand Management, 18(4/5): 285-299.
Kaul, S. (2007). Hedonism and Culture: Impact on Shopping Behaviour – A Research
Agenda. Vikalpa, 32(3), July-September 2007: 81-89.
Keller, K.L. (2013). Strategic Brand Management, March 2003, Fourth Edition. Edinburgh
Gate, Harlow, Essex CM20 2JE, England: Pearson Education Limited.
Keller, K.L. (2003). Brand Synthesis: The Multidimensionality of Brand Knowledge.
Journal of Consumer Research, 29, March 2003: 595-600.
Kenny, D. (2010). Measuring model fit [Online]. Available at
http://www.davidakenny.net/cm/fit.htm. [Accessed 29 February 2016].
Khan, M.A. and Mahmood, Z. (2012). Impact of Brand Loyalty on Brand Equity.
International Journal of Academic Research, 4(1): 33-37.
Kim, J., Morris, J.D. and Swait, J. (2008). Antecedents of true brand loyalty. Journal of
Advertising, 37(2), Summer 2008: 99-117.
Kiyani, T.M. et al. (2012). THE RELATIONSHIP BETWEEN BRAND TRUST,
CUSTOMER SATISFACTION AND CUSTOMER LOYALTY. (EVIDENCE FROM
AUTOMOBILE SECTOR OF PAKISTAN). INTERDISCIPLINARY JOURNAL OF
CONTEMPORARY RESEARCH IN BUSINESS [ejournal], 4(1): 489-502. Available at
http://journal-archieves18.webs.com/489-502.pdf. [Accessed 05 November 2015].

EMS (M. BUS. ADMIN. DEGREE) JUNE 2016 112
Knox, S. and Walker, D. (2003). Empirical developments in the measurement of
involvement, brand loyalty and their relationship in grocery markets. Journal of Strategic
Marketing, 11: 271-286. Available at http://www2.ifes.com.br/webifes/conhecimento/.
[Accessed 12 September 2011].
Knox, S. and Walker, D. (2001). Measuring and managing brand loyalty. Journal of
Strategic Marketing, 9: 111-128. Available at
http://www2.ifes.com.br/webifes/conhecimento/. [Accessed 29 October 2015].
Kothari, C.R. (2004). Research Methodology: Methods & Techniques. New Delhi, India:
New Age International (P) Limited Publishers.
Kotler, P. (2002). Marketing Insights from A to Z. Hoboken in New Jersey: John Wiley &
Sons Inc.
Kotler, P. and Armstrong G. (2011). Principles of Marketing. Thirteen Edition, New
Jersey, NJ: Pearson Prentice Hall.
Kotler, P. and Armstrong, G. (2011). Principles of Marketing. Pinelands in Cape Town:
Pearson Education South Africa (Pty) Ltd Prentice Hall, p. 242 and 374.
Kotler, P. and Armstrong G. (2010). Principles of Marketing. Thirteen Edition, New
Jersey, NJ: Pearson Prentice Hall.
Kotler, P. and Keller, K, L. (2012). A framework for Marketing Management. Essex:
Pearson Education Limited.
Kotler, P. and Keller, K.L. (2006). Marketing Management, Upper Saddle River in New
Jersey USA: Pearson Prentice Hall Pearson Education Inc.
KPMG Sector Report. (2015). Fast-Moving Consumer Goods in Africa [online]. Available
at https://www.kpmg.com/Africa/en/IssuesAndInsights/Articles-Publications/General-
Industries-Publications/Documents/Fast-
Moving%20Consumer%20Goods%20sector%20report%202015.pdf.
Kuikka, A. and Laukkanen, T. (2012). Brand loyalty and the role of hedonic value. Journal
of Product & Brand Management, 21(7): 529-537.
EMS (M. BUS. ADMIN. DEGREE) JUNE 2016 113
Kwong, M.Z. and Candinegara, I. (2014). Relationship between Brand Experience, Brand
Personality, consumer Satisfaction, and consumer Loyalty of DSSMF Brand. iBuss
Management [ejournal], 18(2): 89-98, Available at
http://studentjournal.petra.ac.id/index.php/ibm/article/view/2411/2190. [Accessed 01
November 2015].
Langer, L. (1997). What consumers wish brand managers knew. Journal of Advertising
Research, 37(6): 60-66.
Laubser, L. (2014). The motivations behind brand choice in the older segment in the
Western Cape, South Africa, Research assignment presented in partial fulfilment of the
requirements for the degree of Master of Business Administration. Stellenbosch
University’: Stellenbosch University, South Africa. Available at
https://scholar.sun.ac.za/handle/10019.1/96194. [Accessed 15 October 2015].
Lim, E.A.C. and Ang, S.H. (2008). Hedonic vs. utilitarian consumption: A cross-cultural
perspective based on cultural conditioning. Journal of Business Research, 61(3): 225-232.
Lourens, A.P.L. (2014). Analysing retailers' buying behaviour and loyalty of branded
edible groundnuts in the North West Province and Gauteng, Mini- dissertation submitted
in partial fulfilment of the requirements for the degree Magister in Business
Administration. Potchefstroom Campus of the North-West University: Potchefstroom
campus of the North-West University, South Africa. Available at
http://dspace.nwu.ac.za/handle/10394/10754. [Accessed 16 October 2015].
Maheshwari, V., Lodorfos, G. and Jacobsen, S. (2014). Determinants of Brand Loyalty: A
Study of the Experience-commitment-Loyalty Constructs. International Journal of
Business Administration, 5(6): 13-23.
Malhotra, N. K. (2012). Basic Marketing Research, 4th edition. New Jersey: Pearson.
Martins, J. (2007). The South African consumer market. Global Journal of Business, 1(1):
168-183.

EMS (M. BUS. ADMIN. DEGREE) JUNE 2016 114
Mano, H. and Oliver, R.L. (1993). Assessing the Dimensionality and Structure of the
Consumption Experience: Evaluation, Feeling, and Satisfaction. Journal of Consumer
Research, 20: 451-466.
Matarid, N.M., Youssef, M.A.M. and Alsoud, G.F.A.A. (2014). The Impact of Brand
Extension Strategy on the Brand Equity of Fast Moving Consumer Goods (FMCG) in
Egypt. European Journal of Business and Management, 6(21): 154-163.
Matzler, K., Grabner-Kräuter, S. and Bidmon, S. (2006). THE VALUE – BRAND TRUST
– BRAND LOYALTY CHAIN: AN ANALYSIS OF SOME MODERATING
VARIABLES. Innovative Marketing [ejournal], 2(2): 76-88. Available at
http://businessperspectives.org/journals_free/im/2006/im_en_2006_02_Matzler.pdf.
[Accessed 19 October 2015].
Mazibuko, A.L. (2010). Brand loyalty of cereal products, A mini-dissertation submitted
for the Masters in Business Administration. Potchefstroom campus: North-West
University, South Africa. Available at
http://dspace.nwu.ac.za/bitstream/handle/10394/4427/mazibuko_al.pdf?sequence=2.
[Accessed 12 October 2015].
Mbuyazi, V.S. (2012). The use of new communication strategies to enhance marketing of
fast moving customer goods (FMCG): Masters of Arts in the Department of
Communication Science thesis. University of Zululand: South Africa. Available at
http://www.netd.ac.za/?action=view&identifier=oai%3Aunion.ndltd.org%3Auzulu%2Foai
%3Auzspace.uzulu.ac.za%3A10530%2F1344. [Accessed 12 October 2015].
Mellens, M., Dekimpe, M.G. and Steenkamp J.B.E.M. (1996). A Review of Brand-Loyalty
Measures in Marketing. Tijdschrift voor Economie en Management, XLI (4): 507-533.
Available at https://lirias.kuleuven.be/bitstream/123456789/119352/1/TEM1996-4_507-
533p.pdf. [Accessed 14 October 2015].
Mishra, M., Kesharwani, A. and Das, D. (2016). The relationship between risk aversion,
brand trust, brand affect and loyalty: evidence from the FMCG industry. Journal of Indian
Business Research [ejournal], 8(2): 1–25. Available at http://dx.doi.org/10.1108/JIBR-04-
2015-0045. [Accessed 29 May 2016].

EMS (M. BUS. ADMIN. DEGREE) JUNE 2016 115
Mkhabela, M.K. (2014). South African Foreign Policy In Africa: The Case Of South
African Retail Multinational Corporations, submitted in accordance with the requirements
for the degree of Master of Arts in the subject International Politics, University of South
Africa: South Africa, Available at http://uir.unisa.ac.za/handle/10500/13860. [Accessed 19
November 2015].
Mohan, B.C. and Sequeira, A.H. (2012). Customer-Based Brand Equity in the Fast Moving
Consumer Goods Industry in India. The International Journal Of Management, 1(4),
October 2012.
Moisescu, O.I. (2014). Assessing Customer Loyalty: A Literature Review.
Multidisciplinary Academic Conference on Economic Management and Marketing in
Prague, 5-6 December 2014, Available at https://mpra.ub.uni-
muenchen.de/65287/9/MPRA_paper_65287.pdf. [Accessed 19 October 2015].
Moolla, A.I. (2010). A conceptual framework to measure brand loyalty: Doctorate Thesis,
Potchefstroom campus: North-West University, South Africa, Available at
http://dspace.nwu.ac.za/bitstream/handle/10394/4442/Moolla_AI.pdf?sequence=2.
[Accessed 26 December 2012].
Moolla, A.I. and Bisschoff, C.A. (2013). An empirical model that measures brand loyalty
of fast-moving consumer goods. Journal of Economics, 4(1):1-9.
Moolla, A.I. and Bischoff, C.A. (2012). A Model to Measure the Brand Loyalty for Fast
Moving Consumer Goods. Journal of Social Sciences, 31(1): 71-85.
Nam, J. Ekinci, Y and Whyatt, G. (2011). Brand Equity, Brand Loyalty and Consumer
Satisfaction. Annals of Tourism Research, 38(3): 1009–1030.
Nayyab, H.H., Sehr, A., Adnan, M. and Ali, Z. (2011). The impact of consumer behaviour
on FMCG’s A study of Okara, Punjab (Pakistan). Interdisciplinary Journal of
Contemporary Research in Business [ejournal], 3(2): 804-833, Available at
http://connection.ebscohost.com/c/articles/70548076/impact-consumer-behavior-fmcgs-
study-okara-punjab-pakistan. [Accessed 19 November 2015].

EMS (M. BUS. ADMIN. DEGREE) JUNE 2016 116
Negm, E.M., Sahd, F.E. and Tantawi, P. (2012). Measuring the Impact of Certain Hedonic,
Rational, and Influential Components on Consumers’ Intention to Adopt Innovative Fast
Moving Consumer Goods (FMCG) in Egypt. The International Journal of Business and
Management Research [ejournal], pp. 51-68. Available
http://ijbmr.org/yahoo_site_admin/assets/docs/2012_Issue.0192727.pdf. [Accessed 29 May
2016].
Nyanga, M. (2015). The nature of brand loyalty at the base of the pyramid, A research
project submitted as partial fulfilment to a Masters in Business Administration at the
Gordon Institute of Business Science of the University of Pretoria. Pretoria: South Africa.
Available at http://repository.up.ac.za/handle/2263/45039. [Accessed 12 October 2015].
Okada, E.M. (2005). Justification Effects on Consumer Choice of Hedonic and Utilitarian
Goods. Journal of Marketing Research, 42(1): 43-53.
Oliver, R.L. (1999). Whence Consumer Loyalty. Journal of Marketing, 63: 33-44.
Oliver, R.L. (1980). A Cognitive Model of the Antecedents and Consequences of
Satisfaction Decisions. Journal of Marketing Research, XVII, November 1980: 460-469.
Olsen, S.O. and Skallerud, K. (2011). Retail attributes’ differential effects on utilitarian
versus hedonic shopping value. Journal of Consumer Marketing, 28(7): 532-539.
Park, C.W., Jaworski, B.J. and MacInnis, D.J. (1986). Strategic Brand Concept-Image
Management. The Journal of Marketing, 50(4): 135-145.
Phiri, N. (2007). Brand loyalty in the sports drinks market, A short dissertation submitted
for the Magister Commercii in Business Management at University of Johannesburg.
Johannesburg: South Africa’. Available at https://ujdigispace.uj.ac.za/handle/10210/5932.
[Accessed 12 October 2015].
Pillay, P. (2007). The importance of branding fast moving consumer goods in retail chain
stores: Consumers & Marketers perceptions in South Africa, Masters Dissertation at
University of Kwazulu-Natal. Kwazulu-Natal: South Africa. Available at
http://hdl.handle.net/10413/1044. [Accessed 02 November 2015].
EMS (M. BUS. ADMIN. DEGREE) JUNE 2016 117
Punniyamoorthy, M. and Raj M.P.M. (2007). An empirical model for brand loyalty
measurement. Journal of Targeting, Measurement and Analysis for Marketing, 15(4): 222-
233.
Qasim, M.S. and Agarwal, S. (2015). Consumer Behaviour towards selected FMCG (Fast
Moving Consumer Goods) in Delhi NCR. International Journal of Informative &
Futuristic Research [ejournal], 2(7): 2041–2047, Available at http://ijifr.com/pdfsave/21-
03-2015766V2-E7-027.pdf. [Accessed 23 November 2015].
Radder, L., van Eyk, M. and Swiegelaar, C. (2015). Levels of customer loyalty and
perceptions of loyalty programme benefits: A South African retail example. The Retail and
Marketing Review, 11(1): 92-105.
Rai, A. and Medha, S. (2013). The Antecedents of Customer Loyalty: An empirical
Investigation in Life Insurance Context. Journal of Competitiveness, 5(2): 139-163.
Available at
http://www.cjournal.cz/index.php?hid=clanek&bid=search&cid=139&cp=&q=The
Antecedents of Customer Loyalty. [Accessed 18 October 2015].
Ramona, L.G. (2012). A STUDY REGARDING THE CONSUMER BRAND LOYALTY,
PHD THESIS, BABEŞ-BOLYAI UNIVERSITY, FACULTY OF ECONOMICS AND
BUSINESS ADMINISTRATION MARKETING DEPARTMENT. Alba County:
Romania. Available at http://193.231.20.119/doctorat/teza/fisier/108. [Accessed 03
November 2015].
Rundle-Thiele, S. and Mackay, M. (2001). Assessing the performance of brand loyalty
measures. Journal of Services Marketing, 15(7): 529-546. Available at
http://dx.doi.org/10.1108/EUM0000000006210. [Accessed 23 October 2015].
Sahin, A., Zehir, C. and Kitapçı, H. (2011). The Effects of Brand Experiences, Trust and
Satisfaction on Building Brand Loyalty; An Empirical Research On Global Brands. 7th
International Strategic Management Conference, Procedia Social and Behavioral Sciences
24. Available at http://www.sciencedirect.com/science/article/pii/S1877042811016715.
[Accessed 30 March 2013].
EMS (M. BUS. ADMIN. DEGREE) JUNE 2016 118
Sekaran, U. (2003). Research Methods for Business: A Skill-Building Approach. New
York, NY: John Wiley & Sons Inc,
Sharma, S. (1981). The theory of Stochastic Preferences: Further Comments and
Clarifications. Journal of Marketing Research, 18(3), August 1981: 364-369.
Siag, R. Choudhary, S. (2015). Rural India offering opportunities to FMCG companies.
International Journal of Applied Research; 1 (4): 1-4.
Simay, A.E. (2013). Connexions of Consumer Satisfaction, Consumer Trust and Consumer
Loyalty in the Hungarian Mobile Telecommunication Services Market, Ph.D. dissertation,
Department of Marketing Research and Consumer Behaviour, Corvinus University:
Budapest. Available at http://phd.lib.uni-corvinus.hu/748/13/Simay_Attila_ten.pdf.
[Accessed 27 October 2015].
Spassova, G. and Isen, A.M. (2013). Positive affect moderates the impact of assortment
size on choice satisfaction. Journal of Retailing, 89(4): 397-408.
Srivastava, K. and Sharma, N.K. (2013). Consumer attitude towards brand extension: A
comparative study of fast moving consumer goods, durable goods and services. Journal of
Indian Business Research [ejournal], 5(3): 177–197, Available at
http://dx.doi.org/10.1108/JIBR-07-2012-0057. [Accessed 19 November 2015].
Steenkamp, E.N. (2010). Investigating CRM application within the South African FMCG
Industry, a research report in partial fulfilment of the requirements for the degree of Master
of Business Administration. Stellenbosch: University of Stellenbosch, South Africa,
Available at http://scholar.sun.ac.za/handle/10019.1/1020. [Accessed 13 October 2015].
Steenkamp, J. E. M. and Burgess, S. M. (2002). Optimum stimulation level and
exploratory consumer behaviour in an emerging consumer market. International Journal of
Research in Marketing, 19: 131-150.
Suhartanto, D. et al. (2011). Examining the formation of attitudinal, conative and
behavioural loyalty: An empirical analysis in the Hotel Industry. European Journal of
Tourism, Hospitality and Recreation [ejournal], 2(3): 7-27. Available at
http://www.academia.edu/3215344/Examining_the_formation_of_attitudinal_conative_and
EMS (M. BUS. ADMIN. DEGREE) JUNE 2016 119
_behavioural_loyalty_An_empirical_analysis_in_the_hotel_industry. [Accessed 29
October 2015].
Suhr, D. (2006). The basics of structural equation modeling. Presented: Irvine, CA, SAS
User Group of the Western Region of the United States (WUSS).
Terblanche, E. (2002). Building brand loyalty within selected segments of the South
African fast moving consumer goods market: Magister Technologiae Thesis. Port Elizabeth
Technicon: South Africa, Available at
http://dspace.nmmu.ac.za:8080/jspui/handle/10948/78. [Accessed 02 November 2015].
Tiwari, M.K. (2012). An empirical analysis of advertising on Marketing of FMCG Product.
International Journal of Marketing and Technology, 2(6). Available at
http://www.ijmra.us/project%20doc/IJMT_JUNE2012/IJMRA-MT1166.pdf. [Accessed 17
November 2015].
Thurn, E. and Gustafsson, D. (2012). The Battle of the Customers – Does loyalty exist
within the FMCG market?, Masters thesis, Spring 2012’, Linnaeus University – School of
Business and Economics. Växjö: Sweden. Available at http://www.diva-
portal.org/smash/record.jsf?pid=diva2%3A533442&dswid=3173. [Accessed 18 October
2015].
Trade Intelligence Corporate Comparative Performance Report. (2015). Corporate
Comparative Report [Online], May 2015. Available at
http://www.tradeintelligence.co.za/TradeProfiles/RetailComparativeAnalysis.aspx.
[Accessed 23 November 2015].
Tuominen, P. (1999). Managing Brand Equity, Turku School of Economics and Business
Administration. Available at http://lta.hse.fi/1999/1/lta_1999_01_a4.pdf. [Accessed 10
October 2015].
Ullah, G.M.S and Prince, P.R. (2012). Factors Influencing the Bangladeshi Consumers’
Purchase Decision Regarding Fast Moving Consumer Goods: An Exploratory Study. IUP
Journal of Brand Management, 9(1): 7-27.
EMS (M. BUS. ADMIN. DEGREE) JUNE 2016 120
Uncles, M.D., Dowling, G.R. and Hammond, K. (2003). Customer loyalty and customer
loyalty programs. Journal of Consumer Marketing, 20(4): 294-316.
Vaishnani, H.B. (2011). Effects of Sales Promotions on Consumer Preferences and Brand
Equity Perception, thesis submitted in partial fulfilment of the requirements for the Degree
of Doctor of Philosophy to Saurashtra University, Available at
http://etheses.saurashtrauniversity.edu/63/. [Accessed 26 November 2013].
Veloutsou, C. (2015). Brand evaluation, satisfaction and trust as predictors of brand
loyalty: the mediator-moderator effect of brand relationships. Journal of Consumer
Marketing, 32(6): 405-421.
Waters, D. (2011). Quantitative Methods for Business, Fifth edition. Essex, England:
Pearson Education Limited.
Westbrook, R.A. and Oliver, R.L. (1991). The Dimensionality of Consumption Emotion
Patterns and Consumer Satisfaction. Journal of Consumer Research, 18, June 1991: 84-91.
Wilson, A. (2012). Marketing Research: An Integrated Approach, 3rd edition, Financial
Times. England: Prentice Hall.
Yoo, M. and Bai, B. (2013). Customer loyalty marketing research: A comparative
approach between hospitality and business journals. International Journal of Hospitality
Management, 33: 166-177.
Zeeman, R.C. (2013). HEDONIC AND UTILITARIAN SHOPPING MOTIVATIONS
AMONG SOUTH AFRICAN BLACK GENERATION Y STUDENTS, dissertation submitted
for the degree, MAGISTER COMMERCII in the discipline of MARKETING
MANAGEMENT, FACULTY OF ECONOMIC SCIENCES AND INFORMATION
TECHNOLOGY. North-West: North-West University, VAAL TRIANGLE CAMPUS,
South Africa, Available at http://dspace.nwu.ac.za/handle/10394/10627. [Accessed 06
October 2015].
Zikmund, W.G., Babin, B., Carr, J. and Griffin, M. (2010). Business Research Methods,
Eighth edition, Ohio, South-Western/Cengage Learning.

EMS (M. BUS. ADMIN. DEGREE) JUNE 2016 121
Zineldin, M., Nessim, K.S., Thurn, E. and Gustafsson, D. (2014). Loyalty, Quality and
Satisfaction in FMCG Retail Market does Loyalty in Retailing Exist? Journal of Business
& Financial Affairs [ejournal], 3(2): 1-8. Available at
http://www.omicsgroup.org/journals/loyalty-quality-and-satisfaction-in-fmcg-retail-
marketdoes-loyalty-in-retailing-exist-2167-0234.1000122.pdf. [Accessed 23 November
2015].
EMS (M. BUS. ADMIN. DEGREE) JUNE 2016 122
Appendix A: FULL QUESTIONAIRE USED IN THIS STUDY
Dear Respondent,
My name is Ashraf Adams. I am studying for Masters in the above school and I am
in the process of finishing a research project on fast moving consumer goods
(FMCGs) with the Title:
“The impact of utilitarian and hedonic needs satisfaction on brand trust,
brand affect and Brand Loyalty for selected fast moving consumer goods in
South Africa”.
FMCGs are products you buy regularly from stores and supermarkets for home
and personal use such as food, beverages, stationery, batteries, camera film,
vitamin supplements, headache tablets, shaving blades, toiletries, and alcohol. It
will be greatly appreciated if you could take a moment to complete the following
questionnaire concerning your shopping behaviour around the following FMCGs
brands on page 3:
Please note that your response to the questions that follows will be treated
with the strictest confidentiality. It would therefore be greatly appreciated if
you would answer all questions in a fair and open manner. The information
gathered from this questionnaire will be used purely for research purposes.
Your participation is voluntary and you may withdraw from the survey at any
stage.
Thank you for taking the time and effort to complete this questionnaire.
UNIVERSITY OF THE WESTERN CAPE
School of Business and Finance
Private Bag x17 Bellville 7535 South Africa
Telephone: (021) 959 3525 Fax: (021) 959 3219
Secretary: (021) 959 2595

EMS (M. BUS. ADMIN. DEGREE) JUNE 2016 123
Declaration form from the Respondent/ Interviewee:
By completing this questionnaire and submitting it, I confirm that I
understand the contents and nature of the document and consent to
participate in the study.
Signature of Participant: --------------------------------------------------------------------------
------
Note: Please feel free to contact me at [email protected] if you have
questions pertaining to this study

EMS (M. BUS. ADMIN. DEGREE) JUNE 2016 124
Section A – Personal Data
1. Are you:
Male Female
2. Please indicate your age group from the following:
18-24
35-44
55-64
25-34
45-54
65 or over
3. What is your population group? (Please check the one that describes you the
closest.)
African
Indian
Other (for data trending purposes only)
White
Coloured
4. What is the highest level of formal education you have completed? (Please check
only one.)
Attended Primary School
Diploma
Postgraduate Degree
Attended High School
Undergraduate degree
5. What is your marital status? (Please check only one.)
Married
Separated or Divorced
Single, Never Married
Widowed
Instructions:
Please indicate your preference by marking with a cross (X) in the
appropriate block provided.

EMS (M. BUS. ADMIN. DEGREE) JUNE 2016 125
6. How would you describe where you have stayed in the last 5 years. (Please
check only one.)
Rural settlement
City / metropolitan area
Village / town
Other

EMS (M. BUS. ADMIN. DEGREE) MAY 2016 126
Examples of washing powder brands in South African stores
Examples of soap brands in South African stores
Examples of juice brands in South African stores
Examples of milk brands in South African stores
Examples of breakfast cereal brands in South African stores
Instructions:
Think about the brands that you use for washing powder / soap,
juice / milk, breakfast cereals and answer questions that follow with
any one of the following brands in mind.

EMS (M. BUS. ADMIN. DEGREE) JUNE 2016 127
Please indicate the extent to which you agree or disagree by using the following
key:
1 Strongly Disagree
2 Disagree
3 Neutral
4 Agree
5 Strongly Agree
Please indicate your preference by marking with a cross (X) in the appropriate
block provided.
Section B – Consumer perception on brand utilitarian value
B1. When I buy FMCG products, such as those shown above, I need brand
names as a guide to choose.
Strongly disagree1 2 3 4 5Strongly agree
B2. The brand names of FMCG products, such as those shown above, indicate
that the products will work better than unbranded versions.
Strongly disagree1 2 3 4 5Strongly agree
B3. Any of the brands, such as those shown above, will be beneficial to me in
terms of performance when I buy FMCG products.
Strongly disagree1 2 3 4 5Strongly agree
B4. The brands of FMCG products, such as those shown above, are not a
guarantee of better performance.
Strongly disagree1 2 3 4 5Strongly agree
B5. The brands of FMCG products, such as those shown above, are important
to me because they perform their functions.
Strongly disagree1 2 3 4 5Strongly agree
B6. I trust the brands of FMCG products, such as those shown above.
Strongly disagree1 2 3 4 5Strongly agree
B7. I would buy the brands of FMCG products, such as those shown above,
because the value they offer is important to me.
Strongly disagree1 2 3 4 5Strongly agree
B8. Brands, such as those shown above, are more reliable in their performance
compared to FMCG products without brand names.
Strongly disagree1 2 3 4 5Strongly agree

EMS (M. BUS. ADMIN. DEGREE) JUNE 2016 128
Section C – Consumer perception on brand hedonic value
C1. I think the brands of FMCG products, such as those shown above, is
interesting when one chooses these products.
Strongly disagree1 2 3 4 5Strongly agree
C2. I think the sight of brands of FMCG products, such as those shown above,
is exciting.
Strongly disagree1 2 3 4 5Strongly agree
C3. I think the brands of FMCG products, such as those shown above, is
brilliant.
Strongly disagree1 2 3 4 5Strongly agree
C4. I like the fact that brands of FMCG products, such as those shown above,
can better perform its job.
Strongly disagree1 2 3 4 5Strongly agree
C5. I think the brands of FMCG products, such as those shown above, look
more pleasant than un- branded products.
Strongly disagree1 2 3 4 5Strongly agree
C6. I think the brands of FMCG products, such as those shown above, is more
attractive than un- branded products.
Strongly disagree1 2 3 4 5Strongly agree
C7. FMCG products with brand names, as shown above, is more likable when
compared to those without brand names.
Strongly disagree1 2 3 4 5Strongly agree
Section D – Consumer satisfaction
D1. The brands of FMCG products, such as those shown above, make me
happy when shopping for these types of products.
Strongly disagree1 2 3 4 5Strongly agree
D2. The brands of FMCG products, such as those shown above, satisfy my
needs.
Strongly disagree1 2 3 4 5Strongly agree

EMS (M. BUS. ADMIN. DEGREE) JUNE 2016 129
D3. I am excited when I use brands of FMCG products, such as those shown
above.
Strongly disagree1 2 3 4 5Strongly agree
D4. I am confident in brands of FMCG products, such as those shown above.
Strongly disagree1 2 3 4 5Strongly agree
D5. I trust / feel secure in brands of FMCG products, such as those shown
above.
Strongly disagree1 2 3 4 5Strongly agree
D6. I get pleasantly surprised when using brands of FMCG products, such as
those shown above.
Strongly disagree1 2 3 4 5Strongly agree
D7. I sometimes feel worried when using the brands of FMCG products, such
as those shown above.
Strongly disagree1 2 3 4 5Strongly agree
D8. I am sometimes disappointed with brands of FMCG products, such as
those shown above.
Strongly disagree1 2 3 4 5Strongly agree
Section E – Consumer behavioural brand loyalty
E1. My next shopping trip for FMCG products will contain branded FMCG
products, such as those shown above.
Strongly disagree1 2 3 4 5Strongly agree
E2. I will continue to buy branded FMCG products, such as those shown above
when.
Strongly disagree1 2 3 4 5Strongly agree
E3. Any of the brands of FMCG products, such as those shown above, will
always be on my list when I shop for these types of products.
Strongly disagree1 2 3 4 5Strongly agree

EMS (M. BUS. ADMIN. DEGREE) JUNE 2016 130
Section F – Consumer attitudinal brand loyalty
F1. I am committed to using any of the brands of FMCG products, such as
those shown above.
Strongly disagree1 2 3 4 5Strongly agree
F2. When I shop for FMCG products, I am willing to pay a bit more for any of
the brands as shown above.
Strongly disagree1 2 3 4 5Strongly agree
F3. I will not be happy when I shop for FMCG products and do not find any of
the brands as shown above.
Strongly disagree1 2 3 4 5Strongly agree
Section G – Consumer brand trust
G1. When I shop for FMCG products, I trust the brands as shown above.
Strongly disagree1 2 3 4 5Strongly agree
G2. When I shop for FMCG products, I depend on brands as shown above.
Strongly disagree1 2 3 4 5Strongly agree
G3. I see honesty and reliability in the brands of FMCG products, such as those
shown above.
Strongly disagree1 2 3 4 5Strongly agree
G4. I see safety and peace of mind in the brands of FMCG products, such as
those shown above.
Strongly disagree1 2 3 4 5Strongly agree
Section H – Consumer brand affect
H1. I feel good when I use any of the brands of FMCG products, such as those
shown above.
Strongly disagree1 2 3 4 5Strongly agree
H2. I feel happy when I use any of the brands of FMCG products, such as
those shown above.
Strongly disagree1 2 3 4 5Strongly agree
EMS (M. BUS. ADMIN. DEGREE) JUNE 2016 131
H3. I am pleased when I use brands of FMCG products, such as those shown
above.
Strongly disagree1 2 3 4 5Strongly agree
Section I – Respondent assessment of survey quality
I1. I found this survey experience pleasant.
Strongly disagree1 2 3 4 5Strongly agree
I2. This survey length was okay.
Strongly disagree1 2 3 4 5Strongly agree

EMS (M. BUS. ADMIN. DEGREE) JUNE 2016 132
Appendix B: PROOFREADING CERTIFICATION