absorbance and photoluminescence spectra - kaust...
TRANSCRIPT

Supplementary Figure 1: Absorbance and photoluminescence spectra. UV/Vis
absorbance and photoluminescence spectra of (a) SiIDT-2FBT and SiIDT-2FBT/PC70BM
(1:2) thin films and (b) SiIDT-DTBT and SiIDT-DTBT/PC70BM (1:3) thin films. The films were
prepared following published device film fabrication procedures.1 Photoluminescence
quenching by PC70BM in both blends was found to be ~96 %. The thickness of the films is
44±7 nm for SiIDT-DTBT/PC70BM and 67±5 nm for SiIDT-2FBT/PC70BM.

Supplementary Figure 2: Microsecond transient absorption spectroscopy of
SiIDT2FBT and SiIDT2FBT/PC70BM. (a) Transient absorption spectra of thin SiIDT-2FBT
film. Sample was excited with 635 nm laser pulses with 13.4 µJ.cm-2. (b) Single wavelength
kinetics of SiIDT-2FBT measured at 1000 nm with 635 nm, 3.1 µJ.cm-2 excitation under
constant oxygen and nitrogen flux. (c) Single wavelength kinetics of SiIDT-2FBT/PC70BM
(1:2) measured at 1000 nm with 635 nm, 3.1 µJ.cm-2 excitation. The kinetics were recorded
under nitrogen (before and after oxygen measurements) and oxygen atmospheres. The
signal amplitude and decay was found to be completely reversible when measured under a
nitrogen atmosphere (green and red decays) after the oxygen quenching experiment (blue
decay), thus indicating low sample degradation during the duration of our measurements.
The kinetic (measured under N2) was fitted with a (
) function to account
for the mono-exponentially decaying polymer triplet exciton and the power law obeying
polaron signal decay. The triplet contribution to the overall transient absorption signal was

thus extracted. A comparison of the triplet absorption at 300 ns after light excitation in the
neat polymer and blend film shows that triplet generation in the blend is 3 times more
efficient than in the neat polymer film.
Supplementary Figure 3: Microsecond transient absorption spectroscopy of
SiIDTDTBT and SiIDTDTBT/PC70BM. Transient absorption spectra of thin (a) SiIDT-DTBT
and (c) SiIDT-2FBT/PC70BM (1:3) films. The films were prepared following device film
fabrication procedures reported previously.1 Laser excitation was with 630 nm laser pulses
with an excitation density of 4.7 µJ.cm-2 for the neat film and 5.8 µJ.cm-2 for the blend film
experiments. b) SiIDT-DTBT kinetics at 980 nm (630 nm excitation) in oxygen and nitrogen
atmospheres show quenching of the signal in the presence of molecular oxygen. d) The
SiIDT-DTBT/PC70BM (1:3) kinetics show that the signal decay is independent of the probed
wavelength, thus indicating the presence of only polaron species in the film.

Supplementary Figure 4: Polymer singlet exciton decay. Transient absorption decays of
the neat SiIDT-2FBT film excited at 635 nm and probed at 990, 1200, 1300 nm. The kinetics
were fitted globally with a single exponential function yielding a 160 ps exciton lifetime.
Supplementary Figure 5: Global fitting analyses of triplet and polaron decays. Global
fitting analyses of the transient absorption data of SiIDT-2FBT/PC70BM (1:2) blends
measured at different excitation densities. Kinetics were fitted with: (
) (
)
(
) . Data collected with higher excitation densities could not be fitted with this
function and is not included here. The first two exponential terms correspond to the polymer
singlet exciton decay, while the third exponent fits the rise time of the triplet signal starting at
100 ps.
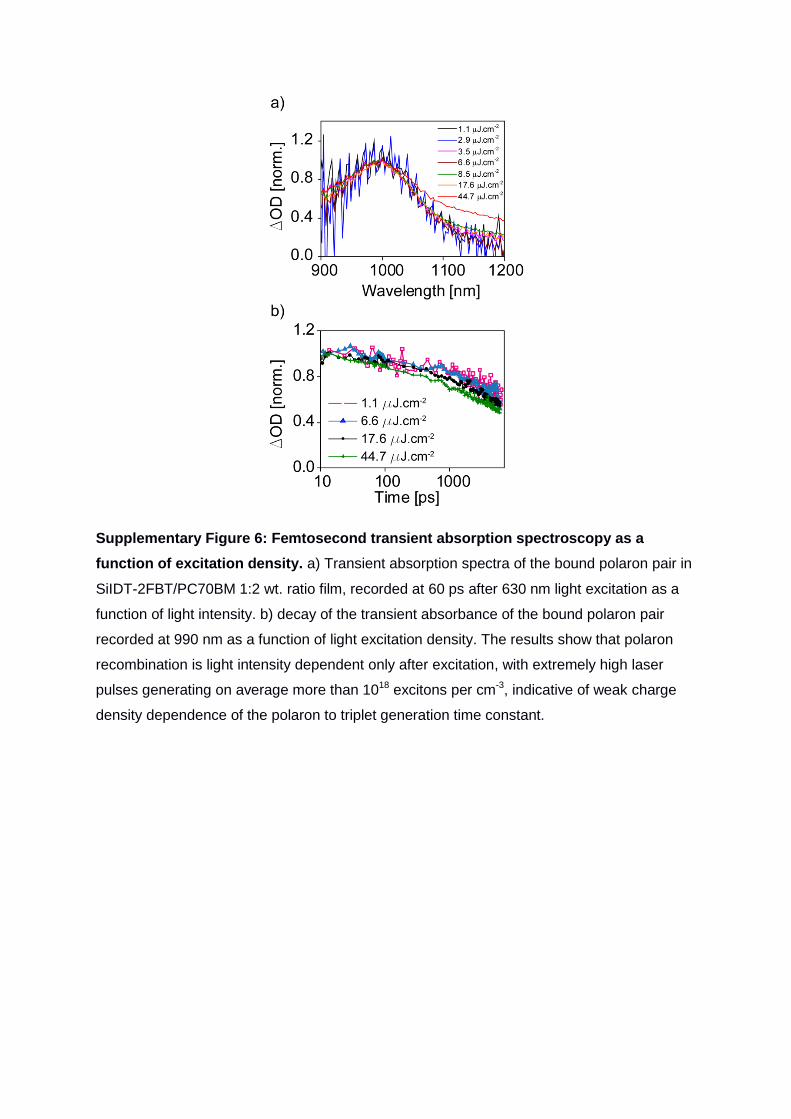
Supplementary Figure 6: Femtosecond transient absorption spectroscopy as a
function of excitation density. a) Transient absorption spectra of the bound polaron pair in
SiIDT-2FBT/PC70BM 1:2 wt. ratio film, recorded at 60 ps after 630 nm light excitation as a
function of light intensity. b) decay of the transient absorbance of the bound polaron pair
recorded at 990 nm as a function of light excitation density. The results show that polaron
recombination is light intensity dependent only after excitation, with extremely high laser
pulses generating on average more than 1018 excitons per cm-3, indicative of weak charge
density dependence of the polaron to triplet generation time constant.

a)
Conformer Structure Energy/trimer
[eV]
SiIDT-2FBT (‘wavy’)
minimum
SiIDT-2FBT (‘linear’)
minimum+0.039
SiIDT-DTBT (‘wavy’)
minimum
SiIDT-DTBT (‘linear’)
minimum+0.087
b)
Supplementary Figure 7: Conformers and torsional potential energy surfaces of
oligomers used in DFT studies. (a) Conformers of SiIDT-2FBT and SiIDT-DTBT
copolymers and their energies calculated in vacuum at the DFT B3LYP/6-31G(d) level;
‘minimum’ indicates the most stable structure obtained from the full set of tested oligomer
conformers. (b) Torsional potential calculated between SilDT and BT (blue curve, higher
amplitude) and between SilDT and 2FBT (grey curve, lower amplitude).

a)
b)
Supplementary Figure 8: Calculated energy level alignment of oligomers. (a) Size
dependence of the calculated energy level alignment in the investigated blends obtained
with TDDFT B3LYP/6-31G(d); (b) Comparison of the two model systems: tetramer of SiIDT-
2FBT and trimer of SiIDT-DTBT blended with PC70BM; the experimental (EXP) values have
been obtained from the onset of absorption of the neat polymer films, published in ref. 1. The
S1 (S1) and T1 (T1) are the lowest–energy singlet and triplet excited states, respectively,
calculated for an isolated oligomer. The 1CT1 (1CT1) energy is the energy of the
Coulombically-bound electron-hole pair across the interface. The triplet 3CT1 state is not
shown but its energy is calculated to be almost degenerate with the singlet 1CT1.
0
0.5
1
1.5
2
2.5
EXP DA DADA DADADA DADADA'HTHT'
DADADADA
Ener
gy [
eV
]
S1 SiIDT-2FBT
1CT1 SiIDT-2FBT
T1 SiIDT-2FBT
S1 SiIDT-DTBT
1CT1 SiIDT-DTBT
T1 SiIDT-DTBT
0
0.2
0.4
0.6
0.8
1
1.2
1.4
1.6
1.8
2
EXP SiIDT-2FBT 4(SiIDT-2FBT):PCBM EXP SiIDT-DTBT 3(SiIDT-DTBT:PCBM)
Ener
gy [
eV
] S1
T1
1CT1
1CT4

a)
DADADA SiIDT-2FBT
Hole Electron
S1 (NTOs)
T1 (spin
density) 1CT1
(NTOs 0.005)
1CT1 (NTOs)
Polaron+ (MO)
b)
DADADA SiIDT-DTBT
Hole Electron
S1 (NTOs)
T1 (spin
density)
1CT1 (NTOs 0.005)
1CT4 (NTOs 0.005)
1CT1
(NTOs 0.02)
1CT4 (NTOs 0.02)
Polaron+ (MO)

Supplementary Figure 9: Charger density isosurfaces. The density iso-values
(calculated using a spin cut-off of 0.02 electronic-charge per Bohr3 unless otherwise stated)
of the lowest lying electronically excited states with charge transfer character (1CT1) in
trimer:fullerene pairs as well as the hole polaron. (a) For SiIDT-2FBT the electron in the first
excited state is delocalised between the oligomer and PC70BM. (b) For SiIDT-DTBT the
electron and hole NTOs are localised on the PC70BM and oligomer units, respectively.
Supplementary Figure 10: Electroluminescence spectra Electroluminescence spectra of
the films of SiIDT-2FBT and SiIDT-2FBT/PC70BM. The shift in energy between these two
spectra was estimated to be 0.14 eV consistent with our quantum chemical calculations.
Electroluminescence was measured using a spectrograph (Shamrock 303) combined with a
InGaAs photodiode array (iDUS) cooled to -90 °C. Electroluminescence spectra from blend
and pure polymer devices were measured at 11 mA/cm2.

Supplementary Figure 11: Field dependent transient absorption spectroscopy. TA
decays of SiIDT-DTBT/PC70BM (1:3) and SiIDT-2FBT/PC70BM (1:2) devices as a function
of applied external electrical bias, measured with 635 nm and 630 nm excitation pulses,
respectively. Probe pulses, 980 nm, were used to probe polaron absorbance.
Supplementary Figure 12: Device JV curves. J-V curves of optimised SiIDT-
2FBT/PC70BM (1:2) and SiIDT-DTBT/PC70BM (1:3) devices measured in dark and under
AM1.5 one sun conditions.

Supplementary Figure 13: Transient photocurrent and photovoltage decays. Transient
photocurrent (line) and photovoltage (triangles) decays for SiIDT-2FBT/PC70BM (1:2) at 0.5
sun equivalent light intensity. Results show substantially faster decay time at short circuit
suggesting efficient carrier extraction with little competition from non-geminate
recombination.
Supplementary Figure 14: Charge extraction. Charge extraction at open-circuit (crosses)
and at 1 sun measured at various applied bias (squares) after correction for incurred charge
carrier losses and capacitive charge on the electrodes for SiIDT-2FBT/PC70BM (1:2) device.
30
25
20
15
10
5
0
Tra
nsie
nt V
olta
ge
[mV
]
20x10-6151050
Time [s]
0.5
0.4
0.3
0.2
0.1
0.0
Tra
nsie
nt C
urr
ent [m
A]
TPV 0.5 sun TPC 0.5 sun
1015
2
3
4
5
6
1016
2
3
4
5
Charg
e c
arr
ier
density n
[cm
-3]
1.00.80.60.40.20.0
Voltage V [V]
1 sun CE at various applied bias CE at open-circuit
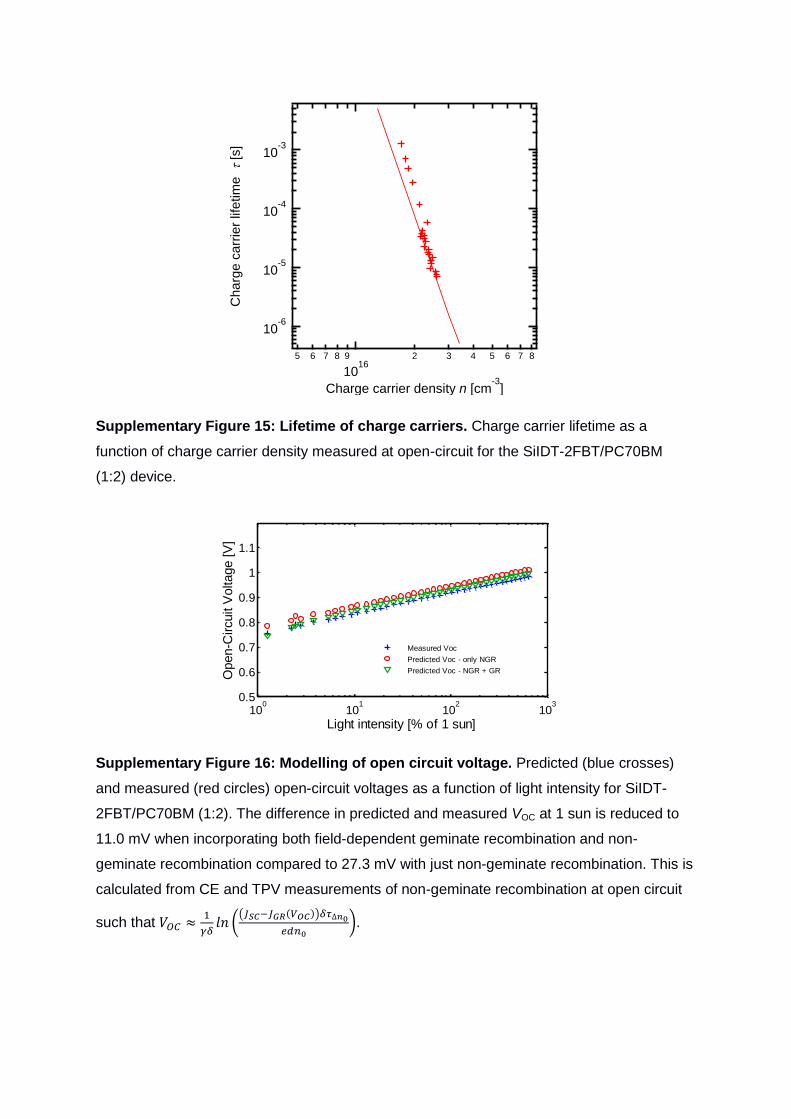
Supplementary Figure 15: Lifetime of charge carriers. Charge carrier lifetime as a
function of charge carrier density measured at open-circuit for the SiIDT-2FBT/PC70BM
(1:2) device.
Supplementary Figure 16: Modelling of open circuit voltage. Predicted (blue crosses)
and measured (red circles) open-circuit voltages as a function of light intensity for SiIDT-
2FBT/PC70BM (1:2). The difference in predicted and measured VOC at 1 sun is reduced to
11.0 mV when incorporating both field-dependent geminate recombination and non-
geminate recombination compared to 27.3 mV with just non-geminate recombination. This is
calculated from CE and TPV measurements of non-geminate recombination at open circuit
such that
(
( ( ))
).
10-6
10-5
10-4
10-3
Ch
arg
e c
arr
ier
life
tim
e
[s]
5 6 7 8 9
1016
2 3 4 5 6 7 8
Charge carrier density n [cm-3
]
100
101
102
103
0.5
0.6
0.7
0.8
0.9
1
1.1
Light intensity [% of 1 sun]
Open-C
ircuit V
oltage [V
]
Measured Voc
Predicted Voc - only NGR
Predicted Voc - NGR + GR

S1
EXP [eV]
a
ECS
PESA [eV]
b
S1 CALC [eV]
ECT1
CALC [eV]
ET
CALC [eV]
SiIDT-2FBT/PC70BM
1.8 1.7 1.60 1.45 1.10
SiIDT-DTBT/PC70BM
1.7 1.3 1.55 1.34 0.99
Supplementary Table 1. Optical properties and experimental and calculated energy
levels of SiIDT based polymers. (a) The energy of the lowest exciton transition (S1) was
estimated from the onset of absorption of the neat polymer films, published in ref. 1. (b) The
energies of the separated charges were estimated previously using photoelectron
spectroscopy (PESA)1 and using 3.7 eV for the fullerene electron affinity.
VOC
[V] JSC
[mA.cm-2
] FF
PCE [%]
Film thickness
[nm]
SiIDT-2FBT/PC70BM 0.92 2.12 0.56 1.09 93
SiIDT-DTBT/PC70BM 0.82 8.52 0.49 3.45 75
Supplementary Table 2. Device characteristics. The device characteristics were
determined from the J-V curves of the SiIDT-2FBT/PC70BM (1:2) and SiIDT-DTBT/PC70BM
(1:3) blends.

SiIDT-2FBT/PC70BM Length
[Å]
S1
[eV]
1CT1
[eV]
1CT4
[eV]
T1
[eV]
|1CT1-S1|
[eV]
|T1-1CT1|
[eV]
EXP 1.8
DA ~15 2.26 1.79 2.09 1.51 0.47 0.28
DADA ~30 1.80 1.55 2.02 1.28 0.25 0.27
DADADA
(PC70BM translated
±2Å along from BT) ~50
1.75 1.53
(1.52)
1.81
(1.83) 1.24 0.22 0.29
DADADA ‘wavy’ 1.69 1.49 1.79 1.16 0.20 0.33
DADADADA ~65 1.6 1.45 1.71 1.1 0.15 0.35
SiIDT-
DTBT/PC70BM
Length
[Å]
S1
[eV]
1CT1
[eV]
1CT4
[eV]
T1
[eV]
|1CT1-S1|
[eV]
|T1-1CT1|
[eV]
EXP 1.7
DA ~20 1.86 1.48 2.05 1.13 0.38 0.35
DADA ~40 1.78 1.36 1.71 1.10 0.42 0.26
DADADA
(PC70BM translated
±2Å along from BT) ~70
1.55 1.34
(1.32)
1.56
(1.56) 0.99 0.21 0.35
DADADA ‘wavy’ 1.58 1.39 1.6 1.03 0.19 0.36
Supplementary Table 3. Excited state energies and energy differences for different
oligomer sizes. For each trimer two additional oligomer-fullerene configurations were
considered: (i) PC70BM displaced 2 Å along the oligomer axis (value in brackets for the
1CT1), and (ii) a ‘linear’ oligomer replaced with the wavy Head-to-Tail conformer (‘wavy’).

Supplementary Note 1. Polymer and triplet exciton spectra. The polymer triplet
absorption spectrum, included in Figure 2b was obtained from the microsecond transient
absorption spectra of the neat polymer film as shown in Supplementary Figure 2. The
polymer polaron spectrum in Figure 2b was obtained from the blend transient absorption
spectrum recorded after 3 microseconds time delay in which the polymer triplet absorption
after 3 microseconds is assumed to be negligible.
Supplementary Note 2. Quantum chemical calculation of excited state energetics. We
have used time-dependent density functional theory (TDDFT) with the B3LYP functional to
calculate relevant excited states of SiIDT-2FBT, SiIDT-DTBT and the two polymers
combined with PC70BM. Both the energetics of these states relative to the ground state, and
further analysis on the charge distribution for these states provide information on the
processes occurring following photoexcitation of the two different polymers. Our model
system is an oligomer interacting with a single PC70BM molecule in vacuum.
We have performed calculations on a tetramer of SilDT-2FBT and a trimer of Si-lDT-DTBT
(~65 Angstrom versus ~70 Angstrom end to end). Oligomers of such length provide excited
state energetics (linear response TDDFT with B3LYP/6-31G(d)) comparable to the
experimental data (Supplementary Figure 8 and Supplementary Table 3) at a modest
computational cost. Furthermore, for such oligomer lengths we observe saturation to within ~
0.05 eV in the oligomer length dependent values of the first singlet, triplet and charge
transfer state energies.
Fullerene-oligomer pairs were constructed in a three step process. Firstly, the ground state
geometry of the oligomer with methyl groups replacing the lateral alkyl chains was optimised
at the DFT (B3LYP/6-31G(d)) level.2 The calculated torsional potential between the SiIDT
and 2FBT units (Supplementary Figure 7b) indicates that the optimum ground-state
conformation is planar, with the barrier having risen to 25 meV at ±20 degrees from planarity
in the gas phase (suggesting thermal fluctuations in torsion of ±20 degrees at 300 K). For
non-fluorinated SiIDT-BT the torsional potential is shallower, allowing thermal fluctuations of
±40 degrees. This difference can be attributed to additional non-bonding interactions present
between the fluorine atoms on the BT unit and sulphur or C-H groups on the SiIDT moiety.3
The torsional potential for the SiIDT-DTBT similarly has a minimum for planar structures and
is shallower than that for Si-IDT-2FBT. Both polymers can potentially form a variety of
different conformations that are compatible with the optimum planar structure. We consider
just two, (1) where the two thiophene units or fragments flanking the BT are both oriented so
that their sulphur atoms point away from the thiodiazole unit, which we denote as ‘wavy’ and

(2) where the two thiophene units or fragments flanking the BT are oriented in opposite
directions, which we denote as ‘linear’. The particular structures studied are shown in
Supplementary Figure 7. Although for both systems the ‘wavy’ conformer is found to be
more stable from the gas phase calculations, we choose to consider henceforth only the
‘linear’ conformers. We select these structures because the linear conformers are better able
to organise into ordered domains, as required from the observed tendency of SiIDT-2FBT to
crystallise and because the difference in the gas phase energies relative to the minimum
energy ‘wavy’ conformers is only 0.013 and 0.026 eV per repeat unit for SiIDT-2FBT and
SiIDT-DTBT, respectively. The higher tendency of SiIDT-2FBT to crystallise is probably
influenced by the planarisation induced by fluorination.
In the next stage, the structure of the PC70BM molecule is optimised, using DFT with
B3LYP/6-31G(d), and then placed in the space between the side chains of the optimised
oligomer and above the acceptor (BT) unit in such a way that a hexagonal facet of the
PC70BM is almost cofacial (i.e. slip-stacked orientation) with the 6-atom (benzoid) ring of the
BT. The edge to edge oligomer-fullerene separation is set to 3.5 Angstroms. This is informed
by a separate geometry optimisation with the ωB97XD functional. This functional contains
Grimme's empirical dispersion correction, and so should produce better inter-molecular
separations. Finally TDDFT calculations (B3LYP/6-31G(d)) are carried out on each fullerene-
oligomer complex of B3LYP-optimised oligomer and PC70BM, as well as the isolated
oligomers. The choice of a moderately sized basis set with additional polarisation functions
helps to avoid overestimation of the excited state energies through basis set of limited size,
while making calculations of this size (in number of atoms) computationally tractable.
We now investigate the excited state energy level alignment of the different systems
(Supplementary Figure 8 and Supplementary Table 3) in order to understand why long-lived
charge pair generation appears to be less efficient for SiIDT-2FBT:PC70BM blends than for
SiIDT-DTBT in spite of favourable microstructure properties (high polymer crystallinity and
intercalation of PC70BM between the polymer side chains). We aim to address two
important mechanisms with regard to charge separation and device performance: (i) the role
of ‘excess energy’ (|1CT1-S1|, Supplementary Figure 8b) inherited from exciton generation
upon light absorption and (ii) the possibility that the charge-transfer excited state
recombines into a neutral triplet excited state in one of the two materials (|T1-1CT1|).
First, we notice that in both cases the driving force for charge separation via the lowest 1CT1
states, quantified as the difference between the first singlet and the lowest CT state, 1S-
1CT1, is small (0.21 eV for SiIDT-DTBT and 0.15 eV for SiIDT-2FBT) (note that for P3HT it is

~0.9 eV)4; however this driving force is slightly higher (by ~0.06 eV) for the SiIDT-
DTBT:PC70BM system. In addition, for both model systems the triplet energy (T1) is
significantly lower (by 0.35 eV in both systems) than the lowest CT state (1CT1). Both the
small 1S-1CT1, energy and the substantial 1CT1-1T energy are detrimental as they tend to
limit charge separation and favour recombination to triplets. However, there is one feature
that differs in the two systems: for SiIDT-DTBT:PC70BM the first higher lying (‘hot’) CT-state
(namely 1CT4) is almost resonant (~0.01 eV higher) with the lowest oligomer singlet (S1),
while for SiIDT-2FBT:PC70BM the 1CT4 state lies 0.1 eV higher and is therefore less
accessible energetically from the S1. The energy alignment of the S1 and 1CT1 remains
almost unaltered when sliding the PC70BM by 2 Å away from the initial position along the
polymer chain (the 1CT1 changes by ~0.01 – 0.02 eV) for both systems. Selecting the ‘wavy’
conformer of the oligomer changes the energies of the singlet and triplet states, but it does
not change the relative energy alignments of the crucial excited states.
A first qualitative understanding of the nature of the excited states is obtained by visualising
the hole and electron natural transition orbitals (NTOs) of the vertical excitations calculated
with TD-DFT B3LYP/6-31G(d). These orbitals can provide information on the charge transfer
character and the degree of delocalisation of the excitation. In the case of SiIDT-2FBT the
electron NTO of the 1CT1 state has a noticeable contribution from the oligomer acceptor (BT)
unit (Supplementary Figure 9a). This is not the case for SiIDT-DTBT:PC70BM, where the
additional thiophenes on both sides of the BT unit reduce its electron withdrawing character,
allowing the electron to localise on the fullerene (Supplementary Figure 9b).
Importantly, the hole wavefunction of the 1CT4 state is more delocalised than in the 1CT1
state in each case, so that the average electron-hole separation is higher when the system
lies in the ‘hot’ rather than the ‘cold’ CT states. The delocalisation of the hole density along
the oligomer backbone can be expected to reduce the net Coulomb interaction and so
improve charge separation. This advantage would only apply in the SiIDT-DTBT:PC70BM
system since the hot state is not accessible from the singlet of the SiIDT-2FBT.
Supplementary Note 3. Device JV reconstruction. Charge extraction (CE) was performed
at open-circuit under different illumination intensities and at various applied bias, as
described previously,5 to measure the average excess charge carrier density (n) within the
device relative to 0 V in the dark. The device is illuminated by a ring of white LEDs, which
can achieve illumination intensities up to ~7 suns, for approximately 100 ms to allow the
device to reach steady state conditions. The LEDs are switched off (100 ns) and the device
discharged close to short-circuit over a measurement resistance of 50 Ω. The resulting

transients are acquired with a TDS 3032 Tektronix digital oscilloscope, converted to a
current using ohms law and integrated with respect to time to calculate n. This is corrected
from the capacitive charge on the electrode and recombination losses during extraction. n is
observed to increase exponentially with open-circuit such that , where and
are experimentally derived constants which describe the voltage dependence of average
charge carrier density.
Transient photovoltage (TPV) was performed at open-circuit under different illumination
intensities, as described previously,5 to measure the average charge carrier lifetime. The
device is held under continuous illumination provided by a ring of white LEDs. A small
perturbation from a Nd:YAG pulsed laser (pulse duration 1-5 ns) is used to generate a small
amount of extra charge in the device, which is forced to recombine under open-circuit
conditions. The resulting voltage transient is measured with a TDS 3032 Tektronix digital
oscilloscope and fitted with a single exponential function to obtain a carrier lifetime. This
small-perturbation carrier lifetime is observed to vary exponentially with open-circuit such
that where and are experimentally derived constants which describe
the voltage dependence of the average charge carrier lifetime. The small perturbation carrier
lifetime can be related to the total charge carrier lifetime where (
) is the
order of recombination.6
Transient photocurrent was performed at short-circuit under different illumination intensities,
as described previously. Through the method of differential charging it is also possible to
obtain the charge carrier density at open-circuit.5
The J-V curve can be described as the competition between a generation flux ( ) and
recombination current ( ) such that ( ) ( ). Assuming field independent
generation and no non-geminate recombination at short circuit, we make the approximation
. Assuming only non-geminate losses as measured by CE and TPV we calculate
( ) using:
Supplementary equation 1:
( )
where e is the electronic charge, d is the active layer thickness and , and are
experimentally derived constants defined previously. As shown in Figure 4b the resulting J-V
reconstruction is a poor match to the experimental data. For the field dependence observed
in SiIDT-2FBT/PC70BM, a field dependent geminate recombination is included in the
generation term, such that ( ) ( ), where has the form of a quadratic. In

order to convert directly between optical density measured in field dependent TAS and
current density, the generation profile was referenced relative to at 0.5 sun illumination
and scaled linearly with light intensity as previously described by Credgington et al.6
Supplementary References:
1 Schroeder, B. C. et al. Silaindacenodithiophene-based low band gap polymers - the effect of fluorine substitution on device performances and film morphologies. Adv. Funct. Mater. 22, 1663-1670 (2012).
2 Few, S., Frost, J. M., Kirkpatrick, J. & Nelson, J. Influence of chemical structure on the charge transfer state spectrum of a polymer:fullerene complex. J. Phys. Chem. C 118, 8253-8261 (2014).
3 Bronstein, H. et al. Effect of Fluorination on the properties of a donor-acceptor copolymer for use in photovoltaic cells and transistors. Chem. Mat. 25, 277-285 (2013).
4 Veldman, D., Meskers, S. C. J. & Janssen, R. A. J. The energy of charge-transfer states in electron donor-acceptor blends: insight into the energy losses in organic solar cells. Adv. Funct. Mater. 19, 1939-1948 (2009).
5 Shuttle, C. G. et al. Experimental determination of the rate law for charge carrier decay in a polythiophene: fullerene solar cell. Appl. Phys. Lett. 92, 093311 (2008).
6 Credgington, D., Jamieson, F. C., Walker, B., Thuc-Quyen, N. & Durrant, J. R. Quantification of geminate and non-geminate recombination losses within a solution-processed small-molecule bulk heterojunction solar cell. Adv. Mater. 24, 2135-2141 (2012).