ab122025027@yahoo - utcc2.utcc.ac.thutcc2.utcc.ac.th/utccijbe/_uploads/inprocess/201607/factors...1...
TRANSCRIPT
1
Factors affecting customer satisfaction and loyalty and service quality of
Chinese restaurants in Bangkok Chinatown
Huijuan Deng
Rawida Wiriyakitjar, Ph.D.
School of Business, University of the Thai Chamber of Commerce, Thailand
Abstract
Purpose - The purpose of this study is to analyze the factors affecting customer satisfaction, customer loyalty and service quality in Bangkok’s Chinatown in the building of these strong relationship.
Design/methodology/approach - This research was conducted using primary data. The questionnaire was based on dimensions of expectations and perception scales of the modified DINESER model. A total of 400 questionnaires were analyzed by the Independent Sample t-test, ANOVA, Multiple Regression, Chi-square and Paired Sample t-test.
Findings - According to the findings, there is a difference of customer’s satisfaction based on demographic characteristics, the difference between customer perception and customer expectation.Moreover, there is no different of service quality based on demographic characteristic,and service quality that have influence to customers’ satisfaction. The customer satisfaction has a positive relation on customs loyalty.
Practical implications - The restaurant managers lean more about demographic characteristics that can affect the customer satisfaction and use this information to
2
create better service performance and increase the customer satisfaction. Finally, they can be able to strengthen their customer loyalty to promote and recommendation the good reputation of the restaurant in Bangkok Chinatown.This can also guide the restaurant managers how to retain old customers and develop more potential customers.
Keywords - Bangkok Chinatown, customer satisfaction, customer loyalty, service quality,Chinese restaurant.
Paper type - Research paper
1. Introduction
The establishment of the ASEAN (Association of Southeast Asian Nations) community means that labor, capital and other factors of production of 10 ASEAN countries will be available for the free flow of trade. Integration, reducing transportation cost, goods, and capital from China will be more convenient and flow smoothly into the ASEAN countries, according to the market demand for resources. This will deepen the trade between China and other ASEAN countries.
In Thailand, more and more Chinese businessmen and Chinese students are studying abroad. This is also increasing Chinese food consumption and market demand. The Chinese food industry has become a large part of the basis for much of the overseas Chinese survival and development. Local residents also have a great enthusiasm for the mysterious Chinese food. Local residents try Chinese food out of honor and to further promote the rapid development of Chinese food. Restaurant managers bring the cultural influence of Chinese restaurants from abroad. It helps foreign customers to understand Chinese culture from multiple levels and helps Thai people feel the charm of Chinese food and culture. Chinese restaurants have had a pattern of rapid expansion in Bangkok (wiki, 2015). So, this is an interesting point to investigate and to find the main factors that influence a customer’s satisfaction in Chinese restaurants. The better the understanding of customer’s preferences and attitudes toward Chinese restaurants.
In order to maintain good and long-term customer relationships with customers to achieve a good customer base (Aaker and Jacobson,1994). Chinese restaurants need to pay more attention to their service quality and the evaluation of customers’ satisfaction to sustain their core competencies and continuously improve their service
3
quality to meet the higher satisfaction and re-patronage Chinese restaurant or willingness to recommend to others.
The objective of this study is to see if there are any customer satisfaction differences among demographic characteristics of Chinese restaurants in Bangkok Chinatown, to study the customer perception, customer expectation of service quality also to analyze the influence of demographic characteristics, service quality, analyze the influence between service quality and customer satisfaction and to analyze the influence between customer satisfaction and customer loyalty of Chinese restaurant in Bangkok Chinatown.
The research questions of this study are 1. Is there a difference in customer satisfaction among the demographic characteristics of Chinese restaurants in Bangkok’s Chinatown. 2. What are the customers’ perceptions and customers’ expectations of service quality of Chinese restaurants in Bangkok’s Chinatown? 3. How demographic characteristics influence service quality of Chinese restaurants in Bangkok’s Chinatown? 4. How do the service quality dimensions of restaurants influence customers satisfaction in Chinese restaurants in Bangkok’s Chinatown? 5.How does customer satisfaction influence customer loyalty in Chinese restaurants in Bangkok’s Chinatown? Information in this study can be useful for the improvement of restaurant service quality and increase customer satisfaction. Restaurant managers can use this information to promote and recommend the good reputation of their restaurant in Bangkok’s Chinatown, retain existing customers and develop more potential customers.
2. Literature reviews and hypotheses
2.1.Demographics and customer satisfaction
(1) Gender and customer satisfaction
Gradey and Fisk (2003) found that women were less satisfied than men when the employee display negative emotions. Men are easier to be satisfied and give less attention to cleanliness, comfort and restaurant design(Bruni, 2008).
(2) Age and customer satisfaction
4
American Customer Satisfaction Survey Index which proves that the satisfaction of older consumer is higher than young consumers(Siddiqui, 2011). Rad Nawaz Lodhi and Naureen Afzal(2013) proposed that the crucial factors that have an impact on the satisfaction level of customers are age levels.
(3) Income and customer satisfaction
Higher level income of consumers’ perceives differently from lower-income consumers(Lim, Bennett & Dagger, 2008). Kassim(2006) found that income is considered on of the most powerful factors in customer perception and satisfaction.
(4) Occupation and customer satisfaction
The different types occupation affect perception and expectations of customers when they have a meal in a restaurant (Wilson & Gilligan, 2005).
Hypothesis 1: There is a difference in a customer’s satisfaction based on demographic characteristics.
2.2 Service Quality Dimensions
In service quality literature the first model to measure service quality was presented by Gronroos(1984). Gronroos identified two service quality dimensions-The first dimension was ‘technical-quality’ (“what service” is provided) by what a customer receives as the outcome of service. The second dimension was ‘functional-quality’ of how (“the service is provided), ‘functional-quality’ concerns how service is delivered, the customers’ perception of the interaction with service providers. Service quality was categorized into “what” (i.e. Service evaluated after performance) and “how” (i.e. Service evaluated during performance) categories (Swartz and Brown, 1989).
A more recent service quality proposed a three-component model that was
5
based on the customer-employee interaction (i.e. Functional or process quality), the service environment, and the outcome (i.e. Technical quality). Rust and Oliver(1994) mainly attempted to study the elements of the service environment as components of the functional dimension based on research by Bitner(1992), Spangenberg et al.,(1996), Brady and Cronin(2001). Lehtinen and Lehtinen’s (1982) identified three service quality dimensions- interactive (where the dimension of quality originates in the interaction between the customer and the service organization), physical quality (i.e. Product or support) and corporate (image) quality.
The service quality measurement model was recognized by the academic community in 1990 by Zeithaml, L. L. Berry, and Parasuraman. These are the three academics who measured results. The SERVQUAL scale is the service quality measurement method and is the most widely used. The SERVQUA model is used to measure the service quality through the difference in the measure of customer service expectation and the perception of service when the customer service perception is more than the service expected, the customers will be satisfied with the service quality of the restaurant and vice versa. SERVQUAL of service quality is divided into five dimensions: Tangibles, Reliability, Responsiveness, Assurance, and Empathy.
Hypothesis 2: The can be a difference between a customer’s perception and customer’s expectation.
2.3 Demographics and service quality
(1) Gender and service quality
Gender differences can affect customers who purchase goods or services final decision. Different gender customers vary in the way they make a decision. Spathis et al. (2004) studied that the gender of consumers was different and perception of service quality was also different on the perception of service quality and on the importance attached to its various dimensions. Sanchez-Hernandez et al. (2010) found that there were differences between men and women in the association of service quality with customer evaluation.
(2) Age and service quality
6
The restaurant industry in today’s competitive market needs to provide a high quality food and a high service quality. Higher food value and a good repeat environment are needed to ensure the improvement of the competitive ability of the restaurant in the market. The restaurants need to do more customers sampling research in order to better meet the demands of the different age groups of customers(Morgan and Rao, 2000). The young customers food quality is not the most important attribute determining the perception of service quality(Soriano, 2002).
(3) Income and service quality
In addition to gender and age, other demographics will affect a customer’s restaurant of choice. The study found that income is also an important influencing factor of a customer choice of a restaurant. For example, the elderly will choose a cheap restaurant. Because the income level of the elderly is low. So in the choice of restaurant, the elderly will be focused on price first (Atkin et al.,1998). Suzanah (2013) identified that to customers with a lower income, convenience is one of the important factors determining their choice of food. Results showed that as the monthly income increases, weight control and familiarity did not become main factors in food selection. Compared to low-income consumers, the high-income consumers expect a higher quality of service outcomes. The high-income consumers in order to receive a higher quality of interaction from service firms are more likely to pay higher rates (Whittle, 1984). The consumers with high-income levels have a different perception of service quality than the consumers with lower income level.
(4) Occupation and service quality
In the literature, very few studies have been undertaken on service quality perceptions and occupations. Some researchers also find that consumers’ perceptions of service quality in hotels, does not vary with different occupations. That hotel consumers are mostly professional, such as Tsang and Qu(2000). In China, Nadiri,and Hussain(2005)in Cyprus. Consumers’ perceptions of service quality in hotels do not vary with occupations ( Lee and Chen, 2009).
Hypothesis 3: There is a difference of service quality based on demographic characteristics.
7
2.4 Service quality and customer satisfaction
Service quality and customer satisfaction issues are directly linked to the restaurant industry profits. A growing number of managers are paying more attention to their service quality and the evaluation of customer satisfaction. ( Gilbert and Veloutsou, 2006). To maintain a good and long-term customer relationship with customers, the organization needs to provide a high level of service to customers to achieve better results of customer satisfaction. When the company provides a high-quality service for the customer the company will have a good customer base (Aaker and Jacobson, 1994).
(1)The existence of extensive literature records of customer satisfaction and service quality.
Researchers in different industries have investigated the relationship between service quality dimensions and customer satisfaction, including the restaurant industry. (Gilbert et al.,2004).
(2)Service quality as a variable to achieve customer satisfaction of the antecedent constructs.
In the past, the marketing literature in the study found a positive relationship between service quality and customer satisfaction. (Anderson and Sullivan, 1993). Most restaurant owners want to improve customer loyalty and increase the number of customers to patronize again. This most dramatically increases the income of the restaurant. In order to achieve customer satisfaction, the premise of the five service quality dimensions needs to be studied and understood. Any one of the five service quality dimensions, on the basis of the original study, was shown to provide customers with additional increases in the value of the service quality, will be made to enhance the quality of service. Customers will receive a unique experience and satisfactory service. Researchers have been using SERVQUAL for research of restaurant industry .Knutson and Patton (1993) created an instrument called DINESERV to assess customers’ perceptions of restaurant service quality. DINESERV was adapted from SERVQUAL and proposed a reliable, easier way for assessing how customers view restaurant quality (Markovic et al.,2010). Service quality is defined as the customer’s expectation and the customers perceived view of a restaurant's service quality, the difference between customer expectation and customer perception. The original DINESERV instrument included 40 service quality items.
8
After the final modification DINESERV (Stevens et al., 1995) contained 29 items, measured on a seven-point scale. DINESERV is divided into five service quality dimensions. The researchers found that reliability is the most important service quality dimension; secondly, there are tangibles, assurance, responsiveness, and empathy. Tangibles dimension measures all the physical facilities in the restaurant, such as the parking area, the restaurant decoration, etc. Responsiveness and dimensions are used to measure whether the employees have the ability and willingness to meet the customer’s needs. Assurance that the dimension is used to measure the performance of the restaurant’s staff and solves all the problems in the restaurant. Make sure the customers of the restaurant feel safe and confident of service quality. Empathy is used to measure the restaurant staff whether they have the ability and willingness to meet the special needs of customers. Let customers feel special and enjoy a pleasant meal experience and receive personal attention. DINESERV Model is the measure of five dimensions of service. Quality to help the service organizations to understand and to measure the service quality, by using the perceptions and expectations from groups of customers. Organization, with strict control and reducing any gaps between customer expectations and perceptions of the service.
Hypothesis 4: Service quality will have an influence on customer satisfaction.
2.5 Relationship between customer satisfaction and loyalty
The customer response to food, beverage, room services and prices directly influence customer satisfaction and their decision to recommend to other customers. The relationship between customer satisfaction and customer loyalty have a positive contact (Taylor and Baker, 1994). Frédéric Bielen Nathalie Demoulin, (2007) investigate the effect of waiting time satisfaction on the relationship between customer satisfaction and customer loyalty. When the satisfaction is up to a certain level loyalty will increase greatly at the same time. When the Satisfaction dropped dramatically loyalty dropped sharply(Oliva et al.,1992). A small increase in customer satisfaction boosted customer loyalty dramatically. Customer satisfaction is an important index to judge customer loyalty. Customer satisfaction can be evaluated for the employee and the company through customer attitude (Reynolds and Arnold, 2000). A high degree of satisfied customers are more likely to repurchase the product or service and are willing to recommend to other people. (Liu and Jang, 2009).
Hypothesis 5: Customer satisfaction has a relationship to a customer’s loyalty.
9
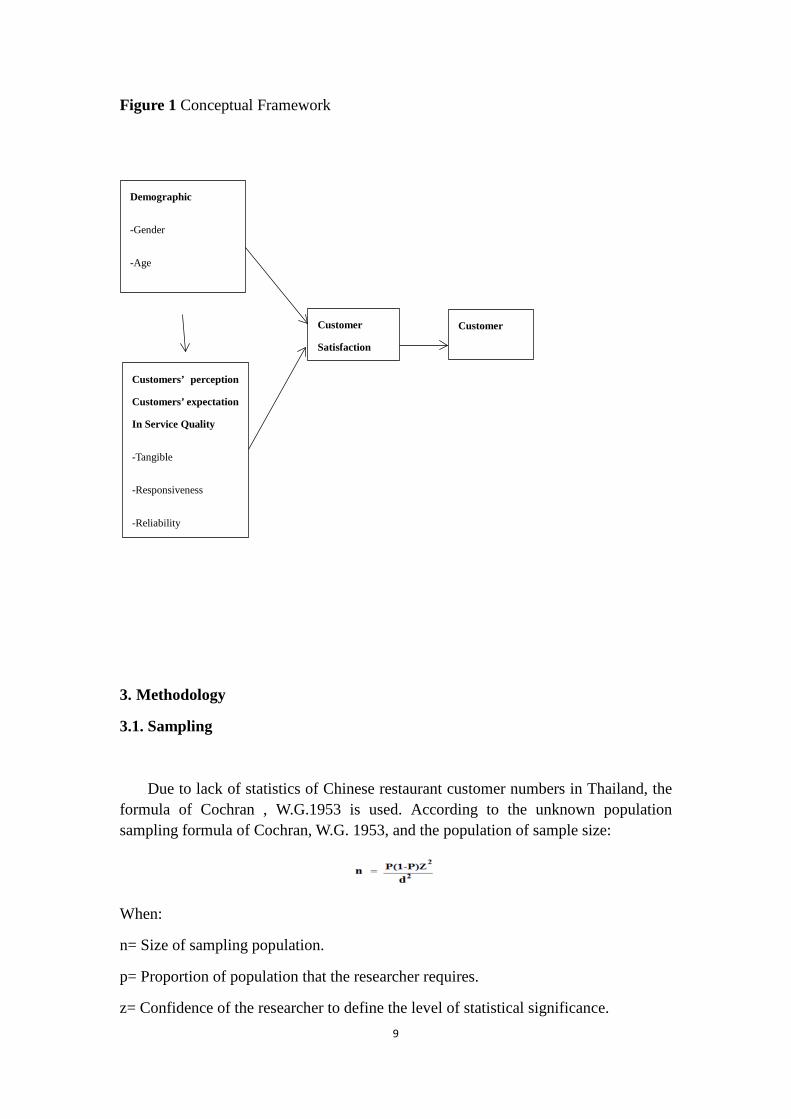
Figure 1 Conceptual Framework
3. Methodology
3.1. Sampling
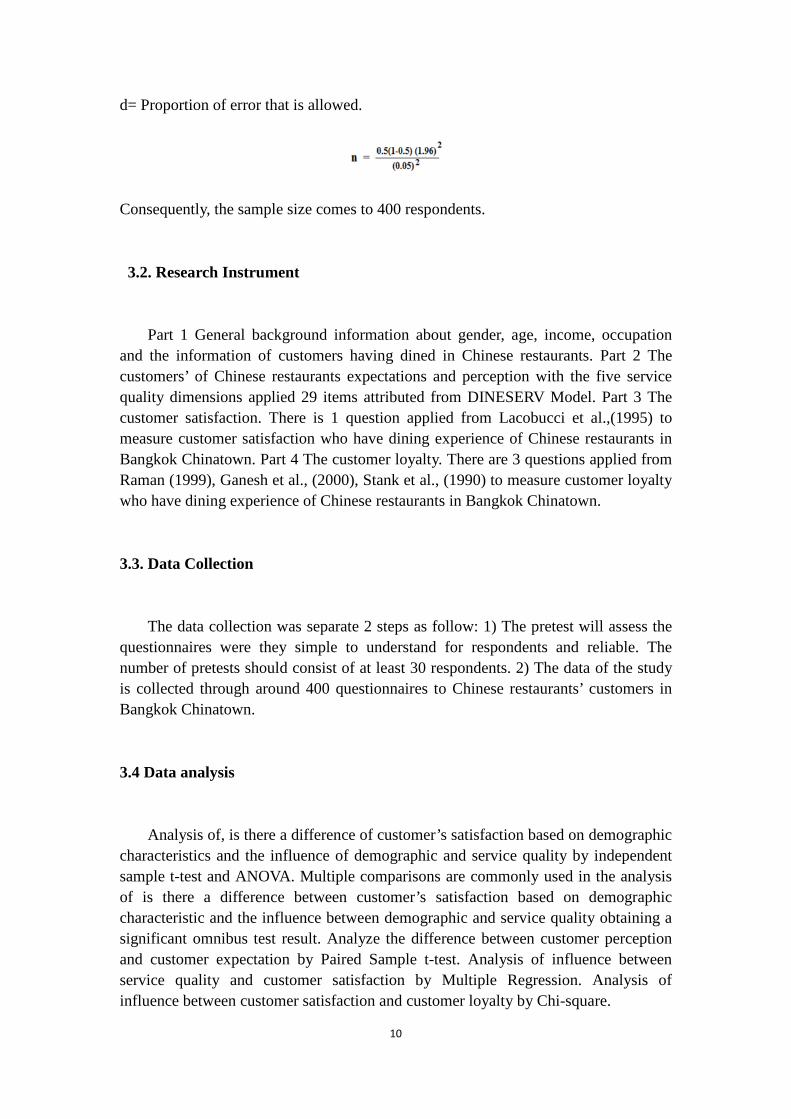
Due to lack of statistics of Chinese restaurant customer numbers in Thailand, the formula of Cochran , W.G.1953 is used. According to the unknown population sampling formula of Cochran, W.G. 1953, and the population of sample size:
When:
n= Size of sampling population.
p= Proportion of population that the researcher requires.
z= Confidence of the researcher to define the level of statistical significance.
Demographic
-Gender
-Age
Customers’ perception
Customers’ expectation
In Service Quality
-Tangible
-Responsiveness
-Reliability
Customer
Satisfaction
Customer
10
d= Proportion of error that is allowed.
Consequently, the sample size comes to 400 respondents.
3.2. Research Instrument
Part 1 General background information about gender, age, income, occupation and the information of customers having dined in Chinese restaurants. Part 2 The customers’ of Chinese restaurants expectations and perception with the five service quality dimensions applied 29 items attributed from DINESERV Model. Part 3 The customer satisfaction. There is 1 question applied from Lacobucci et al.,(1995) to measure customer satisfaction who have dining experience of Chinese restaurants in Bangkok Chinatown. Part 4 The customer loyalty. There are 3 questions applied from Raman (1999), Ganesh et al., (2000), Stank et al., (1990) to measure customer loyalty who have dining experience of Chinese restaurants in Bangkok Chinatown.
3.3. Data Collection
The data collection was separate 2 steps as follow: 1) The pretest will assess the questionnaires were they simple to understand for respondents and reliable. The number of pretests should consist of at least 30 respondents. 2) The data of the study is collected through around 400 questionnaires to Chinese restaurants’ customers in Bangkok Chinatown.
3.4 Data analysis
Analysis of, is there a difference of customer’s satisfaction based on demographic characteristics and the influence of demographic and service quality by independent sample t-test and ANOVA. Multiple comparisons are commonly used in the analysis of is there a difference between customer’s satisfaction based on demographic characteristic and the influence between demographic and service quality obtaining a significant omnibus test result. Analyze the difference between customer perception and customer expectation by Paired Sample t-test. Analysis of influence between service quality and customer satisfaction by Multiple Regression. Analysis of influence between customer satisfaction and customer loyalty by Chi-square.
11
4. Results
In the describe statistic, the result show the demographic of respondent which was male was 41.8% and female was 58.3%, the major age between 21-31 years old (36.3%), the major range of monthly income was 10,001-20,000 baht (35.5%), major occupation of respondents was company’s employee (32.0%), the most number of sample before have been to Chinese restaurant (83.0%), the most number of sample dinner (60.3%), the most number of sample on time per many month (37.0%), the most number of sample purpose for friend party (36.0%).
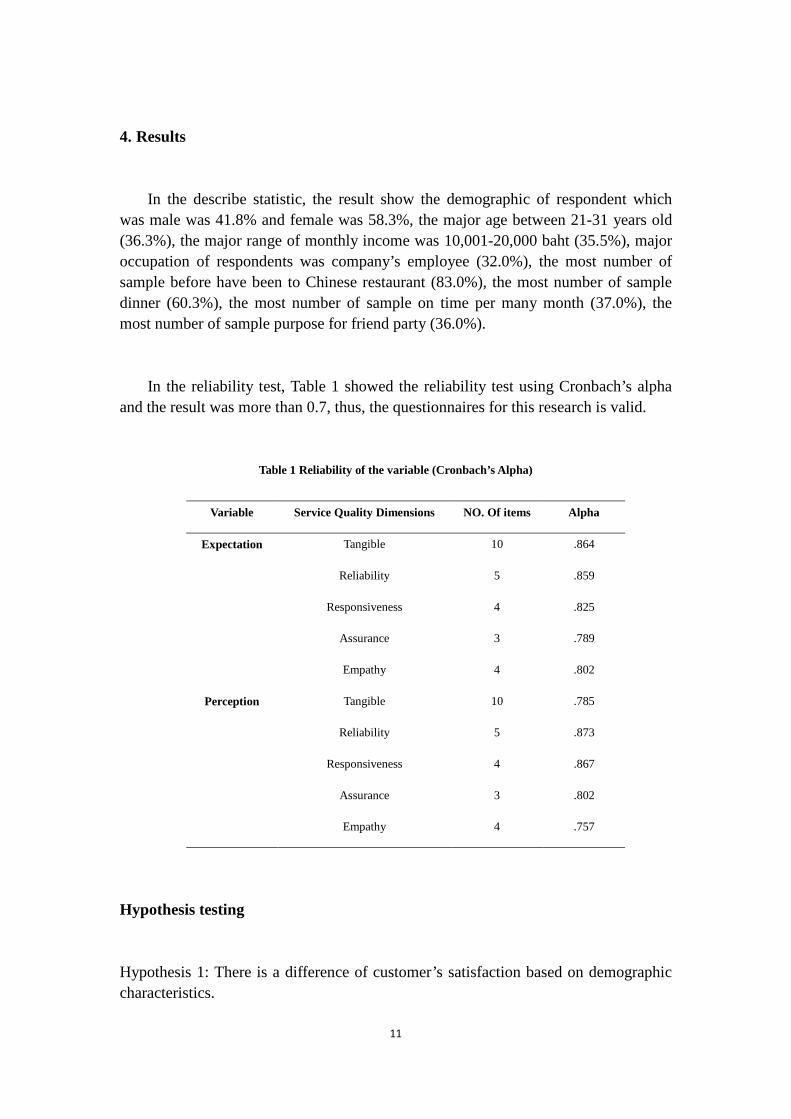
In the reliability test, Table 1 showed the reliability test using Cronbach’s alpha and the result was more than 0.7, thus, the questionnaires for this research is valid.
Table 1 Reliability of the variable (Cronbach’s Alpha)
Hypothesis testing
Hypothesis 1: There is a difference of customer’s satisfaction based on demographic characteristics.
Variable Service Quality Dimensions NO. Of items Alpha
Expectation Tangible 10 .864
Reliability 5 .859
Responsiveness 4 .825
Assurance 3 .789
Empathy 4 .802
Perception Tangible 10 .785
Reliability 5 .873
Responsiveness 4 .867
Assurance 3 .802
Empathy 4 .757
12
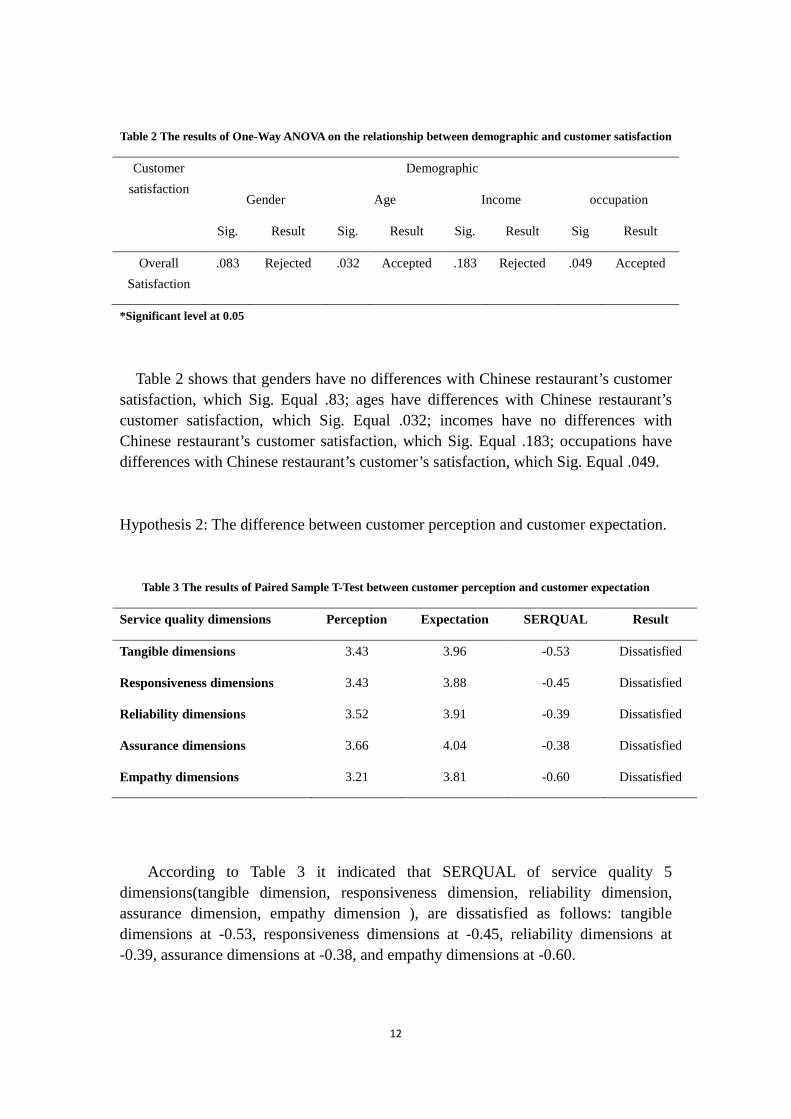
Table 2 The results of One-Way ANOVA on the relationship between demographic and customer satisfaction
Customer satisfaction
Demographic
Gender Age Income occupation
Sig. Result Sig. Result Sig. Result Sig Result
Overall Satisfaction
.083 Rejected .032 Accepted .183 Rejected .049 Accepted
*Significant level at 0.05
Table 2 shows that genders have no differences with Chinese restaurant’s customer satisfaction, which Sig. Equal .83; ages have differences with Chinese restaurant’s customer satisfaction, which Sig. Equal .032; incomes have no differences with Chinese restaurant’s customer satisfaction, which Sig. Equal .183; occupations have differences with Chinese restaurant’s customer’s satisfaction, which Sig. Equal .049.
Hypothesis 2: The difference between customer perception and customer expectation.
Table 3 The results of Paired Sample T-Test between customer perception and customer expectation
Service quality dimensions Perception Expectation SERQUAL Result
Tangible dimensions 3.43 3.96 -0.53 Dissatisfied
Responsiveness dimensions 3.43 3.88 -0.45 Dissatisfied
Reliability dimensions 3.52 3.91 -0.39 Dissatisfied
Assurance dimensions 3.66 4.04 -0.38 Dissatisfied
Empathy dimensions 3.21 3.81 -0.60 Dissatisfied
According to Table 3 it indicated that SERQUAL of service quality 5 dimensions(tangible dimension, responsiveness dimension, reliability dimension, assurance dimension, empathy dimension ), are dissatisfied as follows: tangible dimensions at -0.53, responsiveness dimensions at -0.45, reliability dimensions at -0.39, assurance dimensions at -0.38, and empathy dimensions at -0.60.
13
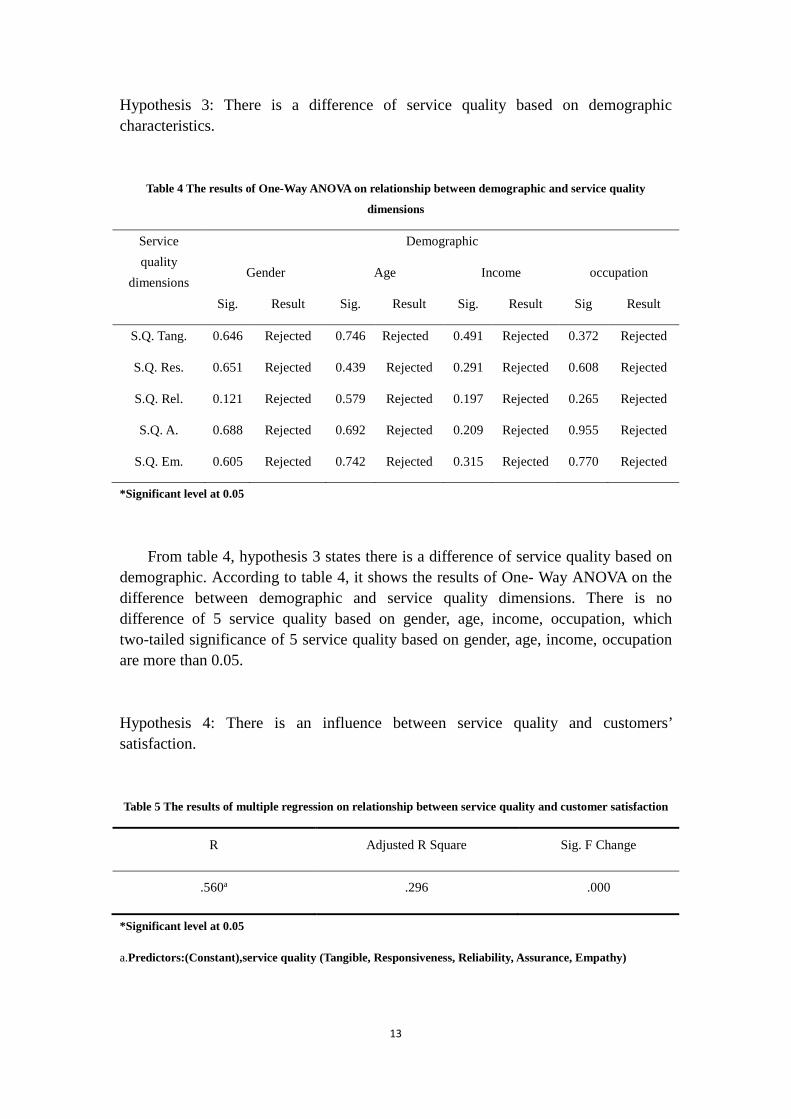
Hypothesis 3: There is a difference of service quality based on demographic characteristics.
Table 4 The results of One-Way ANOVA on relationship between demographic and service quality
dimensions
Service quality
dimensions
Demographic
Gender Age Income occupation
Sig. Result Sig. Result Sig. Result Sig Result
S.Q. Tang. 0.646 Rejected 0.746 Rejected 0.491 Rejected 0.372 Rejected
S.Q. Res. 0.651 Rejected 0.439 Rejected 0.291 Rejected 0.608 Rejected
S.Q. Rel. 0.121 Rejected 0.579 Rejected 0.197 Rejected 0.265 Rejected
S.Q. A. 0.688 Rejected 0.692 Rejected 0.209 Rejected 0.955 Rejected
S.Q. Em. 0.605 Rejected 0.742 Rejected 0.315 Rejected 0.770 Rejected
*Significant level at 0.05
From table 4, hypothesis 3 states there is a difference of service quality based on demographic. According to table 4, it shows the results of One- Way ANOVA on the difference between demographic and service quality dimensions. There is no difference of 5 service quality based on gender, age, income, occupation, which two-tailed significance of 5 service quality based on gender, age, income, occupation are more than 0.05.
Hypothesis 4: There is an influence between service quality and customers’ satisfaction.
Table 5 The results of multiple regression on relationship between service quality and customer satisfaction
R Adjusted R Square Sig. F Change
.560a .296 .000
*Significant level at 0.05
a.Predictors:(Constant),service quality (Tangible, Responsiveness, Reliability, Assurance, Empathy)
14
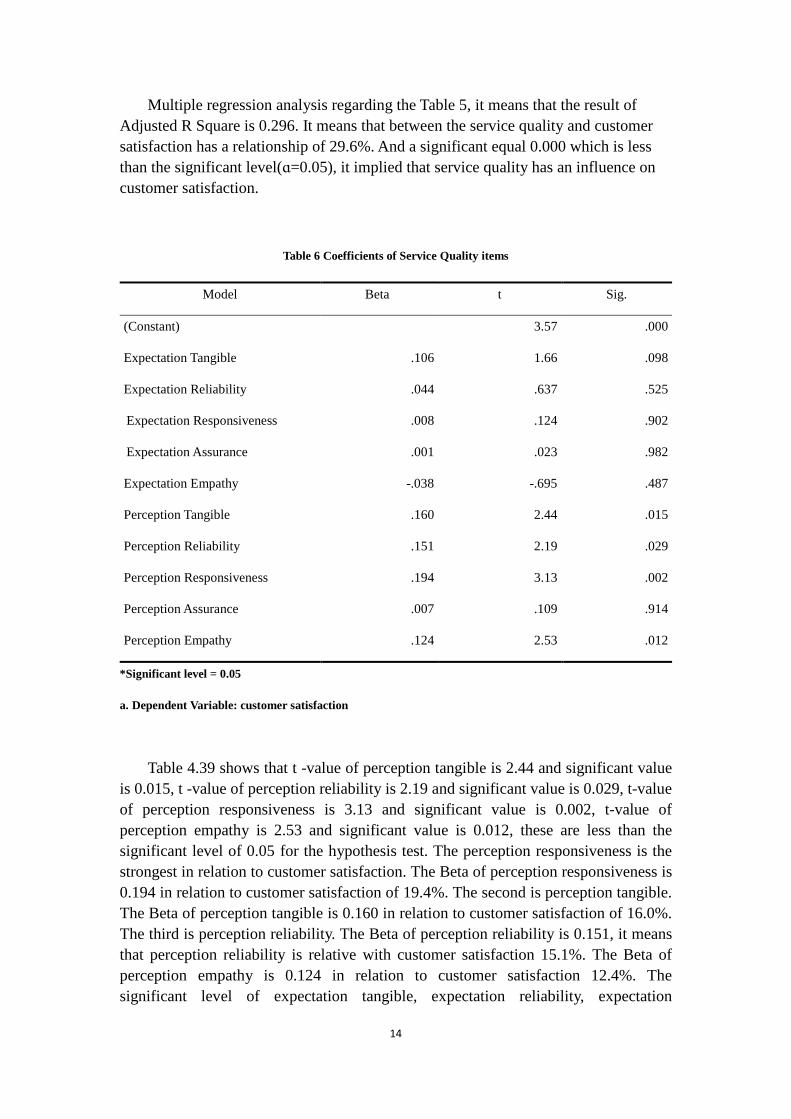
Multiple regression analysis regarding the Table 5, it means that the result of Adjusted R Square is 0.296. It means that between the service quality and customer satisfaction has a relationship of 29.6%. And a significant equal 0.000 which is less than the significant level(ɑ=0.05), it implied that service quality has an influence on customer satisfaction.
Table 6 Coefficients of Service Quality items
Model Beta t Sig.
(Constant)
Expectation Tangible
Expectation Reliability
Expectation Responsiveness
Expectation Assurance
Expectation Empathy
Perception Tangible
Perception Reliability
Perception Responsiveness
Perception Assurance
Perception Empathy
3.57 .000
.106 1.66 .098
.044 .637 .525
.008 .124 .902
.001 .023 .982
-.038 -.695 .487
.160 2.44 .015
.151 2.19 .029
.194 3.13 .002
.007 .109 .914
.124 2.53 .012
*Significant level = 0.05
a. Dependent Variable: customer satisfaction
Table 4.39 shows that t -value of perception tangible is 2.44 and significant value is 0.015, t -value of perception reliability is 2.19 and significant value is 0.029, t-value of perception responsiveness is 3.13 and significant value is 0.002, t-value of perception empathy is 2.53 and significant value is 0.012, these are less than the significant level of 0.05 for the hypothesis test. The perception responsiveness is the strongest in relation to customer satisfaction. The Beta of perception responsiveness is 0.194 in relation to customer satisfaction of 19.4%. The second is perception tangible. The Beta of perception tangible is 0.160 in relation to customer satisfaction of 16.0%. The third is perception reliability. The Beta of perception reliability is 0.151, it means that perception reliability is relative with customer satisfaction 15.1%. The Beta of perception empathy is 0.124 in relation to customer satisfaction 12.4%. The significant level of expectation tangible, expectation reliability, expectation
15
responsiveness, expectation assurance, expectation empathy and perception assurance are more than the significant level of 0.05, which means that there is no relationship with customers’ satisfaction.
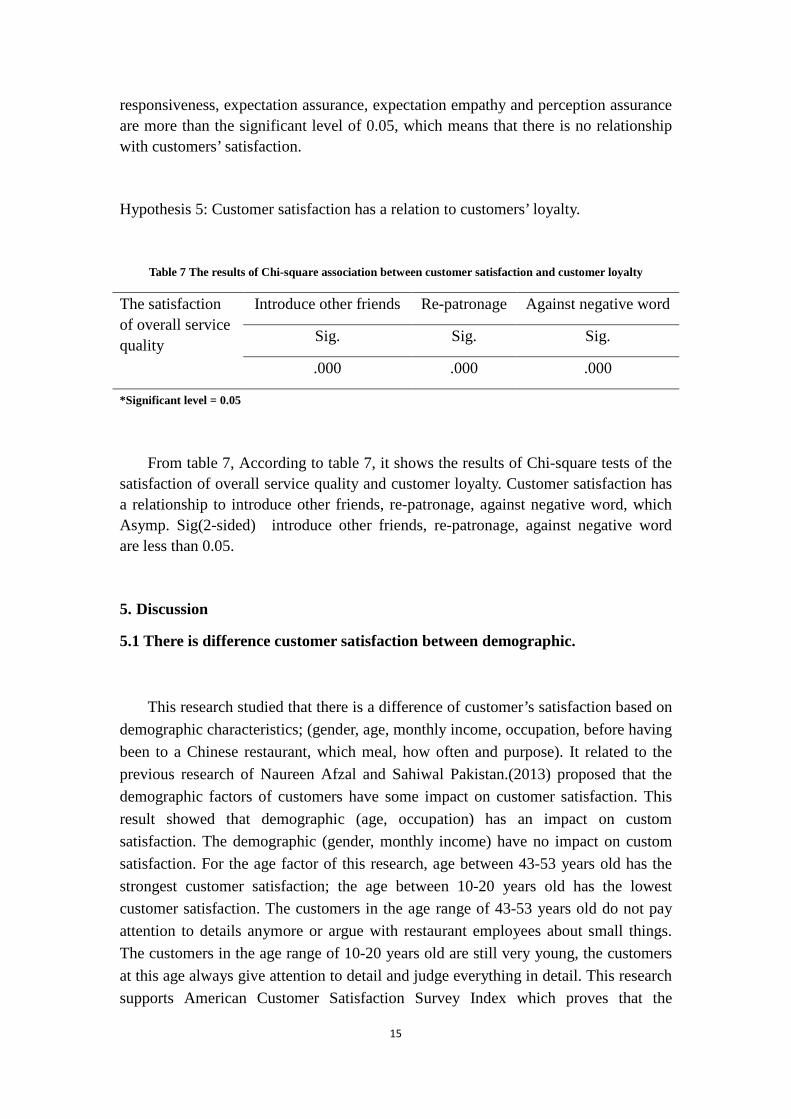
Hypothesis 5: Customer satisfaction has a relation to customers’ loyalty.
Table 7 The results of Chi-square association between customer satisfaction and customer loyalty
The satisfaction of overall service quality
Introduce other friends Re-patronage Against negative word
Sig. Sig. Sig.
.000 .000 .000
*Significant level = 0.05
From table 7, According to table 7, it shows the results of Chi-square tests of the satisfaction of overall service quality and customer loyalty. Customer satisfaction has a relationship to introduce other friends, re-patronage, against negative word, which Asymp. Sig(2-sided) introduce other friends, re-patronage, against negative word are less than 0.05.
5. Discussion
5.1 There is difference customer satisfaction between demographic.
This research studied that there is a difference of customer’s satisfaction based on demographic characteristics; (gender, age, monthly income, occupation, before having been to a Chinese restaurant, which meal, how often and purpose). It related to the previous research of Naureen Afzal and Sahiwal Pakistan.(2013) proposed that the demographic factors of customers have some impact on customer satisfaction. This result showed that demographic (age, occupation) has an impact on custom satisfaction. The demographic (gender, monthly income) have no impact on custom satisfaction. For the age factor of this research, age between 43-53 years old has the strongest customer satisfaction; the age between 10-20 years old has the lowest customer satisfaction. The customers in the age range of 43-53 years old do not pay attention to details anymore or argue with restaurant employees about small things. The customers in the age range of 10-20 years old are still very young, the customers at this age always give attention to detail and judge everything in detail. This research supports American Customer Satisfaction Survey Index which proves that the
16
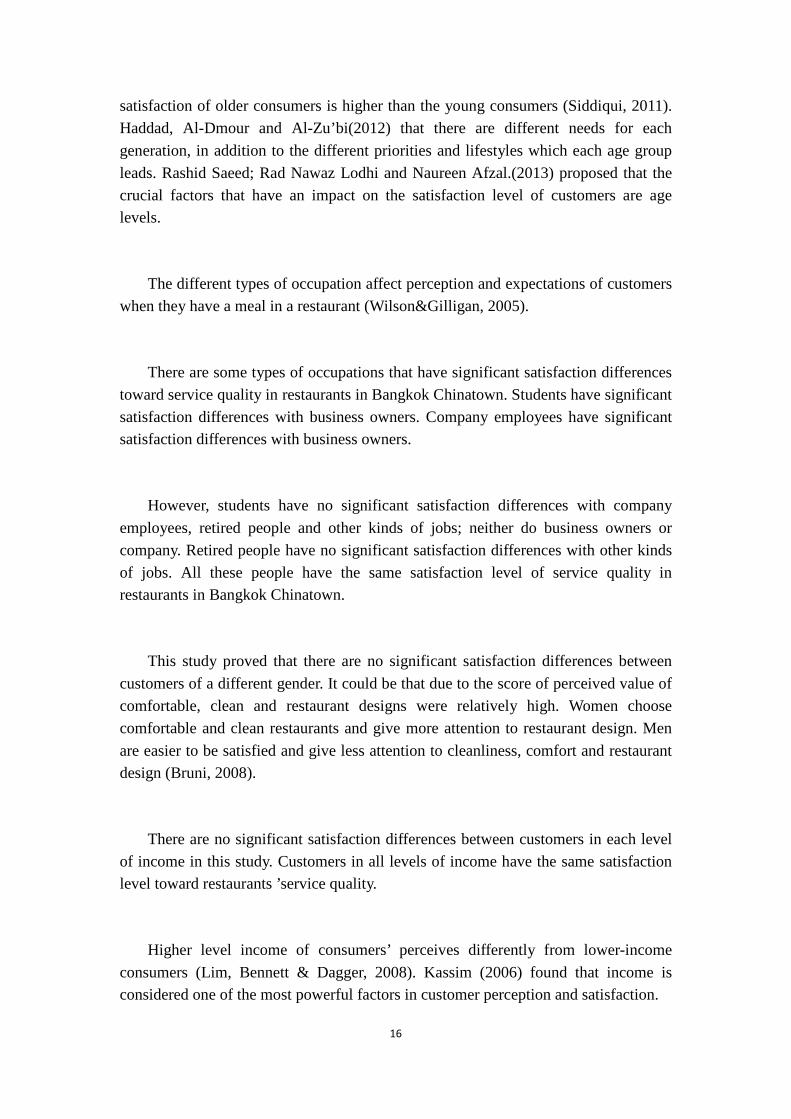
satisfaction of older consumers is higher than the young consumers (Siddiqui, 2011). Haddad, Al-Dmour and Al-Zu’bi(2012) that there are different needs for each generation, in addition to the different priorities and lifestyles which each age group leads. Rashid Saeed; Rad Nawaz Lodhi and Naureen Afzal.(2013) proposed that the crucial factors that have an impact on the satisfaction level of customers are age levels.
The different types of occupation affect perception and expectations of customers when they have a meal in a restaurant (Wilson&Gilligan, 2005).
There are some types of occupations that have significant satisfaction differences toward service quality in restaurants in Bangkok Chinatown. Students have significant satisfaction differences with business owners. Company employees have significant satisfaction differences with business owners.
However, students have no significant satisfaction differences with company employees, retired people and other kinds of jobs; neither do business owners or company. Retired people have no significant satisfaction differences with other kinds of jobs. All these people have the same satisfaction level of service quality in restaurants in Bangkok Chinatown.
This study proved that there are no significant satisfaction differences between customers of a different gender. It could be that due to the score of perceived value of comfortable, clean and restaurant designs were relatively high. Women choose comfortable and clean restaurants and give more attention to restaurant design. Men are easier to be satisfied and give less attention to cleanliness, comfort and restaurant design (Bruni, 2008).
There are no significant satisfaction differences between customers in each level of income in this study. Customers in all levels of income have the same satisfaction level toward restaurants ’service quality.
Higher level income of consumers’ perceives differently from lower-income consumers (Lim, Bennett & Dagger, 2008). Kassim (2006) found that income is considered one of the most powerful factors in customer perception and satisfaction.
17
5.2 There are differences of service quality based on demographic characteristic.
Research in service quality of restaurants is an important concern for restaurant consumers. The inflow of the guests depends on the quality of service they get from the restaurant. Service quality perceptions of restaurant consumers may be influenced by demographic characteristics. Perceptions of service in restaurants may also vary among the consumers based on the differences in nationality, gender, age, education, occupation, etc.
From the results of this, research indicated that age, occupation and income had similar results with the previous research, the discussion as follows: Siu and Mou(2005) observed that consumers’ perceptions of service quality do not vary with the age difference. Lee and Chen(2009) also found that consumers’ perception of service quality in the restaurants do not vary with the occupation. Eudora Hagan(2015) observed that staying in a restaurant does not really require a certain threshold of income. In this study, the discussion of the difference of service quality based on demographic characteristics (age, occupation, income) showed that the demographic characteristic there is no differences in service quality. This result supports the previous research.
From the results of this, research indicated that gender had dissimilar results with the previous literature, the discussion as follows: Sanchez-Hernandez et al.(2010) found differences between men and women in association with service quality with customer evaluation. Rahman and Jahan(2012)found significant differences between the ranking of male and female guests with the tangibles, reliability, responsiveness, assurance and empathy dimensions of service quality in restaurants. In this study, this finding was refused prior to the research, with gender there are no differences in service quality. This is because there are different category restaurants.
5.3 The service quality influence to customer satisfaction.
The relationship between customer satisfaction and service quality, Oliver (1993) first suggested that service quality would be antecedent to customer satisfaction regardless of whether these were cumulative or transaction-specific. Some researchers have found empirical supports for the view of
18
the point mentioned above (Anderson & Sullivan, 1993) where customer satisfaction came as a result of service quality.
The results of this research that service quality has an influence on customers’ satisfaction; this finding supports the previous research. Russt and Zahorik(1993) and Storbacka el al. (1994)found service quality to be correlated with satisfaction.
5.4 Customer satisfaction has a positive relation on customs loyalty.
From the table 4.7.5.1 to table 4.7.5.6, this research found that the relationship between customer satisfaction and customer loyalty has a positive connection. This is supported by W.G et. Al. (2006) they proposed that satisfied customers exhibit loyalty and provide positive word of mouth. Therefore, a small increase in customer satisfaction boosted customer loyalty dramatically, customer satisfaction is an important index to decide customer loyalty (Reynolds and Arnold, 2000).
6. Conclusion
This result showed that demographic (age, occupation) has impact on custom satisfaction. The demographic (gender, monthly income) have no impact on custom satisfaction. Different age have different of customer’s satisfaction, for the age factor of this research, age between 43-53 years old have strongest customer customer satisfaction, the age between 10-20 years old have lowest customer satisfaction. There are some types of occupation that have significant satisfaction differences toward service quality in restaurant in Bangkok Chinatown. Students have significant satisfaction differences with business owner. Company’s employees have significant satisfaction differences with business owner. This study found that there are differences of service quality based on demographic characteristic. From the result of this research indicated that service quality perceptions of restaurant consumers may be influenced by demographic characteristics. Perceptions of service quality in restaurant may also vary among the consumers based on the differences in age, occupation, and income. The relationship between customer satisfaction and service quality, the results that service quality have influence to customers’ satisfaction. The relationship between customer satisfaction and customer loyalty have a contact. In commercial activities, enterprise to meet customer needs and enhance customer service satisfaction, while maintaining the existing customer base and attract more potential customers.
19
7. Implication for Business
This study focused on four aspects to recommend the Chinese restaurant managers in Chinatown, Bangkok to improve the restaurant service quality, increase the customer satisfaction and attract more customers as follows:
1. Based on the demographic of consumers, The Chinese restaurant should focus on significant consumer groups of company’s employees. The consumers of the age between 21 to 31 years old care more about tangible dimension items (Johnny Sue Reynolds & Jaesun Hwang, 2005). Chinese restaurant managers should improve the environment to be comfortable and clean especially in dining the area, music, soft lighting, etc. And Chinese restaurant managers should try to improve their staff to be neatly groomed, well-trained employees.
2. Based on expectation items of customers, research suggests Chinese restaurant managers to continue improving tangible dimension items “Seating availability” and assurance dimension items “Employees make you feel welcome and are consistently courteous” and “Employees give a clear understanding of food and service.
3. Base on the perception of customers, Chinese restaurant managers should improve on empathy dimension items, “specifically for children” and “Provide vegetarian food”.
4. Based on service quality gap, the researcher suggests that the Chinese restaurant managers should focus on different service quality dimension items. Some improvements are needed to be made for responsiveness dimension items such as “provide prompt service at all times” and “during busy times, employees be available to respond promptly”. Assurance dimension items: “Employees ability to inspire customers’ trust” and Employees of Chinese restaurants have sufficient knowledge, such as food, ingredients and so on. Tangible dimension items “The Staff of Chinese restaurants in Bangkok Chinatown need to dress neatly”, interior exterior, needs to be maintained, along with decorations, parking areas, and exterior buildings ”. Reliability dimension items “Providing service as promised” and “Staff can quickly solve the problems”. And empathy dimension items “specifically for children regarding’ nutritional meals” and “Provide vegetarian food”.
20
8. Limitation of research
First, the restaurant number is limited to Bangkok’s Chinatown. The questionnaires could not be distributed to other restaurants.
Second, the questionnaire is quite substantial. Therefore, the sampling group took a long time to fill out the questionnaires. Some respondents did not have much patience or were in a hurry and didn’t show their real feelings when they filled out the questionnaires, the answers lacked credibility and the answers were not completed according to the actual situation.
9. Further Research
First, this study researches the expectation and perception of service quality in the restaurant, the future research should be studied on expectation and perception of service quality compared with other branches.
Second, this study only focused on the customers in Bangkok Chinatown and does not include the customers in other provinces, a more comprehensive study.
Third, the future research should be studied about external factors which could have a significant effect on customers’ satisfaction this should be considered. For example, culture, physical environment, tradition.
21
REFERENCES
Aaker, D.A. and Jacobson, R. (1994), “The financial information content of perceived
quality”, Journal of Marketing Research, Vol. 31 No. 2, pp. 191-201.
Anderson,E.W.and Sullivan,M.W.(1993),“The antecedent and consequence of custom
satisfaction for firms”, Marketing Science, Vol. 12 No. 2, pp.125-43.
Atkin,D.J., Jeffres,L.W.and Neuendorf, K.A.(1998),‘‘Understanding internet adoption
as telecommunications behaviour”,Broadcasting and Electronic Media, Vol.42
No.4, pp.475-90.
Bitner, M.J. (1992), “ Servicescapes: the impact of physical surroundings on customer
and employees”, Journal of Marketing, Vol. 56, pp. 57-71.
Frédéric Bielen Nathalie Demoulin,(2007),”Waiting time influence on the satisfaction
loyalty relation in service”,Managing Service Quality:An International Journal,
Vol. 17 Iss 2pp. 174-193.
Gilbert , G.R. and Veloutsou, C. ( 2006 ) , “ A cross-industry comparison of customer
satisfaction”, The Journal of Services Marketing, Vol. 20 No. 5, pp. 298-308.
Gilbert, G.R., Veloutsou, C., Goode, M.M.H. and Moutinho, L. ( 2004 ) , “Measuring
customer satisfaction in the fast food industry: a cross-national approach”, The
Journal of Services Marketing, Vol. 18 No. 5, pp. 371-83.
22
Gronroos , C., ( 1984 ) A service quality model and its market implications. European
Journal of Marketing 18 (4), 36–44.
Jaksa Jack Kivela, (1997),"Restaurant marketing: selection and segmentation in Hong
Kong",International Journal of Contemporary Hospitality Management,Vol. 9Iss
3 pp. 116 – 123.
Knutson, B. J., & Patton, M. E.(1993), “Restaurants can find Gold among Silver Hair:
Opportunities in the 55+ market”, Journal of Hospitality & Leisure1(3), 79-91.
Lee,Y.P., & Chen, C.Y. (2009),“Banking Service Quality in Vietnam: A comparison of
Customers’ and Bank Staff ’ s Perceptions”, The Journal of International Manage
Studies 4(2), 140-146.
Lehtinen,J.R.. and Lehtinen,O.(1982)“Service quality: a study of quality dimensions”,
Helsinki.Lewis,B.R.(1993)“Service Quality measurement”marketing intelligence
and planning, Vol.11 No. 4, pp. 4-12.
Liu, Y. and Jang, S.C. (2009b), “ Perceptions of Chinese restaurants in the US : what
affects customer satisfaction and behavioral intentions”, International Journal of
Hospitality Management, Vol. 28 No. 3, pp. 338-348.
Markovic,S.,Raspor,S.,Segaric,K.(2010).Do restaurant performance meet customers ’
expectations ? An assessment of restaurant service quality using a modified
DINESERV approach, Tourism and Hospitality Management, Vol. 16, No.2, pp
181-195.
Morgan,I.and Rao,J.(2000), “ How restaurant owners manage strategic risk”, Cornell
23
Hotel and Restaurant Administration Quarterly, Vol. 41 No.6, pp.64-74.
Oliva,T.A.,Oliver,R.L.and MacMillan, I.C. (1992),“A catastrophe model for develop
service satisfaction strategies'', Journal of Marketing, Vol. 56, July, pp. 83-95.
Parasuraman , A ., Zeithaml , V. and Berry , L.L. (1990) “Delivering Quality Service:
Balancing Customer Perceptions and Expectations”, The Free Press, New York.
Rashid Saeed, Rab Nawaz Lodhi and Naureen Afzal. (2013), “ Impact of Customer
Satisfaction and Demographic Factors on Customer’ s Loyalty in Bangking
Sector of Pakistan ”, Journal of Scientific Research 18(10): 1429-1435.
Reynolds, K.E. and Arnold, M.J.(2000),“Customer loyalty to the salesperson and the
store:examining relationship customers in an upscale retail context”, Journal of
Personal Selling and Sales Management, Vol. 20 No. 2, pp. 89-98.
Rust R .T . and Richard L . Oliver ( 1994 ) ” Service quality insights and managerial
implications from the frontier ”, in Roland T. Rust and Richard L. Oliver(eds) ,
Service Quality : New imensions in Theory and Practice, Thousand Oaks, CA :
Sage Publications,pp.1-9.
Sánchez-Hernández, R., Martínez-Tur, V., Peiró, J.M., & Moliner,C.(2010),” Linking
Functional and Relational Service Quality to Customer Satisfaction and Loyalty:
Differences between Men and Women”, Psychological Reports 106, 1-13.
Siudzinski, P. (2001), “Recruiting tool”, Restaurant Business, Vol.100 No.5, p.17.
Soriano, R. D. (2002), “Customers’ Expectations Factors in Restaurant”, International
Journal of Quality and Reliability Management 19(8-9), 1055-1067.
24
Spangenberg, E.R., Crowley, A.E. and Henderson, P.W. (1996), “Improving the store
environment : do olfactory cues affect evaluations and behaviors ? ”, Journal of
Marketing, Vol. 60, pp. 67-80.
Spathis, C., Petridou, E., & Glaveli, N. (2004), “Managing Service Quality in Banks:
Customers Gender Effects”, Managing Service Quality 14 (1), 90-102.
Stafford,M.R.(1996),“Demographic Discriminators of Service Quality in the Banking
Industry”, Journal of Services Marketing 10 (4), 6-22.
Stevens , P. , Knutson , B. , Patton , M . ( 1995 ) . DINESERV : a toll for measuring
service quality in restaurant, Cornell Hotel Restaurant Administration Quarterly,
Vol. 36, pp. 56- 60.
Suzanah Abdul Rahman Muhammad Muzaffar Ali Khan Khattak Najibatul Rusyda
Mansor(2013),Determinants of food choice among adults in an urban community
Nutrition & Food Science, Vol.43 Iss 5 pp. 413 - 421
Swartz, T. A . and Brown , S .W . (1989), “ Consumer and provider expectations and
experiences evaluating professional service quality”, Journal of the Academy of
Marketing Science, Vol. 17 No. 2, pp. 189-95.
Taylor , S.A. and Baker, T. L . ( 1994 ) , “ An assessment of the relationship between
service quality and customer satisfaction in the formation of consumer’ Purchase
intentions”, Journal of Retailing, Vol. 70 No. 2, pp. 163-78.
Tsang, N. & Qu, H. (2000), “Service Quality in China’s Hotel Industry: a Perspective

25
from Tourists and Hotel Manager”international journal of contemporary hospital
Management 12 (5), 316-326.
Whittle, J.W . ( 1984 ), “Marketing management: Select customers want personalized,
individual service”, American Banker, pp. 4.