a,b a,b c a,# b,d, , c a,# b,d, - scielo
TRANSCRIPT
Quim. Nova, Vol. 42, No. 9, 1038-1043, 2019http://dx.doi.org/10.21577/0100-4042.20170430
*e-mail: [email protected]#e-mail alternativo: [email protected]
DETECTION OF THE PEPTIDE P17-1 (HIV) BY SURFACE ENHANCE RAMAN SCATTERING (SERS)
Leandro B. Carneiroa,b, Marli L. Moraesc, Sidney J. L. Ribeiroa,# and Alexandre G. Brolob,d,*,
aInstituto de Quimica, Universidade Estadual Paulista, 14800-900 Araraquara – SP, BrasilbDepartment of Chemistry, University of Victoria, Victoria, British Columbia, CanadacInstituto de Ciência e Tecnologia, Universidade Federal de São Paulo, 12247-014 São José dos Campos – SP, BrasildCenter for Advanced Materials and Related Technologies, University of Victoria, Victoria, Canada
Recebido em 07/05/2019; aceito em 02/09/2019; publicado na web em 23/10/2019
A bioanalytical method for HIV detection based on surface-enhanced Raman scattering (SERS) is described. The assay targeted the peptide p17-1. This peptide sequence is present in the protein p17, a structural protein essential in the life cycle of the human immunodeficiency retrovirus (HIV). The antibody anti-p17 was immobilized in a planar gold surface using self-assembled techniques. This planar platform was used to capture the target analyte (p17-1 peptide). The peptide detection was carried out using specially designed SERS probes, consisting of gold nanoparticles coated with a Raman reporter molecule (Nile Blue A) and functionalized with anti-p17. This sandwich assay led to the successful detection of the peptide p17-1 at 40.8 ng/mL levels. The sandwich assay described here demonstrated that the SERS technique can rival more common fluorescence methods, such as ELISA, in the detection HIV-type virus.
Keywords: HIV; SERS; peptide p17-1; SERS probes; SERS Immunoassay.
INTRODUCTION
HIV (human immunodeficiency virus) attacks CD4 lymphocytes,1
severely compromising the immune system of the host.2 The first weeks following HIV infection are extremely dynamic and associated with rapid damage to generative immune cells.3 This means that most people infected with HIV are unable to fight opportunism microorganism infections. Those are infections that normally do not develop in healthy individuals, but they can be life threatening for someone with immune system compromised by HIV.4 HIV infections can develop into AIDS (acquired immune deficiency syndrome) leaving the patient highly susceptible to any other threatening infections.5
The matrix protein p17 is described as a key element in important stages of the HIV life cycle, including incorporation of the envelope into virions and particle assembly.6,7 There is a large variety of tests for HIV detection,8,9 but the most common are based on ELISA (enzyme-linked immunosorbent assay).10,11 ELISA-based assays are a workhorse analytical tool in biomedical research and widely used for medical diagnostics.12 However, surface-enhanced Raman scattering (SERS)13 has been shown to be a viable alternative to ELISA and it is gaining popularity as a bioanalytical tool, due to its advantages in terms of specificity and sensitivity.14,15
SERS-based immunoassays have been reported to detect cancer markers,16,17 Alzheimers,18 Hepatitis B,19 dengue virus,20 Zika infection21 and other pathogens,22 Gold nanoparticles are generally the platform of choice for biomedical applications of SERS,23,24 due to their good biocompatibility25 non-toxicity and optical proprieties.26 Usually, gold nanoparticles used in biomedical applications are modified with a Raman reporter and further functionalized with an antibody that targets the analyte of interest.26 These types of platforms are known as “SERS probes”,27 and they have been established as a powerful tool for lower level quantification.15 For instance, Xie et. al showed a simple and highly
selective antibody free assay for simultaneous capture and detection of glycoproteins based in SERS.28
In this work, we developed a SERS-based immunoassay for the detection of the peptide p17-1. Peptide sequences corresponding to well-defined regions of a protein have been shown to possess specific functions, such as promoting membrane fusion.29 The sequence and structure of amino acids in a peptide are crucial to identify recognition sites of antigenic proteins, such as p17.30,31 Indeed, the sequence of the peptide p17-1 (LSGGELDRWEKIRLPGG) correlates with high immunoreactivity and interact strongly with anti-p17 antibodies. The suggested approach to detect peptide p17-1 demonstrated here is promising and could be further developed for applications with real biological samples.
EXPERIMENTAL
Chemicals
Ultrapure water was used in all experiments (Banstead Nanopure water purification system, 18.2 Ω-cm resistivity). The other chemicals used were 11-mercaptoundenoic acid (MUA, ≥99% from Sigma Adrich), gold (III) chloride trihydrate (HAuCl4.3H2O, ≥99,9% from Sigma Aldrich), sodium citrate dehydrate (≥99% from FG), Nile Blue A perchorate (NBA, 95% from Sigma Aldrich), Ethyl dimethylaminopropylcarbodiimide and sulfo-N-hydroxysuccinimide (EDC and sulfo-NHS both from ProteoChem, USA), HS-PEG-COOH (Molecular Weight=3000 Da from Rapp Polymere Tuebingen, Germany), antibody monoclonal IgG HIV p17 (Molecular Weight 17 KDa from Santa Cruz Biotechonology, USA), peptide p17-1 (sequence LSGGELDRWEKIRLPGG, ≥98%, from RS Synthesis, USA), and bovine serum albumin (BSA, ≥96%, from Sigma Aldrich).
Preparation of Gold Nanoparticles (AuNPs)
Gold nanoparticles were synthesized by Au (III) reduction with sodium citrate as described by the protocol developed by Turkevich.32 340 µL of 10.1 mmol L-1 chloroauric acid (HAuCl4) aqueous solution
DETECTION OF THE PEPTIDE P17-1 (HIV) BY SURFACE ENHANCE RAMAN SCATTERING (SERS)
Leandro B. Carneiroa,b, Marli L. Moraesc, Sidney J. L. Ribeiroa,# and Alexandre G. Brolob,d,*,
aInstituto de Quimica, Universidade Estadual Paulista, 14800-900 Araraquara – SP, BrasilbDepartment of Chemistry, University of Victoria, Victoria, British Columbia, CanadacInstituto de Ciência e Tecnologia, Universidade Federal de São Paulo, 12247-014 São José dos Campos – SP, BrasildCenter for Advanced Materials and Related Technologies, University of Victoria, Victoria, CanadaAr
tigo
Detection of the peptide p17-1 (HIV) by Surface Enhance Raman Scattering (SERS) 1039Vol. 42, No. 9
was diluted, stirred and heated up 100 ºC. Subsequently, 5 mL of citrate solution (1%) was added quickly under heating, following by stirring for another 1 h.
Surface Modification of Au Films
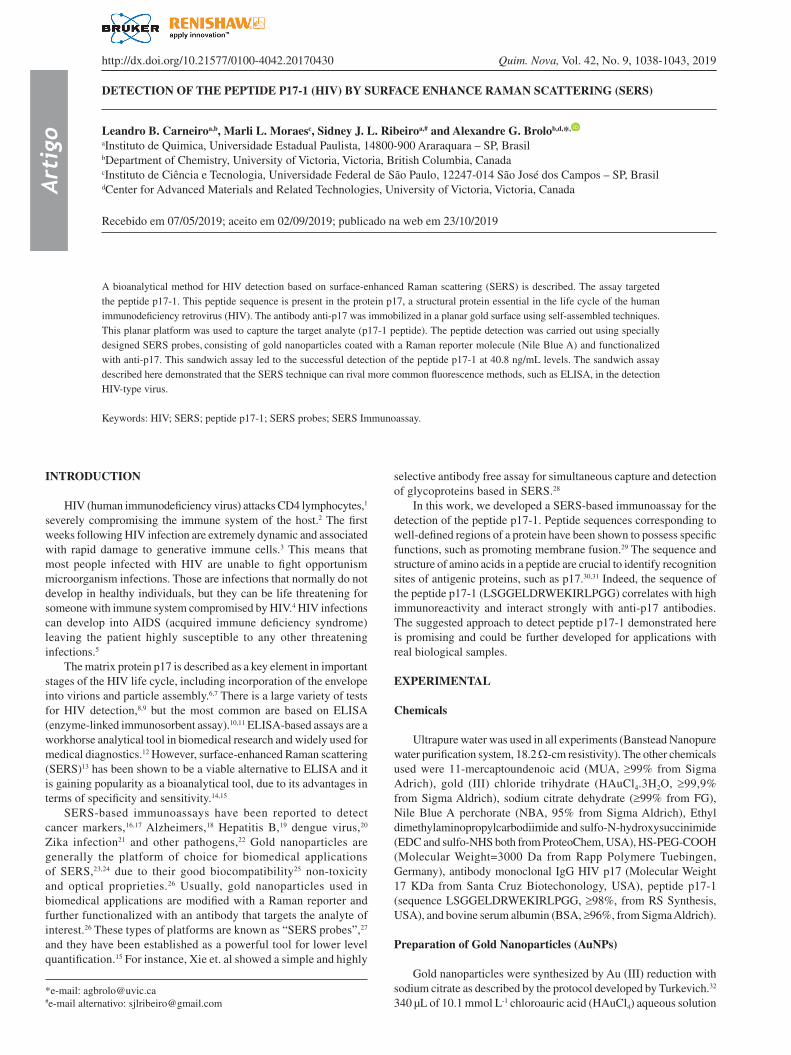
A schematic for the surface modification of a planar Au film is presented in Figure 1. Au-coated slides (100 nm thick Au deposited on a 5 nm Cr adhesion layer, Figure 1A) were immersed into 10 mmol L-1 ethanolic solutions of MUA for 24 hours, followed by thoroughly rinsing with ethanol and drying with ultrapure nitrogen (Figure 1B). The -COOH functional group at the modified Au slide surfaces were activated by EDC/sulfo-NHS, as shown in Figure 1C. 40 µL of 20 mg mL-1 solution of EDC was quickly added to the surface, followed by 40 µL of 55 mg mL-1 solution of sulfo-NHS. The mixture was left incubating for 2 hours.
After EDC/sulfo-NHS activation, the modified Au slides were immersed in a solution containing 100 µL of anti-p17 (100 µg mL-1, Figure 1D) in PBS for 6 hours, then rinsed thoroughly and dried. The resulting structure presented in Figure 1D will be referred throughout the text as the “capture platform’’.
Preparation of SERS probes
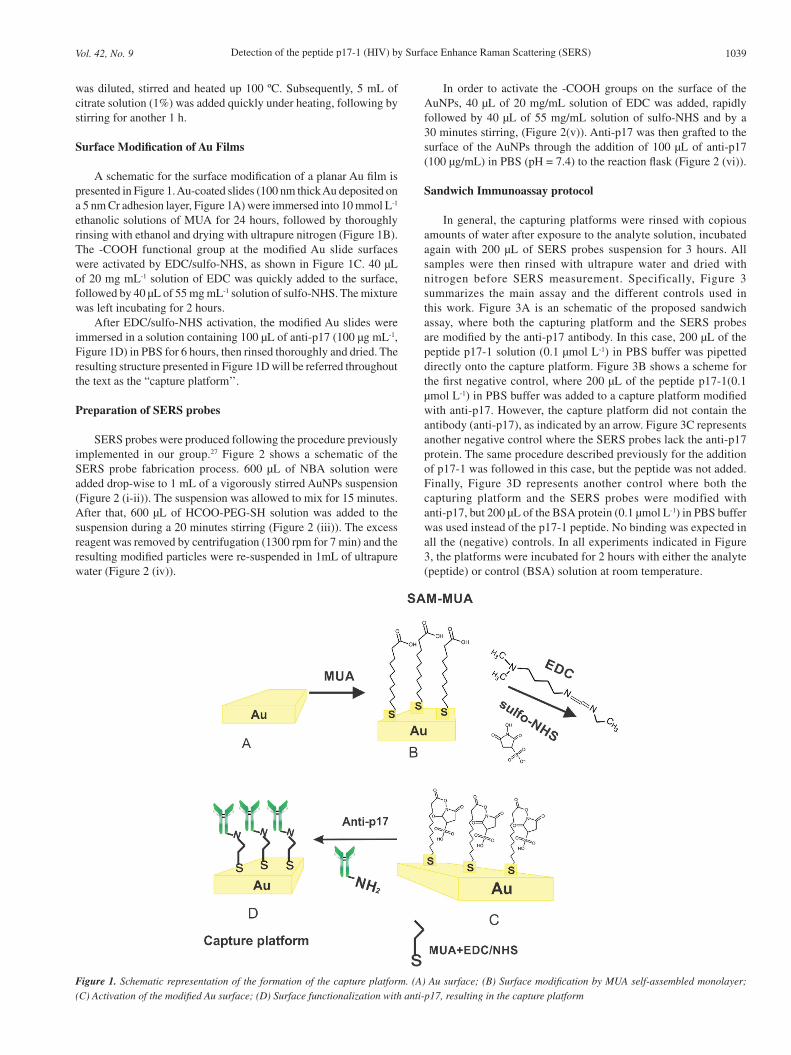
SERS probes were produced following the procedure previously implemented in our group.27 Figure 2 shows a schematic of the SERS probe fabrication process. 600 µL of NBA solution were added drop-wise to 1 mL of a vigorously stirred AuNPs suspension (Figure 2 (i-ii)). The suspension was allowed to mix for 15 minutes. After that, 600 µL of HCOO-PEG-SH solution was added to the suspension during a 20 minutes stirring (Figure 2 (iii)). The excess reagent was removed by centrifugation (1300 rpm for 7 min) and the resulting modified particles were re-suspended in 1mL of ultrapure water (Figure 2 (iv)).
In order to activate the -COOH groups on the surface of the AuNPs, 40 µL of 20 mg/mL solution of EDC was added, rapidly followed by 40 µL of 55 mg/mL solution of sulfo-NHS and by a 30 minutes stirring, (Figure 2(v)). Anti-p17 was then grafted to the surface of the AuNPs through the addition of 100 µL of anti-p17 (100 µg/mL) in PBS (pH = 7.4) to the reaction flask (Figure 2 (vi)).
Sandwich Immunoassay protocol
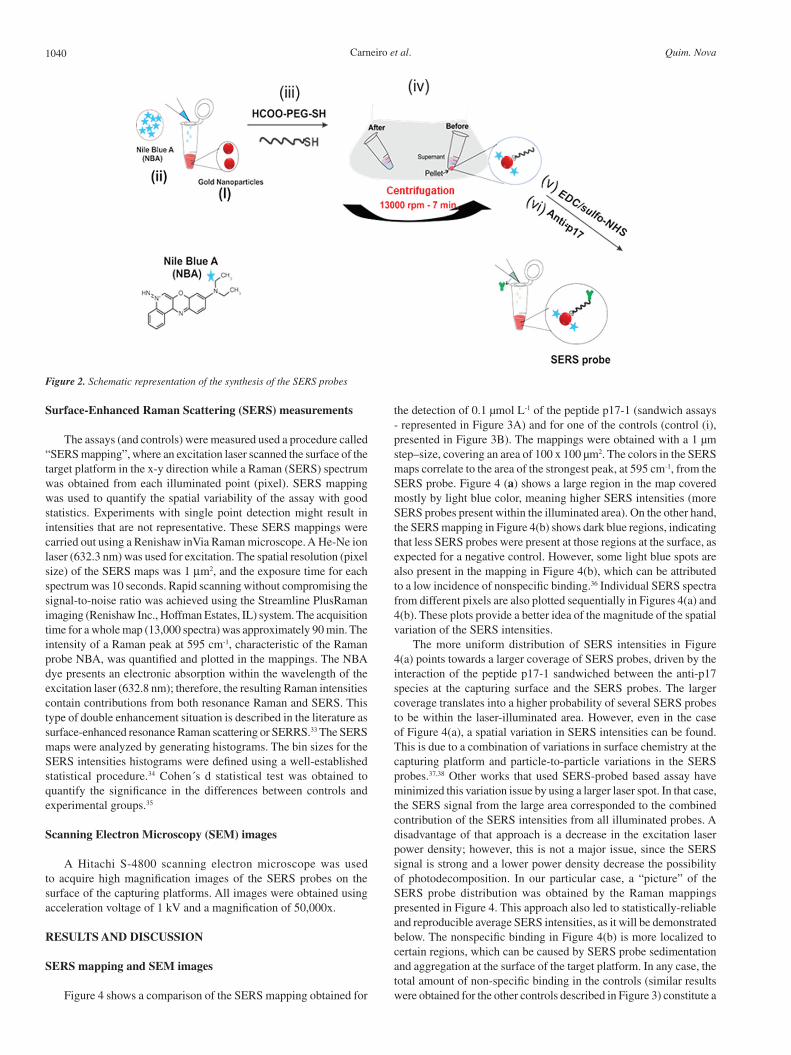
In general, the capturing platforms were rinsed with copious amounts of water after exposure to the analyte solution, incubated again with 200 µL of SERS probes suspension for 3 hours. All samples were then rinsed with ultrapure water and dried with nitrogen before SERS measurement. Specifically, Figure 3 summarizes the main assay and the different controls used in this work. Figure 3A is an schematic of the proposed sandwich assay, where both the capturing platform and the SERS probes are modified by the anti-p17 antibody. In this case, 200 µL of the peptide p17-1 solution (0.1 µmol L-1) in PBS buffer was pipetted directly onto the capture platform. Figure 3B shows a scheme for the first negative control, where 200 µL of the peptide p17-1(0.1 µmol L-1) in PBS buffer was added to a capture platform modified with anti-p17. However, the capture platform did not contain the antibody (anti-p17), as indicated by an arrow. Figure 3C represents another negative control where the SERS probes lack the anti-p17 protein. The same procedure described previously for the addition of p17-1 was followed in this case, but the peptide was not added. Finally, Figure 3D represents another control where both the capturing platform and the SERS probes were modified with anti-p17, but 200 µL of the BSA protein (0.1 µmol L-1) in PBS buffer was used instead of the p17-1 peptide. No binding was expected in all the (negative) controls. In all experiments indicated in Figure 3, the platforms were incubated for 2 hours with either the analyte (peptide) or control (BSA) solution at room temperature.
Figure 1. Schematic representation of the formation of the capture platform. (A) Au surface; (B) Surface modification by MUA self-assembled monolayer; (C) Activation of the modified Au surface; (D) Surface functionalization with anti-p17, resulting in the capture platform
Carneiro et al.1040 Quim. Nova
Surface-Enhanced Raman Scattering (SERS) measurements
The assays (and controls) were measured used a procedure called “SERS mapping”, where an excitation laser scanned the surface of the target platform in the x-y direction while a Raman (SERS) spectrum was obtained from each illuminated point (pixel). SERS mapping was used to quantify the spatial variability of the assay with good statistics. Experiments with single point detection might result in intensities that are not representative. These SERS mappings were carried out using a Renishaw inVia Raman microscope. A He-Ne ion laser (632.3 nm) was used for excitation. The spatial resolution (pixel size) of the SERS maps was 1 µm2, and the exposure time for each spectrum was 10 seconds. Rapid scanning without compromising the signal-to-noise ratio was achieved using the Streamline PlusRaman imaging (Renishaw Inc., Hoffman Estates, IL) system. The acquisition time for a whole map (13,000 spectra) was approximately 90 min. The intensity of a Raman peak at 595 cm-1, characteristic of the Raman probe NBA, was quantified and plotted in the mappings. The NBA dye presents an electronic absorption within the wavelength of the excitation laser (632.8 nm); therefore, the resulting Raman intensities contain contributions from both resonance Raman and SERS. This type of double enhancement situation is described in the literature as surface-enhanced resonance Raman scattering or SERRS.33 The SERS maps were analyzed by generating histograms. The bin sizes for the SERS intensities histograms were defined using a well-established statistical procedure. 34 Cohen´s d statistical test was obtained to quantify the significance in the differences between controls and experimental groups.35
Scanning Electron Microscopy (SEM) images
A Hitachi S-4800 scanning electron microscope was used to acquire high magnification images of the SERS probes on the surface of the capturing platforms. All images were obtained using acceleration voltage of 1 kV and a magnification of 50,000x.
RESULTS AND DISCUSSION
SERS mapping and SEM images
Figure 4 shows a comparison of the SERS mapping obtained for
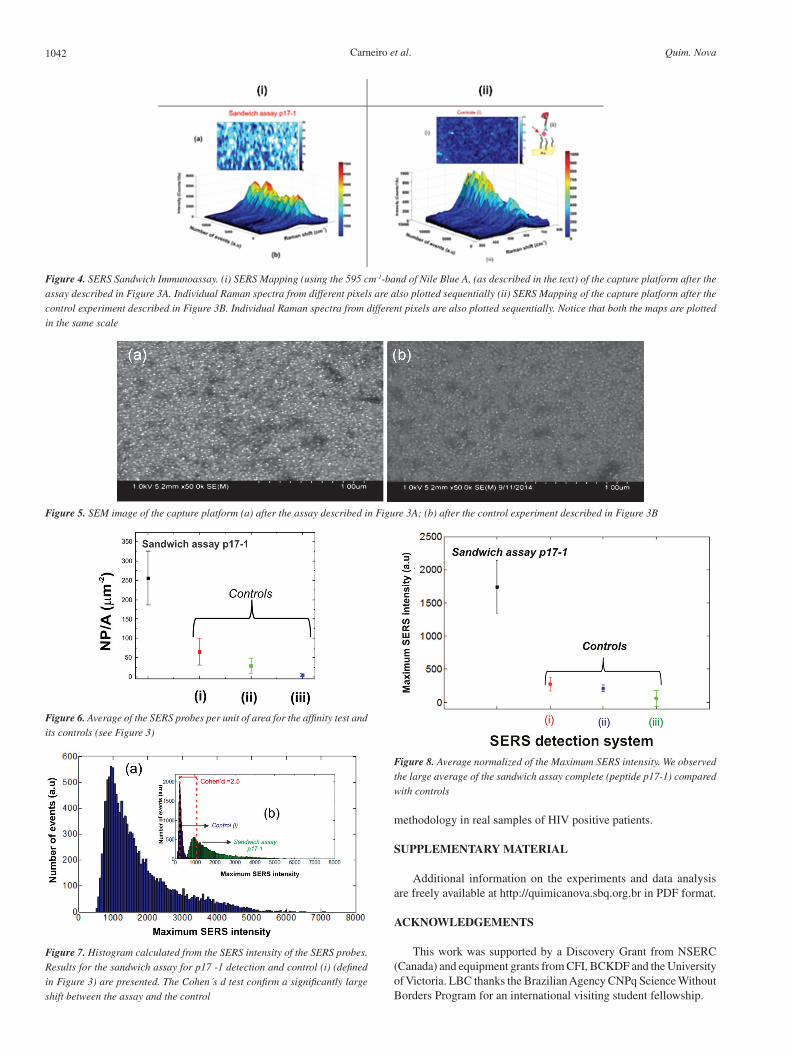
the detection of 0.1 µmol L-1 of the peptide p17-1 (sandwich assays - represented in Figure 3A) and for one of the controls (control (i), presented in Figure 3B). The mappings were obtained with a 1 µm step–size, covering an area of 100 x 100 µm2. The colors in the SERS maps correlate to the area of the strongest peak, at 595 cm-1, from the SERS probe. Figure 4 (a) shows a large region in the map covered mostly by light blue color, meaning higher SERS intensities (more SERS probes present within the illuminated area). On the other hand, the SERS mapping in Figure 4(b) shows dark blue regions, indicating that less SERS probes were present at those regions at the surface, as expected for a negative control. However, some light blue spots are also present in the mapping in Figure 4(b), which can be attributed to a low incidence of nonspecific binding.36 Individual SERS spectra from different pixels are also plotted sequentially in Figures 4(a) and 4(b). These plots provide a better idea of the magnitude of the spatial variation of the SERS intensities.
The more uniform distribution of SERS intensities in Figure 4(a) points towards a larger coverage of SERS probes, driven by the interaction of the peptide p17-1 sandwiched between the anti-p17 species at the capturing surface and the SERS probes. The larger coverage translates into a higher probability of several SERS probes to be within the laser-illuminated area. However, even in the case of Figure 4(a), a spatial variation in SERS intensities can be found. This is due to a combination of variations in surface chemistry at the capturing platform and particle-to-particle variations in the SERS probes.37,38 Other works that used SERS-probed based assay have minimized this variation issue by using a larger laser spot. In that case, the SERS signal from the large area corresponded to the combined contribution of the SERS intensities from all illuminated probes. A disadvantage of that approach is a decrease in the excitation laser power density; however, this is not a major issue, since the SERS signal is strong and a lower power density decrease the possibility of photodecomposition. In our particular case, a “picture” of the SERS probe distribution was obtained by the Raman mappings presented in Figure 4. This approach also led to statistically-reliable and reproducible average SERS intensities, as it will be demonstrated below. The nonspecific binding in Figure 4(b) is more localized to certain regions, which can be caused by SERS probe sedimentation and aggregation at the surface of the target platform. In any case, the total amount of non-specific binding in the controls (similar results were obtained for the other controls described in Figure 3) constitute a
Figure 2. Schematic representation of the synthesis of the SERS probes
Detection of the peptide p17-1 (HIV) by Surface Enhance Raman Scattering (SERS) 1041Vol. 42, No. 9
background that will ultimately limit the minimum detectable amount of the p17-1 in this assay configuration.
The SERS mapping results in Figure 4 were confirmed by SEM images presented in Figure 5. Notice that Figure 5(a) presents a relative uniform distribution of SERS probes at the surface, which agrees with the relative small variation in SERS intensities observed in Figure 4(a). On the other hand, the surface of the control experiment (Figure 5(b) shows a sparse distribution of SERS probes (the SERS map results for the other controls are shown as Supporting Information).
Figure 6 shows the average coverage of SERS probes for the p17-1 assay and the controls (described in Figure 3). The SERS probe coverages were obtained by counting their number in 15 SEM images and normalizing by the total area (NPs µm-2). Figure 6 clearly demonstrates that the controls consistently presented a lower SERS probe coverage than the assay for the detection of 40.8 ng/mL of the p17-1 peptide. This is in accordance to the SERS mapping shown in Figure 4.
Statistical distribution of SERS intensities
An advantage of using the SERS mapping approach is that further statistical information of the spatial distribution of SERS probes adsorbed on the surface can also be obtained. Figure 7 shows histograms for the distribution of the SERS intensities (13,000 spectra in one sandwich assay) for both the assay for the detection of p17-1 (Figure 3A) and for the controls described in Figure 3B. The histogram in Figure 7a reflects a log-normal distribution skewed to larger values of intensities from a relative small number of events (each “event” correspond to a ~ 1 µm2 pixel region probed by the laser). This is consistent with the generation of highly effective SERS regions in the surface of the capture probe. Those rare regions of strong Raman response are common in SERS and correspond to the presence of highly effective hotspots. The control (i) (inset Figure 7b) also shows a good number of positive events (SERS signal characteristic of the probe molecule); however, the intensities were much lower than in Figure 7a. This correlates to a smaller number of adsorbed SERS probes within the illuminated area (as discussed in Figures 5 and 6).
Cohen’s d test, a statistical significance test between two groups based on the average and standard deviation,39 was carried out. (See Supporting information, Statistic data). Cohen’s d test confirmed a statically significant shift between the sandwich assay (for the detection of p17-1) and the control (i) (defined in Figure 3). The Cohen’s d-value of 2.5 was calculated from the results in Figure 7(b). Similar results were obtained for all other controls (ii, and iii) indicated in Figure 3.
Figure 8 summarizes the average SERS intensities obtained from each of the histograms (including the assay and one of the negative controls). Each average was determined from approximately 13600 spectra in the mapping of the area of the SERS peak of the NBA probe at 595 cm-1. The assay is easily discriminated from the controls, indicating successful detection of the peptide p17-1. The negative controls presented a similar background, assigned to non-specific binding, as discussed before.
CONCLUSIONS
In summary, the SERS mapping approach was used to detect peptide p17-1 through a sandwich assay. The successful determination of p17-1 reported here is a promising avenue for HIV diagnostic. The protein p17 is detected in the plasma of HIV in people infected at lower levels as described in literature.40,41 The non-specific binding led to a background SERS that increased the limit of detection. This might be mitigated by improving the surface chemistry to minimize non-specific interactions. Although the limit of detection of standard ELISA is lower (~10 pg/mL), the SERS method provides advantages in terms of analysis time. The levels of p17-1 detected here (40.8 ng mL-1) was chosen to be compatible with clinical amounts. Although these levels are at the high end, the SERS method has still a lot of room for improvements.
It is hoped that this proof of concept will attract the attention of clinicians and spark further developments towards the testing of this
Figure 3. Schematic representation of the sandwich immunoassay and the controls used in this work. (A) Sandwich-assay detection of peptide p17-1; (B) control (i): SERS probes lack anti-p17; (C) control (ii): capture platform does not carry anti-p17; and (D) control (iii): BSA (0.1 µmol L-1) is used instead of p17-1 peptide
Carneiro et al.1042 Quim. Nova
Figure 4. SERS Sandwich Immunoassay. (i) SERS Mapping (using the 595 cm-1-band of Nile Blue A, (as described in the text) of the capture platform after the assay described in Figure 3A. Individual Raman spectra from different pixels are also plotted sequentially (ii) SERS Mapping of the capture platform after the control experiment described in Figure 3B. Individual Raman spectra from different pixels are also plotted sequentially. Notice that both the maps are plotted in the same scale
Figure 5. SEM image of the capture platform (a) after the assay described in Figure 3A; (b) after the control experiment described in Figure 3B
Figure 6. Average of the SERS probes per unit of area for the affinity test and its controls (see Figure 3)
Figure 7. Histogram calculated from the SERS intensity of the SERS probes. Results for the sandwich assay for p17 -1 detection and control (i) (defined in Figure 3) are presented. The Cohen´s d test confirm a significantly large shift between the assay and the control
Figure 8. Average normalized of the Maximum SERS intensity. We observed the large average of the sandwich assay complete (peptide p17-1) compared with controls
methodology in real samples of HIV positive patients.
SUPPLEMENTARY MATERIAL
Additional information on the experiments and data analysis are freely available at http://quimicanova.sbq.org.br in PDF format.
ACKNOWLEDGEMENTS
This work was supported by a Discovery Grant from NSERC (Canada) and equipment grants from CFI, BCKDF and the University of Victoria. LBC thanks the Brazilian Agency CNPq Science Without Borders Program for an international visiting student fellowship.

Detection of the peptide p17-1 (HIV) by Surface Enhance Raman Scattering (SERS) 1043Vol. 42, No. 9
REFERENCES
1. http://www.phac-aspc.gc.ca/aids-sida/info/index-eng.php, accessed in October 2019.
2. Cloyd, M. W.; Chen, J. J. Y.; Adeqboyega, P.; Wang, L.; Curr. Mol. Med. 2001, 1, 545.
3. McMichael, A. J.; Borrow, P.; Tomaras, G. D.; Goonetilleke, N.; Haynes, B. F.; Nat. Rev Immunol. 2010, 10, 11.
4. www.health.ny.gov, accessed in October 2019. 5. Barre-Sioussi, F.; Ross, A. L.; Delfraissy, J. F.; Nat. Microbiol. 2013, 11,
877. 6. Fiorentini, S.; Marini, E.; Caracciolo, S.; Caruso, A.; New Microbiol.
2011, 29, 1. 7. Bugatti, A.; Giagulli, C.; Urbinatti, C.; Caccuri, F.; Chiodeli, P.; Oreste,
P.; Fiorentini, S.; Orro, A.; Milanesi, L.; D’ursi, P.; Caruso, A.; Rusnati, M.; J. Biol. Chem. 2013, 288, 1150.
8. Jangam, R. S.; Agarwal, A. K.; Sur, K.; Kelso, D. M.; Biosens. Bioelectron. 2013, 42, 69.
9. Nabatiyan, A.; Baumann, M. A.; Parpia, Z.; Kelso, D. M.; J. Acquired Immune Defic. Syndr. 2010, 53, 55.
10. Rohrman, B. A.; Leautaud, V.; Molyneux, E.; Richards-Kortum, R. R.; PlosOne 2012, 9, 1.
11. Engavall, E.; Clin. Chem. 2009, 56, 319. 12. Howes, P. D.; Rana, S.; Stevens, M. M.; Chem.Soc. Rev. 2014, 43, 3835. 13. Fan, M.; Wang, P.; Escobedo, C.; Sinton, D.; Brolo, A. G.; Lab on a
Chip 2012, 12, 1554. 14. Zengin, A.; Tamer, U.; Caykara, T.; Biomacrolecules 2013, 14, 3001. 15. Schkuler, S.; Angew. Chem., Int. Ed. 2014, 53, 4756. 16. Banaei, N.; Foley, A.; Houghton, J.; Sun, Y.; Kim, B.; Nanotecnology
2017, 28, 1. 17. Roy S., Jaiswal A. In Next Generation Point-of-care Biomedical Sensors
Technologies for Cancer Diagnosis; Chandra P., Tan Y., Singh S., eds.; Springer: Singapore, 2017, pp. 173-204.
18. Zhang K.; Liu.Y.; Wang, Y.; Zhang, R.; Liu.; J.; Wei, J.; Qian, H.; Baohong, L.; ACS Appl. Mater. Interfaces 2018, 10, 15388.
19. Zengin, A.; Tamer, U.; Caykara, T.; J. Raman Spectrosc. 2017, 48, 668. 20. Purrà,S. M.; Camps, C. M.; de Puig H.; Bosch I.; Gehrke L.; Hamad-
Schifferli K.; ACS Infect. Dis. 2017, 3, 767. 21. Camacho, S. A.; Sobral-Filho, R. G.; Aoki, P. H. B.; Constantino, C. J.
L.; Brolo, A.G.; ACS Sensors 2018, 3, 587. 22. Granger, J. H.; Schlotter, N. E.; Crawford, A. C.; Porter, M. D.; Chem.
Soc. Rev. 2016, 45, 3865.
23. Jamieson, L. E.; Asiala, S. M.; Gracie, K.; Faulds, K.; Grahm, D.; Annu. Rev. Anal. Chem. 2017, 1.
24. Goodacre, R.; Grahm, D.; Fauds, K.; Trends Anal. Chem. 2018, 102, 359.
25. Saha, K.; Agasti, S. S.; Kim, C.; Li, X.; Rotello, V. M.; Chem. Rev. 2012, 112, 2739.
26. Dreaden, E. C.; Alkinaly, A. M.; Huang, X.; Murphy, C. J.; El-Sayed, M. A.; Chem. Soc. Rev. 2012, 41, 2740.
27. Shaw, C. P.; Fan, M.; Lane, C.; Barry, G.; Jirasek, A.; Brolo, A. G.; J. Phys. Chem. C 2013, 117, 16595.
28. Xie, D.; Zhu, W. F.; Cheng, H.; Yao, Z.; Li, M.; Zhao, Y. L.; Phys. Chem. Chem. Phys. 2018, 20, 8881.
29. Petri, L.; Ferreira, M.; Moraes, M. L.; Nanosci. Nanotechnol. 2011, 11, 1.
30. Lotterberger, J.; Salvetti, J. L.; Beltramini, L. M.; Tonarelli, G.; Rev. Argent. Microbiol. 2004, 36, 151.
31. Sapsford, K. E.; Banco-Canosa, J. B.; Dawson, P. E.; Bioconjugate Chem. 2010, 21, 393.
32. Kimling, J.; Maier, M.; Okenve, B.; Koitaidis, V.; Ballot, H.; Plech, A.; J. Phys. Chem. B 2006, 110, 15700.
33. Izumi, C.M.S.; Moffit, M.; Brolo, A.G.; J. Phys. Chem. C 2011, 115, 19104.
34. Agresti, A.; Coull, B. A.; Am. Stat. 2001, 52, 119. 35. Cohen, J.; Statistical power analysis for the behavior sciences, 2nd ed.,
Lawrence Erlbaum: Michigan, 1988. 36. Sinha, L.; Wang, Y.; Yang, C.; Khan, A.; Brankov, J. G.; Liu, J. C.;
Tichauer, K. M.; Sci. Rep. 2015, 5, 1. 37. Yang, J.; Palla, M.; Bosco, F. G.; Rindzevicius, T.; Alstrom, T. S.;
Schimidt, M. S.; Boisen, A.; Ju, J.; Lin, Q.; ACS. Nano 2013, 7, 5350. 38. Porter, M. D.; Lippert, R. J.; Siperko, L. M.; Wang, G.; Narayanan, R.;
Chem. Soc. Rev. 2008, 37, 1001. 39. Sullivan, G. M.; Feinn, R.; J. Grad. Med. Educ. 2012, 4, 279. 40. Renga B.; Francisci, D.; D´Amore, C.; Schiaroll, E.; Andrea M.;
Cipriani, S.; Baldelli, F.; Fiorucci, S.; Plos One 2012, 7, 1. 41. Francesco, M. A.; Baronio, M.; Fiorentini, S.; Signorini, C.; Bonfanti,
C.; Poiesi, C.;. Popovic, M.; Grassi, M.; Garrafa, M.; Bozzo, L.; Lewis, G.; Licenzi, S.; Gallo, R. C.; Caruso, A.; Proc. Natl. Acad. Sci. U. S. A. 2002, 99, 9972.
FAPESP helped in meeting the publication costs of the article
This is an open-access article distributed under the terms of the Creative Commons Attribution License.