a universal truth: no health without a workforce
TRANSCRIPT

A UNIVERSAL TRUTH:
NO HEALTH WITHOUT A WORKFORCE

This report was commissioned by the Global Health Workforce Alliance (GHWA) Secretariat and the World Health Organization (WHO) to consolidate the latest information available on human resources for health and inform the global community on how to attain, sustain and accelerate progress on universal health coverage.
The main contributors of the report are: Jim Campbell (ICS Integrare), Gilles Dussault (Instituto de Higiene e Medicina Tropical (IHMT ), James Buchan (Queen Margaret University), Francisco Pozo-Martin (ICS Integrare), Maria Guerra Arias (ICS Integrare), Claudia Leone (IHMT ), Amani Siyam (WHO), Giorgio Cometto (GHWA).
WHO and GHWA are grateful to the Chair and members of the Technical Advisory Group that oversaw and provided guidance to the development of the report, providing both strategic stewardship and inputs on its contents:
• Chair – Tim Evans (World Bank);• members – Eric Buch (University of Pretoria); Yoswa Dambisya (University of Limpopo); Luc De Bernis (UNFPA); Bjarne
Garden (Norad); Uta Lehmann (University of the Western Cape); Simon Lewin (Norwegian Knowledge Centre for the Health Services and Medical Research Council of South Africa); Estelle Quain (United States Agency for International Development); Jessica Rose (United States Agency for International Development); Amani Siyam (WHO); Neil Squires (Department for International Development); Barbara Stilwell (IntraHealth); Ties Boerma (WHO); Feng Zhao (African Development Bank); and
• supported by – Akiko Maeda (World Bank) and Edson Araújo (World Bank).
WHO and GHWA also acknowledge the research team from the Instituto de Cooperación Social Integrare (ICS Integrare), the Instituto de Higiene e Medicina Tropical (IHMT) and Save the Children who were responsible for collecting and analysing the data, developing successive drafts of the report and converting the country profiles to an online format:
• coordination: Jim Campbell, Gilles Dussault and James Buchan;• for ICS Integrare: Jim Campbell; Francisco Pozo-Martin, Maria Guerra Arias, Manon ter Linden and
Laura Sochas;• for IHMT: Gilles Dussault; Claudia Leone; João Pedro Gregório; Silvia Machaqueiro; and Ana Paula Oliveira; and• for Save the Children: Louise Holly and Tim Shorten.
David Evans (WHO) and Rüdiger Krech (WHO) reviewed the report and provided inputs on its contents.
WHO and GHWA wish to acknowledge key informants who contributed published and grey literature or validated and provided quality assurance on the information of specific sections (mentioned in parentheses): Celia Pierantoni (Brazil); Jerker Liljestrand and Mean Reatanak Sambath (Cambodia); Sophia Lin and Graham Roberts (Fiji); Masamine Jimba (Japan); Abdelaye Mechbal and Mina Abaacrouche (Morocco); Amalia Mepatia (Mozambique); Alberto Infante (Spain); Sheena Currie (Yemen); Eric Friedman; Katie Leach-Kemon and Rafael Lozano of Institute for Health Metrics and Evaluation; Petra ten Hoope-Bender.
WHO and GHWA are grateful to the following donors for their financial contributions towards the report: Ministry of Health, Brazil; Deutsche Gesellschaft für Internationale Zusammenarbeit, Germany; Irish Aid; Norwegian Agency for Development Cooperation; Department for International Development, United Kingdom; and United States Agency for International Development.
Suggested citation: Campbell J, Dussault G, Buchan J, Pozo-Martin F, Guerra Arias M, Leone C, Siyam A, Cometto G. A universal truth: no health without a workforce. Forum Report, Third Global Forum on Human Resources for Health, Recife, Brazil. Geneva, Global Health Workforce Alliance and World Health Organization, 2013.
The views expressed in this report are those of the authors and not necessarily those of the Organizations they represent.
ACKNOWLEDGEMENTS
WHO Library Cataloguing-in-Publication Data:
A universal truth: no health without a workforce.1.Health Manpower. 2.Health Personnel. 3.Delivery of Health Care. I.World Health Organization. II.Global Health Workforce Alliance.ISBN 978 92 4 150676 2(NLM classification: W 76)
© World Health Organization 2014
All rights reserved. Publications of the World Health Organization are available on the WHO website (www.who.int) or can be purchased from WHO Press, World Health Organization, 20 Avenue Appia, 1211 Geneva 27, Switzerland (tel.: +41 22 791 3264; fax: +41 22 791 4857; e-mail: [email protected]).
Requests for permission to reproduce or translate WHO publications –whether for sale or for non-commercial distribution– should be addressed to WHO Press through the WHO website (www.who.int/about/licensing/ copyright_form/en/index.html).
The designations employed and the presentation of the material in this publication do not imply the expression of any opinion whatsoever on the part of the World Health Organization concerning the legal status of any country, territory, city or area or of its authorities, or concerning the delimitation of its frontiers or boundaries. Dotted lines on maps represent approximate border lines for which there may not yet be full agreement.
The mention of specific companies or of certain manufacturers’ products does not imply that they are endorsed or recommended by the World Health Organization in preference to others of a similar nature that are not mentioned. Errors and omissions excepted, the names of proprietary products are distinguished by initial capital letters.
All reasonable precautions have been taken by the World Health Organization to verify the information contained in this publication. However, the published material is being distributed without warranty of any kind, either expressed or implied. The responsibility for the interpretation and use of the material lies with the reader. In no event shall the World Health Organization be liable for damages arising from its use.
Design & Layout by Prographics Inc, USA.
Printed in France.

A UNIVERSAL TRUTH:
NO HEALTH WITHOUT A WORKFORCE
1 Purpose of the report ....................................................................1
2 Methods ...........................................................................................52.1 Methods. .....................................................................................................................62.2 Data sources ..............................................................................................................6
3 What are the human resources for health dimensions of universal health coverage? .............................9
Annexes ............................................................................................. 82Annex 1. Country profiles – explanation of data sources and methods...............82Annex 2. Workforce 2035 estimates for the 36 profiled countries .........................84
Online annexeshttp://www.who.int/workforcealliance/knowledge/resources/hrhreport2013/ en/index.html
Annex 3. UHC status in 36 profiled countriesAnnex 4: Workforce data for 193 countries (adapted from the WHO Global Health Observatory Data Repository)Annex 5: Country profiles - data set
References ........................................................................................ 86
Foreword ............................................................................................. iv
Executive summary ............................................................................v
CONTENTS4 Progress on human resources for health in the decade of action since 2006 ..........................................13
4.1 Availability .................................................................................................................144.2 Accessibility .............................................................................................................254.3 Acceptability.............................................................................................................274.4 Quality ........................................................................................................................284.5 Summary ...................................................................................................................30
5 Towards a contemporary agenda for human resources for health ................................................31
5.1 The “big picture” challenges for human resources for health ......................325.2 The evidence adds up ............................................................................................385.3 Focus themes for a contemporary agenda ........................................................38
6 Towards action and results ......................................................416.1 Conclusions ..............................................................................................................44
7 Country profiles ............................................................................45
COUNTRY PROFILES i i i
BOX 1. Findings of the Second Global Forum on Human Resources for Health, Bangkok, Thailand, 2011 ........................ 3
BOX 2. What is a skilled birth attendant? ..................................................................................................................................... 8
BOX 3. Health professional dual practice................................................................................................................................... 14
BOX 4. The density threshold of 22.8 skilled health workers per 10 000 population: origins, logic and limitations. ........ 18
BOX 5. Improving acceptability: the respectful maternal care agenda. ................................................................................. 27
BOX 6. Innovative approaches to expanding the quality of health coverage. ....................................................................... 29
BOX 7. Health care as an employment sector: the importance and characteristics of health labour markets .................. 35
BOX 8. Accelerating the supply of skilled health professionals: estimates of potential population needs (current and in 2035) ....................................................................................................................................................... 36
BOX 9. Seven themes to inform action on human resources for health ................................................................................ 39
BOX 10. A manifesto for action ..................................................................................................................................................... 42
FIGURE 1. Human resources for health: availability, accessibility, acceptability, quality and effective coverage ................... 11
FIGURE 2 Frequency of all country reporting of workforce data to WHO’s Global Health Observatory (1990–2012) and a focus on 57 low-density and low-coverage countries (2008–2012)............................................ 15
FIGURE 3. Density of skilled health professionals per 10 000 population (all countries and the 36 profiled countries) ................................................................................................................. 16
FIGURE 4. Workforce to population ratios for 186 countries. ....................................................................................................... 19
FIGURE 5. Median density of skilled health professionals per 10 000 population, countries (n = 118) grouped by quintiles of GDP (adjusted for purchasing power parity) per capita. ......................................................................... 20
FIGURE 6. Median density of skilled health professionals per 10 000 population, countries (n = 118) grouped by quintiles of total health expenditure by the government (%). ............................................................... 21
FIGURE 7. Average exponential growth rate in the number of midwives and nurses and of physicians in 46 countries, 2004 to the the latest year available ................................................................................................... 22
FIGURE 8. Ratio of highest and lowest subnational density of physicians to the national average in 25 profiled countries..................................................................................................................................... 26
FIGURE 9. Drivers of change for the health workforce .................................................................................................................. 33
TABLE 1. Number of countries (n = 118) with a workforce-to-population ratio below the 59.4 per 10 000 threshold according to the World Bank income classification.................................................................................... 20
TABLE 2. Average exponential growth rate in the number of skilled health professionals over time in 32 countries, by WHO region, 2004 to the latest year available ............................................................................. 23
TABLE 3. Average exponential growth rate in the density of skilled health professionals per 10 000 population over time in 32 countries, by WHO region, 2004 to the latest year available ........................... 23
CONTENTS i i i
FIG
URE
SLIST OF BOXES, FIGURES AND TABLES
TAB
LES
BO
XES
ABBREVIATIONS AND ACRONYMS
EU European Union
G8 Group of Eight
GDP gross domestic product
ICS Integrare Instituto de Cooperación Social Integrare
IHMT Instituto de Higiene e Medicina Tropical
ILO International Labour Organization
MOOC Massive Open Online Course
OECD Organisation for Economic Co-operation and Development
PPP purchasing power parity
UNFPA United Nations Population Fund
iv A UNIVERSAL TRUTH: NO HEALTH WITHOUT A WORKFORCE
FOREWORD
As world leaders embrace the aspiration for universal health coverage, it is clearer than ever that this ambition cannot be realized without a health workforce that is fit for purpose and fit to practice. This report was commissioned to provide a cutting-edge analysis of the status of human resources for health and to sketch an agenda looking ahead to the next 15–20 years.
Gearing up the health workforce to meet the challenge of universal health coverage is no simple task, and continuing with the status quo in the development of human resources for health will not necessarily yield the expected results: looking back at the past 10 years, a clear lesson learned is the need to move away from piecemeal approaches and short-term solutions; only long-term action, backed up by political commitment and adequate investments, will lead to the transformative changes required to attain sustainable results in developing the health workforce.
More health workers will be required: new modelling estimates indicate a much higher global deficit than previously thought. Although these estimates serve illustrative purposes and should not be seen as a planning target, they highlight the magnitude of future challenges, implying the need to rethink the traditional models of education, deployment and management of the health workforce.
It is not all about numbers: the goal of universal health coverage requires a paradigm shift, going beyond a discourse on shortages but rather focusing more explicitly on the accessibility, acceptability, quality and productivity of the health workforce, placing equity at the centre of the agenda. Broader factors also need to be taken into account: an evolving epidemiological profile and population structure are increasing the burden of noncommunicable diseases and long-term care on health systems, and there is increased recognition that health workers can serve as change agents in society, reorienting health systems towards primary care and
action on the social determinants of health. A transformative scaling up of health education will reflect such trends in determining health workers’ competencies in the 21st century.
As the findings of this report clearly highlight, many advances have been achieved in the past decade. For instance, among the countries affected by severe shortage, most of those with available data improved their availability of skilled health professionals, and the adoption of the WHO Global Code of Practice on the International Recruitment of Health Personnel indicates the wide recognition that the health workforce represents a shared global priority. Nevertheless, attaining and sustaining universal health coverage may remain a challenge for the health workforce in countries at all levels of socioeconomic development, if they continue moving along their current paths. This report illustrates how progress is possible and highlights successful and promising novel approaches, providing the inspiration to open a decade of innovation on developing the health workforce, following the decade of action called for by The World Health Report 2006.
The findings of this report also come at the most opportune time, as the goal of universal health coverage gains momentum and the discussions on the post-2015 development agenda begin in earnest. Ramping up efforts is required to meet the great challenge of ensuring that everyone, whoever they are and wherever they live, has access to a health worker. This agenda belongs to all of us who have a responsibility in designing policy, planning, deployment or retention interventions and to those who work at the front line of service provision: a simple but universal truth is that there can be no health without a workforce.
Marie-Paule Kieny Assistant Director-GeneralWorld Health Organization

EXECUTIVE SUMMARY v
EXECUTIVE SUMMARY
PurposeThis report is intended to inform proceedings at the Third Global Forum on Human Resources for Health and to inform a global audience and trigger momentum for action. It aims to consolidate what is known on human resources for health and how to attain, sustain and accelerate progress on universal health coverage.
MethodsThe report uses mixed methods in selecting, collating and analysing country data. This includes analysing the workforce data in the WHO Global Health Observatory, searches of human resources for health progress in 36 countries and horizon-scanning of “big picture” challenges in the immediate future. Limitations include a reliance on published data and secondary sources. The available data also limit comparison between countries. Nevertheless, we can draw from the synthesis of information with reasonable confidence.
What are the human resources for health dimensions of universal health coverage?The report presents a case that the health workforce is central to attaining, sustaining and accelerating progress on universal health coverage and suggests three guiding questions for decision-makers. What health workforce is required to ensure effective coverage of an agreed package of health care benefits? What health workforce is required to progressively expand coverage over time? How does a country produce, deploy and sustain a health workforce that is both fit for purpose and fit to practice in support of universal health coverage?
Photo credit: Arne Hoel / World Bank

vi A UNIVERSAL TRUTH: NO HEALTH WITHOUT A WORKFORCE
Progress on human resources for health in the decade of action since 2006Progress was assessed through the lens of availability, accessibility, acceptability and quality as well as universal health coverage, to identify the key drivers, emerging trends and issues common to all countries.
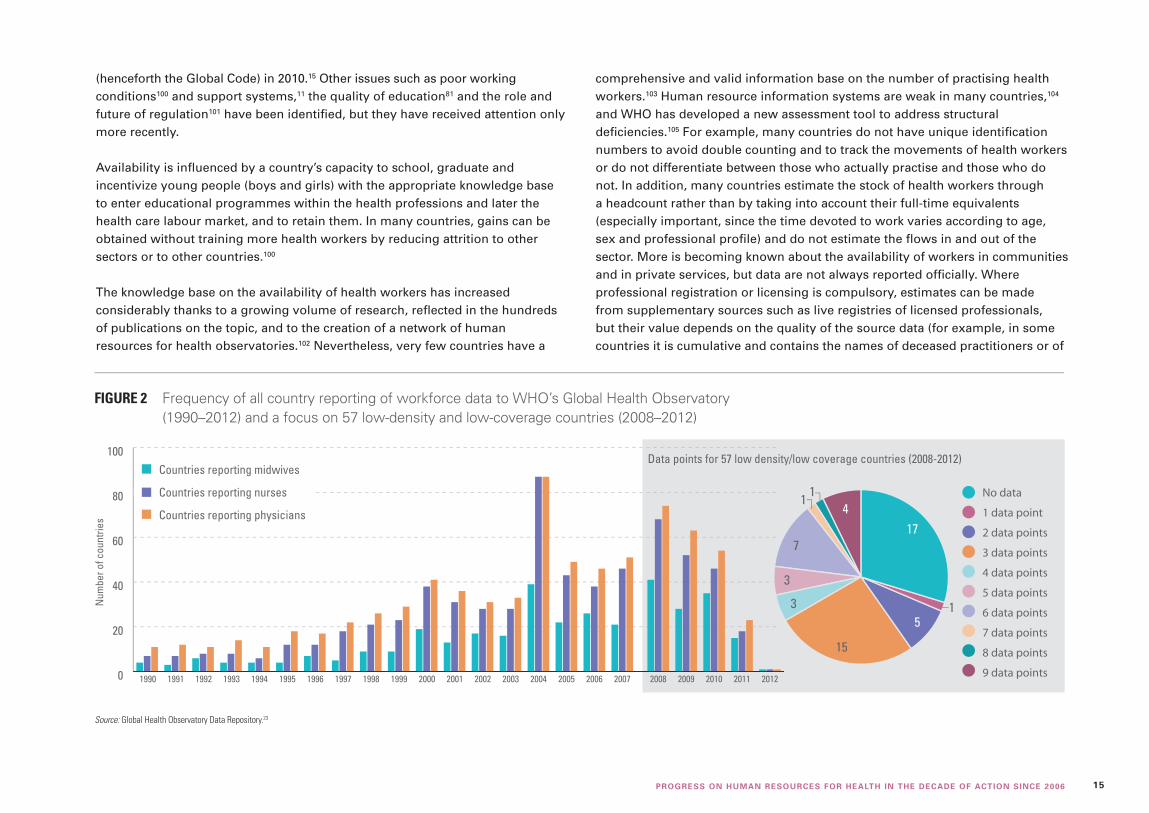
AvailabilityFew countries have a comprehensive and valid information base on available health workers. The WHO Global Health Observatory reports workforce data for 186 countries, but 53% of these countries have fewer than 7 annual data points on midwives, nurses and physicians across the past 20 years. Further, of the 57 countries identified in 2006 with low human resources for health density and low service coverage, 17 countries have no data point in the past five years.
We created a global snapshot in comparison to three density thresholds of skilled health professionals (midwives, nurses and physicians) per 10 000 population. The three thresholds (22.8, 34.5 and 59.4 skilled health professionals per 10 000 population) were purposively selected to highlight the variation in health workforce availability. The report makes clear that the thresholds (often referred to incorrectly as benchmarks) are not developed to promote targets that a country should or must achieve but are used to illustrate the pattern of availability globally:
To answer these questions, we use a conceptual framework that speaks to the key principles of both the right to health and minimum social protection floors: the availability, accessibility, acceptability and quality of health services. Noting WHO’s statement that health services are only as effective as the persons responsible for delivering them, we adapted the availability, accessibility, acceptability and quality dimensions to the health workforce:
• availability – the sufficient supply and stock of health workers, with the relevant competencies and skill mix that correspond to the health needs of the population;
• accessibility – the equitable access to health workers, including in terms of travel time and transport, opening hours and corresponding workforce atten-dance, whether the infrastructure is disability-friendly, referral mechanisms and the direct and indirect cost of services, both formal and informal;
• acceptability – the characteristics and ability of the workforce to treat everyone with dignity, create trust and enable or promote demand for services; and
• quality – the competencies, skills, knowledge and behaviour of the health worker as assessed according to professional norms and as perceived by users.
1
Assess the gap between the need for a health workforce, actual supply (stock, skills mix and competencies) and the population’s demand for health services.
Formulate human resources for health policy objectives that encapsulate the vision for the health system and services.
Towards action and results10-point agenda
32
Recognize the centrality of the health workforce in translating the vision of universal health coverage into improved health care on the ground.
EXECUTIVE SUMMARY vi i
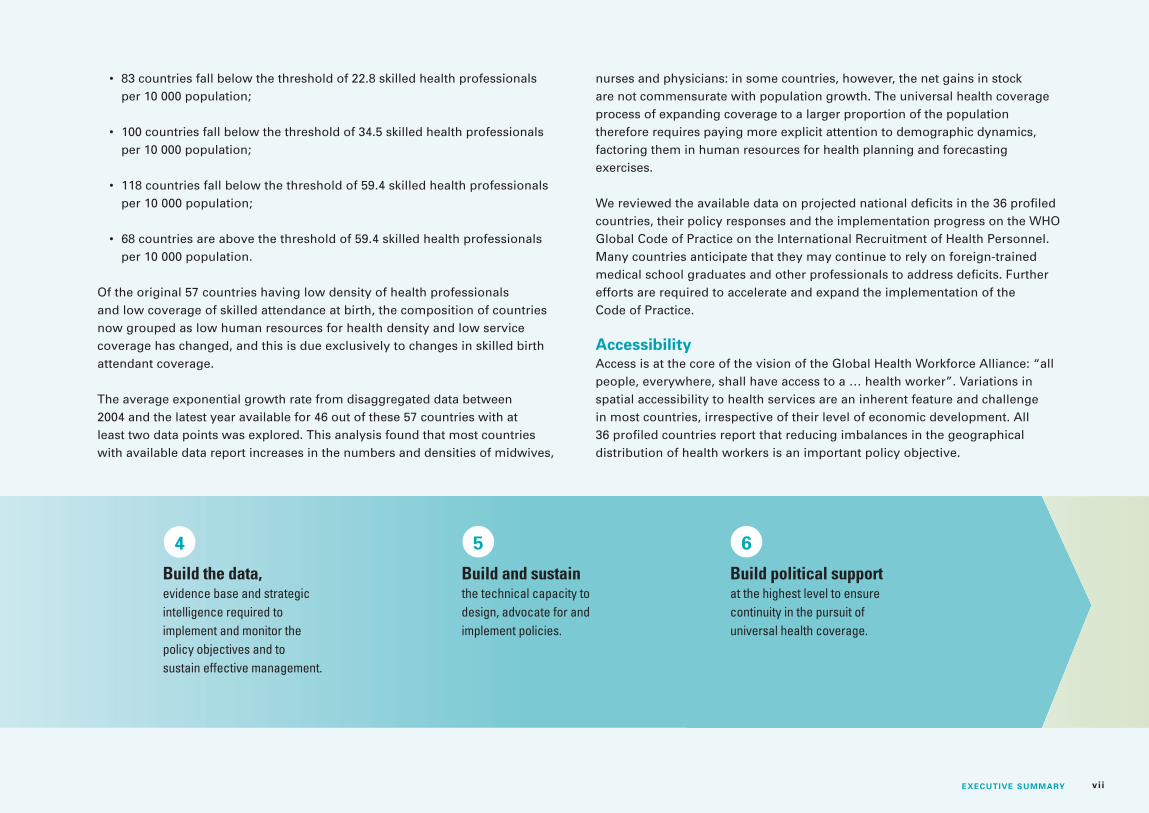
• 83 countries fall below the threshold of 22.8 skilled health professionals per 10 000 population;
• 100 countries fall below the threshold of 34.5 skilled health professionals per 10 000 population;
• 118 countries fall below the threshold of 59.4 skilled health professionals per 10 000 population;
• 68 countries are above the threshold of 59.4 skilled health professionals per 10 000 population.
Of the original 57 countries having low density of health professionals and low coverage of skilled attendance at birth, the composition of countries now grouped as low human resources for health density and low service coverage has changed, and this is due exclusively to changes in skilled birth attendant coverage.
The average exponential growth rate from disaggregated data between 2004 and the latest year available for 46 out of these 57 countries with at least two data points was explored. This analysis found that most countries with available data report increases in the numbers and densities of midwives,
Build the data, evidence base and strategic intelligence required to implement and monitor the policy objectives and to sustain effective management.
Build and sustain the technical capacity to design, advocate for and implement policies.
Build political support at the highest level to ensure continuity in the pursuit of universal health coverage.
4 65
nurses and physicians: in some countries, however, the net gains in stock are not commensurate with population growth. The universal health coverage process of expanding coverage to a larger proportion of the population therefore requires paying more explicit attention to demographic dynamics, factoring them in human resources for health planning and forecasting exercises.
We reviewed the available data on projected national deficits in the 36 profiled countries, their policy responses and the implementation progress on the WHO Global Code of Practice on the International Recruitment of Health Personnel. Many countries anticipate that they may continue to rely on foreign-trained medical school graduates and other professionals to address deficits. Further efforts are required to accelerate and expand the implementation of the Code of Practice.
AccessibilityAccess is at the core of the vision of the Global Health Workforce Alliance: “all people, everywhere, shall have access to a … health worker”. Variations in spatial accessibility to health services are an inherent feature and challenge in most countries, irrespective of their level of economic development. All 36 profiled countries report that reducing imbalances in the geographical distribution of health workers is an important policy objective.

vii i A UNIVERSAL TRUTH: NO HEALTH WITHOUT A WORKFORCE
Many policy tools are available to distribute the health workforce more equitably. These range from providing financial incentives to health workers in remote postings, ensuring that continuing professional development and training is available beyond urban areas, prolonging the residency period during which workers have less choice over their posting and providing non-financial incentives such as free housing, better diagnostic facilities, security and access to health care free of charge. In any case, a multifaceted, comprehensive and flexible approach is needed for sustained improvement, such as that proposed by WHO recommendations on increasing access to health workers in remote and rural areas through improved retention. Technological advances in geographical information systems, mapping technologies and the geography of health can further inform future action on human resources for health and universal health coverage.
AcceptabilityAcceptability is enhanced when users of services have access to a health workforce that meets their expectations in terms of its profile, sex and age composition, its skills mix, and cultural awareness. The creation and expansion of various types of workers, deployed close to communities, can be an effective and efficient way to make services more accessible and acceptable. Using the sex distribution of physicians and the ratio of nurses to physicians as proxies for acceptability, we found a wide variation in health workforce configurations and no major pattern in skill mix. Only high-income countries demonstrated a tighter
clustering in the ratio of nurses to physicians, but even these countries had health systems that remained heavily reliant on physician-led services.
QualityThe measurement of quality is hindered by the lack of a universally accepted definition or indicators and is often neglected. In this report, we define quality according to the competencies of health workers, as influenced by the enabling environment of education, regulation and association. This is a major challenge in all countries. Although improving the quality of health workers and the care they provide is a high policy priority in some countries, it is absent in others.
In the 36 countries profiled, we used the existence of an accreditation system for education institutions and regulation of access to professional practice as proxy indicators of conditions that positively influence the quality of the health workforce. We found the following:
• A total of 33 countries have some formal or informal mechanism for accrediting educational institutions in place or being developed.
• 27 countries have started or plan to improve the quality of education of health professionals.
• 35 countries have mechanisms in place to regulate the access to the practice
Reform the governance and institutional human resources for health environment.
Assess the cost of the various scenarios of health workforce reforms.
Encourage international partners to focus their support and to report on their official development assistance for building the capacity of health systems.
Encourage international partners to address transnational issues and strengthen global human resources for health governance, collaborative platforms and mechanisms.
7 98 10

EXECUTIVE SUMMARY ixEXECUTIVE SUMMARY ix
of medicine, dentistry and pharmacy. The situation is more varied for midwifery and nursing. However, the effectiveness of such mechanisms is not always clear.
• In general, there is no proactive surveillance of the quality of practice in the form of periodical site visits. Performance is deemed to be correct until some complaint is formulated or some error, misbehaviour or health problem is detected.
Summary findingsThe following human resources for health themes are common to most countries:
• There are shortages of some categories of health workers, and more are forecast.
• The health workforce is ageing, and replacement is a challenge.
• Although skills-mix imbalances persist, advanced practitioners, midwives, nurses and auxiliaries are still insufficiently used in many settings.
• Availability and accessibility continue to vary widely within countries because of difficulty in attracting and retaining workers.
• Adapting education strategies and the content of pre-service education is a major challenge.
Acting on human resources for health is now in the hands of governments and all interested stakeholders. Political and technical leadership is critical to seize the opportunity to attain, sustain and accelerate progress on universal health coverage by transformative action on human resources for health.
The universal truth: no health without a workforce.
• Health workers need to be kept motivated in an enabling environment.
• Performance assessment and quality of care are afforded insufficient priority.
• Country capacity to estimate future human resources for health needs and design longer-term policies varies.
• Human resource information data and systems to meet the needs of decision-makers require strengthening and investment.
Countries that have shown progress in improving the essential availability, accessibility, acceptability and quality dimensions have in common that political commitment to doing so has been strong, that they have strived to improve human resources for health in a systemic manner, linking health workforce development initiatives and also with broader action to strengthen health systems, and that continuity in implementing their preferred strategies has been maintained.
Towards a contemporary human resources for health agendaThe World Health Report 2000 stated that human resources are the most important of the health system’s inputs. Nevertheless, progress has not been
Photo credit: Md. Mahfuzul Hasan Bhuiyan
x A UNIVERSAL TRUTH: NO HEALTH WITHOUT A WORKFORCE
far enough or rapid enough. Business as usual is therefore not an option; action must reflect what needs to be done and can be done and what can collectively be anticipated as emerging challenges.
Horizon-scanning exercises on future health systems converge in their identification of the emerging challenges and can inform scenarios on the human resources for health implications of progressively expanding effective coverage. We analysed the workforce implications of new global health targets in the context of the Millennium Development Goals, universal health coverage and the post-2015 agenda to highlight the scope of future challenges. We estimated a global deficit of about 12.9 million skilled health professionals (midwives, nurses and physicians) by 2035. While this estimate was produced for illustrative purposes and should not be seen as a planning target, it implies the need to rethink the traditional models of education, deployment and remuneration of the health workforce, long-term system-building, comprehensive labour market engagement and essential data and intelligence systems.
Seven focus areas emerge from the evidence as the bridge from “what is” to “what can be”: an articulated vision for human resources for health fully underpinning the achievement of universal health coverage nationally and globally:
• health systems can only operate with a health workforce;
• responsive to population needs;
• with supply and demand aligned;
• with supply informed by evidence;
• with effective governance enshrined;
• respecting the rights of the worker, who in turn must embrace the right to health; and
• providing the stewardship and financing for shared prosperity and wealth.
Towards action and resultsThe report presents a 10-point agenda to strengthen human resources for health in the context of universal health coverage. Given the specificities of each country, policy-makers will need to interpret these actions in accordance
with their needs and capacity. These are the conditions for success in improving the availability, accessibility, acceptability and quality of the health workforce commensurate with the principles of universal health coverage. Each action is necessary and important; all will be required at various points in the process.
1) Recognize the centrality of the health workforce in translating the vision of universal health coverage into improved health care on the ground. 2) Assess the gap between the need for a health workforce, actual supply (stock, skills mix and competencies) and the population’s demand for health services. 3) Formulate human resources for health policy objectives that encapsulate the vision for the health system and services. 4) Build the data, evidence base and strategic intelligence required to implement and monitor the policy objectives and to sustain effective management. 5) Build and sustain the technical capacity to design, advocate for and implement policies. 6) Build political support at the highest level to ensure continuity in the pursuit of universal health coverage. 7) Reform the governance and institutional human resources for health environment. 8) Assess the cost of the various scenarios of health workforce reforms. 9) Encourage international partners to focus their support and to report on their official development assistance for building the capacity of health systems. 10) Encourage international partners to address transnational issues and strengthen global human resources for health governance, collaborative platforms and mechanisms.
Acting on human resources for health is now in the hands of governments and all interested stakeholders. Political and technical leadership is critical to seize the opportunity to attain, sustain and accelerate progress on universal health coverage by transformative action on human resources for health. This requires a contemporary agenda in support of the millions of individual health workers that manage, administer and provide the health and social services that we wish all people – rich and poor – to access and obtain. The universal truth: no health without a workforce.
1PURPOSE OF THE REPORT
PURPOSE OF THE REPORT
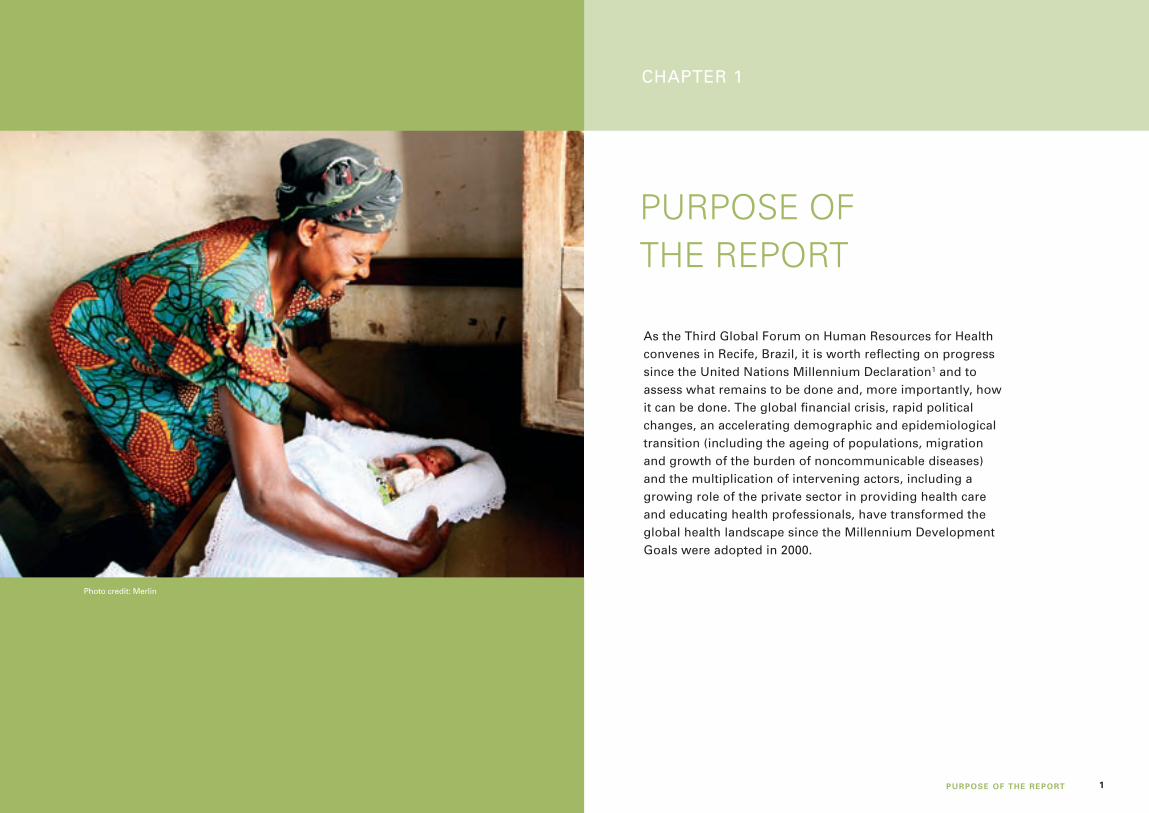
As the Third Global Forum on Human Resources for Health convenes in Recife, Brazil, it is worth reflecting on progress since the United Nations Millennium Declaration1 and to assess what remains to be done and, more importantly, how it can be done. The global financial crisis, rapid political changes, an accelerating demographic and epidemiological transition (including the ageing of populations, migration and growth of the burden of noncommunicable diseases) and the multiplication of intervening actors, including a growing role of the private sector in providing health care and educating health professionals, have transformed the global health landscape since the Millennium Development Goals were adopted in 2000.
CHAPTER 1CHAPTER 1
Photo credit: Merlin

2 A UNIVERSAL TRUTH: NO HEALTH WITHOUT A WORKFORCE
Despite all difficulties, the commitment of the international community to improving the health of all is stronger than ever. After pledging to achieve specific health outcomes as part of the Millennium Development Goals, Member States of the United Nations have now engaged in the process of guaranteeing universal health coverage to their populations,2 and the Member States of the International Labour Organization have agreed new commitments to social protection floors and accelerating the availability, accessibility, acceptability and quality of essential health services, particularly maternity services.3 In anticipation of the end date of the Millennium Declaration, the United Nations Secretary-General has initiated a global discussion on the post-2015 development agenda for health, sustainable development goals, and the World We Want in the period 2015–2030.4–7
The momentum is encouraging, even if there is continuing discussion on the scope of priorities that will eventually be included in a post-2015 declaration.8 Similarly, although there is debate on the understanding of universal health coverage,9 it is recognized that all countries, irrespective of their level of economic development, are challenged to attain, sustain or accelerate progress on universal health coverage. Covering a greater percentage of the population, expanding a health benefits package and integrating financial (and social) protection at an affordable cost requires a holistic approach, and the governance, management, performance and productivity of the health workforce to deliver quality health services is an essential component of this.
The centrality of the health workforce to improving health services and population health outcomes is well established. Less than 10 years ago, the report of the Joint Learning Initiative10,11 alerted the world to the urgency of responding to health workforce needs as a critical precondition to achieving the Millennium Development Goals. The World Health Report 2006: working together for health12 further highlighted the issue and gave directions for a decade of action on human resources for health. It proposed creating a global stakeholders’ alliance to advocate and mobilize resources and support for health workforce development. The Global Health Workforce Alliance was
The centrality of the health workforce to improving health services and population health outcomes is well established.
Photo credit: Alyssa Banta

3PURPOSE OF THE REPORT
officially launched on 25 May 2006 during the 59th World Health Assembly in Geneva, alongside new resolutions on the rapid scaling up of health workforce production (WHA59.23) and strengthening nursing and midwifery (WHA59.27).
The Alliance convened a first Global Forum on Human Resources for Health in Kampala, Uganda in 2008. Participants agreed on the vision that “all people, everywhere, shall have access to a skilled, motivated and supported health worker within a robust health system”. The Kampala Declaration and Agenda for Global Action13 was adopted, focusing attention on six strategic areas of human resources for health. These were the first global commitments specifically targeting health workforce issues. The Second Global Forum on Human Resources for Health, in Bangkok, Thailand in January 2011, reviewed progress of the first three years of the Agenda.14
It recognized that key advances had been made at country level, such as formulating and adopting national health workforce plans or strategies. At the global level, the Forum hailed the adoption in May 2010 of the WHO Global Code of Practice on the International Recruitment of Health Personnel15 by the World Health Assembly as a major accomplishment. It also observed that a series of events and initiatives showed that the level of awareness of the importance of strengthening the health workforce to improve the performance of health systems had increased. However, Forum participants identified major gaps that remained to be filled (Box 1). 16
As the Third Global Forum meets, there is extensive literature on what needs to be done and on what can be done to support universal health coverage and the post-2015 agenda for health. Countries, international agencies, health commentators and researchers have reaffirmed the need for action, and there is now an abundance of evidence-informed recommendations. Reports for the Sixty-sixth World Health Assembly in May 201317,18 have particularly noted the need for transformative action on human resources for health and echo the Alliance’s 2013–2016 strategy to establish a new, contemporary agenda on the health workforce in support of universal health coverage.19
• The supply and availability of qualified health workers in many countries remained insufficient to deliver an effective package of essential health services and ensure that poor and marginalized people have equitable access to the health workforce and to health services.
• Planning and developing the future health workforce was impaired by the lack of reliable and updated information on the state of the workforce, its composition, distribution and evolution.
• Leadership and regulatory frameworks were still in need of strengthening to ensure that effective policies are adopted and implemented, particularly in relation to distribution, retention and performance of health workers.
• National health workforce coordination mechanisms to foster synergies among stakeholders were greatly lacking.
• There was a need for strong national capacity in all countries to regularly collect, collate, analyse and share data to inform policy-making, planning and management. New benchmarks beyond the densities of physicians, nurses and midwives were advocated.
• More attention was needed on aspects such as geographical distribution, retention, gender balance, minimum standards and competency frameworks and the diverse composition of the health workforce.
Source: adapted from Global Health Workforce Alliance et al.16
BOX 1 Findings of the Second Global Forum on Human Resources for Health, Bangkok, Thailand, 2011

4 A UNIVERSAL TRUTH: NO HEALTH WITHOUT A WORKFORCE
This Forum report builds on the current discourse of post-2015 priorities, which encompass global health, universal health coverage and social protection, with a view to consolidate what is known on human resources for health and inform how to attain, sustain and accelerate progress on universal health coverage. Its purpose complements the Alliance’s strategy:
• to collate and synthesize the evidence on how human resources for health is an essential component of universal health coverage and improving health outcomes;
• to analyse the workforce dimensions of availability, accessibility, acceptability and quality as preconditions for effective coverage and universal health coverage;
• to foresee the “big picture” human resources for health challenges that countries and the international community are likely to face in the period 2015–2035; and
• to identify relevant and actionable policy options on human resources for health that countries and the international community can adopt to address both individual and collective human resources for health challenges.

5METHODS
The Alliance convened a Technical Advisory Group comprised of international experts in human resources for health to provide guidance and to review this report from its conception to publication. A research team from the Instituto de Cooperación Social Integrare (ICS Integrare), the Instituto de Higiene e Medicina Tropical (IHMT) and Save the Children were appointed, based on a competitive tendering process, to lead the data collection, analysis and report writing, supported by contributions from WHO, the World Bank and the Alliance Secretariat.
METHODS
CHAPTER 2
Photo credit: Min Zaw / Photoshare

6 A UNIVERSAL TRUTH: NO HEALTH WITHOUT A WORKFORCE
2.1 MethodsMixed methods were used in selecting, collating and analysing country data, under the oversight of the Technical Advisory Group.
• Thirty-six countries were selected as a sample based on their human resources for health attributes and challenges in attaining, sustaining or accelerating progress on universal health coverage. For each of the six WHO regions (Africa, the Americas, Eastern Mediterranean, Europe, South-East Asia and the Western Pacific), countries were categorized into upper, middle and lower tertiles according to both their global and regional rankings for public health expenditure per capita (in current US dollars) and the density of skilled health professionals (midwives, nurses and physicians) per 10 000 population. This allowed a selection of six countries from each region, aiming for an even distribution across the tertiles. An initial selection of countries was tested against income group, language and population size, as well as practical issues of data availability and potential lessons emerging, to obtain a diverse sample.
• For the selection of human resources for health indicators, various sources were compared for consistency, including: an initial list proposed by the Technical Advisory Group, the WHO Handbook on monitoring and evaluation of human resources for health,20 the Pan American Health Organization Handbook for measurement and monitoring indicators of the regional goals for human resources for health21 and a Forum discussion paper on the availability, accessibility, acceptability and quality of human resources for health.22 Each indicator was reviewed according to whether it was a recognized metric, its linkage to the availability, accessibility, acceptability and quality dimensions of human resources for health and the availability of data.
• A structured search protocol was developed to collect data on the health workforce situation in the 36 countries. Demographic, socioeconomic and health workforce data were obtained from the July 2013 WHO Global Health Observatory Data Repository23 and from the United Nations Population Prospects, 2012 revision.24 Information on key dimensions of the health workforce and the policy and institutional environment was obtained through a systematic search of key sources, including: government web sites, human resources for health observatories (where available), the HRH Global Resource Centre,25 the World Bank Health, Nutrition and Population web site26
and the Alliance’s human resources for health country profiles.27 Web searches of key terms were used to complete any gaps in the data set. Where possible, data were verified with key informants from the respective countries.
• The data obtained were used to construct the country profiles, with proxies established for the availability, accessibility, acceptability and quality of the health workforce. Density of skilled health professionals was calculated by dividing the aggregate of skilled health professionals (latest available data) by the population of the country in 2010. A set of “traffic light” indicators was produced to assess the evidence collected on each dimension of the quality of human resources for health (accreditation, regulation and licensing) and human resources for health governance (leadership and partnership, policy and management and strategy and finance). Annex 1 presents further information on this process and describes the grading criteria.
• A structured search was developed to collect data on universal health coverage status in the 36 countries, using government, the World Bank and UHC Forward web sites. Key informants, including WHO staff members, reviewed the data. This is presented in Annex 3: UHC status in 36 profiled countries.
• The World Bank and WHO prepared contributions for boxes and panels presented in the report, drawing on secondary data.
• Country and international data sets were analysed using Excel and STATA.
The mixed methods result in a snapshot of the human resources for health dimensions and policy context across 36 low-, middle- and high-income countries. This enables the report to launch a discussion on the trends and emerging issues in the context of universal health coverage.
2.2 Data sourcesThe report is informed by existing workforce data and an extensive desk review of human resources for health in 36 countries and their potential relationship to attain, sustain or accelerate progress on universal health coverage. Both existing data and available literature present limitations in enabling a definitive analysis of country context, but they do facilitate the development of a reasonably accurate picture of the health workforce and of the challenges it

7METHODS
faces. We present examples of limitations to alert readers to the need for caution in interpreting available data.
First, the report relies on the health workforce figures collected by WHO through a data-mining process from officially published records that is subsequently collated in the Global Health Observatory. We accessed the data for 193 countries in the WHO update of July 2013,23 converting this to a user-friendly spreadsheet (see Annex 4: Workforce data for 193 countries (adapted from the WHO Global Health Observatory Data Repository). Although these data are more reliable and consistent than previous versions, we identified several important issues that limit analysis of all human resources for health.
• Data on health workers tend to be more complete for the public sector and may underestimate the active workforce in the private, military, nongovernmental organization and faith-based health sectors.
• Data is mostly on the traditional, more highly skilled professions, which masks the skill mix across countries, such as associate clinicians, advanced practitioners, auxiliaries and community health workers.
• Official data are not reported annually in all countries, and the dataset therefore has year-on-year gaps.
• Categorizing health workers according to the International Labour Organization’s International Standard Classification of Occupations (ISCO) may result in differing national job titles – with different education pathways, competencies and qualifications – being defined as equivalent to the international definitions and occupational classifications of a midwife or a nurse. This equivalency is then carried into the grouping of “skilled health professionals” of midwives, nurses and physicians and may also inform reporting of “skilled birth attendants” (Box 2).
• Updated figures on variation in the density of human resources for health at the subnational level are not consistently available, so these data had to be collated through other sources, which were heterogeneous in scope, methods and depth. Footnotes in the country profiles provide further details on the composition of the skilled health professionals used to estimate the corresponding density for each country.”
Second, although the review draws from both published and grey literature and includes quality review mechanisms with key informants and the Technical Advisory Group, there is still an implicit limitation in the capacity of a literature review to give justice to the complexities of human resources for health policy, planning and implementation within countries.33 The grading of evidence against structured criteria is used to compile the country profiles, but this is an indicative measure of a country’s policy and strategy environment and should only be interpreted as such. Evidence in the country profiles does not measure
Photo credit: Save the Children

8 A UNIVERSAL TRUTH: NO HEALTH WITHOUT A WORKFORCE
the “implementation strength”34,35 (such as the extent to which the policy or strategy was implemented since its adoption, and/or its success, or lack thereof, in strengthening the health workforce), since, with a few exceptions, this level of evidence is not available from the literature in most of the countries profiled here; field work would be needed to assess the degree of implementation and results obtained.
Rather the evidence allows an objective assessment of whether policy-makers are responsive to the issue under observation. In the countries where there is additional evidence, through regular monitoring and evaluation or specific
research, and this is available in the public domain, implementation challenges are more likely to be reported and therefore more likely to inform the grading exercise. Countries that have not benefited from monitoring, evaluation and research to produce additional evidence may therefore be graded as having in place conducive policies, when in reality the governance of human resources for health and policy implementation may be experiencing considerable challenges.36 Further efforts at measuring progress in the development of human resources for health towards the progressive realization of universal health coverage should be tailored to both the different realities and the different information basis currently available in countries.
WHO defines a skilled birth attendant as “an accredited health professional – such as a midwife, doctor or nurse – who has been educated and trained to proficiency in the skills needed to manage normal (uncomplicated) pregnancies, childbirth and the immediate postnatal period and in the iden-tification, management and referral of complications in women and newborns”.28 The Global Health Observatory, like the International Standard Classification of Occupations, reports midwifery and nursing personnel as skilled professionals but clearly separates the two groups. Neither specifies the level of education corresponding to these occupational titles. Whereas midwives are specifically educated to manage pregnancies and deliveries, not all nurses have the required competencies. As a result, exact figures of how many skilled birth attendants are available in a country are difficult to obtain. This is particularly the case in countries with no separate identifiable category of “midwife”.
For example, in Portugal, all nurses have a four-year training programme that enables them to deliver general nursing care but not to be a skilled birth attendant. Only after an additional two-year specialization in maternal health and obstetrics can a nurse be considered a skilled birth attendant. In 2012, of 65 467 nurses registered in Portugal, only 2947 were recognized as enfermeiro especial-ista em saúde materna e obstétrica (nurse specialized in maternal health and obstetrics) and can be categorized as a skilled birth attendant.29 Since the training of midwives was abolished in 1982, only a few of the older category of “midwives” remain in practice, and this category of skilled birth attendant is in the process of disappearing as the individuals reach retirement. For physicians, the
number of registered gynaecologists and obstetricians is known but not disaggregated to make it possible to estimate how many actually attend births and what percentage of their available working time this constitutes.
In sum, for an OECD country like Portugal, it is not possible to establish the number of skilled birth attendants. Portugal is one among 58 countries of all levels of economic development, for which the 2013 World Health Statistics does not report data for midwives and nurses. Counting midwives and nurses is notoriously difficult because the definitions and level of education vary greatly from one country to another. The International Confederation of Midwives has a clear definition of midwife,30 adopted by WHO and UNFPA, and the categorization by the International Standard Classification of Occupations makes clear the distinction between midwives, nurses, auxiliary midwives and auxiliary nurses. Nevertheless, few countries apply these distinctions rigorously. Counting skilled birth attendants is an even greater challenge.31,32 Demographic and Household Surveys enquire about who assisted at childbirth, but there is some concern that this introduces a bias in reporting by incorrectly determining the difference between a midwife, nurse or auxiliary. The current difficulties in standardized reporting therefore call into question the validity of the number and density of skilled birth attendants as a proxy indicator for progress on Millennium Development Goal 5.
BOX 2 What is a skilled birth attendant?

9WHAT ARE THE HUMAN RESOURCES FOR HEALTH DIMENSIONS OF UNIVERSAL HEALTH COVERAGE?
Universal health coverage has enjoyed rising global attention since 2008, resulting in a prolific evidence base and commentary on its dimensions, characteristics, benefits and potential impact,37–54 The World Health Report 2013 55 being a recent addition to the debate. Informed by The World Health Report 2010 43 and Evans et al., 56 this Forum report understands universal health coverage as “the goal that all people obtain the health services they need without risking financial hardship”. This involves increasing the share of costs covered from pre-paid pooled funds, increasing the share of people covered and increasing the number of services included.
WHAT ARE THE HUMAN RESOURCES FOR HEALTH DIMENSIONS OF UNIVERSAL HEALTH COVERAGE?
CHAPTER 3
Photo credit: Julien Harneis
10 A UNIVERSAL TRUTH: NO HEALTH WITHOUT A WORKFORCE
An appropriate measurement framework for universal health coverage is still under discussion, given the difficulty of accurately assessing “what services every individual needed, whether they received them, at what level of quality, and at what cost in relation to their income”. 56 Measurement may therefore include composite indicators and tracers as proxies for overall coverage, including a focus on maternal, neonatal and child health as a litmus test for overall progress. An agreed measurement tool will add enormous value to universal health coverage policy and planning, hopefully including measuring human resources for health. In the interim, we follow Evans et al.56 in defining universal health coverage as “when people obtain the health services they need and benefit from financial risk protection”.
This report does not expand on the case for universal health coverage, which has already been well established by the evidence cited above, the World Health Assembly resolutions,57,58 the United Nations General Assembly Declaration and most eloquently by Margaret Chan, WHO’s Director-General, who describes it as the “ultimate expression of fairness”59 and by Jim Yong Kim, President of the World Bank, who noted in an address to the 2013 World Health Assembly that “the growing momentum for universal health
coverage coincides with a new chapter in the global fight against poverty.” The focus is instead on the human resources for health implications of universal health coverage – what kind of health workforce is required to attain, sustain or accelerate progress so that all people – rich and poor – can access, use and, most importantly, obtain the high-quality health services they need. For instance, reducing financial barriers may stimulate demand for services for which the existing stock of health workers is insufficiently prepared and result in reducing patient time with health providers, the quality of care and patient satisfaction and potentially affecting health outcomes. This is the concept of effective coverage as defined by WHO and others60,61 – the proportion of the population obtaining
effective, quality care in relation to need – with specific focus on promoting and attaining equity.62-67
However, individual need is subjective, influenced by multiple factors and subject to ethical considerations and rationing. Hence a health benefits package is often determined (and included in constitutional legislation in some instances) in relation to demographics, the burden of disease and policy priorities to equitably distribute health services in relation to population need.68 The principles of universal health coverage and the right to health apply universally (progressive realization, non-discrimination, participatory decision-making, giving priority to vulnerable groups, etc.), but countries will also need to determine specific population needs and priorities. The precise scope of universal health coverage may therefore vary across countries and over time. Essential services for all are a given, but countries seeking to expand a package of care that addresses a high burden of either communicable diseases or maternal, neonatal, infant and child morbidity and mortality will require a workforce configuration and skills mix that is tailored accordingly and different than in countries whose extended package of care is primarily related to a growing epidemic of noncommunicable diseases or an ageing population requiring long-term care. Equally, the challenges inherent to providing urban services are different to those associated with ensuring an equitable supply of health services to rural areas. Similarly, a government with a health purchasing power of US$ 1000 per capita may give priority to and extend differing, and broader, benefits than a government tasked to manage on less than US$ 80 per capita.
The implications of universal health coverage for health workforce governance are therefore relatively straightforward, even if the universal health coverage literature to date is largely silent on this issue. What health workforce is required to ensure effective coverage of an agreed health benefits package that is responsive to population needs and policy priorities? Further, what health workforce is required to progressively expand effective coverage and the benefits package over time, accounting for changes in population needs and expectations, social determinants of health, burden of disease, technologies, financial resources and stocks and flows of health workers? Policy-makers should adopt a forward-looking planning approach, informed by scanning exercises of long-term perspectives and needs in health
The principles of universal health coverage and the right to health apply universally, but countries will also need to determine specific population needs and priorities.

11WHAT ARE THE HUMAN RESOURCES FOR HEALTH DIMENSIONS OF UNIVERSAL HEALTH COVERAGE?
systems,69–74 human resources for health75–80 and education and training.81 In simpler terms, how does a country produce and sustain a health workforce that is both fit for purpose and fit to practice in support of universal health coverage?
The health workforce is part of the chain of inputs, processes, outputs, outcomes and impact needed to supply efficient and effective health services and produce good health. Human resources (be they community-based or facility-based, clinical, administrative, managerial, education or research- oriented) cannot be considered in isolation from the infrastructure, equipment, medicines, consumables and financial resources that create an enabling or positive practice environment that interacts with communities and individuals. All are equally essential in the complex, adaptive structures that are health systems. Nevertheless, the centrality of the health workforce in enabling demand for and delivering health care is recognized as the core of dynamic, local health systems 82–86 – it is “the backbone and limbs of the health care sector”87 – and hence is the starting-point for aligning supply with need and demand.
To reinforce the central role of human resources for health, we use a conceptual framework22,88 (Fig. 1) that considers the four critical dimensions of human resources for health: availability, accessibility, acceptability and quality. The availability, accessibility, acceptability and quality dimensions are at the core of the concept of effective coverage, the right to health89 and the social protection floors agreed by ILO Member States, and these collectively reinforce the universal health coverage agenda. At the simplest level, without health workers, there can be no health services. The availability of health workers is therefore the primary determinant of and a necessary condition for effective coverage, but the principles in the right to quality of health services and people-centred care across the life course90 also require full attention to accessibility, acceptability and quality.
Based on the dimensions depicted in Fig. 1, we are able to expand the appreciation of whether a workforce is fit for purpose and fit to practice. A fit-for-purpose health workforce91–97 should have the competencies and quality standards required to meet the current and anticipated future population needs and achieve the intended policy outcomes. The concept translates to whether
the availability, accessibility, acceptability and quality of the workforce are collectively able to deliver, both now and in the foreseeable future, effective coverage of the services required: that is, to attain, sustain or accelerate progress on universal health coverage and the principles and obligations of the right to health. Human resources for health governance subsequently requires due attention to the stock, skills mix, distribution, productivity and quality of the workforce (the supply) in relation to population needs and to enabling demand for and utilization of the health benefits package on offer.
Most importantly, a health workforce fit for purpose is a contextual consideration, correlated with the dimensions of geography, demography, population coverage,
Availability of HRH
Accessibility to HRH
Acceptability of HRH
service utilization
Quality of HRH
Population + health needs: Who is provided EFFECTIVE COVERAGE?
EFFECTIVE COVERAGE GAP
Theoretical coverage by ‘availability’ of health workforce
FIGURE 1 Human resources for health: availability, accessibility, acceptability, quality and effective coverage
Source: adapted from Campbell et al. 22 and Campbell et al. 88.

12 A UNIVERSAL TRUTH: NO HEALTH WITHOUT A WORKFORCE
the health benefits package and financial affordability. There is therefore no one-size-fits-all approach to determine appropriate workforce supply (including workforce density thresholds). However, there are common issues and challenges in the governance, management and reward of the health workforce to ensure that it coordinates, manages and provides the required range of health promotion, disease prevention, curative, rehabilitative and palliative health services determined by policy-makers. Evidence-informed guidelines and tools are therefore valuable to inform workforce planning and decision-making.
Fit-to-practice health workers require the stewardship of governments and associated agencies to protect the health and safety of the public by providing mechanisms that ensure that health workers are competent to perform their tasks and actually do so in practice. The concept is at the heart of creating trust and confidence between health workers and the wider population, thus enabling and encouraging demand for services. Stewardship is a continuous loop in appraising, monitoring and evaluating human resources and taking appropriate action, acknowledging that “the performance of the health sector is only as good as the performance of the men and women who provide the services”.98 This is effectively the role of good human resources for health governance and human resources for health management, a core function of the health sector.99 Good stewardship is also about ensuring that the workforce itself is fairly treated and valued: has access to continuing education, is rewarded appropriately and on time, and is involved in governance mechanisms.
Fig. 1 and the concepts of fit for purpose and fit to practice come together to inform the human resources for health challenges inherent in universal health coverage in four areas:
• availability – the sufficient supply, appropriate stock of health workers, with the relevant competencies and skill mix that corresponds to the health needs of the population;
• accessibility – the equitable distribution of health workers in terms of travel time and transport (spatial), opening hours and corresponding workforce attendance (temporal), the infrastructure’s attributes (physical – such as disabled-friendly buildings), referral mechanisms (organizational) and the direct and indirect cost of services, both formal and informal (financial);
• acceptability – the characteristics and ability of the workforce to treat all patients with dignity, create trust and enable or promote demand for services; this may take different forms such as a same-sex provider or a provider who understands and speaks one’s language and whose behaviour is respectful according to age, religion, social and cultural values etc.; and
• quality – the competencies, skills, knowledge and behaviour of the health worker as assessed according to professional norms (or other guiding standards) and as perceived by users.
Even though all four dimensions are equally important, there is a logical sequence in addressing them, as Fig. 1 implies. Without sufficient availability, accessibility to health workers cannot be guaranteed; and even if availability and accessibility are adequate, without acceptability, the population may not use health services; finally, when the quality of health workers is inadequate, the effects on services in terms of improving health outcomes will be suboptimal. The result of the causal chain is then evident: the proportion of the population obtaining effective, high-quality care in relation to need will be reduced.
The availability, accessibility, acceptability and quality dimensions were used to inform a stocktaking analysis of human resources for health in the sample of 36 low-, middle- and high-income countries featured in this report. For universal health coverage, available evidence was reviewed to determine population coverage, the health benefits package and the level of financial protection (see Annex 3: UHC status in 36 profiled countries). The results of the human resources for health stocktaking are provided in the individual country profiles in Section 7 of this report and discussed in more detail in the next chapter.

13PROGRESS ON HUMAN RESOURCES FOR HEALTH IN THE DECADE OF ACTION SINCE 2006
Four questions will guide our assessment of progress since The World Health Report 2006,12 with findings categorized according to the availability, accessibility, acceptability and quality dimensions.
• What are the emerging trends and messages with regard to the availability, accessibility, acceptability and quality dimensions and their determinants?
• What are the key drivers and policy levers under each of the availability, accessibility, acceptability and quality dimensions?
• Which are common issues across (a) the 36 profiled countries and (b) in the 57 countries with low human resources for health density and low service coverage identified in The World Health Report 2006 ? 12
• Which, if any, are the common issues and challenges for all countries?
PROGRESS ON HUMAN RESOURCES FOR HEALTH IN THE DECADE OF ACTION SINCE 2006
CHAPTER 4
Photo credit: DFID

14 A UNIVERSAL TRUTH: NO HEALTH WITHOUT A WORKFORCE
As we try to provide responses to these questions, it is important to bear in mind the limitations of available data and information identified earlier. For example, when we report that there is an accreditation process or that a human resources for health plan has been formulated, we cannot comment further on the reality on the ground. To do this, we would need to go beyond relying on published information and the opinions of key informants and directly observe what actually happens.
4.1 AvailabilityThe agenda since the Joint Learning Initiative report of 2004 and The World Health Report 200612 has been largely dominated by the issues of availability of the qualified workforce (such as stock and distribution issues; in particular, the density of midwives, nurses and physicians) and international migration from lower-income to higher-income countries, culminating in the adoption of the WHO Global Code of Practice on the International Recruitment of Health Personnel
Health professional dual practice – the practice of holding jobs in the public and private sector at the same time (also referred to as dual employment, multiple job holding and, when unregulat-ed: moonlighting) – is a widespread phenomenon in countries of all levels of economic development and with implications for the equity and quality of health care provision.106 Dual-practice possibilities are driven by the nature of the health worker labour market; low-density or poor areas offer little prospect of dual practice compared with more affluent urban areas – and as such, the perceptions of higher dual-practice opportunities in urban compared with rural areas become an important contributor to geographical maldistribution.
Dual practice among physicians has been reported to be as high as 89% in Egypt, more than 80% in Bangladesh, around 35% in Vietnam and 50% in Chad. It is also reportedly common in many other countries whether it is formally sanctioned or not.107
Whether governments should authorize dual practice among health professionals remains debated; in part, this is informed by recognition that in some countries individual workers use dual practice as a coping mechanism to allow them to earn a living
wage. The determinants and the effects of dual practice need to be better understood to inform policies to manage it. Supporters of dual practice argue that it allows governments to recruit and retain high-quality doctors at reduced cost, improves access to health care and increases health worker income and professional practice. Those against dual practice claim that it leads to fewer and poorer-quality services in the public sector and directs higher-paying patients and inducing demand towards more and better services in private practice while adding financial burden on consumers.
The common assumption is that dual practitioners maximize profit (or income). Indeed, evidence from Viet Nam demonstrates that physicians almost double their total pay through the dual-practice gains. However, the income maximization approach does not fully explain the health workers’ decision to engage in dual practice, since broader professional preferences may influence this behaviour. For example, dual practice has been described as a coping mechanism and cited as a result of the gap between professionals’ expectations and what the public sector can offer either in terms of pay or practice environment.108 More evidence is required that assesses the impact of dual
practice or providing comparisons of the performance of health workers engaged in dual practice to those practising exclusively in the public or private sector.
Policies to manage dual practice range from a complete ban (such as China) to unrestricted allowance (such as Bangladesh and Egypt), restricted allowance (such as Kenya and Zambia), exclusive contracts (such as Italy, Spain and Portugal) and self-regulation (such as the United States of America). There are countries where dual practice, mainly of senior doctors, is recognized, regulated and coordinated (such as Australia and England) or Bahrain and France, which allow private practice in public hospitals. The optimal policy to regulate dual practice will depend on the country’s health policy objectives, its health funding system, the dynamics of the health labour market and the ability of the governments to enforce regulations and monitor private sector activity.
Source: personal communication, Edson Araújo, World Bank.
BOX 3 Health professional dual practice
15PROGRESS ON HUMAN RESOURCES FOR HEALTH IN THE DECADE OF ACTION SINCE 2006
(henceforth the Global Code) in 2010.15 Other issues such as poor working conditions100 and support systems,11 the quality of education81 and the role and future of regulation101 have been identified, but they have received attention only more recently.
Availability is influenced by a country’s capacity to school, graduate and incentivize young people (boys and girls) with the appropriate knowledge base to enter educational programmes within the health professions and later the health care labour market, and to retain them. In many countries, gains can be obtained without training more health workers by reducing attrition to other sectors or to other countries.100
The knowledge base on the availability of health workers has increased considerably thanks to a growing volume of research, reflected in the hundreds of publications on the topic, and to the creation of a network of human resources for health observatories.102 Nevertheless, very few countries have a
comprehensive and valid information base on the number of practising health workers.103 Human resource information systems are weak in many countries,104 and WHO has developed a new assessment tool to address structural deficiencies.105 For example, many countries do not have unique identification numbers to avoid double counting and to track the movements of health workers or do not differentiate between those who actually practise and those who do not. In addition, many countries estimate the stock of health workers through a headcount rather than by taking into account their full-time equivalents (especially important, since the time devoted to work varies according to age, sex and professional profile) and do not estimate the flows in and out of the sector. More is becoming known about the availability of workers in communities and in private services, but data are not always reported officially. Where professional registration or licensing is compulsory, estimates can be made from supplementary sources such as live registries of licensed professionals, but their value depends on the quality of the source data (for example, in some countries it is cumulative and contains the names of deceased practitioners or of
FIGURE 2 Frequency of all country reporting of workforce data to WHO’s Global Health Observatory (1990–2012) and a focus on 57 low-density and low-coverage countries (2008–2012)
Source: Global Health Observatory Data Repository.23
0 10 20 30
5th
4th
3rd
2nd
1stGove
rnm
ent H
ealth
Exp
endi
ture
(%) Q
uint
ile
21.08
17.72
9.72
11.70
8.74
0
20
40
60
80
100
1990 1991 1992 1993 1994 1995 1996 1997 1998 1999 2000 2001 2002 2003 2004 2005 2006 2007 2008 2009 2010 2011 2012
Countries reporting midwives
Countries reporting nurses
Countries reporting physicians
Data points for 57 low density/low coverage countries (2008-2012)
No data
1 data point
2 data points
3 data points
4 data points
5 data points
6 data points
7 data points
8 data points
9 data points
17
15
15
3
3
7
1 14
Num
ber o
f cou
ntrie
s

16 A UNIVERSAL TRUTH: NO HEALTH WITHOUT A WORKFORCE
others who have left the country). Rarely is information available on inactive or inexistent health workers (sometime referred to as “ghost workers”) or on dual employment in public and private sectors, a practice with potentially important effects on the availability of and accessibility to health workers (Box 3).
The WHO Global Health Observatory reports workforce data for 186 countries in its July 2013 revision. The data inform international publications and analysis, including reporting on human resources for health progress – such as the G8’s 2013 accountability report.109 Given the potential impact of how the data in this global repository are used and interpreted, it is critical to be aware of the frequency and periodicity of country reporting in the stocktaking analysis that follows. Fig. 2 captures an overview of all country data (1990–2012) and highlights the availability of data from the 57 countries with low density and low coverage in the past five years (2008–2012).
The number of countries publishing official data on a regular and consistent basis and making them available to the WHO Global Health Observatory is low; this consideration applies to most countries, and not just the ones with low human resources for health density. Colombia, Cuba and Turkey are examples of exceptions where published government or official data are available annually across the period 1990–2010. The majority (53%) of countries have fewer than seven data points (one reported figure for any of the three professions in any year) in the past 20 years. Both the frequency and periodicity of data limits comparison of progress over time. Despite a decade of action called for in The World Health Report 2006 12, the number of data points declines from 2004 (the year WHO led a focused effort to capture data on the health workforce to inform The World Health Report 2006). For the 57 countries with low human resources for health density and low service coverage identified by The World Health Report 2006, where workforce challenges were considered acute, the median year of the most recent human resources for health data is 2008. A total of 70% (n = 40) of countries have at least one data point in the past five years (2008–2012); this figure declines to 21% (n = 12) if we review only the past three years (2010–2012). The strengthening of human resources for health governance requires concerted efforts to publish, report and disseminate workforce data as a priority. Any research and analysis commenting on the “latest” available data from a country should therefore be subject to scrutiny.
Fig. 3 presents the density of skilled health professionals (midwives, nurses and physicians) for 186 countries grouped into density quintiles highlighted in different colours. Countries marked in light green are the 36 profiled countries; their distribution on the density scale closely coincides with the diversity across all countries and confirms the selection exercise to assess countries from all regions with differing densities and other characteristics (such as population and public health expenditure).
The horizontal lines correspond to three density thresholds (22.8, 34.5 and 59.4 per 10 000 population) purposively selected to highlight the variation in workforce availability in 2013. The thresholds (often referred to incorrectly as benchmarks)
FIGURE 3 Density of skilled health professionals per 10 000 population (all countries and the 36 profiled countries)
10
20
30
40
50
60
70
80
5th
4th
3rd
2nd
1st
GDP
(PPP
) Qui
ntile
30
-10
-5
0
5
10
15
-10
-5
0
5
10
15
-10
-5
0
5
10
15 Ratio of low to average density
Ration of high to average density
Afghanistan
Afghanistan
BangladeshBrazil
ChinaCuba
England
EthiopiaYe
men
ThailandFij
i
France
Ghana
HungarySpain
South Africa
India
IndonesiaJapan
Kyrgyzs
tan
Mozambique
Nepal
NicaraguaOman
Peru
Philippines
Senegal
0
50
100
150
200
250
0
50
100
150
200
250 pc
quintile5
quintile4
quitinle3
quintile2
quitile1
pc2
place
0
50
100
150
200
250pc
quintile5
quintile4
quitinle3
quintile2
quitile1
pc2
place
0
50
100
150
200
250pc
quintile5
quintile4
quitinle3
quintile2
quitile1
pc2
place
Countries in the first quintile
Countries in the third quintile
Countries in the fifth quintile
Countries in the second quintile
Countries in the fourth quintile
Profiled Countries
Countries (n=186)
0 20050 100 150
Threshold
34.5/10,00022.8/10,000
59.4/10,000D
ensi
ty o
f ski
lled
heal
th p
rofe
ssio
nals
per
10
000
popu
latio
n

17PROGRESS ON HUMAN RESOURCES FOR HEALTH IN THE DECADE OF ACTION SINCE 2006
are not to promote targets that a country should or must achieve but to illustrate the pattern within the overall global picture. The first threshold of 22.8 per 10 000 population arose from the early work of the Joint Learning Initiative in 2002–2004 and was further developed in The World Health Report 2006 12 to partly illustrate the global workforce crisis. However, it is often forgotten that the “crisis” category refers to two dimensions: a density of skilled health professionals of less than 22.8 per 10 000 population and less than 80% coverage rate for deliveries by skilled birth attendants: thus, low human resources for health density and low service coverage. Box 4 provides an overview of the origins of this threshold, its underpinning logic and its limitations.
The second threshold of 34.5 skilled health professionals (midwives, nurses and physicians) per 10 000 population arises from research conducted by the International Labour Organization in support of its regulation on Social Protection,3,117 the World Social Security Statistics 2010/2011118 and a background paper for The World Health Report 2010.119 The threshold indicates the modelled estimates of workforce requirements, termed as a staff access deficit indicator, to address access deficits in population coverage of an expanded health benefits package.120
A final threshold of 59.4 skilled health professionals (midwives, nurses and physicians) per 10 000 population was introduced in the context of visioning the workforce requirements that are inherent in the Ending Preventable Maternal Deaths initiative: a target-setting exercise coordinated by WHO and the United States Agency for International Development to reduce global maternal deaths to 50 per 100 000 live births by 2035.121 The analysis has identified the maternal mortality ratio achieved by Mexico (50 per 100 000 live births) as a feasible target for 2035. The 59.4 skilled health professionals per 10 000 population is the skilled workforce configuration Mexico uses to achieve this maternal mortality ratio.
The same caveats about the density threshold approach that are examined in Box 4 apply to these other thresholds, even though their methodological lim-itations are not discussed here. It is important to understand that these are not benchmarks, as workforce density is not an end in itself but a means to improve health. The thresholds are used here to emphasize that discussion is needed on what is the workforce requirement to accelerate reductions in maternal (and neo-natal) mortality as a tracer within the broader universal health coverage objective.
Using these three thresholds, of 186 countries with available data:
• 83 countries (44.6%) do not currently meet the 2006 World Health Report 12
threshold of 22.8 skilled health professionals per 10 000 population (see the discussion later in this section for more details);
• 17 countries (9.1%) surpass this threshold but not the ILO one of 34.5 skilled health professionals per 10 000 population;
• 18 countries (9.7%) meet the ILO threshold but not the threshold of 59.4 skilled health professionals per 10 000 population; and
• 68 countries (36.6%) reach or exceed the latter.
This simplified picture (Fig. 4) of workforce availability does not purport to address productivity and performance. However, of note is that 83 countries are below the 22.8 threshold and 100 countries (53.8%) below the ILO one identified
Photo credit: O. Monsen
18 A UNIVERSAL TRUTH: NO HEALTH WITHOUT A WORKFORCE
The World Health Report 2006 12 presented an estimate of 22.8 midwives, nurses and physicians per 10 000 population as a threshold to achieve relatively high coverage for essential health interventions in countries most in need. The threshold was a product of a needs-based approach applied to the best available data for 193 countries, to estimate health workforce requirements to achieve an 80% coverage rate for deliveries by skilled birth attendants. This analysis calculated a global shortage of 2.4 million midwives, nurses and physicians among the 57 countries falling both below the human resources for health threshold and the 80% coverage rate.
The appeal of these estimates served the dual purpose of translating the critical issue of health workforce in the language of the Millennium Development Goals and making the case for additional resources and specific policies within organizations, governments and multinational organizations.110 The World Health Report 2006 12 clearly stated that “these estimates are not a substitute for specific country assessments of sufficiency, nor do they detract from the fact that the effect of increasing the number of health workers depends crucially on other determinants such as levels of income and education in the community”.111,112 Inadvertently, the threshold estimate was perceived as a strategic planning target and proved to be unrealistic as a short- or medium-term goal for many low- and middle-income countries. For example, Bossert & Ono110 estimated that funding the proposed number of health workers would require some countries to devote 50% of their gross domestic product (GDP) to health.
Several critiques followed to question the viability of the threshold estimate. Scheffler & Fulton113 argued that the bivariate model used, relating the outcome of interest to the density of health workers, was simplistic and sensitive to which health coverage is under consideration. Secondly, using simple bivariate association omits key socioeconomic correlates, thereby biasing the results.113,114 Further still, Fulton et al.115 showed that including additional variables – such as geographical characteristics – that affect the relationship between the number of health workers and health care service utilization measures can raise estimates. Third, studies using cross-sectional data modelling are limited in establishing a causal effect (in this case, an increase in the health workforce density is claimed to result in improving the health outcome in question). Despite the critiques, strong evidence indicates a link between density and health outcomes, as shown by Farahani et al.,114 who used longitudinal panel data from 1960 to 2000 for 99 countries and a dynamic regression model to obtain estimates of the effect of both short-run and long-term changes in the number of physicians per capita on infant mortality. They reported a substantial long-term effect of physicians’ density on the reduction in infant mortality.
Repeating the bivariate analysis with recent data (WHO Global Health Observatory, 2012 update23) indicates a lower estimate of 16.5 per 10 000 population and a halving of the shortage estimate to 1.12 million. In the absence of controls for any country-specific factors in the 2006 analysis and the repeat of that in 2013, these estimates should be treated with caution, and whether the lower values indicate real improvements cannot be determined.
On a positive note, and despite its limitations, The World Health Report 2006 12 yielded a threshold that generated a great deal of attention to the global health workforce crisis. It was not meant to inform decision-makers about the optimal distribution of health workers in their country nor was it meant to be a strategic planning target. The threshold and the publications that have commented since have helped to draw attention to the fact that more questions need to be addressed. It was always recognized that there are more sophisticated methods of determining needs, yet these require more comprehensive and timely data on all health workforce densities (beyond midwives, nurses and physicians) and also on key correlates such as health care utilization and health outcomes. This could inspire a research agenda on how critical health outcome indicators can be brought together in a composite or determin-istic index against which thresholds can be set. WHO needs to do more work to establish a human resources for health research agenda, strengthening metrics and benchmarks and facilitating new thinking; classifying countries into “crisis” or “non-crisis” may be something of the past.
Source: personal communication, Amani Siyam and Ties Boerma, WHO.
BOX 4 The density threshold of 22.8 skilled health workers per 10 000 population: origins, logic and limitations

PROGRESS ON HUMAN RESOURCES FOR HEALTH IN THE DECADE OF ACTION SINCE 2006 19
FIGURE 4 Workforce to population ratios for 186 countries
Group 1: density of skilled workforce lower than 22.8/10 000 population and a coverage of births attended by SBA less than 80%
Group 2: density of skilled workforce lower than 22.8 /10 000 population and coverage of births attended by SBA greater than 80%
Group 3: density of skilled workforce lower than 22.8/10 000 population but no recent data on coverage of births attended by SBA
Group 4: density is equal or greater than 22.8/10 000 and smaller than 34.5/10 000
Group 5: density is equal or greater than 34.5/10 000 and smaller than 59.4/10 000
Group 6: density is equal or greater than 59.4/10 000
Source: WHO. Global Health Observatory Data Repository23

20 A UNIVERSAL TRUTH: NO HEALTH WITHOUT A WORKFORCE
in the context of a universal health coverage discourse, highlighting the necessity for human resources for health to be considered a global challenge.
Most (70%) of the countries with a density of skilled health professionals of less than 22.8 per 10 000 population and a coverage of births by skilled birth attendants below 80% are in Africa (31 countries, 57%) and in South-East Asia (7 countries, 13%). In South-East Asia, the number of countries below 22.8 per 10 000 population and with a skilled birth attendant coverage below 80% is small, but they are some of the most populous (estimates for 2012): Myanmar (population 52.8 million), Bangladesh (154.7 million), Indonesia (246.9 million) and India (1236.7 million). In contrast, most (11 or 48%) of the countries with a density below 22.8 per 10 000 but with a skilled birth attendant coverage exceeding 80% are in the Americas. Of the 68 countries that exceed the workforce-to-population ratio of 59.4 per 10 000 population, 36 are in the European Region, and none in Africa, where only Algeria, Botswana and Tunisia are above 22.8 per 10 000.
A total of 118 countries (63%) are below the threshold of 59.4 per 10 000 population (Table 1). Two thirds of the world’s countries may therefore face considerable challenges in addressing deficits below this indicative threshold. In comparing, for these 118 countries, density of skilled health professionals to GDP (adjusted for purchasing power parity (PPP)) per capita and total health expenditure by government, we found:
• a medium-to-large statistically significant (P < 0.05) positive correlation between workforce density and GDP (PPP) per capita; and
• a small statistically significant (P < 0.05) positive correlation between workforce density and the proportion of total health expenditure undertaken by the government.
Fig. 5 and 6 expand upon these results. Fig. 5 shows the median density of skilled health professionals per 10 000 population for the 118 countries, where these are
FIGURE 5 Median density of skilled health professionals per 10 000 population, countries (n=118) grouped by quintiles of GDP (adjusted for purchasing power parity) per capita
World Bank country classification by income group1
Density of skilled health workforce by 10 000 population
<22.8 22.8–34.4 34.5–59.3 Total
n % n % n % n %
Low income 39 95 2 5 0 0 41 100
Lower-middle income 30 70 6 14 7 16 43 100
Upper-middle income 12 48 7 28 6 24 25 100
High income 2 22 2 22 5 56 9 1000 10 20 30
5th
4th
3rd
2nd
1st
GD
P (P
PP) Q
uint
ile
30
26.05
15.49
8.40
2.73
Median density per 10 000 population
TABLE 1
TABLE 1 Number of countries (n = 118) with a workforce-to-population ratio below the 59.4 per 10 000 population threshold according to the World Bank income classification
1 Available at: http://data.worldbank.org/about/country-classifications

21PROGRESS ON HUMAN RESOURCES FOR HEALTH IN THE DECADE OF ACTION SINCE 2006
grouped into quintiles of GDP (PPP) per capita – the first quintile containing the 22 countries with the lowest GDP (PPP) per capita and the fifth quintile containing the 21 countries with the highest GDP (PPP) per capita.
As Fig. 5 shows, the median density of skilled professionals is higher in the countries with higher GDP (PPP) per capita. From the lowest (first) to the highest (fifth) GDP (PPP) quintile, the median density of skilled health professionals increases by a factor of more than 10. Lower-income countries tend to have smaller workforce-to-population ratios.
Fig. 6 shows the median density of skilled health professionals per 10 000 population for the same 118 countries grouped into quintiles in terms of the proportion (%) of total health expenditure that is made by the government.
From Fig. 6, the 44 countries in the two highest quintiles of total public health expenditure have a substantially higher median density of skilled health
FIGURE 6 Median density of skilled health professionals per 10 000 population, countries (n =118) grouped by quintiles of total health expenditure by the government (%)
0 10 20 30
5th
4th
3rd
2nd
1st
Gov
ernm
ent H
ealth
Exp
endi
ture
(%) Q
uint
ile
21.08
17.72
9.72
11.70
8.74
Median density per 10 000 population
professionals than the 74 countries in the lower three quintiles. Countries in which a high proportion of total health expenditure is made by the government tend to have higher workforce-to-population ratios.
We also reviewed trends in the original 57 countries with both low human resources for health density and low skilled birth attendance coverage identified in The World Health Report 2006.12 The aim was to determine which countries have remained in this category, which ones have moved in or out of it and the dynamics influencing this. We found the following:
• For 3 of the 57 countries there is no skilled birth attendant coverage data for 2011, so they have been excluded from the count (Comoros, Equatorial Guinea and Eritrea).
• For the remaining 54 countries, 6 (Benin, Congo, Democratic Republic of the Congo, El Salvador, Iraq and Peru) indicate that skilled birth attendant coverage increased above 80% in 2011 and thus they exit the group of countries with low human resources for health density and low service coverage.
• Six countries (Bolivia, Cape Verde, Guatemala, Solomon Islands, Timor-Leste and Vanuatu), however, now indicate that skilled birth attendant coverage has dropped below 80% and thus they enter this category of low human resources for health density and low service coverage.
There is therefore a change in the composition of countries grouped as low human resources for health density and low service coverage, and this is due exclusively to changes in coverage of skilled birth attendance. Although workforce challenges in the countries listed above may or may not have changed in the period from 2004 to the latest year with available data, these countries have witnessed differing trends in coverage with the workforce configurations they have. This reinforces the limitations, described in more depth in Box 4, of relying on a crude density threshold for planning and monitoring purposes.
Of interest, rather, is what is influencing these changes in density and productivity. The latter is beyond the scope of this report and additional
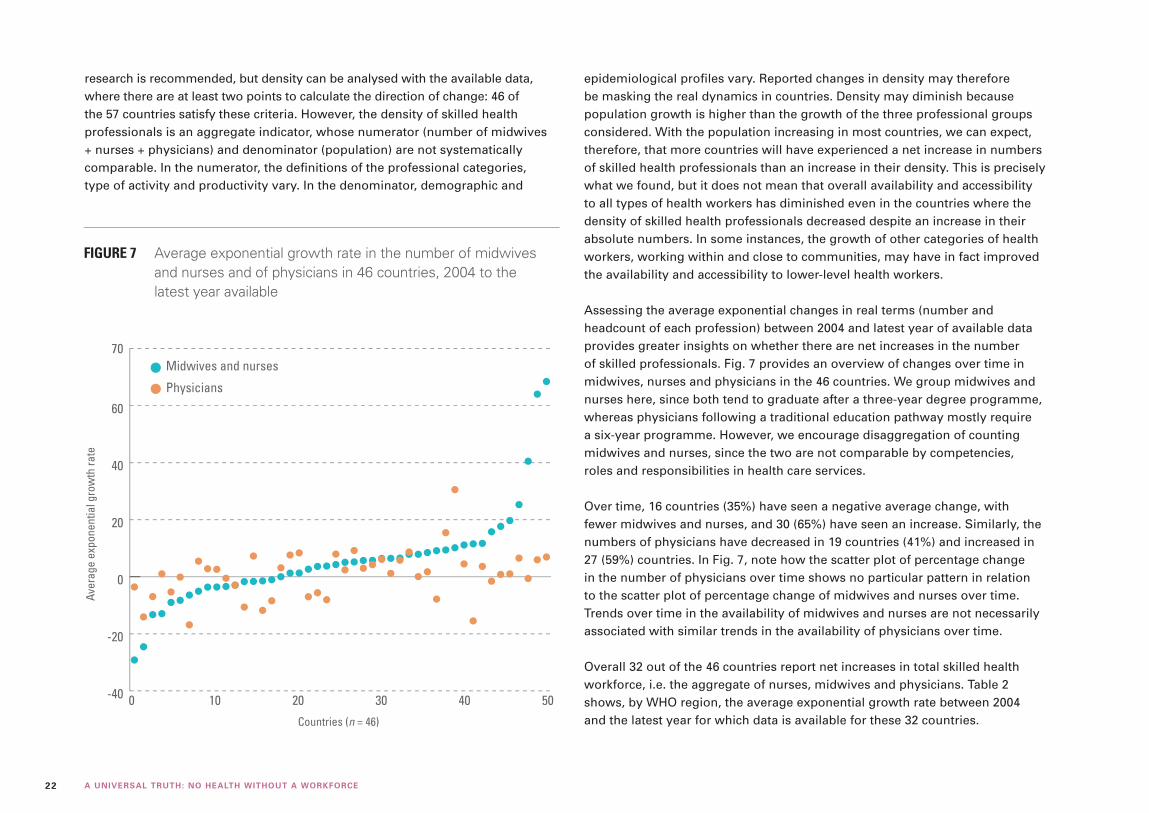
22 A UNIVERSAL TRUTH: NO HEALTH WITHOUT A WORKFORCE
research is recommended, but density can be analysed with the available data, where there are at least two points to calculate the direction of change: 46 of the 57 countries satisfy these criteria. However, the density of skilled health professionals is an aggregate indicator, whose numerator (number of midwives + nurses + physicians) and denominator (population) are not systematically comparable. In the numerator, the definitions of the professional categories, type of activity and productivity vary. In the denominator, demographic and
epidemiological profiles vary. Reported changes in density may therefore be masking the real dynamics in countries. Density may diminish because population growth is higher than the growth of the three professional groups considered. With the population increasing in most countries, we can expect, therefore, that more countries will have experienced a net increase in numbers of skilled health professionals than an increase in their density. This is precisely what we found, but it does not mean that overall availability and accessibility to all types of health workers has diminished even in the countries where the density of skilled health professionals decreased despite an increase in their absolute numbers. In some instances, the growth of other categories of health workers, working within and close to communities, may have in fact improved the availability and accessibility to lower-level health workers.
Assessing the average exponential changes in real terms (number and headcount of each profession) between 2004 and latest year of available data provides greater insights on whether there are net increases in the number of skilled professionals. Fig. 7 provides an overview of changes over time in midwives, nurses and physicians in the 46 countries. We group midwives and nurses here, since both tend to graduate after a three-year degree programme, whereas physicians following a traditional education pathway mostly require a six-year programme. However, we encourage disaggregation of counting midwives and nurses, since the two are not comparable by competencies, roles and responsibilities in health care services.
Over time, 16 countries (35%) have seen a negative average change, with fewer midwives and nurses, and 30 (65%) have seen an increase. Similarly, the numbers of physicians have decreased in 19 countries (41%) and increased in 27 (59%) countries. In Fig. 7, note how the scatter plot of percentage change in the number of physicians over time shows no particular pattern in relation to the scatter plot of percentage change of midwives and nurses over time. Trends over time in the availability of midwives and nurses are not necessarily associated with similar trends in the availability of physicians over time.
Overall 32 out of the 46 countries report net increases in total skilled health workforce, i.e. the aggregate of nurses, midwives and physicians. Table 2 shows, by WHO region, the average exponential growth rate between 2004 and the latest year for which data is available for these 32 countries.
FIGURE 7 Average exponential growth rate in the number of midwives and nurses and of physicians in 46 countries, 2004 to the latest year available
Aver
age
expo
nent
ial g
row
th ra
te
-40
-20
0
20
40
60
0 10 20 30 40 50
Midwives and nurses
Physicians
Countries (n = 46)
70

23PROGRESS ON HUMAN RESOURCES FOR HEALTH IN THE DECADE OF ACTION SINCE 2006
With the available data, 18 (56%) have experienced a solid (average exponential growth rate between 1% and 4.9%) or very solid (average exponential growth rate between 5% and 9.9%) rate of growth in the number of skilled professionals. Nine of these countries are in Africa and four in the Eastern Mediterranean. Four countries have seen a low rate of growth (average exponential growth rate lower than 1%), two of which are in Africa. Ten countries have seen an extraordinary (average exponential growth rate greater than 10%) rate of increase in the number of skilled health professionals, most of which are also in Africa. The existence of a few extreme outliers, however, may indicate challenges in validity of data for some countries and reinforces the need to strengthen information systems for human resources for health and to maintain reporting standards constant over time to allow comparability.
These changes in the number of skilled health professionals indicate that most countries are striving to increase health workforce availability. In some cases, however, these efforts are at least partially offset by population growth: Table 3 shows the trend in workforce availability, controlling for population growth in these countries. It shows, for each and over the same time period, the average exponential growth rate in the density of skilled health professionals per 10 000 population.
Of the 32 countries where the number of skilled health professionals has increased, in 6 (19%) the average rate of change in workforce density is negative, and in one country (3%) it is null or near null (less than 1%): in these countries the effect of population growth is such that it counteracts the effect of an increase in the number of professionals on the density of
WHO region
Average exponential growth rate in the number of skilled health professionals
<1% 1–4.9% 5–9.9% ≥10% Total
n n n n n
Africa 2 2 7 8 19
The Americas 0 1 1 – 2
Eastern Mediterranean 0 3 1 1 5
Europe 0 0 0 0 0
South-East Asia 1 0 2 1 4
Western Pacific 1 1 0 0 2
Total 4 7 11 10 32
TABLE 2 Average exponential growth rate in the number of skilled health professionals over time in 32 countries, by WHO region, 2004 to the latest year available
WHO region
Average exponential growth rate in the density of skilled health professionals
Negative Null or near-null (<1%) Positive Total
n n n n
Africa 3 1 15 19
The Americas 0 0 2 2
Eastern Mediterranean 1 0 4 5
Europe 0 0 0 0
South-East Asia 1 0 3 4
Western Pacific 1 0 1 2
Total 6 1 25 32
TABLE 3 Average exponential growth rate in the density of skilled health professionals per 10 000 population over time in 32 countries by WHO region, 2004 to the latest year available

24 A UNIVERSAL TRUTH: NO HEALTH WITHOUT A WORKFORCE
the workforce per 10 000 population. For the remaining 25 (78%) countries, encouragingly, there is a positive average rate of increase in density of the skilled health workforce.
In summary, most countries with available data are reporting increases in the numbers and density of midwives, nurses and physicians: in some of these, however, the net gains in stock are not commensurate with population growth. The universal health coverage process of expanding coverage to a larger proportion of the population therefore requires paying more explicit attention to demographic dynamics, factoring them in human resources for health planning and forecasting exercises.
Some countries have set out to give priority to equity and have built an inclusive system from the start,122 but historical, multicountry evidence using cross-
sectional Demographic and Health Survey data also suggests that many countries that have accelerated progress towards universal health coverage have left the poor and rural population behind.123 However, reported coverage of skilled attendance at birth is improving in some countries, and more detailed analysis is required to assess whether this is translating into quality and improved health outcomes.124
Mobility also determines the availability of health workers. Recent studies on the migration of health professionals125,126 have shown that several high-income countries have been and in some cases remain dependent on foreign workers to avoid shortages of qualified health workers. In England, for instance, up to 35% of registered physicians were foreign-trained. Countries such as Oman, the United Arab Emirates and Saudi Arabia have much higher levels of dependence (above 80%) and have adopted policies to train more nationals, but it will take time before significant effects can be observed. Countries that are financially able to attract health workers from abroad are often those with high expected shortages. In the United States of America, due to the ageing of the health workforce, the growth of demand and the difficulty in recruiting faculty and new students, in particular for nursing care, shortages of 500 000 nurses and of 44 000 family physicians are forecast in 2025.127–129 The impact of the ageing of the workforce leading to increased retirement is also noted in other high-income countries. The European Commission has estimated that shortages across all EU countries will be close to 2 000 000 by 2020.130 Japan is also experiencing shortages, with projections that the domestic supply of physicians will not overcome estimated deficits until 2036.131 The Australian Bureau of Statistics132 reports that the country “is highly reliant on the immigration of doctors and nurses”: Health Workforce Australia projects a reduced supply of up to 109 000 nurses by 2025.133 Even countries with a lower income level have started recruiting abroad; in June 2013, Brazil launched a programme to recruit 6 000 physicians and other professionals in the coming three years.134
The World Health Assembly adopted the Global Code in 2010, but further efforts are required to accelerate its implementation. For example, in the WHO European Region, which reported most progress in implementing the Code in 2013, only 36 of 53 Member States reported any activity, with a few notable exceptions (Finland, Germany, Ireland, Norway and Switzerland), which have been proactively pro-moting the Code and taking measures to implement it. However, much of the
Photo credit: Eva Lopes

25PROGRESS ON HUMAN RESOURCES FOR HEALTH IN THE DECADE OF ACTION SINCE 2006
reported activity was limited to disseminating the Code and encouraging stake-holders to follow its recommendations.135 In Africa, where most low-density and low-coverage countries are, only one country has reported having taken steps to implement the Code. Unfortunately, the richness of the Code, albeit voluntary, is not informing concerted actions.136 Although the Code emphasizes the measure-ment of migration and exchange of information (with regular reporting), it has additional value within its ethical norms and institutional and legal arrangements in support of good human resources for health governance, management and planning.137 Article 6, on data gathering and research, encourages the strengthen-ing of human resource information systems (and other supporting data sources) to determine the stock (or availability) of all health workers. Migration cannot be measured and information exchanged unless baseline data exists on the practising workforce.
4.2 AccessibilityThe dimension of access is at the core of the Alliance’s vision statement: “all people, everywhere, shall have access to a … health worker”. The Alliance’s vision reinforces the importance of having enough and appropriately distributed health workers, close to the communities they serve, and without barriers to access. These issues are part of determining the accessibility to human resources for health which, as discussed in Chapter 3, includes spatial, temporal, physical, organizational and financial components.
For the spatial dimension (such as the geography of human resources for health and workforce distribution in relation to need), which is affected by many factors (including demand for health services in rural areas, education strategies, incentive systems and management support for rural deployment), it is difficult to assess whether this has improved, remained the same or was reduced in recent years because of lack of comparable data over time. The WHO Global Health Observatory includes data on urban-rural distribution, but these are from 2004. Country research from the World Bank and others provides strong evidence that workforce distribution is often inequitable.138 ILO’s research to determine the 34.5 per 10 000 threshold discussed earlier is itself premised on a staff access deficit, such as the stock and distribution of health workers.
Data collated for this report provide further evidence of inequitable distribution. The structured search for each country provided information on subnational
distribution (Fig. 8). We note that the sources are not always government documents, and so we also reviewed national policy and strategy statements. Notwithstanding the heterogeneity in data sources, the clear picture that emerges is that variation in spatial accessibility is an inherent feature and challenge in most countries, echoing the World Bank findings.
The causes of these imbalances are well known. Health professionals generally prefer to settle in urban environments for the same reasons other individuals do: access to better equipped facilities, to networks of colleagues, to continuing education, to better living conditions for their families, to possibilities of work for their spouse and often to private practice to complement low salaries in public services. All 36 countries report that reducing imbalances in the geographical distribution of health workers is an important policy objective. For instance, Thailand has made significant improvements in the last 10 years, with specific policies to deploy health workers in all regions and narrow the equity gap.88,139
With respect to policy tools for improving the equity of health worker distribution, concrete measures vary, although some are more popular than others such as: financial incentives (Afghanistan, England, France, Hungary, India, Mozambique, Nepal, Thailand, Senegal and South Africa), continuing professional and career development opportunities (Australia, England, Hungary and Nepal), prolonging the residency period, introducing periods of training in rural areas (Ghana, Mexico, Philippines and South Africa), and other non-financial incentives – free housing, better diagnostic facilities, security, free access to health care (Mozambique, Nepal and the Philippines).
Which interventions are most effective in addressing inequitable distribution of health workers varies according to time and context. What seems clear is that a multifaceted, comprehensive and flexible approach is needed, as
Most countries with available data are reporting increases in the numbers of midwives, nurses and physicians. In some cases, however, these advances are at least partially offset by population growth.

26 A UNIVERSAL TRUTH: NO HEALTH WITHOUT A WORKFORCE
proposed by WHO in its evidence-informed global policy recommendations on increasing access to health workers in remote and rural areas through improved retention.140 WHO’s recommendation is to put in place a package that would include adjusting educational processes (recruitment of students from underserved regions, decentralizing training, sensitizing new professionals to the needs of rural and remote regions and access to continuing professional development), improving regulation (contracting, reviewing the division of tasks and creating new types of health professionals), offering a mix of financial (bonuses, subsidies and more rapid access to pension) and professional and personal incentives (better supervision, access to the Internet and support for the schooling of children).
Information on how countries are addressing the temporal, physical, organizational and financial components of health workforce accessibility is not abundant from the data reviewed. An analysis of how removing user fees
affects human resources for health141 concluded that the interconnectedness between fee removal and accessibility to a health worker proves difficult to assess, but that in some countries it may increase workloads in rural areas beyond the capacity of the workforce supply. A series in the HRH Journal – “Right time, right place: improving access to health service through effective retention and distribution of health workers” – will start this year and will provide additional insights for policy-makers and planners, potentially covering all five dimensions of accessibility.
Progress reports on human resources for health from WHO in 201033 and the Alliance in 201114 did not address how to measure access to a health worker, despite some commentators calling for a more robust scientific and empirical approach. Proxies were instead chosen, such as whether policies and plans are in place. Nevertheless, governments have core obligations to equitably distribute health services, and universal health coverage calls for focused attention on
FIGURE 8 Ratio of the highest and lowest subnational density of physicians to the national average in 25 profiled countries
-10
-5
0
5
10
15
-10
-5
0
5
10
15
-10
-5
0
5
10
15
Ratio of high to average density
Ratio of low to average density
Afghanistan
BangladeshBrazil
ChinaCuba
England
Ethiopia
Yemen
ThailandFij
i
France
Ghana
HungarySpain
South Africa
India
IndonesiaJapan
Kyrgyzs
tan
Mozambique
Nepal
NicaraguaOman
Peru
Philippines
Senegal

27PROGRESS ON HUMAN RESOURCES FOR HEALTH IN THE DECADE OF ACTION SINCE 2006
inequities and meeting the needs of vulnerable and marginalized populations. The distribution of health workers is recognized as a major impediment to progress in all the reports informing the United Nations Secretary-General’s initiatives on post-2015 and the sustainable development goals and should be addressed.
With advances in geographical information systems, mapping technologies and the geography of health,142–144 the time is now right to reconsider this and measure spatial, temporal and other dimensions of accessibility to a health worker. This is increasingly evident in terms of determining geographical access to facilities offering maternal, child and newborn care145–152 as well as the health professionals within them; the technology can be similarly applied to map the geography of human resources for health and accessibility to all health workers. This approach is used increasingly in OECD countries, and new research supported by the Bill & Melinda Gates Foundation, Norwegian Agency for Development Cooperation, UNFPA, United States Agency for International Development and WHO is integrating workforce-mapping approaches in a state-of-the-art analysis to inform potential application in support of the United Nations Secretary-General’s Every Woman, Every Child campaign.153
4.3 AcceptabilityThe dimension of acceptability introduces the dynamic of how users perceive the health worker and workforce and, by extension, patient choice. Policy and planners cannot rely on the premise that “if you build it, they will come” when locating facilities and deploying health workers within them. The availability and accessibility dimensions undoubtedly influence – but do not guarantee – consumer demand and utilization of health services. Acceptability is enhanced when users of services have access to a health workforce that meets their expectations in terms of its sex and age composition, its skill mix, cultural awareness, attitudes and behaviour, perceived competencies and quality of care (respect, no discrimination, good communication and empathy). The World Health Report 2006 12 defined responsiveness, which refers to these variables as one of the important dimensions of health workers’ performance.
The respectful maternal care agenda (Box 5) encapsulates the importance of acceptability and is embraced by a growing number of organizations.154 It sets objectives and recommends strategies to improve the acceptability of maternal services and thereby increase their utilization.
The creation and expansion of professional groups closer to communities is also seen as a way to make services more accessible and acceptable. Abundant literature shows that communities accept new intermediary professions such as medical assistants, surgery technicians, auxiliary nurses and lay health workers when some conditions are met. These include an enabling and motivating work and regulatory environment as well as adequate basic and continuing training and supervision.155–157 In addition to contributing to acceptability, this type of strategy also improves availability and accessibility at lower costs, providing an example of the adaptive strategies adopted by health systems facing significant shortage or maldistribution challenges because of constrained resources.
In the country profiles, we highlight the sex distribution of physicians and the skills mix of nurses and physicians as proxies for accessibility, primarily since data are more generally available. The sex distribution proxy relates to the evidence that the availability and accessibility of women health care providers is a critical factor in user demand and satisfaction with services in countries and in populations in which being served by someone of the other sex is not culturally
Every woman needs access to skilled health care if she is to be safe during childbirth – but the quality of that care is crucial. Women’s memories of their childbearing experiences stay with them for a lifetime.
Unfortunately, too often, pregnant women seeking maternity care receive varying degrees of ill treatment: from relatively subtle disrespect of their autonomy and dignity to outright abuse – physical assault, verbal insults, discrimination, abandonment or detention in facilities for failure to pay. Evidence is now emerging that this fear of being poorly treated and abused in health facilities is holding women back from seeking help. It is proving to be as great a deterrent as cost of care and transport.
Source: Respectful maternity care: the universal rights of childbearing women.154
BOX 5 Improving acceptability: the respectful maternal care agenda

28 A UNIVERSAL TRUTH: NO HEALTH WITHOUT A WORKFORCE
accepted. This particularly concerns reproductive health services in lower-income countries, where the demographic balance is in favour of men (such as 83% of physicians in India158), whereas in higher-income countries women now form a majority in educational institutions and are gradually becoming a majority of physicians. However, attracting more women medical students is not a guarantee that access to women doctors will improve in the same proportion, as the new graduates do not always enter the labour market or may seek more flexible working patterns in their career paths.
The expectations of users in terms of responsiveness to their cultural specificities can be met through education reforms that promote the acquisition of competencies corresponding to new needs and expectations. Several countries, including China, Egypt and Morocco, have engaged in or are planning education reforms along the lines defined by the Lancet Commission on Health Professionals for a New Century81, which has launched important debates on how to educate health professionals.
4.4 QualityWHO recommends that the measurement of universal health coverage concentrate on determining whether people obtain the high-quality health services they need. The competencies of health workers – their skills, knowledge and behaviour – to meet and deliver quality health services is a major challenge in all countries, however, since quality gaps attributable to health workers are observed everywhere.
Multiple factors influence the quality of the performance of health workers, defined in terms of effectiveness and efficiency. Some are related to the duration and scope of pre-service education or training and whether the institutional and regulatory mechanisms ensure that curricula reflect good practice and current evidence so that graduates attain the competencies and practical skills and experience to be fit for practice. Others relate to the context in which they work, including the quality of infrastructure, equipment and consumables, continuing education and training, regulation, management, supervision, performance incentives and the perceptions of communities and individuals towards them. Linked to the location of practice are the attributes of intrinsic motivation, respectful care and interprofessional and team-based collaboration.
In some high-income countries, such as Australia, England and the United States of America, these gaps are openly recognized and are being addressed.159 Even when well-established quality assurance mechanisms exist, some provider performance is of poor quality, as was recently observed in England.160
Well-known problems such as high rates of nosocomial (hospital-acquired) infections, resulting mainly from poor handwashing habits of workers, still persist. In lower-income countries, quality has often been described as poor in terms of compliance by workers with professional norms and protocols or improper behaviour (lack of respect and rudeness); studies have shown that all categories of health workers are concerned.55 Nevertheless, there are positive examples from countries applying new innovative approaches that reinforce all four dimensions of availability, accessibility, acceptability and quality (Box 6).
The 2013 report of the independent Expert Review Group (iERG) notes with concern that the quality of care (and implicit within this, the quality of health care workers) is “either ignored or sits at the margins of discussions”.90 The iERG also notes the absence of a universally accepted definition of, or indicators for, quality. In the 36 countries profiled, we used the existence of an accreditation system for education institutions and regulatory frameworks for access to professional practice as proxy indicators of conditions that can positively influence the quality of the performance of the health workforce. This option does not substitute for the direct observation of the activities of health workers, but it can at least inform a stocktaking of efforts to assess, maintain and improve quality. In 33 of the 36 countries profiled, some formal or informal mechanism of accreditation of education institutions was in place or being developed. The spectrum includes:
• well-established and legally recognized independent accreditation authorities with a long tradition of setting standards, such as the Australian Medical Council165, the Liaison Committee on Medical Education166 in Canada and the United States of America, the General Medical Council in the United Kingdom167 or more recent ones such as the Caribbean Accreditation Authority for Education in Medicine and other Health Professions;165
• government-managed accreditation systems, such as in Germany (Ministry of Health), Ghana (National Accreditation Board), Hungary

29PROGRESS ON HUMAN RESOURCES FOR HEALTH IN THE DECADE OF ACTION SINCE 2006
Given the acute shortages in the health workforce, several countries have been implementing innovative approaches to overcoming health worker shortages and expanding health coverage.
Expanded role of community health workers. Ethiopia’s Health Extension Program offers a package of basic and essen-tial health services delivered by health extension workers. The Health Extension Program was launched in 2003 and deployed 34 000 government-salaried women health extension workers, who spend about 75% of their time on outreach activities: con-ducting household visits, educating families to adopt healthy lifestyles and serve as model families in their neighbourhood and organizing communities to participate in expanding Health Extension Program services. A 2013 study found that the Health Extension Program improved knowledge of and practices in maternal and newborn health care at scale.161
Workforce innovations in health care delivery models. Yemen has introduced an innovative care model162 to improve access to care for the underserved population, including neglected, vulnerable groups and those living in remote areas or in areas with security concerns. For these groups, investing
in the traditional health delivery system that relied primarily on deploying health professionals was ineffective. The new care model makes more effective use of the limited health workforce by teaming professionals with community-based health workers through integrated maternal, neonatal and child health outreach services.
Scaling up education systems to serve underserved com-munities. In response to the need to scale up midwives prac-tising in underserved areas, BRAC University in Bangladesh has innovated a new spoke-and-hub diploma programme whereby seven training sites located in remote areas and admitting students from those areas are supported by a University-based hub that has developed a standardized curriculum and provides faculty training and educational support. The hub-and-spoke model permits more than 200 midwives per year to be trained locally under the auspices of a University-sanctioned diploma programme. The University of the Philippines School of Health Sciences Leyte offers an innovative stepladder curriculum in which each student starts at a single point and exits at various levels with varying competencies, first as a community health worker or midwife, and then sequentially as bachelor of science in nursing and eventually as physician. The School provides
scholarships and admits deserving high school graduates from remote and largely inaccessible rural communities, who are bound by a contract and are committed to return to serve their communities after completing a programme.
Harnessing information and communication technology to improve the quality of health professional education and access to health services. The Government of Rwanda is engaged in two e-health initiatives aimed at raising the capacity of health workers.163 An e-learning programme is being introduced for nurse training through instruction based on information and communication technology and expected to be expanded to physicians in the future. The second is an expansion of Massive Open Online Course (MOOC) – an online educational programme aimed at large-scale participation and open (free of charge) access via the Internet.164 Although using these technologies appears to incur minimal costs, there has been little evaluation of the cost–effectiveness, and more research is warranted.
Source: personal communication, Akiko Maeda and Tim Evans, World Bank.
BOX 6 Innovative approaches to expanding the quality of health coverage
(Hungarian Education Board), Kyrgyzstan (Ministry of Education and Science), Lithuania (Ministry of Education and Science) and the Philippines (Technical Education and Skills Development Authority);
• authorization to operate (Morocco, by the Secretary-General of the Government); and
• assessment and advice from recognized international professional associations, such as the World Federation of Medical Education169,
the Conférence internationale des doyens des facultés de médecine d’expression française170 for medical studies or the Association of Schools of Public Health in the European Region171 for public health schools; the latter are not accreditation bodies but support education institutions in achieving accreditation.
In 27 countries, we have found evidence of efforts or plans to improve the quality of education of health professionals. Strategies include: reviewing and “modernizing” curricula (such as Brazil, Cambodia, Mexico, Norway
30 A UNIVERSAL TRUTH: NO HEALTH WITHOUT A WORKFORCE
and Senegal), developing continuing and in-service education (such as Mozambique, Sudan, Thailand and Yemen) and creating a dedicated body to improve education and training (such as Health Education England172 or the Commission on Higher Education in the Philippines173). The recent Lancet Commission report Health professionals for a new century: transforming education to strengthen health systems in an interdependent world174 offers several suggestions on how the quality of the education of health workers can be improved in a sustainable manner.
In 35 of the 36 countries profiled for this report, access to the practice of medicine, dentistry and pharmacy requires a license generally issued by a professional council or by a government agency. In some instances, re-licensing exists, usually after five years and conditional on the completion of continuing education activities. In the case of nursing and midwifery, the situation across the 36 countries is more varied. This is consistent with analysis by the International Council of Nurses where the incidence of nursing and midwifery councils overseeing regulatory mechanisms is lower in the countries of Africa, the Middle East and Gulf States.175
In general, there is no proactive surveillance of the quality of practice in the form of periodic site visits. Quality of performance is deemed to be correct until some complaint is formulated or some error or misbehaviour or health problem is detected. Regular direct performance assessment of practice is done in Canada, but in none of the countries reviewed did we identify a similar system.
4.5 SummaryIn the end, countries that have shown progress in improving the essential availability, accessibility, acceptability and quality dimensions (such as England, Ghana, Kyrgyzstan and Thailand) have in common that political commitment to doing this has been strong, they have strived to improve human resources for health in a systemic manner, linking different health workforce development initiatives together and also with broader health system strengthening actions, and continuity in implementing their preferred strategies has been maintained. The health ministry cannot develop the national health workforce in isolation, nor can this be imposed externally. For example, “Between 2001 and 2011, the Thai Universal Coverage Scheme thrived despite seven governments, six elections
and one coup d’état, 10 Health Ministers who chaired the National Health Security Board and 6 Permanent Secretaries who headed the Ministry of Public Health.”139
The evidence collated shows emerging themes and key human resources for health issues, many of which are common to all countries.
• There are shortages of some categories of health workers and more are forecast.
• The health workforce is ageing, and replacement is a challenge.
• Skills-mix imbalances persist, yet with insufficient utilization of advanced practitioners, midwives, nurses and auxiliaries.
• Wide variation in availability and accessibility persists within countries because of attraction and retention difficulties.
• Adapting education strategies and the content of pre-service education is a major challenge.
• Health workers need to be kept motivated in an enabling environment.
• Performance assessment and the quality of care are afforded insufficient priority.
• Capacity in estimating future needs and designing longer-term policies varies.
• Human resource information data and systems to meet the needs of decision-makers require strengthening and investment.
Progress on human resources for health for universal health coverage has been accomplished in the 36 countries profiled, but the picture is not that of a uniform and sustained course. Countries do not advance at the same pace and, in some instances, they regress.

31TOWARDS A CONTEMPORARY AGENDA FOR HUMAN RESOURCES FOR HEALTH
TOWARDS A CONTEMPORARY AGENDA FOR HUMAN RESOURCES FOR HEALTH
CHAPTER 5
“Human resources are the most important of the health system’s inputs. The performance of health care systems depends ultimately on the knowledge, skills and motivation of persons responsible for delivering services.”
Source: The World Health Report 2000 – Health systems: improving performance.176
Photo credit: Sumon Yusuf
32 A UNIVERSAL TRUTH: NO HEALTH WITHOUT A WORKFORCE
As stated in the opening chapter, the global health landscape has transformed since the Millennium Development Goals were adopted in 2000.177 The same will be true in the next decade, and this requires a paradigm shift in global health governance and in particular action to strengthen human resources for health and attain, sustain or accelerate progress on universal health coverage. Despite the alert from The World Health Report 2000,176 progress has not gone far enough or rapidly enough. Global health commentators in 2013 have emphasized, once again, that “the biggest obstacle to improving health is the lack of health work-ers”.90,178 WHO and the Alliance have called for transformative action17,18 and a contemporary agenda.19 Business as usual is therefore not an option; action must reflect what needs to be done, and can be done and what can collectively be anticipated as emerging challenges.
Chapter 4 presented an overview of what is known. We set out: the key drivers and policy levers of the availability, accessibility, acceptability and quality dimensions of the health workforce and how each affects effective coverage; the emerging trends and messages in each of these availability, accessibility, acceptability and quality dimensions across the 36 profiled countries and in the 57 countries with low density and low coverage; and the themes common to all countries. We recognize the limitations of the data and analysis, but we can draw from the synthesis with reasonable confidence.
Chapter 5 discusses what can be anticipated. We explore, in the context of broader health and population dynamics, the “big picture” challenges for human resources for health. We then outline seven focus areas on human resources for health that we believe must be integrated into the forward-looking agendas of universal health coverage and post-2015 developments.
5.1 The “big picture” challenges for human resources for healthAnticipating the “big picture” challenges is an essential responsibility of human resources for health governance and stewardship. The human resources for health implications of progressively expanding effective coverage should be the driving force in constructing our human resources for health agenda. This goes beyond providing a limited package of essential interventions: to achieve “the ultimate expression of fairness”, the universal health coverage vision in 2013 and beyond must expand benefits and coverage for a more holistic, people-centred response to population needs in all countries.
Recent horizon-scanning exercises on health systems converge in their identification of future challenges. Examples include the following.
• A Bellagio meeting in 2012 highlighted how future health markets can better serve the needs of the poor in low- and middle-income countries.69
• Analysis conducted for the World Economic Forum in 2013 developed scenarios of what health systems might look like in 2040.70
• The 2013 Global Monitoring Report by the World Bank and International Monetary Fund179 looked at population growth and urban-rural mobility to anticipate the impact on health and social services in 2030.
• OECD countries have forecast population needs for health services and health workers.79
Each of these approaches is relevant to how to anticipate future necessary changes in the production, supply, demand and management of health workers. The scenarios of what future health systems may look like by 2040 are particularly revealing: their configuration and the skills mix of health workers within them are anticipated to change radically. The health workforce legacies inherited from the past are unlikely to be sufficient to respond to what lies ahead:
“In all instances the preferred health system of the future is strikingly different than health care systems of today, with empowered patients, more diverse delivery models, new roles and stakeholders, incentives and norms. Creating a financially sustainable health system requires a major re-orientation towards values and outcomes, the involvement of a broader set of stakeholders in a more effective governance structure, and greater engagement and responsibility of patients and citizens.” 70
Consistent throughout these and other horizon-scanning approaches is the due attention to macro, meso and micro drivers of change, alongside which is the recognition that the drivers of change are themselves dynamic. Fig. 9 identifies a selection of these macro, meso and micro drivers to help illustrate where transformative action and the contemporary agenda must respond. We then explore and briefly present examples of the issues that are relevant to human resources for health.

33
Financial crisis
CHAN
GING NEEDS
Demographic change
INCREA
SED
NEE
D
INCREASED DEMAND
DELIVERY
FIN
ANCI
NG
HRH PIPELINE
Focus on adolescents
+
Education
Populationgrowth
Conflict
Accountability
People-centredcare
+
Intregrated team-based learning and
practiceResults-based financing
Migration flows
+
Education
Universal Health Coverage
Urbanization ClimateChange
Acceptability of HRH
Feminisation of workforce
Inter-sectoral approach to
health
MACRO MACROMESO MESOMICRO MICRO
Economic growth
Value for money
Un
SUPPLY DRIVERS
DEMAND DRIVERS
NCDs
M health
Economic growth
Public-private partnerships
Community-sourced workers
TOWARDS A CONTEMPORARY AGENDA FOR HUMAN RESOURCES FOR HEALTH
FIGURE 9 Drivers of change for the health workforce

34 A UNIVERSAL TRUTH: NO HEALTH WITHOUT A WORKFORCE
The macro context includes the state of the economy, human development, demography, markets for services and labour, mobility and migration. Demographic change is a critical consideration for universal health coverage: for example, 96% of the additional 1.4 billion people in low- and middle-income countries in 2030 will live in urban areas,179 and by 2050, 1 in 3 births will take place in Africa. Giving priority to and delivering equitable health services, responsive to population change, will create new dynamics. Both public and private services will have to respond to demand, but there is an inherent doubt in whether the health market, if left to its own commercial interests, will favour equitable access on the basis of need and universality. Many countries are also reconfiguring services in response to funding changes triggered by the global economic crisis, which is driving a focus on improved performance, reducing levels of public sector funding and affecting health care labour markets. Policy dynamics in relation to new models of service delivery, changing roles and responsibilities and the geographical and sector distribution of health professionals will need to account for this.
The configuration of health systems will generate meso influences. The objective of universal health coverage is itself a driver of change, as it implies renewing primary health care. Integrating the social determinants of health and addressing the epidemic in noncommunicable diseases implies a major reorientation of health services towards preventive care. The principles and financial necessity for cost-effective health services may have profound impacts. All countries are challenged to secure more health for the money, be it from domestic or international sources of funding.180 This driver stimulates a shift to prevention and primary care, with frontline provision of services that reduces demand for secondary and tertiary services. Governance, stewardship, patient participation and enhanced models of accountability for decision-making and resource allocation will follow. Addressing these drivers will require new understanding of the health sector as a dynamic labour market (Box 7).
At the micro level, the workforce of tomorrow must clearly be different than that of today if it is to meet the challenges of delivering on universal health coverage. Pre-service education and continuing professional development must respond and adjust to new and changing needs and expectations. New models of transformative education with integrated team-based learning will be increasingly adopted. Information technology already supports open-source
education and new, less costly, modes of learning. Rapid developments in the evidence base for effective clinical practice will imply continuous education for professional practitioners to remain fit for purpose. Both public and private education providers will require the associated investments to produce the new numbers and skills mix of the health workforce. To ensure adequate responses from these providers, rigorous accreditation mechanisms will be needed.
Once employed, individual health workers must be increasingly recognized as agents for change and as economic agents. They are both the major cost of and investment in health service delivery. Their behaviour influences both the reorientation and the cost of health services. In return, they must be afforded their labour rights and appropriate conditions of employment in an enabling and supportive work environment. Conditions of employment must also account for the demographics of the health workforce, with flexible terms and opportunities across the working lifespan that are responsive to the increasing proportions of women among physicians and other professions. Remuneration and rewards (financial and non-financial incentives) will also require change. Career structures must be transparent and career development opportunities made available based on merit. Incentive-based funding, to purchase results in both health service outputs and health outcomes, is likely to grow and will imply new modes of funding the health workforce, such as commissioning results from the public or private workforce. Notwithstanding, there must be continual investment in the education and funding of the public sector workforce to maintain quality and ensure equity.
The above examples provide an overview of the challenges; they do not exhaust the scenarios that can be anticipated across all countries. More work will be required in the context of each country to scan and develop their individual scenarios and arrive at their specific challenges to deliver a workforce that is fit for purpose and fit for practice.
Transnational drivers of change will exert additional influences on human resources for health governance and management.
The principle of shared responsibilities in the right to health extends to the global community, whose actions can inform and influence, both positively and negatively, all four dimensions of the health workforce: availability,

35TOWARDS A CONTEMPORARY AGENDA FOR HUMAN RESOURCES FOR HEALTH
accessibility, acceptability and quality. The Oslo Ministerial Declaration on Global Health and Foreign Policy in 2007 set the scene for new analysis of global health governance and committed its supporting governments to promote universal health coverage in the multilateral agenda and to advance solutions to imbalances in the global health workforce market.187,188 The 2012 United Nations
General Assembly resolution on global health and foreign policy extends this momentum to all countries with an emphasis on promoting sustained, inclusive and equitable growth, social cohesion and well-being of the population.2 These developments will affect health systems, with consequences for the governance and management of the health workforce.
The health workforce represents a significant share of the labour force in virtually all countries. In countries with higher income, the relative importance tends to be higher than in countries with lower income, since it can account for up to 13% of the total workforce. In the United States, for example, the health care sector employs 10.6% of the country’s total labour force, and this participation has been increasing over time.181
Despite being a large and important employment sector, labour economic frameworks have been applied insufficiently to under-stand the dynamics of health sector labour markets. There are multiple manifestations of labour market failures in health care in which the supply, demand and need dimensions fail to find an optimal equilibrium. Decisions related to health workforce training, such as scaling up the production of health workers, rarely anticipate the levels of likely outflows from the workforce because of poor working conditions, time spent looking for a job, worker illness, retirement and migration (see figure referring to Togo).182,183 Getting a better return on investment in the production of health workers will depend therefore on how many of these labour market issues are managed.
Underlying health labour market dynamics is the recognition that health workers respond strategically to policy and institutional changes as well as to external forces. The old assumption that
BOX 7 Health care as an employment sector: the importance and characteristics of health labour markets
Production
890 doctorstrained
Migration:250
Retired:20
Unemployed:20
Employed full-time in the Government sector:
400
Employed full-time in the private
for profit sector:200
Serving 80% of the population:150 doctors
Concentrated in the capital city(20% of population):
75% of employed doctors
Health workforce dynamic, Togo184
health workers are passive actors, inherently competent and motivated to serve the public, does not hold in most settings. Rather, it is important to recognize their behaviour as economic actors, with clear preferences185 and, in many cases, making informed choices over sectors and geographical location. Further, the interaction of health workers as economic agents with institutional employers and patient consumers is an exciting and growing area of work related to results-based funding and
incentive systems for performance. Labour market analysis is also important in understanding both within-country shifts of health workers (urban-rural distribution) as well as international flows of workers between countries. In short, further investment in health labour market analysis is likely to inform policies that address diverse market failures and hence contribute to increasing the availability, accessibility and quality of health workers.186 Source: personal communication, Edson Araújo and Tim Evans, World Bank.

36 A UNIVERSAL TRUTH: NO HEALTH WITHOUT A WORKFORCE
Shared responsibilities will further lend themselves to the articulation of new goals and targets for the health sector, with direct and indirect impact on the health workforce. The 2013 United Nations General Assembly included discussion on health in the framework of sustainable development, with a proposed health goal of achieving health and well-being at all ages tabled, and with recognition that investing in the health workforce will strengthen both the national economy and health services. Irrespective of the final wording of any potential goals, there is increasing recognition that the global health community
requires a paradigm shift in its approach to investing in the health workforce,189 learning from the experiences of vertical and single-issue investments in the last 10 years. This is encouraging, as past investment has often failed to give priority to the need for comprehensive human resources for health support. Nevertheless, any new goals, targets and initiatives must be grounded in the realities of and the impact on the health workforce. For instance, strengthening the health workforce to achieve reproductive health rights and the proposed new targets for maternal and neonatal mortality reductions in the Ending Preventable
The world’s population is rising. By 2035, an additional 1.9 billion people will be seeking to access and obtain high-quality health care within the scope of universal health coverage. This increased demand and the obligation of governments to respond raise the question as to what the global health workforce requirements for 2035 may be.
There is currently no consensus on the best models to project workforce requirements, but some of the “big picture” challenges can be anticipated in the stock of health workers. Many factors such as population needs, models of care and health worker pro-ductivity influence the projections of the health workers needed. To prompt a debate in answering this question, we estimated the number of additional skilled health professionals (midwives, nurses and physicians) required to reach, in all countries, a minimum density threshold of 34.5 per 10 000 population, both currently (based on the latest available workforce data) and in 2035 (based on a population projection of 8.6 billion and no positive or negative growth in the stock of health professionals). Data were taken from United Nations population projections and the WHO Global Health Observatory for 186 countries. The
simplicity of the model is recognized. The emphasis is on the “big picture” that may prompt further research and analysis.
Globally, there are an estimated 27.2 million skilled health pro-fessionals for a population of approximately 6.7 billion (matching United Nations population estimates to the source year – average: 2008 – for workforce data in the WHO Global Health Observatory). For this population of 6.7 billion, the density threshold corresponds to 23.2 million skilled health professionals, and the distribution is highly variable. Focusing only on the countries presently below the threshold, there are 8.9 million skilled health professionals for a population of 4.7 billion, which corresponds to a current deficit of about 7.2 million. Nearly half the deficit, totalling 3.4 million (47%), is in the South-East Asia Region, where 27% of the world’s population lives. The African Region accounts for a skilled health workforce deficit of 1.8 million (25% of the global total). The Western Pacific and Eastern Mediterranean Regions follow, both with skilled workforce deficits of around 0.8 million (11% of the global total). The gaps of skilled health professionals in the Region of the Americas reaches 0.3 million (4%). The deficit is smallest in the European Region, at 0.07 million (1%).
The projection model is entirely driven by the population growth of 1.9 billion and keeps all other factors constant. Under these assumptions, 107 countries would be affected by gaps by 2035: this would lead to a global deficit of about 12.9 million skilled health professionals. Based on the assumptions of the model, the two WHO regions where the absolute deficit would be highest are South-East Asia (5.0 million), representing 39% of the global total, and the African Region (4.3 million), representing 34% of the global total (a substantially higher proportion than the current estimate of 25% because of its projected population growth). The Eastern Mediterranean and Western Pacific Regions would follow, with estimated deficits of 1.6 million (12%) and 1.3 million (10%), respectively. The Region of the Americas and the European Region would have the lowest deficits in 2035: 0.6 million (5%) and 0.1 million (1%), respectively.
To understand the scale of the challenge of eliminating the projected deficits, we performed feasibility analysis, calculating, for each of the 107 countries, the average exponential growth rate required and comparing it to three levels: (1) average exponential growth rate <5% (the scale-up required is most likely to be feasible); (2) average exponential growth rate 5–9.9% (the scale-up required is somewhat likely to be feasible); and (3) average exponential growth rate ≥10% (the scale-up required
BOX 8 Accelerating the supply of skilled health professionals: estimates of potential population needs (current and in 2035)

37TOWARDS A CONTEMPORARY AGENDA FOR HUMAN RESOURCES FOR HEALTH
Maternal Deaths initiative and the forthcoming Every Newborn Action Plan will be a significant undertaking globally. A new study analysing coverage data from 312 nationally representative household surveys between 1990 and 2011 in 69 low- and middle-income countries suggests that historical trends in scaling up coverage will not be sufficient to reach the proposed new targets for neonatal mortality and under-five mortality by 2035.164,190 This evidence implies that reaching these targets will require a transformative change of health systems, especially where the health workforce is concerned.
Box 8 considers the implications of population growth and demand for health services to highlight the scale of the challenges ahead. It makes clear that achieving global progress by 2035, in support of universal health coverage principles and new health targets, will require rethinking the traditional models of education, deployment and remuneration of the health workforce, long-term system-building and comprehensive labour market engagement, and all supported by essential data and intelligence systems. The take-away message is clear: achieving universal health coverage, including accelerating
0
5
10
15
African Region
Countries (n=107)
0 20 1008040 60
Aver
age
expo
nent
ial g
row
th ra
te re
quire
d (m
ost r
ecen
t yea
r ava
ilabl
e un
til 2
035)
0
5
10
15
quintile6
quintile5
quintile4
quitinle3
quintile2
quitile1
African Region
European Region Eastern Mediterranean Region
South-East Asia Region
Western Pacific Region
Region of the Americas
Average exponential growth rate of the skilled health workforce required to reach a 34.5 per 10 000 population threshold in 2035
is most unlikely to be feasible). The results are shown in the figure to the right.
Encouragingly, we found that scaling up to address deficits would be most likely to be feasible in 58 countries (54%) and somewhat likely to be feasible in 34 countries (32%). However, it would be most unlikely to be feasible in 15 countries (14%). The African Region has a high number (13) and proportion of countries (30%) in which the required scale up would be most unlikely to be feasible (average exponential growth rate ≥10%), followed by the Eastern Mediterranean Region (2, or 14%). The African Region also has a high number (23) and proportion (53%) of countries in which scaling up would be somewhat likely to be feasible, followed by the Western Pacific (3, 23%) and South-East Asia (2, or 22%). In the European Region, scaling up would be most likely to be feasible in all (6) countries, as it is in 19 countries (86%) in the Americas and in 9 countries (64%) in the Eastern Mediterranean.
These estimates, however, do not include the variable of attrition. If they did, the number of additional workers that would have to be trained to reach and maintain the density threshold would increase correspondingly, indicating a substantially greater challenge in producing and deploying health workforce to attain or sustain universal health coverage.
Source: personal communication from Francisco Pozo-Martin, Jim Campbell and Laura Sochas (ICS Integrare), based on authors’ calculations.

38 A UNIVERSAL TRUTH: NO HEALTH WITHOUT A WORKFORCE
the curves of maternal mortality rate, neonatal mortality and under-five mortality downwards by 2035 will require an upwards acceleration in the availability, accessibility, acceptability and quality of health workers.
5.2 The evidence adds upChapters 3, 4 and 5 provide structure and evidence to consider how to move towards a contemporary agenda. In 2013, more is known about the existing workforce challenges, the emergence of threats to sustaining universal health coverage and the unfinished agenda. The main positive finding is that we are becoming ever better placed to rise to the grand challenge of human resources for health. The Kampala Declaration and Agenda for Global Action and the increasing evidence base that has been discussed provides greater clarity on the definition, scope and scale of the existing challenges in the availability,
accessibility, acceptability and quality of the health workforce. However these improvements have not been universal, comprehensive or always sustainable. Many countries still have significant deficits in the public sector workforce and inefficient labour markets:182 the crisis in the global health workforce has not yet been addressed comprehensively.
Nevertheless, there is growing cause for optimism, and improvements since 2006 can be tracked. As we have shown in the earlier chapters, there has been progress (albeit not comprehensive and not in all countries) in achieving the conditions for success: in formulating human resources for health plans; in using innovative mechanisms on maximizing and optimizing the capacity of existing health workers; in formalizing the adoption of task-sharing and task-shifting to promote service delivery closer to communities; in using new human resources for health guidelines and tools to inform analysis of national and international labour mobility; in more effectively using data, planning and
projections methods; and implementing a major expansion of human resources for health research in countries at all levels of economic development.
Although workforce density, configuration and skills mix have not been unequivocally confirmed as causing changes in health service utilization, coverage and population health outcomes, there are also upward trends (in national averages) on health service utilization, coverage and population health outcomes in some but not all of the low- and middle-income countries originally classified as having an human resources for health crisis. Some countries are making progress in terms of health services coverage despite relatively low human resources for health density, pointing to the potential for efficiency gains: their pathways to success should be better understood and lessons learned with wider relevance identified. Further work is required to unpack the determinants of causality, improve the metrics and science of workforce intelligence and strengthen the underpinning data and information systems that remain a barrier to progress on universal health coverage.
A contemporary agenda on human resources for health must also account for The World We Want and anticipate the evolution and shifts in the organization, planning and management of population health and health services to promote equity. The forward-looking agenda must appreciate the “big picture” challenges that will influence the workforce in the immediate future. And from this, to then determine how to respond with appropriate models of governance, education, skills mix and service delivery to ensure that the health workforce will become and remain fit for purpose.
5.3 Focus themes for a contemporary agendaIn consolidating the evidence on human resources for health and universal health coverage, we have arrived at a set of priority themes, deliberately condensed to guide policy actions. The scope of human resources for health is too wide a field to do justice to every issue and challenge, and this synthesis should therefore be read in the spirit intended.
The seven themes (Box 9) act as the bridge from what is: an improving but frag-mented picture of the current state of human resources for health globally, to what can be: an articulated vision for human resources for health fully functioning and underpinning the achievement of universal health coverage nationally and globally.
There is a current deficit of about 7.2 million skilled health professionals. A projection model driven by population growth would lead to a global deficit of about 12.9 million by 2035.

39TOWARDS A CONTEMPORARY AGENDA FOR HUMAN RESOURCES FOR HEALTH
Health systems can only operate with a health workforce. Achieving universal health coverage, with priority given to vulnerable groups, depends on the availability, accessibility, acceptability and quality of health workers. This is a clear message for all policy-makers, governments and donors. More equitable deployment in underserved areas with health workers that earn the respect and trust of the communities they serve will be required. Governments must address not only geographically hard-to-reach people but importantly the failed-to-reach people in existing health systems; targeting those outside of formal employment, poor people and disadvantaged people who often cluster in places like urban slums. Pro-equity policies that remove financial barriers or extend financial protection to population groups who were previously excluded will immediately translate into increased demand for existing health services and probably require increases in the health workforce. Scaling up availability, accessibility, acceptability and quality implies major education challenges. These include augmenting and adapting the capacity of production of education institutions so that they can prepare health workers to assume new roles and acquire the type of skills to meet the changing demographic trends and demands created by the growing burden of noncommunicable diseases. The health workforce of tomorrow, in addition to be technically skilled in treating health problems, must also be prepared to address the social determinants of health and be able to advocate for health in all policies.
Responsive to population needs: attaining universal health coverage will require integrated health services and multidisciplinary health teams and may imply new models that change the availability, accessibility, acceptability and quality of the health workforce. Cost-effective health services that are responsive to demographics, multi-morbidity and population change is key. The performance and productivity of health workers and health workforce teams is central to this endeavour and directly and indirectly affects health expenditure. Innovation is required to dismantle outdated modes that excessively emphasize curative services in tertiary care settings and to abandon any existing dysfunctional configurations, team structures and hierarchies. Pursuing and achieving high-quality care requires new approaches to transformative education, effective utilization of information and technology, responsive methods of self-regulation and supportive management and supervision.
With supply and demand aligned: maximizing the return on investment in health workforce education and training is essential, and part of this process is effective planning to ensure that there is the funded demand to utilize the supply of health workers. The costs of producing and retaining a workforce fit for purpose and fit to practice will influence the cost–effectiveness of health services. This is a recurrent cost, and investment in public-sector education is required to maintain the capacity, faculty and quality of training institutions. The education sector cannot be left entirely to market forces, as these can put the quality of public- sector education at risk. In addition, many health systems experience significant levels of attrition in human resources for health, or wastage, as health workers leave for jobs in other sectors or countries. The cost implications of this wastage can be significant, and improved retention will contribute to cost containment, availability and accessibility.
With supply informed by evidence: human resources for health plans must be adaptable to change and to health labour market dynamics and be integrated within broader health and development strategies. Human resources for health plans only retain relevance as long as they are aligned with broader health strategies and can adapt to changing circumstances and policy priorities. They must also be able to accommodate the legitimate involvement and interests of a range of stakeholders while not losing sight of overall objectives of improving health through improving human resources for health. The political economy of health and the influences on decision-making by health professionals and
• Health systems can only operate with a health workforce;
• responsive to population needs;
• with supply and demand aligned;
• with supply informed by evidence;
• with effective governance enshrined;
• respecting the rights of the worker, who in turn must embrace the right to health; and
• providing the stewardship and financing for shared prosperity and wealth.
BOX 9 Seven themes to inform action on human resources for health

40 A UNIVERSAL TRUTH: NO HEALTH WITHOUT A WORKFORCE
their unions or associations, regulatory bodies, employers’ associations, insurance funders and other stakeholders (including the alcohol, food, tobacco and pharmaceutical industries) – sometimes in their self-interest – should also not be underestimated. There is growing appreciation of how scenario-based planning can support an improved understanding of the drivers of change in human resources for health (such as economic, environmental, legal, political, regulatory, social and technological), build stakeholder engagement, and deliver the evidence-informed analysis and adaptable plans that policy-makers will need to consider.
Effective governance enshrined: effective governance and regulation are critical and central components of a comprehensive approach to human resources for health. These are not optional elements of effective health systems; sustained effectiveness is not achievable without regulatory and governance mechanisms in place that can ensure the quality and responsiveness of, and accessibility to, health services, including the health workforce. The role of formal, informal and private providers, in education and in service delivery, must be part of the comprehensive approach. Although regulating the health workforce ultimately remains a government responsibility, nothing prevents some of it being delegated to independent professional bodies, if effective accountability mechanisms are in place. Where a trust relationship is built between government, health workers and users of services, self-regulation can be a form of governance more effective than bureaucratic control and may achieve a better balance between health system and patient safety requirements and an enabling approach that harnesses the intrinsic motivation of health workers.
It respects the rights of the worker, who in turn must embrace the right to health: health workers must have rights to fair treatment at work just as they must treat others fairly. If they wish to achieve universal health coverage, countries and health systems must determine and deliver a fair and formalized employment package to their workforce, which includes a living wage appropriate to their skills and contributions, and with timely and regular payment as a basic principle, as well as an enabling working environment and good quality education and training. They must also address the issue of dual practice, which workers often
use to cope with the absence of a fair wage, and of employment and working conditions that motivate workers and facilitate their retention. The practice of informal payments to health workers in some countries persists and can create financial barriers for the population, alienating the trust and respect of the communities they serve. Reducing and eliminating the need and opportunity for informal payments will require coordinated efforts, which must be underpinned by equitable treatment of the workforce. At the same time, health workers themselves must embrace the right to health and commit to and apply the basic principles of non-discrimination, dignity and respectful care.
It provides the stewardship and funding for shared prosperity and wealth: investment in human resources for health across all availability, accessibility, acceptability and quality dimensions requires a paradigm shift on the economic and social benefits of health sector employment and productivity. The fundamental disconnects between supply and demand in many countries will be exacerbated with greater demands on health coverage; in some cases, this will contribute to a persisting pull of health workers towards high-income countries. Public-sector intervention to correct for the insufficient provision of health workers, their inequitable deployment or their inadequate performance is needed. This requires public-sector expenditure and new approaches to partnerships with the private sector and others. More funding is needed, but so is better funding. This calls for more money for human resources for health and more human resources for health for the money available as an integral part of the agenda on greater value for money, sustainability and accountability.191,192
The final chapter sets out the vision and the conditions for success to ensure that the human resources for health components necessary for attaining universal health coverage are in place and integrated in broader health and development policies. The focus is on an enabling health workforce, fit for purpose and fit to practice.

41TOWARDS ACTION AND RESULTS
TOWARDS ACTION AND RESULTS
CHAPTER 6
The biggest gaps in global health are those between intent and action, and action and results.Joy Phumaphi, Executive Secretary, African Leaders Malaria Alliance, September 2013,
United Nations General Assembly
The evidence presented is clear: there is no health coverage without a health workforce. The global community must act. A transnational, transformative contemporary agenda is required: one that rises to the grand challenge of human resources for health strengthening and makes possible the development and implementation of sustainable health systems, sustainable development and shared prosperity. No country is exempt or isolated from the challenges of universal health coverage and of the related human resources for health ones; we live in an interdependent world in which action and inaction have far-reaching implications for current and future generations.
The final section therefore explores and delineates the actions that can transform intent into actions, and actions into results. It sets out a manifesto for action, highlighting the essential elements to anticipate, develop and act in favour of a fit for purpose health workforce.
Photo credit: Philippe Blanc / Photoshare

42 A UNIVERSAL TRUTH: NO HEALTH WITHOUT A WORKFORCE
1 Recognize the centrality of the health workforce in translating the vision of universal health coverage and its constituent values (such as universality,
financial risk protection, non-discrimination, giving priority to vulnerable groups and ethical management of public-private relations). Responding to this vision in terms of concrete plans for human resources for health must take into account evolving dynamics concerning the country’s macroeconomic picture, the evolving disease burden and demographics and opportunities for innovation in health workforce production, deployment and management. While the vision will be overarching, values based and inclusive, the associated health “needs” will reflect the heterogeneity of the population and its geography and the varying impact of the social determinants of health; different types of services, modalities of provision and innovations may be needed, which in turn will have different implications for human resources for health. Primary care, while being a general priority, may be delivered differently, say in more affluent urban areas and in poor neighbourhoods, which may require a different mix of health workers with different competencies. A one-size-fits-all approach will be inconsistent with these needs.
2 Assess the gap between the health workforce needs, supply (stock, skills mix and competencies) and demand anticipated in the health system vision,
delineated by the objective of universal health coverage and the current availability, accessibility, acceptability and quality dimensions. A health labour market analysis, including public, private, formal and informal health workers and dual practice provides rigour on current dynamics, but in a globalized and rapidly changing world, it is challenging to predict the evolution of labour market dynamics, the demand for services or the behaviour
of health workers. The utilization of horizon-scanning and costed scenario projections to identify and determine the most feasible and viable options is equally necessary. Gap analysis should account for the potential of workforce innovation with team-based care, task-sharing and delegation, up-skilling of current workers, the use of new communication technologies and performance management, while avoiding excessive reliance on any of these individual measures and maintaining solid foundations of a sustainable health workforce.
3 Formulate human resources for health policy objectives that encapsulate the vision for the health system and services, ensuring that the approach to work-
force development is comprehensive and systemic in terms of occupational groups considered, of the interconnectedness of var-ious dimensions of human resources for health policy (education, working environment and conditions, funding and management) and of the private and public sectors. Too often in the past, there has been an incomplete and fragmented approach to formulating and implementing policy on human resources for health. Policies should not only plan the number of health professionals but also reconfigure their nature and type to better meet current and future anticipated patient and population health needs and problems. This action should ensure the collaboration of various sectors (education, public administration and finance) that health has to mobilize. Human resources for health is a constant, evolving dynamic and is best served by continual refinements rather than a static planning process to be revisited only every five years.
4 Build the data, evidence base and strategic intelli-gence required to implement and monitor the policy objectives and sustain effective management through
integrated, interoperable, health information and human resource information systems, with operational research embedded. Assess existing information and then agree, develop and continually im-prove the national human resources for health data set to support effective management and system-wide planning, with regular analysis and reporting for evidence-informed decision-making and regional and international reporting.
Human resource information systems need not to be complex and costly; at minimum they need to capture the data and information policy-makers need on the demographics, composition and geography of the practising workforce (with unique identification numbers), its stocks and flows and to ensure that it is reliable, up-to-date and consistent across sources of data (payroll, labour market surveys, professional registries, etc.). New technologies, open-source software, mobile telecommunication and public- private partnerships offer scope for rapid improvement in human resource data and information systems across all countries.
5 Build and sustain the technical capacity to design, advocate for and implement policies at the national, regional, local and facility levels. This includes two
main areas. First, build the capacity necessary to support data analysis set out in 4 above as well as evaluation and knowledge management and transfer, both nationally and transnationally. This latter effort on knowledge management is particularly important since the production of good data and evidence does not automatically imply or guarantee that policy-makers and managers use them effectively in pursuing improvement in health
BOX 10 A manifesto for action

TOWARDS ACTION AND RESULTS 43
systems. More or better data are often required, but great gains could be already made through more consistent and strategic use of currently available information. Second, it demands focus on developing and sustaining the capacity to manage health services and the administration and supervision of human resources for health, including identifying and developing education and career pathways for specialists who will subsequently lead and manage the implementation of human resources for health policies.
6 Build political support at the highest level to ensure continuity in the pursuit of universal health coverage through intersectoral actions and the continuing
evolution of workforce policies and implementation. Without such high-level and sustained political commitment, experience tells us that policies on human resources for health will not be translated into effective action. In contexts of frequent rotation of health authorities, there is always a risk that policy directions are reversed. This risk can be mitigated if stakeholders, including all types of health workers and especially citizens, are engaged in participatory decision-making to advance universal health coverage and the changes in human resources for health that support this process.
7 Reform the governance and institutional human resources for the health environment to make it enabling and supportive of achieving universal health
coverage and responsive to population health needs and priorities: for example, by strengthening accountability mecha-nisms, decentralizing management and giving more autonomy to facilities in recruiting, dismissing and managing staff, defining systems of incentives and organizing the delivery of services, ensuring representation of civil society in governance and regula-tion processes. In the sphere of regulation, where responsibilities
are devolved to professional councils, review their mandate, separating their role as guarantor of the quality of practice from that of representing the interests of their members.
8 Cost the various scenarios of health workforce reforms, accounting for the evolving role of private providers in education and health services, develop the
investment cases and mobilize financial resources from domestic and, where necessary, international sources. Domestic sources should be used first to show commitment and to create the fiscal space for self-sufficiency. International solidarity and official de-velopment assistance will still be required for many years in low- and lower-middle-income countries with inequities and poverty, and achieving health workforce sustainability in these countries will require long-term, agreed and predictable investment flows for capital and recurrent expenditures.
9 International partners focus their support, and track their official development assistance, on capacity-building at the institutional (governance and
regulation), organizational (relevant ministries and agencies, councils, associations, accreditation bodies and education institu-tions) and individual levels (transfer of competencies and access to knowledge through modern learning tools) in countries that strongly commit to achieving universal health coverage. Countries and their international partners would develop and agree on mutual key commitments – framed in terms of the objectives to be met in relation to the previous recommendations, which will catalyse support and, where appropriate, results-based aid. The “commitments” process is a two-way street.
10 International partners address transnational issues and strengthen global human resources for health governance, collaborative platforms
and mechanisms. The transnational dimensions are multiple. The first is to support the creation and sharing of global public goods to disseminate good practices and evidence from all countries; promote multidisciplinary and multicountry research and knowledge exchange and to provide or mobilize technical assistance as needed. This will ideally unite the universal health coverage and social protection agendas, bringing regulations, technical norms and standards to bear on health and social services, with the multidisciplinary strengths of the ILO and the World Bank as a core part of the process. The second is to strengthen mutual accountability and global governance mechanisms to identify where public sector interventions and funding are failing, to monitor the implementation of the WHO Global Code of Practice on International Recruitment of Health Personnel and to monitor the commitments on human resources for health and universal health coverage made by countries and their partners. By default, this implies ensuring that broader global health governance is also fit for purpose. Budget retrench-ments in international agencies have diminished the capacity for this work and should be rectified. Measures should be in place to ensure that the work of these platforms and mechanisms is closely coordinated with that of others monitoring the progress towards universal health coverage and any new global health targets or initiatives.

44 A UNIVERSAL TRUTH: NO HEALTH WITHOUT A WORKFORCE
6.1 ConclusionThe Joint Learning Initiative summarised that the only route to the health Millennium Development Goals is through the health worker. A contemporary agenda must recognise that the only route to universal health coverage and effective coverage is also through the health worker.193
Given the social, political and economic specificities of each country, policy-makers will need to interpret these actions in accordance to their needs and capacities. These are the conditions for success in improving the availability, accessibility, acceptability and quality of the health workforce commensurate with the principles of universal health coverage. Each action is necessary and important; all will be required, at various points in the process if there is to be any real scope to effectively address all the priority themes described earlier. The first eight actions are directed primarily at national authorities and the last two at international partners, while recognizing that many actions have a transnational dimension.
The 10 action points are presented in a logical sequence that supports the design, implementation and delivery of a health workforce that is fit for purpose and fit to practice, but it is not intended that each be stand-alone – the 10 points must
be considered in an integrated manner. Good practice will take a comprehensive overview of the health labour market, including the evolution of the private sector in many settings, and appreciate the external factors in regional and international markets.
As stated in the opening of this report, The World Health Report 2006,12 the Kampala Declaration and Agenda for Global Action, the momentum on universal health coverage and the post-2015 development agenda offer the international community a platform and unique opportunity to respond to The World We Want. It is now in the hands of governments and all concerned stakeholders to act. Political and technical leadership is critical to seize the opportunity to attain, sustain and accelerate progress on universal health coverage with transformative action on human resources for health.
At stake is a contemporary agenda in support of the millions of individual health workers that manage, administer and provide the health and social services that we wish all people – rich and poor – to access and obtain. The universal truth: no health without a workforce.

45COUNTRY PROFILES
COUNTRY PROFILES
Afghanistan ............................................ 46
Australia .................................................. 47
Bangladesh ............................................ 48
Brazil ........................................................ 49
Cambodia ................................................ 50
China ........................................................ 51
Cuba ......................................................... 52
Egypt ........................................................ 53
Ethiopia .................................................... 54
Fiji ............................................................. 55
France ...................................................... 56
Ghana ...................................................... 57
Hungary ................................................... 58
India ......................................................... 59
Indonesia ................................................ 60
Japan ....................................................... 61
Kenya ....................................................... 62
Kyrgyzstan .............................................. 63
Mexico ..................................................... 64
Morocco .................................................. 65
Mozambique ........................................... 66
Nepal........................................................ 67
Nicaragua ............................................... 68
Norway .................................................... 69
Oman ........................................................ 70
Peru .......................................................... 71
Philippines .............................................. 72
Senegal ................................................... 73
South Africa............................................ 74
Spain ........................................................ 75
Sri Lanka ................................................ 76
Sudan ....................................................... 77
Thailand ................................................... 78
United Kingdom ..................................... 79
United States of America..................... 80
Yemen ...................................................... 81
CHAPTER 7
Photo credit: Damien Schumann / Lung Health Image Library

HRH POLICY AND STRATEGY
SUB-NATIONAL LOW
GEOGRAPHICAL DISTRIBUTION OF PHYSICIANS(density per 10 000 population)
NATIONAL AVERAGE SUB-NATIONAL HIGH
Female physicians
HUMAN RESOURCES FOR HEALTHPOPULATION AND HEALTH
FEASIBILITYDENSITY OF SHPs (Skilled Health Professional)
PER 10 000 POPULATION (Estimated 2010)POPULATION (MILLIONS)
Is there evidence that the country has mechanisms in place to:
TO
AVAILABILITY
ACCEPTABILITY
ACCESSIBILITY
QUALITY
Top 10 causes of morbidity and mortality (DALYs)Communicable, maternal, neonatal, and nutritional InjuriesNon-communicable
Disability-adjusted life years (DALYs) quantify both premature mortality (YLLS) and disability (YLDs) within a population. The top 10 causes of DALYs are ranked from top to bottom in order of the number of DALYs they contribute in 2010. Bars going right show the percent by which DALYs have increased since 1990. Bars going left show the percent by which DALYs have decreased.
Feasibility of achieving thresholds: Most likely Least likelySomewhat likely
Leadership and Partnership
Policy and Management
Strategy/Plan and Finance
HRH GOVERNANCE
Is there government leadership on health workforce policy and management?
Is there intersectoral and multi-stakeholder partnership to inform health workforce policy and management?
related to population health needs?
informed by data and strategic intelligence?
addressing pre-service education?
addressing geographical distribution and retention?
addressing health workforce performance (e.g. competence, responsiveness and productivity)?
addressing international mobility of health workers; and where relevant the WHO Code of Practice on the International Recruitment of Health Personnel?
Is there a national HRH strategy/plan resulting from the above mechanisms?
For which period?
Does the strategy/plan account for the financial costs and resource requirements to implement it?
= Yes = No = Insufficient data= Partial
Is there evidence that the country is adopting recommended good practices on HRH:
Is existing health workforce policy and human resource management:
?
ACCREDIT training institutions for:
Dentists
Midwives
Nurses
Pharmacists
Physicians
REGULATE:
Dentists
Midwives
Nurses
Pharmacists
Physicians
LICENSE/RE-LICENSE:
Dentists
Midwives
Nurses
Pharmacists
Physicians
A UNIVERSAL TRUTH: NO HEALTH WITHOUT A WORKFORCE46
1 PhysicianThe ratio of nurses
to physicians is
BELOWthe OECD average (2.8:1).
TO MEET THRESHOLDS BY 2035, REQUIRES:
1036% increase to meet 22.8/10 000 threshold
1619% increase to meet 34.5/10 000 threshold
2860% increase to meet 59.4/10 000 threshold
20152010 2020 2025 2030 20350
120
140
100
80
60
40
20
Thresholds**
34.5/10 00022.8/10 000
0
10
20
30
40
50
59.4/10 000
160
9.4/10 000*
CURRENTDENSITY
2.5Nurses
7.2Physicians
1.9Physicians
0.6Physicians
Population [all (000s); proportion under 15 (%); proportion over 60 (%)]
28.4; 46; 4 (2010)
Average annual rate of population change (%) 2.4 (2010-2015)
Population living in urban areas (%) 24 (2011)Gross national income per capita (PPP int. $) 1140 (2011)Population living on <$1 (PPP int. $) a day (%) –Total expenditure on health as a percentage of gross domestic product (%)
9.6 (2011)
General government expenditure on health as a percentage of total expenditure on health (%)
16 (2011)
External resources for health as a percentage of total expenditure on health (%)
16.4 (2011)
Life expectancy at birth (years) [all; female; male] 60; 61; 59 (2011)Total fertility rate (per woman) 6.3 (2010)Neonatal mortality rate (per 1 000 live births) 36 (2011)
Infant mortality rate (per 1 000 live births) 73 (2011)Under-five mortality rate (per 1 000 live births) 101 [84-126] (2011)
Maternal mortality ratio (per 100 000 live births) 460 [250-850] (2010)Births attended by skilled health personnel (%) 36.3 (2011)Antenatal care coverage - at least one visit (%) 45.5 (2011)Antenatal care coverage - at least four visits (%) 14.6 (2011)
Diphtheria tetanus toxoid and pertussis (DTP3) immunization coverage among 1-year-olds (%)
66 (2011)
Postnatal care visit within two days of birth (%) 23.4 (2010)
Approximately 57% of the Afghan population has access to basic health care, although coverage is much lower in hard-to-reach areas. Out-of-pocket expenses account for up to 79% of total health expenditure, despite the abolition in 2008 of formal user fees in public health facilities. There is a high burden of communicable diseases, with limited progress towards achieving Millennium Development Goal 4, and also a high and increasing burden of noncommunicable diseases such as heart disease, stroke and depressive disorders. The availability of skilled health professionals (9.4 per 10 000 population) is low, and mechanisms for accreditation, regulation and licensing require improvement. Planning for human resources for health has therefore been a priority for the government, with the development of multiple policies and collaborative forums, but effective implementation is a challenge. Although the planned development of a five-year strategy for human resources for health is a positive sign, effectively implementing it will require clear resource commitments.
AFGHANISTAN
NO DATA
-150 -75 0 75 150
Lower respiratory infections
Tuberculosis
Congenital anomalies
Road injury
Meningitis
Cerebrovascular disease
Ischemic heart disease
Preterm birth complications
Major depressive disorder
Diarrheal diseases
?
??
?
??
?
? / ?
?
2012-2016
*Equal to the total of physicians (N=6 901; 2010), nursing and midwifery personnel (N= 17 257; 2009) and midwives (N= 2 595; 2010) divided by the 2010 population (N= 28 398 000). Source: (WHO Global Health Observatory - Global Health Workforce Statistics – 2012 update - http://apps.who.int/gho/data/view.main)
**See Annex 1 for full explanation on country profile methods and sources.

GEOGRAPHICAL DISTRIBUTION OF PHYSICIANS(density per 10 000 population)
Female physicians
HUMAN RESOURCES FOR HEALTHPOPULATION AND HEALTH
FEASIBILITYPOPULATION (MILLIONS)
Is there evidence that the country has mechanisms in place to:
TO
AVAILABILITY
ACCEPTABILITY
ACCESSIBILITY
QUALITY
Top 10 causes of morbidity and mortality (DALYs)Communicable, maternal, neonatal, and nutritional InjuriesNon-communicable
Disability-adjusted life years (DALYs) quantify both premature mortality (YLLS) and disability (YLDs) within a population. The top 10 causes of DALYs are ranked from top to bottom in order of the number of DALYs they contribute in 2010. Bars going right show the percent by which DALYs have increased since 1990. Bars going left show the percent by which DALYs have decreased.
Feasibility of achieving thresholds: Most likely Least likelySomewhat likely
ACCREDIT training institutions for:
Dentists
Midwives
Nurses
Pharmacists
Physicians
REGULATE:
Dentists
Midwives
Nurses
Pharmacists
Physicians
LICENSE/RE-LICENSE:
Dentists
Midwives
Nurses
Pharmacists
Physicians
HRH POLICY AND STRATEGY
Leadership and Partnership
Policy and Management
Strategy/Plan and Finance
HRH GOVERNANCE
Is there government leadership on health workforce policy and management?
Is there intersectoral and multi-stakeholder partnership to inform health workforce policy and management?
related to population health needs?
informed by data and strategic intelligence?
addressing pre-service education?
addressing geographical distribution and retention?
addressing health workforce performance (e.g. competence, responsiveness and productivity)?
addressing international mobility of health workers; and where relevant the WHO Code of Practice on the International Recruitment of Health Personnel?
Is there a national HRH strategy/plan resulting from the above mechanisms?
For which period?
Does the strategy/plan account for the financial costs and resource requirements to implement it?
= Yes = No = Insufficient data= Partial
Is there evidence that the country is adopting recommended good practices on HRH:
Is existing health workforce policy and human resource management:
?
47
DENSITY OF SHPs (Skilled Health Professional) PER 10 000 POPULATION (Estimated 2010)
SUB-NATIONAL LOW NATIONAL AVERAGE SUB-NATIONAL HIGH
1 Physician
COUNTRY PROFILES
0
6
12
18
24
30
20152010 2020 2025 2030 20350
120
140
100
80
60
40
20
Thresholds**
34.5/10 00022.8/10 000
59.4/10 000
160
126.3/10 000*
CURRENTDENSITY
TO MEET THRESHOLDS BY 2035, REQUIRES:
0% increase to meet 22.8/10 000 threshold
0% increase to meet 34.5/10 000 threshold
0% increase to meet 59.4/10 000 threshold
2.3NursesThe ratio of nurses
to physicians is
BELOWthe OECD average (2.8:1).
–Physicians
38.5Physicians
–Physicians
Population [all (000s); proportion under 15 (%); proportion over 60 (%)]
22.4; 19; 19 (2010)
Average annual rate of population change (%) 1.3 (2010-2015)
Population living in urban areas (%) 89 (2011)Gross national income per capita (PPP int. $) 38110 (2011)Population living on <$1 (PPP int. $) a day (%) –Total expenditure on health as a percentage of gross domestic product (%)
9.0 (2011)
General government expenditure on health as a percentage of total expenditure on health (%)
69 (2011)
External resources for health as a percentage of total expenditure on health (%)
–
Life expectancy at birth (years) [all; female; male] 82; 84; 80 (2011)Total fertility rate (per woman) 1.9 (2010)Neonatal mortality rate (per 1 000 live births) 3 (2011)
Infant mortality rate (per 1 000 live births) 4 (2011)Under-five mortality rate (per 1 000 live births) 5 [4-6] (2011)
Maternal mortality ratio (per 100 000 live births) 7 [4-12] (2010)Births attended by skilled health personnel (%) 99.1 (2009)Antenatal care coverage - at least one visit (%) 97.1 (2009)Antenatal care coverage - at least four visits (%) 91.2 (2009)
Diphtheria tetanus toxoid and pertussis (DTP3) immunization coverage among 1-year-olds (%)
92 (2011)
Postnatal care visit within two days of birth (%) –
Medicare Australia, a universal tax-funded health insurance system introduced in 1984, provides medical, pharmaceutical and hospital treatment to all permanent residents. Public hospital care is free of user charges, and access to doctors of choice for out-of-hospital care and prescription drugs is subsidized. For services not referred by a general practitioner and for all other out-of-hospital services, Medicare coverage is 85%. Private insurance covers some services such as long-term care, dental treatment and home nursing. Private expenditure represents 31.5% of total expenditure on health, and 63% of this is out of pocket. In 2011, about 45% of the population had private insurance coverage. Australia has a 2.3 ratio of nurses to physicians and 38% of the total physicians are women. The density of physicians varies from 38.3 per 10 000 population in major cities to 16.3 in very remote areas; to tackle this problem, the government has introduced incentives and education and training support. Relicensing, conditional on producing evidence of relevant continuous professional development, is compulsory for physicians, nurses, midwives, dentists and pharmacists.
AUSTRALIA
38%
-80 -40 0 40 80
Low back pain
Cerebrovascular disease
Falls
Neck pain
Road injury
Chronic obstructive pulmonary disease
Ischemic heart disease
Other musculoskeletaldisorders
Trachea, bronchus, and lung cancers
Major depressive disorder
/
2011-2015
*Equal to the total of physicians (N= 81 639; 2011), nurses (N= 188 300; 2009), midwives (N= 13 000; 2009) divided by the 2010 population (N= 22 404 000). Source: (WHO Global Health Observatory - Global Health Workforce Statistics – 2012 update - http://apps.who.int/gho/data/view.main)
**See Annex 1 for full explanation on country profile methods and sources.

HRH POLICY AND STRATEGY
SUB-NATIONAL LOW
GEOGRAPHICAL DISTRIBUTION OF PHYSICIANS(density per 10 000 population)
NATIONAL AVERAGE SUB-NATIONAL HIGH
Female physicians
HUMAN RESOURCES FOR HEALTHPOPULATION AND HEALTH
FEASIBILITYDENSITY OF SHPs (Skilled Health Professional)
PER 10 000 POPULATION (Estimated 2010)POPULATION (MILLIONS)
Is there evidence that the country has mechanisms in place to:
TO
AVAILABILITY
ACCEPTABILITY
ACCESSIBILITY
QUALITY
Top 10 causes of morbidity and mortality (DALYs)Communicable, maternal, neonatal, and nutritional InjuriesNon-communicable
Disability-adjusted life years (DALYs) quantify both premature mortality (YLLS) and disability (YLDs) within a population. The top 10 causes of DALYs are ranked from top to bottom in order of the number of DALYs they contribute in 2010. Bars going right show the percent by which DALYs have increased since 1990. Bars going left show the percent by which DALYs have decreased.
Feasibility of achieving thresholds: Most likely Least likelySomewhat likely
Leadership and Partnership
Policy and Management
Strategy/Plan and Finance
HRH GOVERNANCE
Is there government leadership on health workforce policy and management?
Is there intersectoral and multi-stakeholder partnership to inform health workforce policy and management?
related to population health needs?
informed by data and strategic intelligence?
addressing pre-service education?
addressing geographical distribution and retention?
addressing health workforce performance (e.g. competence, responsiveness and productivity)?
addressing international mobility of health workers; and where relevant the WHO Code of Practice on the International Recruitment of Health Personnel?
Is there a national HRH strategy/plan resulting from the above mechanisms?
For which period?
Does the strategy/plan account for the financial costs and resource requirements to implement it?
= Yes = No = Insufficient data= Partial
Is there evidence that the country is adopting recommended good practices on HRH:
Is existing health workforce policy and human resource management:
?
ACCREDIT training institutions for:
Dentists
Midwives
Nurses
Pharmacists
Physicians
REGULATE:
Dentists
Midwives
Nurses
Pharmacists
Physicians
LICENSE/RE-LICENSE:
Dentists
Midwives
Nurses
Pharmacists
Physicians
A UNIVERSAL TRUTH: NO HEALTH WITHOUT A WORKFORCE48
1 Physician
10.8Physicians
3.6Physicians
1.3Physicians
/ ?
0
50
100
150
200
20152010 2020 2025 2030 20350
120
140
100
80
60
40
20
Thresholds**
34.5/10 00022.8/10 000
59.4/10 000
160
5.7/10 000*
CURRENTDENSITY
Population [all (000s); proportion under 15 (%); proportion over 60 (%)]
151.1; 31; 7 (2010)
Average annual rate of population change (%) 1.2 (2010-2015)
Population living in urban areas (%) 28 (2011)Gross national income per capita (PPP int. $) 1940 (2011)Population living on <$1 (PPP int. $) a day (%) 43.25 (2010)Total expenditure on health as a percentage of gross domestic product (%)
3.7 (2011)
General government expenditure on health as a percentage of total expenditure on health (%)
37 (2011)
External resources for health as a percentage of total expenditure on health (%)
6.6 (2011)
Life expectancy at birth (years) [all; female; male] 70; 70; 69 (2011)Total fertility rate (per woman) 2.2 (2010)Neonatal mortality rate (per 1 000 live births) 26 (2011)
Infant mortality rate (per 1 000 live births) 37 (2011)Under-five mortality rate (per 1 000 live births) 46 [41-51] (2011)
Maternal mortality ratio (per 100 000 live births) 240 [140-410] (2010)Births attended by skilled health personnel (%) 31.1 (2011)Antenatal care coverage - at least one visit (%) 49.8 (2011)Antenatal care coverage - at least four visits (%) 25.5 (2011)
Diphtheria tetanus toxoid and pertussis (DTP3) immunization coverage among 1-year-olds (%)
96 (2011)
Postnatal care visit within two days of birth (%) 27.1 (2011)
The health system is a mix of public, private and nongovernmental organization providers, with private expenditure on health comprising 63% of total health expenditure. The burden of communicable diseases is high yet declining, and the country has made good progress towards meeting Millennium Development Goals 4 and 5. Despite this, there are challenges across the domains of the availability, accessibility, acceptability and quality of the health workforce. The density of skilled health professionals is below indicative thresholds, which may present difficulty for successfully scaling up to meet these by 2035. However, concerted efforts are being made in this regard, especially as regards midwives, with the introduction of innovative training models. There are wide disparities in the distribution of the health workforce, with great variation in the density of physicians between regions. The physician workforce is 21% women, and the ratios of nurses to physicians are below the 2.8 OECD average. Further, evidence indicates that mechanisms for regulating and licensing the health workforce require strengthening. This may indicate that, while the existing human resources for health strategy from 2008 and accompanying policies appear to adopt good practice, they are not yet being fully implemented. However, positive efforts are being made to review and revitalize health professional education as part of a five-country network involving China, India, Thailand and Viet Nam.
BANGLADESH
21%
2008
-250 -200 -150 -100 -50 0 50 100 150 200 250
Preterm birth complications
Low back pain
Lower respiratory infections
Chronic obstructive pulmonary disease
Iron-deficiency anemia
Diarrheal diseases
Drowning
Ischemic heart disease
Tuberculosis
Neonatal encephalopathy(birth asphyxia and birth trauma)
TO MEET THRESHOLDS BY 2035, REQUIRES:
404% increase to meet 22.8/10 000 threshold
662% increase to meet 34.5/10 000 threshold
1213% increase to meet 59.4/10 000 threshold
The ratio of nurses to physicians is
BELOWthe OECD average (2.8:1).
.5Nurses
*Equal to the total of physicians (N= 53 603; 2011), registered nurses (N= 26 899; 2011), assistant family planning officers (N= 1 440; 2011), family planning inspectors (N= 4 500; 2011) divided by the 2010 population (N= 151 125 000). Source (WHO Global Health Observatory - Global Health Workforce Statistics – 2012 update - http://apps.who.int/gho/data/view.main)
**See Annex 1 for full explanation on country profile methods and sources.

GEOGRAPHICAL DISTRIBUTION OF PHYSICIANS(density per 10 000 population)
Female physicians
HUMAN RESOURCES FOR HEALTHPOPULATION AND HEALTH
FEASIBILITYPOPULATION (MILLIONS)
Is there evidence that the country has mechanisms in place to:
TO
AVAILABILITY
ACCEPTABILITY
ACCESSIBILITY
QUALITY
Top 10 causes of morbidity and mortality (DALYs)Communicable, maternal, neonatal, and nutritional InjuriesNon-communicable
Disability-adjusted life years (DALYs) quantify both premature mortality (YLLS) and disability (YLDs) within a population. The top 10 causes of DALYs are ranked from top to bottom in order of the number of DALYs they contribute in 2010. Bars going right show the percent by which DALYs have increased since 1990. Bars going left show the percent by which DALYs have decreased.
Feasibility of achieving thresholds: Most likely Least likelySomewhat likely
ACCREDIT training institutions for:
Dentists
Midwives
Nurses
Pharmacists
Physicians
REGULATE:
Dentists
Midwives
Nurses
Pharmacists
Physicians
LICENSE/RE-LICENSE:
Dentists
Midwives
Nurses
Pharmacists
Physicians
HRH POLICY AND STRATEGY
Leadership and Partnership
Policy and Management
Strategy/Plan and Finance
HRH GOVERNANCE
Is there government leadership on health workforce policy and management?
Is there intersectoral and multi-stakeholder partnership to inform health workforce policy and management?
related to population health needs?
informed by data and strategic intelligence?
addressing pre-service education?
addressing geographical distribution and retention?
addressing health workforce performance (e.g. competence, responsiveness and productivity)?
addressing international mobility of health workers; and where relevant the WHO Code of Practice on the International Recruitment of Health Personnel?
Is there a national HRH strategy/plan resulting from the above mechanisms?
For which period?
Does the strategy/plan account for the financial costs and resource requirements to implement it?
Is there evidence that the country is adopting recommended good practices on HRH:
Is existing health workforce policy and human resource management:
49
DENSITY OF SHPs (Skilled Health Professional) PER 10 000 POPULATION (Estimated 2010)
SUB-NATIONAL LOW NATIONAL AVERAGE SUB-NATIONAL HIGH
1 Physician
COUNTRY PROFILES
?= Yes = Partial = No = Insufficient data
36%
TO MEET THRESHOLDS BY 2035, REQUIRES:
0% increase to meet 22.8/10 000 threshold
0% increase to meet 34.5/10 000 threshold
0% increase to meet 59.4/10 000 threshold
4NursesThe ratio of nurses
to physicians is
ABOVEthe OECD average (2.8:1).
0
50
100
150
200
250
20152010 2020 2025 2030 203520152010 2020 2025 2030 20350
120
140
100
80
60
40
20
Thresholds**
34.5/10 00022.8/10 000
59.4/10 000
160
97.3/10 000*
CURRENTDENSITY
40.9Physicians
19.4Physicians
7.1Physicians
Population [all (000s); proportion under 15 (%); proportion over 60 (%)]
195.2; 25; 10 (2010)
Average annual rate of population change (%) 0.8 (2010-2015)
Population living in urban areas (%) 85 (2011)Gross national income per capita (PPP int. $) 11420 (2011)Population living on <$1 (PPP int. $) a day (%) 7.13 (2007)Total expenditure on health as a percentage of gross domestic product (%)
8.9 (2011)
General government expenditure on health as a percentage of total expenditure on health (%)
46 (2011)
External resources for health as a percentage of total expenditure on health (%)
0.3 (2011)
Life expectancy at birth (years) [all; female; male] 74; 78; 71 (2011)Total fertility rate (per woman) 1.8 (2010)Neonatal mortality rate (per 1 000 live births) 10 (2011)
Infant mortality rate (per 1 000 live births) 14 (2011)Under-five mortality rate (per 1 000 live births) 16 [14-18] (2011)
Maternal mortality ratio (per 100 000 live births) 56 [36-85] (2010)Births attended by skilled health personnel (%) 98.9 (2010)Antenatal care coverage - at least one visit (%) 97.3 (2010)Antenatal care coverage - at least four visits (%) 90.2 (2010)
Diphtheria tetanus toxoid and pertussis (DTP3) immunization coverage among 1-year-olds (%)
96 (2011)
Postnatal care visit within two days of birth (%) –
Brazil recognized universal access to health care as a fundamental right in its Constitution of 1988 and created the Unified Health System (SUS) to provide free comprehensive care and essential medicines to all citizens. In parallel to the SUS, a private subsystem covers predominantly those with capacity to buy private insurance or whose employer provides health coverage – resulting in a two-tiered system. Private expenditure, of which 58% is out of pocket, represents 55% of total health expenditure. The nurse-to-physician ratio is 3.6, above the OECD average, and 36% of physicians are women. There is no national long-term plan for human resources for health, but various strategies and investments address human resources for health needs, such as geographical disparities (the density of physicians varies from 40.9 per 10 000 population in the state of Rio de Janeiro to 7.1 per 10 000 in the state of Maranhão). In June 2013, the Ministry of Health launched Mais Medicos (More Doctors), a national and international recruitment programme to fill in available positions in underserved regions at primary care level. Mechanisms for accreditation and regulation of the health workforce are in place.
BRAZIL
-125 -100 -75 -50 -25 0 25 50 75 100 125
Ischemic heart disease
Interpersonal violence
Low back pain
Cerebrovascular disease
Road injury
Diabetes mellitus
Chronic obstructivepulmonary disease
Lower respiratoryinfections
Preterm birthcomplications
Major depressivedisorder
/
?
*Equal to the total of physicians “médicos“ (N=378 354; 2013), nurses “enfermeiros“ (N= 314 127; 2013), technical nursing personnel “técnicos enfermagem” (N= 698 224; 2013), auxiliary nursing personnel “auxiliares enfermagem” (N=508 182; 2013) divided by the 2010 population (N= 195 210 000). Source: (provided by Government of Brazil on 11 November 2013; Source: regional councils, COFEN and CFM- http://www.portalcofen.gov.br/; http://portal.cfm.org.br/). The aggregate density of physicians “médicos“ and nurses “enfermeiros“ (excluding technical and auxiliary nursing personnel) is 35.5 /10 000 population, and the nurses to physician ratio is 0.8.
**See Annex 1 for full explanation on country profile methods and sources.

HRH POLICY AND STRATEGY
SUB-NATIONAL LOW
GEOGRAPHICAL DISTRIBUTION OF PHYSICIANS(density per 10 000 population)
NATIONAL AVERAGE SUB-NATIONAL HIGH
Female physicians
HUMAN RESOURCES FOR HEALTHPOPULATION AND HEALTH
FEASIBILITYDENSITY OF SHPs (Skilled Health Professional)
PER 10 000 POPULATION (Estimated 2010)POPULATION (MILLIONS)
Is there evidence that the country has mechanisms in place to:
TO
AVAILABILITY
ACCEPTABILITY
ACCESSIBILITY
QUALITY
Top 10 causes of morbidity and mortality (DALYs)Communicable, maternal, neonatal, and nutritional InjuriesNon-communicable
Disability-adjusted life years (DALYs) quantify both premature mortality (YLLS) and disability (YLDs) within a population. The top 10 causes of DALYs are ranked from top to bottom in order of the number of DALYs they contribute in 2010. Bars going right show the percent by which DALYs have increased since 1990. Bars going left show the percent by which DALYs have decreased.
Feasibility of achieving thresholds: Most likely Least likelySomewhat likely
Leadership and Partnership
Policy and Management
Strategy/Plan and Finance
HRH GOVERNANCE
Is there government leadership on health workforce policy and management?
Is there intersectoral and multi-stakeholder partnership to inform health workforce policy and management?
related to population health needs?
informed by data and strategic intelligence?
addressing pre-service education?
addressing geographical distribution and retention?
addressing health workforce performance (e.g. competence, responsiveness and productivity)?
addressing international mobility of health workers; and where relevant the WHO Code of Practice on the International Recruitment of Health Personnel?
Is there a national HRH strategy/plan resulting from the above mechanisms?
For which period?
Does the strategy/plan account for the financial costs and resource requirements to implement it?
= Yes = No = Insufficient data= Partial
Is there evidence that the country is adopting recommended good practices on HRH:
Is existing health workforce policy and human resource management:
?
ACCREDIT training institutions for:
Dentists
Midwives
Nurses
Pharmacists
Physicians
REGULATE:
Dentists
Midwives
Nurses
Pharmacists
Physicians
LICENSE/RE-LICENSE:
Dentists
Midwives
Nurses
Pharmacists
Physicians
A UNIVERSAL TRUTH: NO HEALTH WITHOUT A WORKFORCE50
1 Physician
16%
TO MEET THRESHOLDS BY 2035, REQUIRES:
203% increase to meet 22.8/10 000 threshold
358% increase to meet 34.5/10 000 threshold
689% increase to meet 59.4/10 000 threshold 0
5
10
15
20
25
0
120
140
100
80
60
40
20
160
20152010 2020 2025 2030 2035
10.5/10,000*
CURRENTDENSITY
Thresholds**
34.5/10,00022.8/10,000
59.4/10,000
2.5NursesThe ratio of nurses
to physicians is
BELOWthe OECD average (2.8:1).
–Physicians
2.3Physicians
–Physicians
Population [all (000s); proportion under 15 (%); proportion over 60 (%)]
14.4; 32; 6 (2010)
Average annual rate of population change (%) 1.7 (2010-2015)
Population living in urban areas (%) 20 (2011)Gross national income per capita (PPP int. $) 2230 (2011)Population living on <$1 (PPP int. $) a day (%) 32.23 (2007)Total expenditure on health as a percentage of gross domestic product (%)
5.7 (2011)
General government expenditure on health as a percentage of total expenditure on health (%)
22 (2011)
External resources for health as a percentage of total expenditure on health (%)
15.8 (2011)
Life expectancy at birth (years) [all; female; male] 65; 66; 64 (2011)Total fertility rate (per woman) 2.6 (2010)Neonatal mortality rate (per 1 000 live births) 19 (2011)
Infant mortality rate (per 1 000 live births) 36 (2011)Under-five mortality rate (per 1 000 live births) 43 [36-61] (2011)
Maternal mortality ratio (per 100 000 live births) 250 [160-390] (2010)Births attended by skilled health personnel (%) 71.0 (2010)Antenatal care coverage - at least one visit (%) 89.1 (2010)Antenatal care coverage - at least four visits (%) 59.4 (2010)
Diphtheria tetanus toxoid and pertussis (DTP3) immunization coverage among 1-year-olds (%)
94 (2011)
Postnatal care visit within two days of birth (%) 70.4; 2010 (2010)
There is good progress in providing health access to people with low income through funding schemes such as the Health Equity Fund, and the country is on track to meeting the health-related Millennium Development Goals. The burden of disease appears to be shifting from communicable to noncommunicable diseases: diarrhoeal disease in particular, has decreased by 80% from 1990 to 2010. Despite these positive signs, the availability of skilled health professionals is below indicative thresholds and would need to almost double to meet the lowest of these by 2035. Inequities in accessibility are a challenge, with access to skilled birth attendants ranging between 50% and 100% from poorest to richest areas. There is evidence of good policies, including a costed plan for human resources for health (2008–2015), although some key areas such as preservice and in-service education may require even greater focus.
CAMBODIA
-150 -100 -50 0 50 100 150
Cerebrovascular disease
Preterm birth complications
Tuberculosis
Congenital anomalies
Iron-deficiency anemia
Road injury
Major depressive disorder
Diarrheal diseases
Lower respiratoryinfections
Ischemic heartdisease
?
??
?
??
??
2006-2015
? / ?
*Equal to the total of physicians (N= 3 393; 2008), nurses (8 491; 2008) and midwives (N= 3 245; 2008) divided by the 2010 population (N= 14 365 000). Source (WHO Global Health Observatory - Global Health Workforce Statistics – 2012 update- http://apps.who.int/gho/data/view.main)
**See Annex 1 for full explanation on country profile methods and sources.

GEOGRAPHICAL DISTRIBUTION OF PHYSICIANS(density per 10 000 population)
Female physicians
HUMAN RESOURCES FOR HEALTHPOPULATION AND HEALTH
FEASIBILITYPOPULATION (MILLIONS)
Is there evidence that the country has mechanisms in place to:
TO
AVAILABILITY
ACCEPTABILITY
ACCESSIBILITY
QUALITY
Top 10 causes of morbidity and mortality (DALYs)Communicable, maternal, neonatal, and nutritional InjuriesNon-communicable
Disability-adjusted life years (DALYs) quantify both premature mortality (YLLS) and disability (YLDs) within a population. The top 10 causes of DALYs are ranked from top to bottom in order of the number of DALYs they contribute in 2010. Bars going right show the percent by which DALYs have increased since 1990. Bars going left show the percent by which DALYs have decreased.
Feasibility of achieving thresholds: Most likely Least likelySomewhat likely
ACCREDIT training institutions for:
Dentists
Midwives
Nurses
Pharmacists
Physicians
REGULATE:
Dentists
Midwives
Nurses
Pharmacists
Physicians
LICENSE/RE-LICENSE:
Dentists
Midwives
Nurses
Pharmacists
Physicians
HRH POLICY AND STRATEGY
Leadership and Partnership
Policy and Management
Strategy/Plan and Finance
HRH GOVERNANCE
Is there government leadership on health workforce policy and management?
Is there intersectoral and multi-stakeholder partnership to inform health workforce policy and management?
related to population health needs?
informed by data and strategic intelligence?
addressing pre-service education?
addressing geographical distribution and retention?
addressing health workforce performance (e.g. competence, responsiveness and productivity)?
addressing international mobility of health workers; and where relevant the WHO Code of Practice on the International Recruitment of Health Personnel?
Is there a national HRH strategy/plan resulting from the above mechanisms?
For which period?
Does the strategy/plan account for the financial costs and resource requirements to implement it?
= Yes = No = Insufficient data= Partial
Is there evidence that the country is adopting recommended good practices on HRH:
Is existing health workforce policy and human resource management:
?
51
DENSITY OF SHPs (Skilled Health Professional) PER 10 000 POPULATION (Estimated 2010)
SUB-NATIONAL LOW NATIONAL AVERAGE SUB-NATIONAL HIGH
1 Physician
COUNTRY PROFILES
TO MEET THRESHOLDS BY 2035, REQUIRES:
0% increase to meet 22.8/10 000 threshold
24% increase to meet 34.5/10 000 threshold
114% increase to meet 59.4/10 000 threshold
43%
20152010 2020 2025 2030 20350
120
140
100
80
60
40
20
Thresholds**
34.5/10,00022.8/10,000
0
300
600
900
1200
1500
59.4/10,000
160
29.9/10,000*
CURRENTDENSITY
1.0Nurses
37.8Physicians
14.6Physicians
9.2Physicians
Population [all (000s); proportion under 15 (%); proportion over 60 (%)]
1359.8; 19; 12 (2010)
Average annual rate of population change (%) 0.6 (2010-2015)
Population living in urban areas (%) 51 (2011)Gross national income per capita (PPP int. $) 8390 (2011)Population living on <$1 (PPP int. $) a day (%) 13.06 (2008)Total expenditure on health as a percentage of gross domestic product (%)
5.2 (2011)
General government expenditure on health as a percentage of total expenditure on health (%)
56 (2011)
External resources for health as a percentage of total expenditure on health (%)
0.1 (2011)
Life expectancy at birth (years) [all; female; male] 76; 77; 74 (2011)Total fertility rate (per woman) 1.6 (2010)Neonatal mortality rate (per 1 000 live births) 9 (2011)
Infant mortality rate (per 1 000 live births) 13 (2011)Under-five mortality rate (per 1 000 live births) 15 [13-17] (2011)
Maternal mortality ratio (per 100 000 live births) 37 [23-58] (2010)Births attended by skilled health personnel (%) 96.3 (2009)Antenatal care coverage - at least one visit (%) 94.1 (2010)Antenatal care coverage - at least four visits (%) –
Diphtheria tetanus toxoid and pertussis (DTP3) immunization coverage among 1-year-olds (%)
99 (2011)
Postnatal care visit within two days of birth (%) –
China is making good strides towards meeting Millennium Development Goals 4 and 5. There is no single universal health coverage scheme, but a variety of schemes exist for different population groups, including a mandatory scheme for all formal sector workers. The New Rural Cooperative Medical Scheme now covers more than 90% of the rural population in China, a significant part of China’s efforts to reach universal health coverage. In practice, financial coverage depends on the availability of funds, although this is being substantially improved. Lifestyle shifts are leading to a rising burden of chronic diseases, which are recognized as a policy priority. There is good availability of skilled health professionals, already above the 22.8 per 10 000 population threshold and on track to meet the 34.5 per 10 000 indicative threshold by 2035. China benefits from a low-cost medical education system, graduating about 175 000 doctors annually. In addition, about 1 million village doctors, who mostly have vocational training, are serving in rural areas. However, a bias towards urban areas in the distribution of human resources remains, and there is scope for further improving the quality of care. The plan for human resources for health for 2011–2020 is attempting to address some of these issues with measures to improve the retention, distribution and performance of the health workforce.
CHINA
-150 -100 -50 0 50 100 150
Cerebrovascular disease
Low back pain
Road injury
Liver cancer
Major depressive disorder
Diabetes mellitus
Falls
Chronic obstructivepulmonary disease
Ischemic heartdisease
Trachea, bronchus,and lung cancers
?
??
???
?
??
?
?
/ ?
?
?
2011-2020
The ratio of nurses to physicians is
BELOWthe OECD average (2.8:1).
*Equal to the total of physicians (N= 1 972 840; 2010), nurses (N= 2 048 071; 2010) and midwives (N= 42 000; 2001) divided by the 2010 population (N= 1 359 821 000). Source (WHO Global Health Observatory - Global Health Workforce Statistics – 2012 update- http://apps.who.int/gho/data/view.main)
**See Annex 1 for full explanation on country profile methods and sources.

HRH POLICY AND STRATEGY
SUB-NATIONAL LOW
GEOGRAPHICAL DISTRIBUTION OF PHYSICIANS(density per 10 000 population)
NATIONAL AVERAGE SUB-NATIONAL HIGH
Female physicians
HUMAN RESOURCES FOR HEALTHPOPULATION AND HEALTH
FEASIBILITYDENSITY OF SHPs (Skilled Health Professional)
PER 10 000 POPULATION (Estimated 2010)POPULATION (MILLIONS)
Is there evidence that the country has mechanisms in place to:
TO
AVAILABILITY
ACCEPTABILITY
ACCESSIBILITY
QUALITY
Top 10 causes of morbidity and mortality (DALYs)Communicable, maternal, neonatal, and nutritional InjuriesNon-communicable
Disability-adjusted life years (DALYs) quantify both premature mortality (YLLS) and disability (YLDs) within a population. The top 10 causes of DALYs are ranked from top to bottom in order of the number of DALYs they contribute in 2010. Bars going right show the percent by which DALYs have increased since 1990. Bars going left show the percent by which DALYs have decreased.
Feasibility of achieving thresholds: Most likely Least likelySomewhat likely
Leadership and Partnership
Policy and Management
Strategy/Plan and Finance
HRH GOVERNANCE
Is there government leadership on health workforce policy and management?
Is there intersectoral and multi-stakeholder partnership to inform health workforce policy and management?
related to population health needs?
informed by data and strategic intelligence?
addressing pre-service education?
addressing geographical distribution and retention?
addressing health workforce performance (e.g. competence, responsiveness and productivity)?
addressing international mobility of health workers; and where relevant the WHO Code of Practice on the International Recruitment of Health Personnel?
Is there a national HRH strategy/plan resulting from the above mechanisms?
For which period?
Does the strategy/plan account for the financial costs and resource requirements to implement it?
= Yes = No = Insufficient data= Partial
Is there evidence that the country is adopting recommended good practices on HRH:
Is existing health workforce policy and human resource management:
?
ACCREDIT training institutions for:
Dentists
Midwives
Nurses
Pharmacists
Physicians
REGULATE:
Dentists
Midwives
Nurses
Pharmacists
Physicians
LICENSE/RE-LICENSE:
Dentists
Midwives
Nurses
Pharmacists
Physicians
A UNIVERSAL TRUTH: NO HEALTH WITHOUT A WORKFORCE52
1 Physician
Top 10 causes of morbidity and mortality (DALYs)Communicable, maternal, neonatal, and nutritional InjuriesNon-communicable
Disability-adjusted life years (DALYs) quantify both premature mortality (YLLS) and disability (YLDs) within a population. The top 10 causes of DALYs are ranked from top to bottom in order of the number of DALYs they contribute in 2010. Bars going right show the percent by which DALYs have increased since 1990. Bars going left show the percent by which DALYs have decreased.
A UNIVERSAL TRUTH: NO HEALTH WITHOUT A WORKFORCE52
Top 10 causes of morbidity and mortality (DALYs)Communicable, maternal, neonatal, and nutritional InjuriesNon-communicable
A UNIVERSAL TRUTH: NO HEALTH WITHOUT A WORKFORCE52
0
3
6
9
12
15
20152010 2020 2025 2030 203520152010 2020 2025 2030 20350
120
140
100
80
60
40
20
Thresholds**
34.5/10 00022.8/10 000
59.4/10 000
160
159.1/10 000*
CURRENTDENSITY
TO MEET THRESHOLDS BY 2035, REQUIRES:
0% increase to meet 22.8/10 000 threshold
0% increase to meet 34.5/10 000 threshold
0% increase to meet 59.4/10 000 threshold
61%1.3
Nurses
100.7Physicians
67.2Physicians
45.2Physicians
Population [all (000s); proportion under 15 (%); proportion over 60 (%)]
11.3; 17; 17 (2010)
Average annual rate of population change (%) -0.1 (2010-2015)
Population living in urban areas (%) 75 (2011)Gross national income per capita (PPP int. $) –Population living on <$1 (PPP int. $) a day (%) –Total expenditure on health as a percentage of gross domestic product (%)
10.0 (2011)
General government expenditure on health as a percentage of total expenditure on health (%)
95 (2011)
External resources for health as a percentage of total expenditure on health (%)
0.2 (2011)
Life expectancy at birth (years) [all; female; male] 78; 80; 76 (2011)Total fertility rate (per woman) 1.5 (2010)Neonatal mortality rate (per 1 000 live births) 3 (2011)
Infant mortality rate (per 1 000 live births) 5 (2011)Under-five mortality rate (per 1 000 live births) 6 [5-7] (2011)
Maternal mortality ratio (per 100 000 live births) 73 [60-87] (2010)Births attended by skilled health personnel (%) 99.9 (2011)Antenatal care coverage - at least one visit (%) 100 (2009)Antenatal care coverage - at least four visits (%) 100 (2011)
Diphtheria tetanus toxoid and pertussis (DTP3) immunization coverage among 1-year-olds (%)
96 (2011)
Postnatal care visit within two days of birth (%) –
In Cuba, government expenditure on health represents about 95% of total expenditure, the rest being out-of-pocket expenditure. There is universal access to a comprehensive package of health services free of user charges. Primary health care is given priority, aiming at dealing with 80% of health problems. The whole population has access to a family physician. Cuba has a 1.3 ratio of nurses to physicians, and 61% of physicians are women. The density of physicians in the capital is more than twice that of the region with the lowest density. Health workforce issues are given priority through programmes such as Programa del Médico y Enfermera de la Familia and Programa de Mejora Continua de la Calidad de la Atención Estomatológica y la Satisfacción de la Probación y los Prestadores. Mechanisms for physician accreditation and regulation are in place, although no information was found regarding midwifery accreditation, regulation or licensing systems.
CUBA
-100 -50 0 50 100
Ischemic heart disease
Cerebrovascular disease
Low back pain
Diabetes mellitus
Falls
Road injury
Lower respiratory infections
Trachea, bronchus,and lung cancers
Chronic obstructivepulmonary disease
Major depressivedisorder
? ? ?
?
? / ?
?
?
The ratio of nurses to physicians is
BELOWthe OECD average (2.8:1).
*Equal to the total of physicians (N= 76 506; 2010), licensed nurses (N= 47 776; 2010), nursing technicians (N= 42 693; 2010), basic nurses (N= 12 541; 2010), auxiliary nurses (N= 4; 2010) divided by the 2010 population (N= 11 282 000). Source: (WHO Global Health Observatory - Global Health Workforce Statistics – 2012 update- http://apps.who.int/gho/data/view.main)
**See Annex 1 for full explanation on country profile methods and sources.

GEOGRAPHICAL DISTRIBUTION OF PHYSICIANS(density per 10 000 population)
Female physicians
HUMAN RESOURCES FOR HEALTHPOPULATION AND HEALTH
FEASIBILITYPOPULATION (MILLIONS)
Is there evidence that the country has mechanisms in place to:
TO
AVAILABILITY
ACCEPTABILITY
ACCESSIBILITY
QUALITY
Top 10 causes of morbidity and mortality (DALYs)Communicable, maternal, neonatal, and nutritional InjuriesNon-communicable
Disability-adjusted life years (DALYs) quantify both premature mortality (YLLS) and disability (YLDs) within a population. The top 10 causes of DALYs are ranked from top to bottom in order of the number of DALYs they contribute in 2010. Bars going right show the percent by which DALYs have increased since 1990. Bars going left show the percent by which DALYs have decreased.
Feasibility of achieving thresholds: Most likely Least likelySomewhat likely
ACCREDIT training institutions for:
Dentists
Midwives
Nurses
Pharmacists
Physicians
REGULATE:
Dentists
Midwives
Nurses
Pharmacists
Physicians
LICENSE/RE-LICENSE:
Dentists
Midwives
Nurses
Pharmacists
Physicians
HRH POLICY AND STRATEGY
Leadership and Partnership
Policy and Management
Strategy/Plan and Finance
HRH GOVERNANCE
Is there government leadership on health workforce policy and management?
Is there intersectoral and multi-stakeholder partnership to inform health workforce policy and management?
related to population health needs?
informed by data and strategic intelligence?
addressing pre-service education?
addressing geographical distribution and retention?
addressing health workforce performance (e.g. competence, responsiveness and productivity)?
addressing international mobility of health workers; and where relevant the WHO Code of Practice on the International Recruitment of Health Personnel?
Is there a national HRH strategy/plan resulting from the above mechanisms?
For which period?
Does the strategy/plan account for the financial costs and resource requirements to implement it?
= Yes = No = Insufficient data= Partial
Is there evidence that the country is adopting recommended good practices on HRH:
Is existing health workforce policy and human resource management:
?
53
DENSITY OF SHPs (Skilled Health Professional) PER 10 000 POPULATION (Estimated 2010)
SUB-NATIONAL LOW NATIONAL AVERAGE SUB-NATIONAL HIGH
1 Physician
COUNTRY PROFILES
0
20
40
60
80
100
120
20152010 2020 2025 2030 20350
120
140
100
80
60
40
20
Thresholds**
34.5/10 00022.8/10 000
59.4/
160
64.8/10 000*
CURRENTDENSITY
10 000
TO MEET THRESHOLDS BY 2035, REQUIRES:
0% increase to meet 22.8/10 000 threshold
0% increase to meet 34.5/10 000 threshold
27% increase to meet 59.4/10 000 threshold
1.2Nurses
–Physicians
28.3Physicians
–Physicians
Population [all (000s); proportion under 15 (%); proportion over 60 (%)]
78.1; 32; 8 (2010)
Average annual rate of population change (%) 1.6 (2010-2015)
Population living in urban areas (%) 43 (2011)Gross national income per capita (PPP int. $) 6120 (2011)Population living on <$1 (PPP int. $) a day (%) <2 (2008)Total expenditure on health as a percentage of gross domestic product (%)
4.9 (2011)
General government expenditure on health as a percentage of total expenditure on health (%)
41 (2011)
External resources for health as a percentage of total expenditure on health (%)
0.5 (2011)
Life expectancy at birth (years) [all; female; male] 73; 75; 71 (2011)Total fertility rate (per woman) 2.7 (2010)Neonatal mortality rate (per 1 000 live births) 7 (2011)
Infant mortality rate (per 1 000 live births) 18 (2011)Under-five mortality rate (per 1 000 live births) 21 [19-23] (2011)
Maternal mortality ratio (per 100 000 live births) 66 [40-100] (2010)Births attended by skilled health personnel (%) 78.9 (2008)Antenatal care coverage - at least one visit (%) 73.6 (2008)Antenatal care coverage - at least four visits (%) 66 (2008)
Diphtheria tetanus toxoid and pertussis (DTP3) immunization coverage among 1-year-olds (%)
96 (2011)
Postnatal care visit within two days of birth (%) 64.6 (2008)
EGYPT
-200 -150 -100 -50 0 50 100 150 200
Cirrhosis of the liver
Low back pain
Major depressive disorder
Road injury
Cardiomyopathy and myocarditis
Lower respiratoryinfections
Congenital anomalies
Preterm birth complications
Ischemic heartdisease
Cerebrovasculardisease
NO DATA
Egypt has been engaged in improving the performance of its health services for the past 15 years. The Health Insurance Organization (HIO) covers about half the population, and public services are also available for poor people free of charge. However, half the population reports out-of-pocket costs at the point of service. Egypt is on track to attain the health Millennium Development Goals. The country has traditionally produced numbers of health workers above regional averages, but further improving access to and the quality of services, particularly for poor people and for rural populations, will require sustained efforts to address imbalances in skills mix, improved geographical distribution through better working conditions and even greater focus on investing in required equipment and ensuring uniform quality of education. A sector reform programme initiated in 1997 and due to continue through 2018 aims at progressing towards universal health coverage, including by “investing in human resources development”. Areas for improvement targeting educational institutions include reducing overcrowding, increasing financial resources, upgrading training infrastructure and equipment, improving faculty members’ skills, updating curricula and strengthening formal evaluation and accreditation mechanisms. Efforts to address these challenges are conducted under the Higher Education Enhancement Project Fund.
?
??
??? ?
? / ?
?
?
?
?
The ratio of nurses to physicians is
BELOWthe OECD average (2.8:1).
*Equal to the total of physicians (N= 225 565; 2009) and nursing and midwifery personnel (N= 280 561; 2009) divided by the 2010 population (N= 78 076 000). Source: (WHO Global Health Observatory - Global Health Workforce Statistics – 2012 update- http://apps.who.int/gho/data/view.main)
**See Annex 1 for full explanation on country profile methods and sources.

HRH POLICY AND STRATEGY
SUB-NATIONAL LOW
GEOGRAPHICAL DISTRIBUTION OF PHYSICIANS(density per 10 000 population)
NATIONAL AVERAGE SUB-NATIONAL HIGH
Female physicians
HUMAN RESOURCES FOR HEALTHPOPULATION AND HEALTH
FEASIBILITYDENSITY OF SHPs (Skilled Health Professional)
PER 10 000 POPULATION (Estimated 2010)POPULATION (MILLIONS)
Is there evidence that the country has mechanisms in place to:
TO
AVAILABILITY
ACCEPTABILITY
ACCESSIBILITY
QUALITY
Top 10 causes of morbidity and mortality (DALYs)Communicable, maternal, neonatal, and nutritional InjuriesNon-communicable
Disability-adjusted life years (DALYs) quantify both premature mortality (YLLS) and disability (YLDs) within a population. The top 10 causes of DALYs are ranked from top to bottom in order of the number of DALYs they contribute in 2010. Bars going right show the percent by which DALYs have increased since 1990. Bars going left show the percent by which DALYs have decreased.
Feasibility of achieving thresholds: Most likely Least likelySomewhat likely
Leadership and Partnership
Policy and Management
Strategy/Plan and Finance
HRH GOVERNANCE
Is there government leadership on health workforce policy and management?
Is there intersectoral and multi-stakeholder partnership to inform health workforce policy and management?
related to population health needs?
informed by data and strategic intelligence?
addressing pre-service education?
addressing geographical distribution and retention?
addressing health workforce performance (e.g. competence, responsiveness and productivity)?
addressing international mobility of health workers; and where relevant the WHO Code of Practice on the International Recruitment of Health Personnel?
Is there a national HRH strategy/plan resulting from the above mechanisms?
For which period?
Does the strategy/plan account for the financial costs and resource requirements to implement it?
= Yes = No = Insufficient data= Partial
Is there evidence that the country is adopting recommended good practices on HRH:
Is existing health workforce policy and human resource management:
?
ACCREDIT training institutions for:
Dentists
Midwives
Nurses
Pharmacists
Physicians
REGULATE:
Dentists
Midwives
Nurses
Pharmacists
Physicians
LICENSE/RE-LICENSE:
Dentists
Midwives
Nurses
Pharmacists
Physicians
A UNIVERSAL TRUTH: NO HEALTH WITHOUT A WORKFORCE54
1 Physician
18%
TO MEET THRESHOLDS BY 2035, REQUIRES:
1354% increase to meet 22.8/10 000 threshold
2100% increase to meet 34.5/10 000 threshold
3687% increase to meet 59.4/10 000 threshold
The ratio of nurses to physicians is
ABOVEthe OECD average (2.8:1).
9.3Nurses
3.3Physicians
0.3Physicians
0.1Physicians
Population [all (000s); proportion under 15 (%); proportion over 60 (%)]
87.1; 41; 5 (2010)
Average annual rate of population change (%) 2.6 (2010-2015)
Population living in urban areas (%) 17 (2011)Gross national income per capita (PPP int. $) 1110 (2011)Population living on <$1 (PPP int. $) a day (%) –Total expenditure on health as a percentage of gross domestic product (%)
4.7 (2011)
General government expenditure on health as a percentage of total expenditure on health (%)
58 (2011)
External resources for health as a percentage of total expenditure on health (%)
44.3 (2011)
Life expectancy at birth (years) [all; female; male] 60; 62; 59 (2011)Total fertility rate (per woman) 4.2 (2010)Neonatal mortality rate (per 1 000 live births) 31 (2011)
Infant mortality rate (per 1 000 live births) 52 (2011)Under-five mortality rate (per 1 000 live births) 77 [65-93] (2011)
Maternal mortality ratio (per 100 000 live births) 350 [210-630] (2010)Births attended by skilled health personnel (%) 10.0 (2011)Antenatal care coverage - at least one visit (%) 33.9 (2011)Antenatal care coverage - at least four visits (%) 19.1 (2011)
Diphtheria tetanus toxoid and pertussis (DTP3) immunization coverage among 1-year-olds (%)
51 (2011)
Postnatal care visit within two days of birth (%) 6.7 (2011)
Health care is provided on a fee-for-service basis. A key element of the health care funding reforms is to systematize waiver and exemption systems, with government allocation to facilitate access to health services showing improvement in recent years (reaching 2 million beneficiaries). However, challenges remain in identifying beneficiaries and allocating resources from local government. Communicable diseases are the greatest cause of disability-adjusted life-years (DALYs) lost. Ethiopia is making significant progress towards achieving Millennium Development Goal 4. The density of skilled health professionals is lower than indicative thresholds, and there may be challenges in geographical access with a highly unequal distribution of physicians. A low percentage of women doctors (18%) may also indicate problems with acceptability, although the ratio of nurses to doctors is above the OECD average. The Health Sector Development Plan includes a major focus on developing human resources for health, including support for salaries and training. The institutionalization and scaling up of health extension workers through the Health Extension Programme is yielding positive results. Increasing the capacity of training institutions is also seen as a priority. There is a recognized need to improve systems for collecting health workforce data.
ETHIOPIA
-200 -150 -100 -50 0 50 100 150 200
Lower respiratory infections
Diarrheal diseases
Malaria
Preterm birth complications
Tuberculosis
Protein-energy malnutrition
Meningitis
HIV/AIDS
Road injuryNeonatal encephalopathy
(birth asphyxia and birth trauma)
0
50
100
150
200
20152010 2020 2025 2030 20350
120
140
100
80
60
40
20
Thresholds**
34.5/10 00022.8/10 000
59.4/10 000
160
2.7/10 000*
CURRENTDENSITY
?
??
? / ?
2010/11- 2014/15
*Equal to the total of physicians (N= 2 152; 2009), nurses (20 109; 2009), midwives (N= 1 379; 2009) divided by the 2010 population (N= 87 095 000). Source: (WHO Global Health Observatory - Global Health Workforce Statistics – 2012 update - http://apps.who.int/gho/data/view.main)
**See Annex 1 for full explanation on country profile methods and sources.

GEOGRAPHICAL DISTRIBUTION OF PHYSICIANS(density per 10 000 population)
Female physicians
HUMAN RESOURCES FOR HEALTHPOPULATION AND HEALTH
FEASIBILITYPOPULATION (MILLIONS)
Is there evidence that the country has mechanisms in place to:
TO
AVAILABILITY
ACCEPTABILITY
ACCESSIBILITY
QUALITY
Top 10 causes of morbidity and mortality (DALYs)Communicable, maternal, neonatal, and nutritional InjuriesNon-communicable
Disability-adjusted life years (DALYs) quantify both premature mortality (YLLS) and disability (YLDs) within a population. The top 10 causes of DALYs are ranked from top to bottom in order of the number of DALYs they contribute in 2010. Bars going right show the percent by which DALYs have increased since 1990. Bars going left show the percent by which DALYs have decreased.
Feasibility of achieving thresholds: Most likely Least likelySomewhat likely
ACCREDIT training institutions for:
Dentists
Midwives
Nurses
Pharmacists
Physicians
REGULATE:
Dentists
Midwives
Nurses
Pharmacists
Physicians
LICENSE/RE-LICENSE:
Dentists
Midwives
Nurses
Pharmacists
Physicians
HRH POLICY AND STRATEGY
Leadership and Partnership
Policy and Management
Strategy/Plan and Finance
HRH GOVERNANCE
Is there government leadership on health workforce policy and management?
Is there intersectoral and multi-stakeholder partnership to inform health workforce policy and management?
related to population health needs?
informed by data and strategic intelligence?
addressing pre-service education?
addressing geographical distribution and retention?
addressing health workforce performance (e.g. competence, responsiveness and productivity)?
addressing international mobility of health workers; and where relevant the WHO Code of Practice on the International Recruitment of Health Personnel?
Is there a national HRH strategy/plan resulting from the above mechanisms?
For which period?
Does the strategy/plan account for the financial costs and resource requirements to implement it?
= Yes = No = Insufficient data= Partial
Is there evidence that the country is adopting recommended good practices on HRH:
Is existing health workforce policy and human resource management:
?
55
DENSITY OF SHPs (Skilled Health Professional) PER 10 000 POPULATION (Estimated 2010)
SUB-NATIONAL LOW NATIONAL AVERAGE SUB-NATIONAL HIGH
1 Physician
COUNTRY PROFILES
TO MEET THRESHOLDS BY 2035, REQUIRES:
0% increase to meet 22.8/10 000 threshold
40% increase to meet 34.5/10 000 threshold
140% increase to meet 59.4/10 000 threshold 0.0
0.3
0.6
0.9
1.2
1.5
20152010 2020 2025 2030 20350
120
140
100
80
60
40
20
Thresholds**
34.5/10 00022.8/10 000
59.4/10 000
160
27.1/10 000*
CURRENTDENSITY
5.3NursesThe ratio of nurses
to physicians is
ABOVEthe OECD average (2.8:1).
4.7Physicians
4.3Physicians
3.2Physicians
Population [all (000s); proportion under 15 (%); proportion over 60 (%)]
0.9; 29; 8 (2010)
Average annual rate of population change (%) 0.7 (2010-2015)
Population living in urban areas (%) 52 (2011)Gross national income per capita (PPP int. $) 4610 (2011)Population living on <$1 (PPP int. $) a day (%) 5.88 (2009)Total expenditure on health as a percentage of gross domestic product (%)
3.8 (2011)
General government expenditure on health as a percentage of total expenditure on health (%)
68 (2011)
External resources for health as a percentage of total expenditure on health (%)
7.7 (2011)
Life expectancy at birth (years) [all; female; male] 70; 72; 67 (2011)Total fertility rate (per woman) 2.7 (2010)Neonatal mortality rate (per 1 000 live births) 8 (2011)
Infant mortality rate (per 1 000 live births) 14 (2011)Under-five mortality rate (per 1 000 live births) 16 [14-19] (2011)
Maternal mortality ratio (per 100 000 live births) 26 [15-48] (2010)Births attended by skilled health personnel (%) 99.7 (2010)Antenatal care coverage - at least one visit (%) 100 (2005)Antenatal care coverage - at least four visits (%) –
Diphtheria tetanus toxoid and pertussis (DTP3) immunization coverage among 1-year-olds (%)
99 (2011)
Postnatal care visit within two days of birth (%) –
The public health system offers most services free of charge to all residents; 40% of the population is estimated to have access to high-quality services, partly due to resource limitations and geographical barriers. Noncommunicable diseases are an important and rising burden, with heart disease and diabetes as the two major causes of DALYs lost. The data show a good availability of skilled health professionals, with likelihood of meeting the highest indicative threshold by 2035. However, these aggregate numbers may conceal a shortage of physicians, particularly in rural areas. Policy on human resources for health is attempting to address this problem with the recruitment of expatriate doctors while aiming to reduce these numbers as more nationally trained staff become available, to preserve local capacity. Another positive factor is the existence of strong mechanisms for quality control of the workforce (accreditation, regulation and licensing), including requirements of evidence of continuous professional development for relicensing health workers.
FIJI
-250 -200 -150 -100 -50 0 50 100 150 200 250
Ischemic heart disease
Diabetes mellitus
Low back pain
Congenital anomalies
Asthma
Chronic obstructive pulmonary disease
Lower respiratory infections
Cerebrovascular disease
Preterm birth complications
Major depressive disorder
NO DATA / ?
1997-2012
*Equal to the total of physicians (N= 372; 2009), nursing and midwifery personnel (N= 1 957; 2009) divided by the 2010 population (N= 861 000). Source: (WHO Global Health Observatory - Global Health Workforce Statistics – 2012 update - http://apps.who.int/gho/data/view.main)
**See Annex 1 for full explanation on country profile methods and sources.
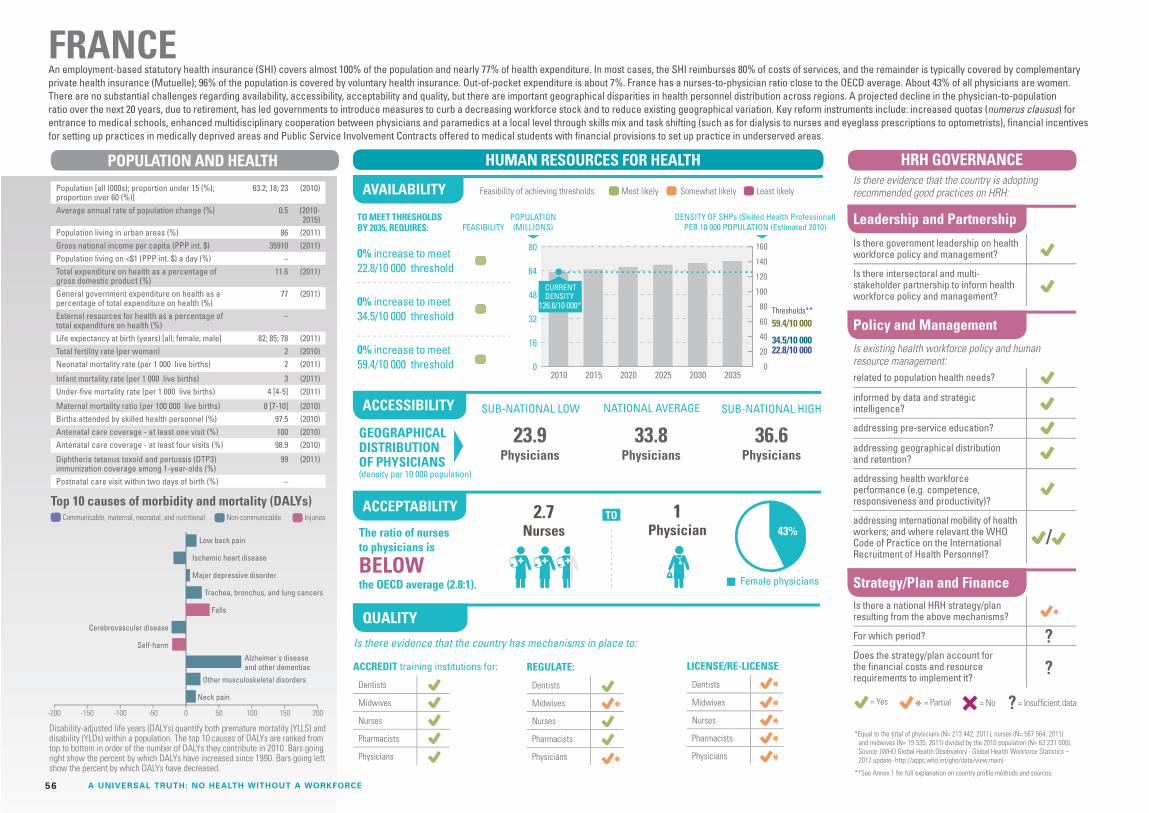
HRH POLICY AND STRATEGY
SUB-NATIONAL LOW
GEOGRAPHICAL DISTRIBUTION OF PHYSICIANS(density per 10 000 population)
NATIONAL AVERAGE SUB-NATIONAL HIGH
Female physicians
HUMAN RESOURCES FOR HEALTHPOPULATION AND HEALTH
FEASIBILITYDENSITY OF SHPs (Skilled Health Professional)
PER 10 000 POPULATION (Estimated 2010)POPULATION (MILLIONS)
Is there evidence that the country has mechanisms in place to:
TO
AVAILABILITY
ACCEPTABILITY
ACCESSIBILITY
QUALITY
Top 10 causes of morbidity and mortality (DALYs)Communicable, maternal, neonatal, and nutritional InjuriesNon-communicable
Disability-adjusted life years (DALYs) quantify both premature mortality (YLLS) and disability (YLDs) within a population. The top 10 causes of DALYs are ranked from top to bottom in order of the number of DALYs they contribute in 2010. Bars going right show the percent by which DALYs have increased since 1990. Bars going left show the percent by which DALYs have decreased.
Feasibility of achieving thresholds: Most likely Least likelySomewhat likely
Leadership and Partnership
Policy and Management
Strategy/Plan and Finance
HRH GOVERNANCE
Is there government leadership on health workforce policy and management?
Is there intersectoral and multi-stakeholder partnership to inform health workforce policy and management?
related to population health needs?
informed by data and strategic intelligence?
addressing pre-service education?
addressing geographical distribution and retention?
addressing health workforce performance (e.g. competence, responsiveness and productivity)?
addressing international mobility of health workers; and where relevant the WHO Code of Practice on the International Recruitment of Health Personnel?
Is there a national HRH strategy/plan resulting from the above mechanisms?
For which period?
Does the strategy/plan account for the financial costs and resource requirements to implement it?
= Yes = No = Insufficient data= Partial
Is there evidence that the country is adopting recommended good practices on HRH:
Is existing health workforce policy and human resource management:
?
ACCREDIT training institutions for:
Dentists
Midwives
Nurses
Pharmacists
Physicians
REGULATE:
Dentists
Midwives
Nurses
Pharmacists
Physicians
LICENSE/RE-LICENSE:
Dentists
Midwives
Nurses
Pharmacists
Physicians
A UNIVERSAL TRUTH: NO HEALTH WITHOUT A WORKFORCE56
1 Physician 43%
TO MEET THRESHOLDS BY 2035, REQUIRES:
0% increase to meet 22.8/10 000 threshold
0% increase to meet 34.5/10 000 threshold
0% increase to meet 59.4/10 000 threshold 0
16
32
48
64
80
20152010 2020 2025 2030 20350
120
140
100
80
60
40
20
Thresholds**
34.5/10 00022.8/10 000
59.4/10 000
160
126.6/10 000*
CURRENTDENSITY
2.7Nurses
36.6Physicians
33.8Physicians
23.9Physicians
Population [all (000s); proportion under 15 (%); proportion over 60 (%)]
63.2; 18; 23 (2010)
Average annual rate of population change (%) 0.5 (2010-2015)
Population living in urban areas (%) 86 (2011)Gross national income per capita (PPP int. $) 35910 (2011)Population living on <$1 (PPP int. $) a day (%) –Total expenditure on health as a percentage of gross domestic product (%)
11.6 (2011)
General government expenditure on health as a percentage of total expenditure on health (%)
77 (2011)
External resources for health as a percentage of total expenditure on health (%)
–
Life expectancy at birth (years) [all; female; male] 82; 85; 78 (2011)Total fertility rate (per woman) 2 (2010)Neonatal mortality rate (per 1 000 live births) 2 (2011)
Infant mortality rate (per 1 000 live births) 3 (2011)Under-five mortality rate (per 1 000 live births) 4 [4-5] (2011)
Maternal mortality ratio (per 100 000 live births) 8 [7-10] (2010)Births attended by skilled health personnel (%) 97.5 (2010)Antenatal care coverage - at least one visit (%) 100 (2010)Antenatal care coverage - at least four visits (%) 98.9 (2010)
Diphtheria tetanus toxoid and pertussis (DTP3) immunization coverage among 1-year-olds (%)
99 (2011)
Postnatal care visit within two days of birth (%) –
An employment-based statutory health insurance (SHI) covers almost 100% of the population and nearly 77% of health expenditure. In most cases, the SHI reimburses 80% of costs of services, and the remainder is typically covered by complementary private health insurance (Mutuelle); 96% of the population is covered by voluntary health insurance. Out-of-pocket expenditure is about 7%. France has a nurses-to-physician ratio close to the OECD average. About 43% of all physicians are women. There are no substantial challenges regarding availability, accessibility, acceptability and quality, but there are important geographical disparities in health personnel distribution across regions. A projected decline in the physician-to-population ratio over the next 20 years, due to retirement, has led governments to introduce measures to curb a decreasing workforce stock and to reduce existing geographical variation. Key reform instruments include: increased quotas (numerus clausus) for entrance to medical schools, enhanced multidisciplinary cooperation between physicians and paramedics at a local level through skills mix and task shifting (such as for dialysis to nurses and eyeglass prescriptions to optometrists), financial incentives for setting up practices in medically deprived areas and Public Service Involvement Contracts offered to medical students with financial provisions to set up practice in underserved areas.
FRANCE
-200 -150 -100 -50 0 50 100 150 200
Low back pain
Ischemic heart disease
Major depressive disorder
Trachea, bronchus, and lung cancers
Falls
Other musculoskeletal disorders
Neck pain
Alzheimer's diseaseand other dementias
Cerebrovascular disease
Self-harm
/
?
?
The ratio of nurses to physicians is
BELOWthe OECD average (2.8:1).
*Equal to the total of physicians (N= 213 442; 2011), nurses (N= 567 564; 2011) and midwives (N= 19 535; 2011) divided by the 2010 population (N= 63 231 000). Source: (WHO Global Health Observatory - Global Health Workforce Statistics – 2012 update- http://apps.who.int/gho/data/view.main)
**See Annex 1 for full explanation on country profile methods and sources.

GEOGRAPHICAL DISTRIBUTION OF PHYSICIANS(density per 10 000 population)
Female physicians
HUMAN RESOURCES FOR HEALTHPOPULATION AND HEALTH
FEASIBILITYPOPULATION (MILLIONS)
Is there evidence that the country has mechanisms in place to:
TO
AVAILABILITY
ACCEPTABILITY
ACCESSIBILITY
QUALITY
Top 10 causes of morbidity and mortality (DALYs)Communicable, maternal, neonatal, and nutritional InjuriesNon-communicable
Disability-adjusted life years (DALYs) quantify both premature mortality (YLLS) and disability (YLDs) within a population. The top 10 causes of DALYs are ranked from top to bottom in order of the number of DALYs they contribute in 2010. Bars going right show the percent by which DALYs have increased since 1990. Bars going left show the percent by which DALYs have decreased.
Feasibility of achieving thresholds: Most likely Least likelySomewhat likely
ACCREDIT training institutions for:
Dentists
Midwives
Nurses
Pharmacists
Physicians
REGULATE:
Dentists
Midwives
Nurses
Pharmacists
Physicians
LICENSE/RE-LICENSE:
Dentists
Midwives
Nurses
Pharmacists
Physicians
HRH POLICY AND STRATEGY
Leadership and Partnership
Policy and Management
Strategy/Plan and Finance
HRH GOVERNANCE
Is there government leadership on health workforce policy and management?
Is there intersectoral and multi-stakeholder partnership to inform health workforce policy and management?
related to population health needs?
informed by data and strategic intelligence?
addressing pre-service education?
addressing geographical distribution and retention?
addressing health workforce performance (e.g. competence, responsiveness and productivity)?
addressing international mobility of health workers; and where relevant the WHO Code of Practice on the International Recruitment of Health Personnel?
Is there a national HRH strategy/plan resulting from the above mechanisms?
For which period?
Does the strategy/plan account for the financial costs and resource requirements to implement it?
= Yes = No = Insufficient data= Partial
Is there evidence that the country is adopting recommended good practices on HRH:
Is existing health workforce policy and human resource management:
?
57
DENSITY OF SHPs (Skilled Health Professional) PER 10 000 POPULATION (Estimated 2010)
SUB-NATIONAL LOW NATIONAL AVERAGE SUB-NATIONAL HIGH
1 Physician
COUNTRY PROFILES
26%The ratio of nurses to physicians is
ABOVEthe OECD average (2.8:1).
The National Health Insurance Scheme covers about 61% of the population: a package of care that provides services for most health problems, with a particular focus on maternal and child health. Premiums are determined by income level, with exemptions for vulnerable groups. Maternal outcomes are improving, but much remains to be done to improve children’s health. Although the health service has a dedicated human resources division and steps have been taken to involve other key stakeholders in policy development, evidence indicates that sustained efforts will be required to fully address workforce challenges. The availability of skilled health professionals is below indicative thresholds, and with rapid population growth, it may be unlikely to scale up effectively before 2035. The density of physicians is particularly low and features significant disparities in geographical distribution. There is need for a greater emphasis on strengthening regulatory mechanisms to improve quality. Further, data collection systems require improvement to inform effective policy. However, positive measures have been taken to improve remuneration, and there has been a decline in migration outflows of health workers, especially nurses.
GHANA
TO MEET THRESHHOLDS BY 2030, REQUIRES:
221% increase to meet 22.8/10 000 threshold
386% increase to meet 34.5/10 000 threshold
736% increase to meet 59.4/10 000 threshold
.1Physicians
.9Physicians
1.9Physicians
12.3 Nurses
Population [all (000s); proportion under 15 (%); proportion over 60 (%)]
24.3; 39; 6 (2010)
Annual population growth rate (%) 2.1 (2011)Population living in urban areas (%) 52 (2011)Gross national income per capita (PPP int. $) 1810 (2011)Population living on <$1 (PPP int. $) a day (%) –Total expenditure on health as a percentage of gross domestic product (%)
4.8 (2011)
General government expenditure on health as a percentage of total expenditure on health (%)
56 (2011)
External resources for health as a percentage of total expenditure on health (%)
14.2 (2011)
Life expectancy at birth (years) [all; female; male] 64; 65; 62 (2011)Total fertility rate (per woman) 4.2 (2010)Neonatal mortality rate (per 1 000 live births) 29 (2011)
Infant mortality rate (per 1 000 live births) 52 (2011)Under-five mortality rate (per 1 000 live births) 78 [66-95] (2011)
Maternal mortality ratio (per 100 000 live births) 350 [210-630] (2010)Births attended by skilled health personnel (%) 54.7 (2008)Antenatal care coverage - at least one visit (%) 86.7 (2008)Antenatal care coverage - at least four visits (%) 78.2 (2008)
Diphtheria tetanus toxoid and pertussis (DTP3) immunization coverage among 1-year-olds (%)
91 (2011)
Postnatal care visit within two days of birth (%) 68.3 (2008)
0
10
20
30
40
20152010 2020 2025 2030 20350
120
140
100
80
60
40
20
Thresholds**
34.5/10 00022.8/10 000
59.4/10 000
160
13.6/10 000*
CURRENTDENSITY
-160 -80 0 80 160
Malaria
HIV/AIDS
Preterm birth complications
Protein-energy malnutrition
Iron-deficiency anemia
Cerebrovascular disease
Meningitis
Lower respiratory infections
Neonatal encephalopathy(birth asphyxia and birth trauma)
Sepsis and other infectiousdisorders of the newborn baby
/
2007-2011
*Equal to the total of physicians (N= 2 033; 2009), nurses (N= 24 974; 2009), registered midwives (N= 2 810; 2008) and enrolled midwives (N= 3 224; 2009) divided by the 2010 population (N= 24 263 000). Source: (WHO Global Health Observatory - Global Health Workforce Statistics – 2012 - http://apps.who.int/gho/data/view.main)
**See Annex 1 for full explanation on country profile methods and sources.

HRH POLICY AND STRATEGY
SUB-NATIONAL LOW
GEOGRAPHICAL DISTRIBUTION OF PHYSICIANS(density per 10 000 population)
NATIONAL AVERAGE SUB-NATIONAL HIGH
Female physicians
HUMAN RESOURCES FOR HEALTHPOPULATION AND HEALTH
FEASIBILITYDENSITY OF SHPs (Skilled Health Professional)
PER 10 000 POPULATION (Estimated 2010)POPULATION (MILLIONS)
Is there evidence that the country has mechanisms in place to:
TO
AVAILABILITY
ACCEPTABILITY
ACCESSIBILITY
QUALITY
Top 10 causes of morbidity and mortality (DALYs)Communicable, maternal, neonatal, and nutritional InjuriesNon-communicable
Disability-adjusted life years (DALYs) quantify both premature mortality (YLLS) and disability (YLDs) within a population. The top 10 causes of DALYs are ranked from top to bottom in order of the number of DALYs they contribute in 2010. Bars going right show the percent by which DALYs have increased since 1990. Bars going left show the percent by which DALYs have decreased.
Feasibility of achieving thresholds: Most likely Least likelySomewhat likely
Leadership and Partnership
Policy and Management
Strategy/Plan and Finance
HRH GOVERNANCE
Is there government leadership on health workforce policy and management?
Is there intersectoral and multi-stakeholder partnership to inform health workforce policy and management?
related to population health needs?
informed by data and strategic intelligence?
addressing pre-service education?
addressing geographical distribution and retention?
addressing health workforce performance (e.g. competence, responsiveness and productivity)?
addressing international mobility of health workers; and where relevant the WHO Code of Practice on the International Recruitment of Health Personnel?
Is there a national HRH strategy/plan resulting from the above mechanisms?
For which period?
Does the strategy/plan account for the financial costs and resource requirements to implement it?
= Yes = No = Insufficient data= Partial
Is there evidence that the country is adopting recommended good practices on HRH:
Is existing health workforce policy and human resource management:
?
ACCREDIT training institutions for:
Dentists
Midwives
Nurses
Pharmacists
Physicians
REGULATE:
Dentists
Midwives
Nurses
Pharmacists
Physicians
LICENSE/RE-LICENSE:
Dentists
Midwives
Nurses
Pharmacists
Physicians
A UNIVERSAL TRUTH: NO HEALTH WITHOUT A WORKFORCE58
1 Physician
0
3
6
9
12
15
20152010 2020 2025 2030 20350
120
140
100
80
60
40
20
Thresholds**
34.5/10 00022.8/10 000
59.4/10 000
160
97.7/10 000*
CURRENTDENSITY
54%
TO MEET THRESHOLDS BY 2035, REQUIRES:
0% increase to meet 22.8/10 000 threshold
0% increase to meet 34.5/10 000 threshold
0% increase to meet 59.4/10 000 threshold
1.8Nurses
60.8Physicians
34.1Physicians
23.5Physicians
Population [all (000s); proportion under 15 (%); proportion over 60 (%)]
10; 15; 23 (2010)
Average annual rate of population change (%) -0.2 (2010-2015)
Population living in urban areas (%) 69 (2011)Gross national income per capita (PPP int. $) 20310 (2011)Population living on <$1 (PPP int. $) a day (%) <2 (2007)Total expenditure on health as a percentage of gross domestic product (%)
7.7 (2011)
General government expenditure on health as a percentage of total expenditure on health (%)
65 (2011)
External resources for health as a percentage of total expenditure on health (%)
–
Life expectancy at birth (years) [all; female; male] 75; 79; 71 (2011)Total fertility rate (per woman) 1.4 (2010)Neonatal mortality rate (per 1 000 live births) 4 (2011)
Infant mortality rate (per 1 000 live births) 5 (2011)Under-five mortality rate (per 1 000 live births) 6 [6-7] (2011)
Maternal mortality ratio (per 100 000 live births) 21 [15-31] (2010)Births attended by skilled health personnel (%) 99.1 (2010)Antenatal care coverage - at least one visit (%) –Antenatal care coverage - at least four visits (%) –
Diphtheria tetanus toxoid and pertussis (DTP3) immunization coverage among 1-year-olds (%)
99 (2011)
Postnatal care visit within two days of birth (%) –
Hungary has achieved almost universal coverage of its population with mandatory social health insurance, which is the main source of public funding for health services. Participation in the social health insurance scheme is compulsory for all residents. In 2009, Hungary spent 7.4% of its GDP on health, with public expenditure accounting for 70% of total spending. There are co-payments for certain services, including pharmaceuticals, dental care and rehabilitation. Hungary’s health system is under reform. The Semmelweis Plan for the Rescue of Health Care provides the framework for a strategy for human resources for health, although it does not include any staffing plan. There are disparities in the distribution of the health workforce, with the capital area of Budapest having the highest density of physicians and the rural south the lowest. The nurse-to-physician ratio is below the OECD average. Low salaries appear to be a key factor in determining emigration and retention challenges. Mechanisms for regulation and licensing of the health workforce are in place. Relicensing is mandatory for all health professionals.
HUNGARY
-50 -25 0 5025
Ischemic heart disease
Cerebrovascular disease
Low back pain
Trachea, bronchus, and lung cancers
Cirrhosis of the liver
Falls
Diabetes mellitus
Colon and rectum cancers
Self-harm
Chronic obstructivepulmonary disease
/
2011-2018
The ratio of nurses to physicians is
BELOWthe OECD average (2.8:1).
*Equal to the total of physicians (N= 33 943; 2010), nurses (N= 62 159; 2010) and midwives (N= 1 750; 2010) divided by the 2010 population (N= 10 015 000). Source: (WHO Global Health Observatory - Global Health Workforce Statistics – 2012 update - http://apps.who.int/gho/data/view.main)
**See Annex 1 for full explanation on country profile methods and sources.

GEOGRAPHICAL DISTRIBUTION OF PHYSICIANS(density per 10 000 population)
Female physicians
HUMAN RESOURCES FOR HEALTHPOPULATION AND HEALTH
FEASIBILITYPOPULATION (MILLIONS)
Is there evidence that the country has mechanisms in place to:
TO
AVAILABILITY
ACCEPTABILITY
ACCESSIBILITY
QUALITY
Top 10 causes of morbidity and mortality (DALYs)Communicable, maternal, neonatal, and nutritional InjuriesNon-communicable
Disability-adjusted life years (DALYs) quantify both premature mortality (YLLS) and disability (YLDs) within a population. The top 10 causes of DALYs are ranked from top to bottom in order of the number of DALYs they contribute in 2010. Bars going right show the percent by which DALYs have increased since 1990. Bars going left show the percent by which DALYs have decreased.
Feasibility of achieving thresholds: Most likely Least likelySomewhat likely
ACCREDIT training institutions for:
Dentists
Midwives
Nurses
Pharmacists
Physicians
REGULATE:
Dentists
Midwives
Nurses
Pharmacists
Physicians
LICENSE/RE-LICENSE:
Dentists
Midwives
Nurses
Pharmacists
Physicians
HRH POLICY AND STRATEGY
Leadership and Partnership
Policy and Management
Strategy/Plan and Finance
HRH GOVERNANCE
Is there government leadership on health workforce policy and management?
Is there intersectoral and multi-stakeholder partnership to inform health workforce policy and management?
related to population health needs?
informed by data and strategic intelligence?
addressing pre-service education?
addressing geographical distribution and retention?
addressing health workforce performance (e.g. competence, responsiveness and productivity)?
addressing international mobility of health workers; and where relevant the WHO Code of Practice on the International Recruitment of Health Personnel?
Is there a national HRH strategy/plan resulting from the above mechanisms?
For which period?
Does the strategy/plan account for the financial costs and resource requirements to implement it?
= Yes = No = Insufficient data= Partial
Is there evidence that the country is adopting recommended good practices on HRH:
Is existing health workforce policy and human resource management:
?
59
DENSITY OF SHPs (Skilled Health Professional) PER 10 000 POPULATION (Estimated 2010)
SUB-NATIONAL LOW NATIONAL AVERAGE SUB-NATIONAL HIGH
1 Physician
COUNTRY PROFILES
0
500
1000
1500
2000
20152010 2020 2025 2030 20350
120
140
100
80
60
40
20
Thresholds**
34.5/10 00022.8/10 000
59.4/10 000
160
15.2/10 000*
CURRENTDENSITY
17%
TO MEET THRESHOLDS BY 2035, REQUIRES:
83% increase to meet 22.8/10 000 threshold
176% increase to meet 34.5/10 000 threshold
376% increase to meet 59.4/10 000 threshold
13.3Physicians
6.5Physicians
3.3Physicians
Population [all (000s); proportion under 15 (%); proportion over 60 (%)]
1205.6; 31; 8 (2010)
Average annual rate of population change (%) 1.2 (2010-2015)
Population living in urban areas (%) 31 (2011)Gross national income per capita (PPP int. $) 3590 (2011)Population living on <$1 (PPP int. $) a day (%) 32.67 (2010)Total expenditure on health as a percentage of gross domestic product (%)
3.9 (2011)
General government expenditure on health as a percentage of total expenditure on health (%)
31 (2011)
External resources for health as a percentage of total expenditure on health (%)
1.0 (2011)
Life expectancy at birth (years) [all; female; male] 65; 67; 64 (2011)Total fertility rate (per woman) 2.6 (2010)Neonatal mortality rate (per 1 000 live births) 32 (2011)
Infant mortality rate (per 1 000 live births) 47 (2011)Under-five mortality rate (per 1 000 live births) 61 [56-68] (2011)
Maternal mortality ratio (per 100 000 live births) 200 [140-310] (2010)Births attended by skilled health personnel (%) 57.7 (2009)Antenatal care coverage - at least one visit (%) 75.1 (2008)Antenatal care coverage - at least four visits (%) 49.7 (2008)
Diphtheria tetanus toxoid and pertussis (DTP3) immunization coverage among 1-year-olds (%)
72 (2011)
Postnatal care visit within two days of birth (%) 47.5 (2008)
Existing social health insurance schemes offer coverage to formal-sector workers and central government employees, and recent schemes offering care free of user charges for populations below the poverty line are being implemented and scaled up across 23 states. With one third of the population still living on less than US$ 1 per day, there is a high burden of communicable diseases, particularly affecting newborns and infants, with limited progress towards achieving Millennium Development Goal 4. The availability of skilled health professionals is currently below the 22.8 per 10 000 population threshold, but scaling up to meet indicative thresholds by 2035 appears feasible. However, inequalities in access (both geographical and income-based) persist. Women physicians are 17% of the total of physicians, and the ratio of nurses to physicians is below the OECD average. Policy mechanisms for human resources for health development, including government leadership and collaboration with key stakeholders, and mechanisms to provide reliable data on the health workforce require strengthening. However, there are efforts to review and revitalize health professional education as part of a five-country network, also involving China, Bangladesh, Thailand and Viet Nam.
INDIA
-160 -80 0 80 160
Preterm birth complications
Diarrheal diseases
Lower respiratory infections
Ischemic heart disease
Chronic obstructive pulmonary disease
Tuberculosis
Road injury
Iron-deficiency anemia
Self-harm
Sepsis and other infectiousdisorders of the newborn baby
/ ?
?
?
?
The ratio of nurses to physicians is
BELOWthe OECD average (2.8:1).
*Equal to the total of physicians (N=757 377; 2009), general nursing and midwifery personnel (N= 1 073 638 ; 2009), divided by the 2010 population (N= 1 205 625 000). Source: (WHO Global Health Observatory - Global Health Workforce Statistics – 2012 - http://apps.who.int/gho/data/view.main)
**See Annex 1 for full explanation on country profile methods and sources.
1.4Nurses

HRH POLICY AND STRATEGY
SUB-NATIONAL LOW
GEOGRAPHICAL DISTRIBUTION OF PHYSICIANS(density per 10 000 population)
NATIONAL AVERAGE SUB-NATIONAL HIGH
Female physicians
HUMAN RESOURCES FOR HEALTHPOPULATION AND HEALTH
FEASIBILITYDENSITY OF SHPs (Skilled Health Professional)
PER 10 000 POPULATION (Estimated 2010)POPULATION (MILLIONS)
Is there evidence that the country has mechanisms in place to:
TO
AVAILABILITY
ACCEPTABILITY
ACCESSIBILITY
QUALITY
Top 10 causes of morbidity and mortality (DALYs)Communicable, maternal, neonatal, and nutritional InjuriesNon-communicable
Disability-adjusted life years (DALYs) quantify both premature mortality (YLLS) and disability (YLDs) within a population. The top 10 causes of DALYs are ranked from top to bottom in order of the number of DALYs they contribute in 2010. Bars going right show the percent by which DALYs have increased since 1990. Bars going left show the percent by which DALYs have decreased.
Feasibility of achieving thresholds: Most likely Least likelySomewhat likely
Leadership and Partnership
Policy and Management
Strategy/Plan and Finance
HRH GOVERNANCE
Is there government leadership on health workforce policy and management?
Is there intersectoral and multi-stakeholder partnership to inform health workforce policy and management?
related to population health needs?
informed by data and strategic intelligence?
addressing pre-service education?
addressing geographical distribution and retention?
addressing health workforce performance (e.g. competence, responsiveness and productivity)?
addressing international mobility of health workers; and where relevant the WHO Code of Practice on the International Recruitment of Health Personnel?
Is there a national HRH strategy/plan resulting from the above mechanisms?
For which period?
Does the strategy/plan account for the financial costs and resource requirements to implement it?
= Yes = No = Insufficient data= Partial
Is there evidence that the country is adopting recommended good practices on HRH:
Is existing health workforce policy and human resource management:
?
ACCREDIT training institutions for:
Dentists
Midwives
Nurses
Pharmacists
Physicians
REGULATE:
Dentists
Midwives
Nurses
Pharmacists
Physicians
LICENSE/RE-LICENSE:
Dentists
Midwives
Nurses
Pharmacists
Physicians
A UNIVERSAL TRUTH: NO HEALTH WITHOUT A WORKFORCE60
1 Physician
0
50
100
150
200
250
300
350
20152010 2020 2025 2030 20350
120
140
100
80
60
40
20
Thresholds*
34.5/10,00022.8/10,000
59.4/10,000
160
16.1/10,000
CURRENTDENSITY
56%
TO MEET THRESHOLDS BY 2035, REQUIRES:
78% increase to meet 22.8/10 000 threshold
170% increase to meet 34.5/10 000 threshold
364% increase to meet 59.4/10 000 threshold
4.4NursesThe ratio of nurses
to physicians is
ABOVEthe OECD average (2.8:1).
5.4Physicians
2.0Physicians
1.0Physicians
Population [all (000s); proportion under 15 (%); proportion over 60 (%)]
240.7; 27; 8 (2010)
Average annual rate of population change (%) 1.2 (2010-2015)
Population living in urban areas (%) 51 (2011)Gross national income per capita (PPP int. $) 4500 (2011)Population living on <$1 (PPP int. $) a day (%) 22.64 (2008)Total expenditure on health as a percentage of gross domestic product (%)
2.7 (2011)
General government expenditure on health as a percentage of total expenditure on health (%)
34 (2011)
External resources for health as a percentage of total expenditure on health (%)
1.2 (2011)
Life expectancy at birth (years) [all; female; male] 69; 71; 68 (2011)Total fertility rate (per woman) 2.1 (2010)Neonatal mortality rate (per 1 000 live births) 15 (2011)
Infant mortality rate (per 1 000 live births) 25 (2011)Under-five mortality rate (per 1 000 live births) 32 [28-40] (2011)
Maternal mortality ratio (per 100 000 live births) 220 [130-350] (2010)Births attended by skilled health personnel (%) 79.8 (2010)Antenatal care coverage - at least one visit (%) 93.3 (2007)Antenatal care coverage - at least four visits (%) 81.5 (2007)
Diphtheria tetanus toxoid and pertussis (DTP3) immunization coverage among 1-year-olds (%)
63 (2011)
Postnatal care visit within two days of birth (%) 70.3 (2007)
Various insurance systems offer coverage to approximately 65% of the population. The country has made progress in reducing maternal mortality, and is on track to meet Millennium Development Goal 4. The rise of noncommunicable diseases is the next great health challenge to be addressed. The broad picture across the domains of availability, accessibility, acceptability and quality shows many strengths: the availability of skilled health professionals is currently below thresholds but could realistically be scaled up to meet these by 2035. This need is recognized in current policy mechanisms, with the plan for human resources for health focusing on improving quality and distribution of education institutions to address the production of human resources for health, and including costed strategies. Acceptability indicators are favourable, with women physicians comprising more than half the workforce and the ratio of nurses to physicians above the OECD average. However, challenges remain in guaranteeing equitable access. In terms of quality, accreditation procedures are currently being improved, and regulatory mechanisms also need strengthening, particularly for nurses and midwives.
INDONESIA
-100 -50 0 50 100
Cerebrovascular disease
Tuberculosis
Road injury
Ischemic heart disease
Diabetes mellitus
Low back pain
Major depressive disorder
Lower respiratory infections
Neonatal encephalopathy(birth asphyxia and birth trauma)
Diarrheal diseases
?
/
2011-2025
*Equal to the total of physicians (N= 49 853; 2012), nurses (N= 217 417; 2012) and midwives (N= 121 084; 2012) divided by the 2010 population (N= 240 676 000). Source: (WHO Global Health Observatory - Global Health Workforce Statistics – 2012 update - http://apps.who.int/gho/data/view.main)
**See Annex 1 for full explanation on country profile methods and sources.

GEOGRAPHICAL DISTRIBUTION OF PHYSICIANS(density per 10 000 population)
Female physicians
HUMAN RESOURCES FOR HEALTHPOPULATION AND HEALTH
FEASIBILITYPOPULATION (MILLIONS)
Is there evidence that the country has mechanisms in place to:
TO
AVAILABILITY
ACCEPTABILITY
ACCESSIBILITY
QUALITY
Top 10 causes of morbidity and mortality (DALYs)Communicable, maternal, neonatal, and nutritional InjuriesNon-communicable
Disability-adjusted life years (DALYs) quantify both premature mortality (YLLS) and disability (YLDs) within a population. The top 10 causes of DALYs are ranked from top to bottom in order of the number of DALYs they contribute in 2010. Bars going right show the percent by which DALYs have increased since 1990. Bars going left show the percent by which DALYs have decreased.
Feasibility of achieving thresholds: Most likely Least likelySomewhat likely
ACCREDIT training institutions for:
Dentists
Midwives
Nurses
Pharmacists
Physicians
REGULATE:
Dentists
Midwives
Nurses
Pharmacists
Physicians
LICENSE/RE-LICENSE:
Dentists
Midwives
Nurses
Pharmacists
Physicians
HRH POLICY AND STRATEGY
Leadership and Partnership
Policy and Management
Strategy/Plan and Finance
HRH GOVERNANCE
Is there government leadership on health workforce policy and management?
Is there intersectoral and multi-stakeholder partnership to inform health workforce policy and management?
related to population health needs?
informed by data and strategic intelligence?
addressing pre-service education?
addressing geographical distribution and retention?
addressing health workforce performance (e.g. competence, responsiveness and productivity)?
addressing international mobility of health workers; and where relevant the WHO Code of Practice on the International Recruitment of Health Personnel?
Is there a national HRH strategy/plan resulting from the above mechanisms?
For which period?
Does the strategy/plan account for the financial costs and resource requirements to implement it?
= Yes = No = Insufficient data= Partial
Is there evidence that the country is adopting recommended good practices on HRH:
Is existing health workforce policy and human resource management:
?
61
DENSITY OF SHPs (Skilled Health Professional) PER 10 000 POPULATION (Estimated 2010)
SUB-NATIONAL LOW NATIONAL AVERAGE SUB-NATIONAL HIGH
1 Physician
COUNTRY PROFILES
0
40
80
120
160
200
20152010 2020 2025 2030 20350
120
140
100
80
60
40
20
Thresholds**
34.5/10,00022.8/10,000
59.4/10,000
160
63.3/10,000*
CURRENTDENSITY
20%
TO MEET THRESHOLDS BY 2035, REQUIRES:
0% increase to meet 22.8/10 000 threshold
0% increase to meet 34.5/10 000 threshold
0% increase to meet 59.4/10 000 threshold
1.8Nurses
28.6Physicians
21.4Physicians
14.3Physicians
Population [all (000s); proportion under 15 (%); proportion over 60 (%)]
127.4; 13; 30 (2010)
Average annual rate of population change (%) -0.1 (2010-2015)
Population living in urban areas (%) 91 (2011)Gross national income per capita (PPP int. $) 35330 (2011)Population living on <$1 (PPP int. $) a day (%) –Total expenditure on health as a percentage of gross domestic product (%)
9.3 (2011)
General government expenditure on health as a percentage of total expenditure on health (%)
80 (2011)
External resources for health as a percentage of total expenditure on health (%)
–
Life expectancy at birth (years) [all; female; male] 83; 86; 79 (2011)Total fertility rate (per woman) 1.4 (2010)Neonatal mortality rate (per 1 000 live births) 1 (2011)
Infant mortality rate (per 1 000 live births) 2 (2011)Under-five mortality rate (per 1 000 live births) 3 [3-4] (2011)
Maternal mortality ratio (per 100 000 live births) 5 [5-6] (2010)Births attended by skilled health personnel (%) 99.8 (2011)Antenatal care coverage - at least one visit (%) –Antenatal care coverage - at least four visits (%) –
Diphtheria tetanus toxoid and pertussis (DTP3) immunization coverage among 1-year-olds (%)
98 (2011)
Postnatal care visit within two days of birth (%) –
Japan’s health system offers coverage to 98.7% of the population through a social insurance model, with maximum copayments of 30% of health care costs and lower copayments for children and older people. The availability of skilled health professionals is above the thresholds, and there is generally good accessibility to health services, but evidence indicates some geographical disparities: for example, the relative ratios of health worker densities between the highest and lowest prefectures are 2.0 for physicians and 2.3 for nurses. Further, the percentage of women physicians is unusually low (20%), while the ratio of nurses to physicians is 1.8, although other sources indicate that it is higher and significantly above the OECD average. Evidence indicates that regulatory mechanisms need strengthening to reach the standards of other high-income countries: for example, licenses for practitioners are granted for life, with no relicensing requirement. A positive element is the existence of strong mechanisms to collect accurate survey data on the health workforce. However, some evidence indicates that these data are not being adequately used to determine policy priorities. For example, there has been a focus on increasing the quota of medical students, but it is not clear whether this policy takes adequate account of health service needs, especially given changing technology and service delivery models.
JAPAN
-50 -25 0 5025
Low back pain
Cerebrovascular disease
Lower respiratory infections
Trachea, bronchus, and lung cancers
Self-harm
Neck pain
Falls
Stomach cancer
Ischemic heartdisease
Other musculo-skeletal disorders
?
?
?
/ The ratio of nurses to physicians is
BELOWthe OECD average (2.8:1).
*Equal to the total of physicians (N= 274 992; 2008), public health nurses (N= 40 388; 2006), nurses (N= 81 419; 2006), assistant nurses (N= 383 503; 2006) and midwives (N= 25 900; 2006) divided by the 2010 population (N= 127 353 000). Source: (WHO Global Health Observatory - Global Health Workforce Statistics – 2012 update - http://apps.who.int/gho/data/view.main)
**See Annex 1 for full explanation on country profile methods and sources.

HRH POLICY AND STRATEGY
SUB-NATIONAL LOW
GEOGRAPHICAL DISTRIBUTION OF PHYSICIANS(density per 10 000 population)
NATIONAL AVERAGE SUB-NATIONAL HIGH
Female physicians
HUMAN RESOURCES FOR HEALTHPOPULATION AND HEALTH
FEASIBILITYDENSITY OF SHPs (Skilled Health Professional)
PER 10 000 POPULATION (Estimated 2010)POPULATION (MILLIONS)
Is there evidence that the country has mechanisms in place to:
TO
AVAILABILITY
ACCEPTABILITY
ACCESSIBILITY
QUALITY
Top 10 causes of morbidity and mortality (DALYs)Communicable, maternal, neonatal, and nutritional InjuriesNon-communicable
Disability-adjusted life years (DALYs) quantify both premature mortality (YLLS) and disability (YLDs) within a population. The top 10 causes of DALYs are ranked from top to bottom in order of the number of DALYs they contribute in 2010. Bars going right show the percent by which DALYs have increased since 1990. Bars going left show the percent by which DALYs have decreased.
Feasibility of achieving thresholds: Most likely Least likelySomewhat likely
Leadership and Partnership
Policy and Management
Strategy/Plan and Finance
HRH GOVERNANCE
Is there government leadership on health workforce policy and management?
Is there intersectoral and multi-stakeholder partnership to inform health workforce policy and management?
related to population health needs?
informed by data and strategic intelligence?
addressing pre-service education?
addressing geographical distribution and retention?
addressing health workforce performance (e.g. competence, responsiveness and productivity)?
addressing international mobility of health workers; and where relevant the WHO Code of Practice on the International Recruitment of Health Personnel?
Is there a national HRH strategy/plan resulting from the above mechanisms?
For which period?
Does the strategy/plan account for the financial costs and resource requirements to implement it?
= Yes = No = Insufficient data= Partial
Is there evidence that the country is adopting recommended good practices on HRH:
Is existing health workforce policy and human resource management:
?
ACCREDIT training institutions for:
Dentists
Midwives
Nurses
Pharmacists
Physicians
REGULATE:
Dentists
Midwives
Nurses
Pharmacists
Physicians
LICENSE/RE-LICENSE:
Dentists
Midwives
Nurses
Pharmacists
Physicians
A UNIVERSAL TRUTH: NO HEALTH WITHOUT A WORKFORCE62
1 Physician
0
20
40
60
80
20152010 2020 2025 2030 20350
120
140
100
80
60
40
20
Thresholds**
34.5/10,00022.8/10,000
59.4/10,000
160
9.9/10,000*
CURRENTDENSITY
33%
TO MEET THRESHOLDS BY 2035, REQUIRES:
315% increase to meet 22.8/10 000 threshold
528% increase to meet 34.5/10 000 threshold
981% increase to meet 59.4/10 000 threshold
4.4NursesThe ratio of nurses
to physicians is
ABOVEthe OECD average (2.8:1).
– Physicians
1.8Physicians
–Physicians
Population [all (000s); proportion under 15 (%); proportion over 60 (%)]
40.9; 42; 4 (2010)
Average annual rate of population change (%) 2.7 (2010-2015)
Population living in urban areas (%) 24 (2011)Gross national income per capita (PPP int. $) 1710 (2011)Population living on <$1 (PPP int. $) a day (%) –Total expenditure on health as a percentage of gross domestic product (%)
4.5 (2011)
General government expenditure on health as a percentage of total expenditure on health (%)
40 (2011)
External resources for health as a percentage of total expenditure on health (%)
38.8 (2011)
Life expectancy at birth (years) [all; female; male] 60; 61; 58 (2011)Total fertility rate (per woman) 4.7 (2010)Neonatal mortality rate (per 1 000 live births) 27 (2011)
Infant mortality rate (per 1 000 live births) 48 (2011)Under-five mortality rate (per 1 000 live births) 73 [64-98] (2011)
Maternal mortality ratio (per 100 000 live births) 360 [230-590] (2010)Births attended by skilled health personnel (%) 43.8 (2009)Antenatal care coverage - at least one visit (%) 91.5 (2009)Antenatal care coverage - at least four visits (%) 47.1 (2009)
Diphtheria tetanus toxoid and pertussis (DTP3) immunization coverage among 1-year-olds (%)
88 (2011)
Postnatal care visit within two days of birth (%) 42.1 (2009)
The National Health Insurance Fund in Kenya covers mostly formal-sector workers: about 25% of poor people are estimated to have medical coverage. The burden of disease is overwhelmingly due to communicable diseases, with HIV infection as the number one cause of mortality and morbidity; progress towards achieving the health Millennium Development Goals has been limited. The availability of skilled health professionals is low and there is inequality in access, ranging from 20% to 80% from the poorest to the richest people. Urban-rural inequities are also significant, particularly for access to physicians. The devolution process underway will give authority over human resources for health to the counties, which may lead to differences in availability according to how counties set priorities for resources. On a positive note, the percentage of women physicians is quite high (about one third). Evidence also indicates good mechanisms for accreditation, regulation and licensing of the health workforce through the various professional councils, including requirements for continuous professional development for relicensing physicians, nurses and dentists. However policy mechanisms, intersectoral collaboration and human resource information systems need to be strengthened to enable successful planning and management of the workforce.
KENYA
-150 -100 -50 0 50 100 150
HIV/AIDS
Malaria
Diarrheal diseases
Preterm birth complications
Protein-energy malnutrition
Meningitis
Iron-deficiency anemia
Lower respiratory infections
Sepsis and other infectiousdisorders of the newborn baby
Neonatal encephalopathy(birth asphyxia and birth trauma)
2009-2012
/
*Equal to the total of physicians (N=7 549; 2011) and nurses (N= 32 941; 2011) divided by the 2010 population (N= 40 909 000). Source: (WHO Global Health Observatory - Global Health Workforce Statistics – 2012 update - http://apps.who.int/gho/data/view.main)
**See Annex 1 for full explanation on country profile methods and sources.
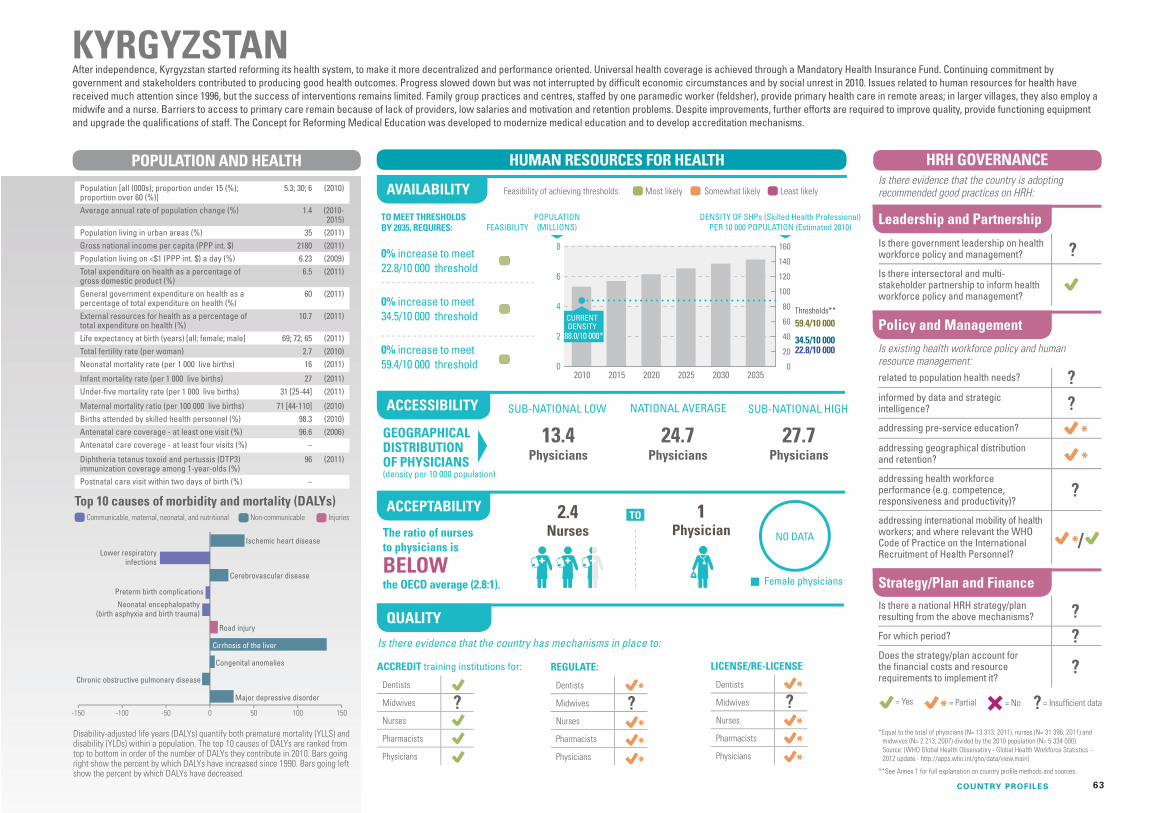
GEOGRAPHICAL DISTRIBUTION OF PHYSICIANS(density per 10 000 population)
Female physicians
HUMAN RESOURCES FOR HEALTHPOPULATION AND HEALTH
FEASIBILITYPOPULATION (MILLIONS)
Is there evidence that the country has mechanisms in place to:
TO
AVAILABILITY
ACCEPTABILITY
ACCESSIBILITY
QUALITY
Top 10 causes of morbidity and mortality (DALYs)Communicable, maternal, neonatal, and nutritional InjuriesNon-communicable
Disability-adjusted life years (DALYs) quantify both premature mortality (YLLS) and disability (YLDs) within a population. The top 10 causes of DALYs are ranked from top to bottom in order of the number of DALYs they contribute in 2010. Bars going right show the percent by which DALYs have increased since 1990. Bars going left show the percent by which DALYs have decreased.
Feasibility of achieving thresholds: Most likely Least likelySomewhat likely
ACCREDIT training institutions for:
Dentists
Midwives
Nurses
Pharmacists
Physicians
REGULATE:
Dentists
Midwives
Nurses
Pharmacists
Physicians
LICENSE/RE-LICENSE:
Dentists
Midwives
Nurses
Pharmacists
Physicians
HRH POLICY AND STRATEGY
Leadership and Partnership
Policy and Management
Strategy/Plan and Finance
HRH GOVERNANCE
Is there government leadership on health workforce policy and management?
Is there intersectoral and multi-stakeholder partnership to inform health workforce policy and management?
related to population health needs?
informed by data and strategic intelligence?
addressing pre-service education?
addressing geographical distribution and retention?
addressing health workforce performance (e.g. competence, responsiveness and productivity)?
addressing international mobility of health workers; and where relevant the WHO Code of Practice on the International Recruitment of Health Personnel?
Is there a national HRH strategy/plan resulting from the above mechanisms?
For which period?
Does the strategy/plan account for the financial costs and resource requirements to implement it?
= Yes = No = Insufficient data= Partial
Is there evidence that the country is adopting recommended good practices on HRH:
Is existing health workforce policy and human resource management:
?
63
DENSITY OF SHPs (Skilled Health Professional) PER 10 000 POPULATION (Estimated 2010)
SUB-NATIONAL LOW NATIONAL AVERAGE SUB-NATIONAL HIGH
1 Physician
COUNTRY PROFILES
0
2
4
6
8
20152010 2020 2025 2030 20350
120
140
100
80
60
40
20
Thresholds**
34.5/10 00022.8/10 000
59.4/10 000
160
88.0/10 000*
CURRENTDENSITY
TO MEET THRESHOLDS BY 2035, REQUIRES:
0% increase to meet 22.8/10 000 threshold
0% increase to meet 34.5/10 000 threshold
0% increase to meet 59.4/10 000 threshold
2.4Nurses
27.7Physicians
24.7Physicians
13.4Physicians
Population [all (000s); proportion under 15 (%); proportion over 60 (%)]
5.3; 30; 6 (2010)
Average annual rate of population change (%) 1.4 (2010-2015)
Population living in urban areas (%) 35 (2011)Gross national income per capita (PPP int. $) 2180 (2011)Population living on <$1 (PPP int. $) a day (%) 6.23 (2009)Total expenditure on health as a percentage of gross domestic product (%)
6.5 (2011)
General government expenditure on health as a percentage of total expenditure on health (%)
60 (2011)
External resources for health as a percentage of total expenditure on health (%)
10.7 (2011)
Life expectancy at birth (years) [all; female; male] 69; 72; 65 (2011)Total fertility rate (per woman) 2.7 (2010)Neonatal mortality rate (per 1 000 live births) 16 (2011)
Infant mortality rate (per 1 000 live births) 27 (2011)Under-five mortality rate (per 1 000 live births) 31 [25-44] (2011)
Maternal mortality ratio (per 100 000 live births) 71 [44-110] (2010)Births attended by skilled health personnel (%) 98.3 (2010)Antenatal care coverage - at least one visit (%) 96.6 (2006)Antenatal care coverage - at least four visits (%) –
Diphtheria tetanus toxoid and pertussis (DTP3) immunization coverage among 1-year-olds (%)
96 (2011)
Postnatal care visit within two days of birth (%) –
After independence, Kyrgyzstan started reforming its health system, to make it more decentralized and performance oriented. Universal health coverage is achieved through a Mandatory Health Insurance Fund. Continuing commitment by government and stakeholders contributed to producing good health outcomes. Progress slowed down but was not interrupted by difficult economic circumstances and by social unrest in 2010. Issues related to human resources for health have received much attention since 1996, but the success of interventions remains limited. Family group practices and centres, staffed by one paramedic worker (feldsher), provide primary health care in remote areas; in larger villages, they also employ a midwife and a nurse. Barriers to access to primary care remain because of lack of providers, low salaries and motivation and retention problems. Despite improvements, further efforts are required to improve quality, provide functioning equipment and upgrade the qualifications of staff. The Concept for Reforming Medical Education was developed to modernize medical education and to develop accreditation mechanisms.
KYRGYZSTAN
NO DATA
-150 -100 -50 0 50 100 150
Ischemic heart disease
Cerebrovascular disease
Road injury
Cirrhosis of the liver
Congenital anomalies
Major depressive disorder
Lower respiratoryinfections
Preterm birth complications
Neonatal encephalopathy(birth asphyxia and birth trauma)
Chronic obstructive pulmonary disease
? ? ?
?
?
?
?
??
?
/ The ratio of nurses to physicians is
BELOWthe OECD average (2.8:1).
*Equal to the total of physicians (N= 13 313; 2011), nurses (N= 31 396; 2011) and midwives (N= 2 213; 2007) divided by the 2010 population (N= 5 334 000). Source: (WHO Global Health Observatory - Global Health Workforce Statistics – 2012 update - http://apps.who.int/gho/data/view.main)
**See Annex 1 for full explanation on country profile methods and sources.

HRH POLICY AND STRATEGY
SUB-NATIONAL LOW
GEOGRAPHICAL DISTRIBUTION OF PHYSICIANS(density per 10 000 population)
NATIONAL AVERAGE SUB-NATIONAL HIGH
Female physicians
HUMAN RESOURCES FOR HEALTHPOPULATION AND HEALTH
FEASIBILITYDENSITY OF SHPs (Skilled Health Professional)
PER 10 000 POPULATION (Estimated 2010)POPULATION (MILLIONS)
Is there evidence that the country has mechanisms in place to:
TO
AVAILABILITY
ACCEPTABILITY
ACCESSIBILITY
QUALITY
Top 10 causes of morbidity and mortality (DALYs)Communicable, maternal, neonatal, and nutritional InjuriesNon-communicable
Disability-adjusted life years (DALYs) quantify both premature mortality (YLLS) and disability (YLDs) within a population. The top 10 causes of DALYs are ranked from top to bottom in order of the number of DALYs they contribute in 2010. Bars going right show the percent by which DALYs have increased since 1990. Bars going left show the percent by which DALYs have decreased.
Feasibility of achieving thresholds: Most likely Least likelySomewhat likely
Leadership and Partnership
Policy and Management
Strategy/Plan and Finance
HRH GOVERNANCE
Is there government leadership on health workforce policy and management?
Is there intersectoral and multi-stakeholder partnership to inform health workforce policy and management?
related to population health needs?
informed by data and strategic intelligence?
addressing pre-service education?
addressing geographical distribution and retention?
addressing health workforce performance (e.g. competence, responsiveness and productivity)?
addressing international mobility of health workers; and where relevant the WHO Code of Practice on the International Recruitment of Health Personnel?
Is there a national HRH strategy/plan resulting from the above mechanisms?
For which period?
Does the strategy/plan account for the financial costs and resource requirements to implement it?
= Yes = No = Insufficient data= Partial
Is there evidence that the country is adopting recommended good practices on HRH:
Is existing health workforce policy and human resource management:
?
ACCREDIT training institutions for:
Dentists
Midwives
Nurses
Pharmacists
Physicians
REGULATE:
Dentists
Midwives
Nurses
Pharmacists
Physicians
LICENSE/RE-LICENSE:
Dentists
Midwives
Nurses
Pharmacists
Physicians
A UNIVERSAL TRUTH: NO HEALTH WITHOUT A WORKFORCE64
1 Physician
0
30
60
90
120
150
20152010 2020 2025 2030 20350
120
140
100
80
60
40
20
Thresholds**
34.5/10 00022.8/10 000
59.4/10 000
160
54.1/10 000*
CURRENTDENSITY
36%
TO MEET THRESHOLDS BY 2035, REQUIRES:
0% increase to meet 22.8/10 000 threshold
0% increase to meet 34.5/10 000 threshold
38% increase to meet 59.4/10 000 threshold
1.9Nurses
19.6Physicians
–Physicians
–Physicians
Population [all (000s); proportion under 15 (%); proportion over 60 (%)]
117.9; 29; 9 (2010)
Average annual rate of population change (%) 1.2 (2010-2015)
Population living in urban areas (%) 78 (2011)Gross national income per capita (PPP int. $) 15390 (2011)Population living on <$1 (PPP int. $) a day (%) <2 (2008)Total expenditure on health as a percentage of gross domestic product (%)
6.2 (2011)
General government expenditure on health as a percentage of total expenditure on health (%)
49 (2011)
External resources for health as a percentage of total expenditure on health (%)
0.0 (2011)
Life expectancy at birth (years) [all; female; male] 75; 78; 72 (2011)Total fertility rate (per woman) 2.3 (2010)Neonatal mortality rate (per 1 000 live births) 7 (2011)
Infant mortality rate (per 1 000 live births) 13 (2011)Under-five mortality rate (per 1 000 live births) 16 [14-18] (2011)
Maternal mortality ratio (per 100 000 live births) 50 [44-56] (2010)Births attended by skilled health personnel (%) 95.3 (2009)Antenatal care coverage - at least one visit (%) 95.8 (2009)Antenatal care coverage - at least four visits (%) –
Diphtheria tetanus toxoid and pertussis (DTP3) immunization coverage among 1-year-olds (%)
97 (2011)
Postnatal care visit within two days of birth (%) 54.9 (2009)
The health system comprises different subsystems with access linked to employment status. The contributory subsystem, funded by employers and employees, is mandatory for salaried workers and covers 47% of the population. The non-contributory subsystem (Seguro Popular-SP) covered 64% of the uninsured population in 2011 and has enabled some progress in access to services in poorer and rural regions and among the indigenous population, even though further improvements are possible. Out-of-pocket payments represent up to 49% of total health expenditure. The burden of some communicable diseases is high, and despite good progress towards meeting the health Millennium Development Goals, there are still challenges regarding maternal mortality and gender equality. There are various strategies for health workforce planning but no formal plan for human resources for health. There is important variation in the density of physicians among regions. The ratio of nurses to physicians is below the OECD average at 1.9. There are mechanisms for regulation and licensing health workforce that differ between types of health workers.
MEXICO
-200 -150 -100 -50 0 50 100 150 200
Diabetes mellitus
Ischemic heart disease
Chronic kidney diseases
Road injury
Interpersonal violence
Cirrhosis of the liver
Congenital anomalies
Lower respiratory infections
Low back pain
Major depressive disorder
2013-2018
? /
?
The ratio of nurses to physicians is
BELOWthe OECD average (2.8:1).
*Equal to the total of physicians (N= 219 560; 2009), auxiliary/assistant nurses (N= 271 319; 2004), enrolled nurses (N= 36 373; 2004) and registered nurses (N= 109 973; 2004) divided by the 2010 population (N= 117 886 000). Source: (WHO Global Health Observatory - Global Health Workforce Statistics – 2012 update - http://apps.who.int/gho/data/view.main)
**See Annex 1 for full explanation on country profile methods and sources.

GEOGRAPHICAL DISTRIBUTION OF PHYSICIANS(density per 10 000 population)
Female physicians
HUMAN RESOURCES FOR HEALTHPOPULATION AND HEALTH
FEASIBILITYPOPULATION (MILLIONS)
Is there evidence that the country has mechanisms in place to:
TO
AVAILABILITY
ACCEPTABILITY
ACCESSIBILITY
QUALITY
Top 10 causes of morbidity and mortality (DALYs)Communicable, maternal, neonatal, and nutritional InjuriesNon-communicable
Disability-adjusted life years (DALYs) quantify both premature mortality (YLLS) and disability (YLDs) within a population. The top 10 causes of DALYs are ranked from top to bottom in order of the number of DALYs they contribute in 2010. Bars going right show the percent by which DALYs have increased since 1990. Bars going left show the percent by which DALYs have decreased.
Feasibility of achieving thresholds: Most likely Least likelySomewhat likely
ACCREDIT training institutions for:
Dentists
Midwives
Nurses
Pharmacists
Physicians
REGULATE:
Dentists
Midwives
Nurses
Pharmacists
Physicians
LICENSE/RE-LICENSE:
Dentists
Midwives
Nurses
Pharmacists
Physicians
HRH POLICY AND STRATEGY
Leadership and Partnership
Policy and Management
Strategy/Plan and Finance
HRH GOVERNANCE
Is there government leadership on health workforce policy and management?
Is there intersectoral and multi-stakeholder partnership to inform health workforce policy and management?
related to population health needs?
informed by data and strategic intelligence?
addressing pre-service education?
addressing geographical distribution and retention?
addressing health workforce performance (e.g. competence, responsiveness and productivity)?
addressing international mobility of health workers; and where relevant the WHO Code of Practice on the International Recruitment of Health Personnel?
Is there a national HRH strategy/plan resulting from the above mechanisms?
For which period?
Does the strategy/plan account for the financial costs and resource requirements to implement it?
= Yes = No = Insufficient data= Partial
Is there evidence that the country is adopting recommended good practices on HRH:
Is existing health workforce policy and human resource management:
?
65
DENSITY OF SHPs (Skilled Health Professional) PER 10 000 POPULATION (Estimated 2010)
SUB-NATIONAL LOW NATIONAL AVERAGE SUB-NATIONAL HIGH
1 Physician
COUNTRY PROFILES
0
10
20
30
40
50
20152010 2020 2025 2030 20350
120
140
100
80
60
40
20
Thresholds**
34.5/10 00022.8/10 000
59.4/10 000
160
15.9/10 000*
CURRENTDENSITY
40%
TO MEET THRESHOLDS BY 2035, REQUIRES:
83% increase to meet 22.8/10 000 threshold
177% increase to meet 34.5/10 000 threshold
376% increase to meet 59.4/10 000 threshold
1.4Nurses
–Physicians
6.2Physicians
–Physicians
Population [all (000s); proportion under 15 (%); proportion over 60 (%)]
31.6; 28; 8 (2010)
Average annual rate of population change (%) 1.4 (2010-2015)
Population living in urban areas (%) 57 (2011)Gross national income per capita (PPP int. $) 4880 (2011)Population living on <$1 (PPP int. $) a day (%) 2.52 (2007)Total expenditure on health as a percentage of gross domestic product (%)
6.0 (2011)
General government expenditure on health as a percentage of total expenditure on health (%)
34 (2011)
External resources for health as a percentage of total expenditure on health (%)
0.4 (2011)
Life expectancy at birth (years) [all; female; male] 72; 74; 70 (2011)Total fertility rate (per woman) 2.3 (2010)Neonatal mortality rate (per 1 000 live births) 19 (2011)
Infant mortality rate (per 1 000 live births) 28 (2011)Under-five mortality rate (per 1 000 live births) 33 [27-39] (2011)
Maternal mortality ratio (per 100 000 live births) 100 [62-170] (2010)Births attended by skilled health personnel (%) 73.6 (2011)Antenatal care coverage - at least one visit (%) 77.1 (2011)Antenatal care coverage - at least four visits (%) 63.9 (2011)
Diphtheria tetanus toxoid and pertussis (DTP3) immunization coverage among 1-year-olds (%)
99 (2011)
Postnatal care visit within two days of birth (%) –
In 2011, a new Constitution defined access to health services as a right. A Strategy for the Health Sector was prepared in 2012, and in July 2013 a policy document was presented to stakeholders in a national conference. It proposes scaling up human resources for health to progress rapidly towards universal health coverage. A new health insurance scheme (RAMED) has been developed to cover populations with no access to social insurance. Morocco is on track to achieving the health Millennium Development Goals, but universal health coverage is a major challenge, since population growth is high and the country is experiencing a rapid demographic and epidemiological transition. The Ministry of Health considers that health workers do not acquire all the competencies corresponding to the needs and expectations of the population. The density of health personnel is below the indicative thresholds needed to meet basic needs, and there is potential to improve the efficiency of the skills mix. The nurse-to-population ratio is about half the average in the Eastern Mediterranean Region. Geographical imbalances in the distribution of physicians remain important.
MOROCCO
-100 -50 0 50 100
Diabetes mellitus
Preterm birth complications
Ischemic heart disease
Major depressive disorder
Cerebrovascular disease
Low back pain
Anxiety disorders
Tuberculosis
Neonatal encephalopathy(birth asphyxia and birth trauma)
Lower respiratoryinfections
?? ?? ?
? / ?
?
2012-2016
?
The ratio of nurses to physicians is
BELOWthe OECD average (2.8:1).
*Equal to the total of physicians (N= 20 682; 2009) and nursing and midwifery personnel (N= 29 689; 2009) divided by the 2010 population (N= 31 642 000). Source: (WHO Global Health Observatory - Global Health Workforce Statistics – 2012 update - http://apps.who.int/gho/data/view.main)
**See Annex 1 for full explanation on country profile methods and sources.

HRH POLICY AND STRATEGY
SUB-NATIONAL LOW
GEOGRAPHICAL DISTRIBUTION OF PHYSICIANS(density per 10 000 population)
NATIONAL AVERAGE SUB-NATIONAL HIGH
Female physicians
HUMAN RESOURCES FOR HEALTHPOPULATION AND HEALTH
FEASIBILITYDENSITY OF SHPs (Skilled Health Professional)
PER 10 000 POPULATION (Estimated 2010)POPULATION (MILLIONS)
Is there evidence that the country has mechanisms in place to:
TO
AVAILABILITY
ACCEPTABILITY
ACCESSIBILITY
QUALITY
Top 10 causes of morbidity and mortality (DALYs)Communicable, maternal, neonatal, and nutritional InjuriesNon-communicable
Disability-adjusted life years (DALYs) quantify both premature mortality (YLLS) and disability (YLDs) within a population. The top 10 causes of DALYs are ranked from top to bottom in order of the number of DALYs they contribute in 2010. Bars going right show the percent by which DALYs have increased since 1990. Bars going left show the percent by which DALYs have decreased.
Feasibility of achieving thresholds: Most likely Least likelySomewhat likely
Leadership and Partnership
Policy and Management
Strategy/Plan and Finance
HRH GOVERNANCE
Is there government leadership on health workforce policy and management?
Is there intersectoral and multi-stakeholder partnership to inform health workforce policy and management?
related to population health needs?
informed by data and strategic intelligence?
addressing pre-service education?
addressing geographical distribution and retention?
addressing health workforce performance (e.g. competence, responsiveness and productivity)?
addressing international mobility of health workers; and where relevant the WHO Code of Practice on the International Recruitment of Health Personnel?
Is there a national HRH strategy/plan resulting from the above mechanisms?
For which period?
Does the strategy/plan account for the financial costs and resource requirements to implement it?
= Yes = No = Insufficient data= Partial
Is there evidence that the country is adopting recommended good practices on HRH:
Is existing health workforce policy and human resource management:
?
ACCREDIT training institutions for:
Dentists
Midwives
Nurses
Pharmacists
Physicians
REGULATE:
Dentists
Midwives
Nurses
Pharmacists
Physicians
LICENSE/RE-LICENSE:
Dentists
Midwives
Nurses
Pharmacists
Physicians
A UNIVERSAL TRUTH: NO HEALTH WITHOUT A WORKFORCE66
1 Physician
0
10
20
30
40
50
20152010 2020 2025 2030 20350
120
140
100
80
60
40
20
Thresholds**
34.5/10 00022.8/10 000
59.4/10 000
160
3.2/10 000*
CURRENTDENSITY
44%
TO MEET THRESHOLDS BY 2035, REQUIRES:
1198% increase to meet 22.8/10 000 threshold
1864% increase to meet 34.5/10 000 threshold
3282% increase to meet 59.4/10 000 threshold
11.3NursesThe ratio of nurses
to physicians is
ABOVEthe OECD average (2.8:1).
3.8Physicians
0.3Physicians
0.2Physicians
Population [all (000s); proportion under 15 (%); proportion over 60 (%)]
24; 44; 5 (2010)
Average annual rate of population change (%) 2.5 (2010-2015)
Population living in urban areas (%) 31 (2011)Gross national income per capita (PPP int. $) 970 (2011)Population living on <$1 (PPP int. $) a day (%) 59.58 (2008)Total expenditure on health as a percentage of gross domestic product (%)
6.6 (2011)
General government expenditure on health as a percentage of total expenditure on health (%)
42 (2011)
External resources for health as a percentage of total expenditure on health (%)
69.8 (2011)
Life expectancy at birth (years) [all; female; male] 53; 53; 52 (2011)Total fertility rate (per woman) 4.9 (2010)Neonatal mortality rate (per 1 000 live births) 34 (2011)
Infant mortality rate (per 1 000 live births) 72 (2011)Under-five mortality rate (per 1 000 live births) 103 [88-121] (2011)
Maternal mortality ratio (per 100 000 live births) 490 [300-850] (2010)Births attended by skilled health personnel (%) 54.3 (2011)Antenatal care coverage - at least one visit (%) 90.6 (2011)Antenatal care coverage - at least four visits (%) –
Diphtheria tetanus toxoid and pertussis (DTP3) immunization coverage among 1-year-olds (%)
76 (2011)
Postnatal care visit within two days of birth (%) –
Almost a third of the population (30%) is deemed to lack access to health services, and 50% have access to high-quality care. Despite progress, maternal and child mortality remain high, and there is a high burden of communicable diseases. There are a number of important health workforce challenges: the availability of skilled health professionals is low and there are both geographical and financial inequities in access. Although the percentage of women doctors is quite high and the ratio of nurses to physicians is above the OECD average, this may be a consequence of insufficient numbers of physicians, rather than an indicator of adequate skill of the workforce. Accreditation, regulation and licensing mechanisms need to be strengthened in order to improve the quality of the workforce. At the policy level, there is willingness to make human resources for health a priority and a Human Resource Development Plan (2008–2015) has been created, which will, however, need to be adequately costed.
MOZAMBIQUE
-200 -150 -100 -50 0 50 100 150 200
HIV/AIDS
Malaria
Lower respiratory infections
Diarrheal diseases
Preterm birth complications
Tuberculosis
Meningitis
Syphilis
Sepsis and other infectiousdisorders of the newborn baby
Neonatal encephalopathy(birth asphyxia and birth trauma)
?
??
??
?
??
2008-2015
? / ?
*Equal to the total of physicians (N= 548; 2008), licensed nurses (N= 28; 2008), baccalaureate nurses (N= 109; 2008), specialized nurses (N= 153; 2008), general nurses (N= 812; 2008), basic nurses (N= 2 382; 2008), elementary nurses (N= 798; 2008), specialized SMI nurses (N= 17; 2008), nurse-midwives (N= 13; 2008), SMI nurses (N= 1 902; 2008), midwives (N= 917; 2008) divided by the 2010 population (N= 23 967 000). Source: (WHO Global Health Observatory - Global Health Workforce Statistics – 2012 update - http://apps.who.int/gho/data/view.main)
**See Annex 1 for full explanation on country profile methods and sources.

GEOGRAPHICAL DISTRIBUTION OF PHYSICIANS(density per 10 000 population)
Female physicians
HUMAN RESOURCES FOR HEALTHPOPULATION AND HEALTH
FEASIBILITYPOPULATION (MILLIONS)
Is there evidence that the country has mechanisms in place to:
TO
AVAILABILITY
ACCEPTABILITY
ACCESSIBILITY
QUALITY
Top 10 causes of morbidity and mortality (DALYs)Communicable, maternal, neonatal, and nutritional InjuriesNon-communicable
Disability-adjusted life years (DALYs) quantify both premature mortality (YLLS) and disability (YLDs) within a population. The top 10 causes of DALYs are ranked from top to bottom in order of the number of DALYs they contribute in 2010. Bars going right show the percent by which DALYs have increased since 1990. Bars going left show the percent by which DALYs have decreased.
Feasibility of achieving thresholds: Most likely Least likelySomewhat likely
ACCREDIT training institutions for:
Dentists
Midwives
Nurses
Pharmacists
Physicians
REGULATE:
Dentists
Midwives
Nurses
Pharmacists
Physicians
LICENSE/RE-LICENSE:
Dentists
Midwives
Nurses
Pharmacists
Physicians
HRH POLICY AND STRATEGY
Leadership and Partnership
Policy and Management
Strategy/Plan and Finance
HRH GOVERNANCE
Is there government leadership on health workforce policy and management?
Is there intersectoral and multi-stakeholder partnership to inform health workforce policy and management?
related to population health needs?
informed by data and strategic intelligence?
addressing pre-service education?
addressing geographical distribution and retention?
addressing health workforce performance (e.g. competence, responsiveness and productivity)?
addressing international mobility of health workers; and where relevant the WHO Code of Practice on the International Recruitment of Health Personnel?
Is there a national HRH strategy/plan resulting from the above mechanisms?
For which period?
Does the strategy/plan account for the financial costs and resource requirements to implement it?
= Yes = No = Insufficient data= Partial
Is there evidence that the country is adopting recommended good practices on HRH:
Is existing health workforce policy and human resource management:
?
67
DENSITY OF SHPs (Skilled Health Professional) PER 10 000 POPULATION (Estimated 2010)
SUB-NATIONAL LOW NATIONAL AVERAGE SUB-NATIONAL HIGH
1 Physician
COUNTRY PROFILES
25%
Although many essential services are nominally free of charge, particularly to poor and marginalized groups, there is evidence of inadequate resources to meet demand, and out-of-pocket payments constitute 62% of total health expenditure. As a low-income country with predominantly rural population, communicable diseases remain the greatest source of DALYs lost, although their burden is declining. Further, Nepal has made good progress towards reducing maternal and infant mortality, and is on track to meet both Millennium Development Goals 4 and 5. However, the availability of physicians, nurses and midwives is still low, and there is limited likelihood of scaling up to meet indicative thresholds by 2035. There may also be challenges in acceptability, with only one quarter of physicians being women and a ratio of nurses to physicians below the OECD average. Regulation and accreditation mechanisms are in place through the various health professional councils. However, the evidence indicates challenges in the motivation, retention and performance of the health workforce, which the current strategic plan for human resources for health (2011–2015) is attempting to address.
NEPAL
TO MEET THRESHOLDS BY 2035, REQUIRES:
351% increase to meet 22.8/10 000 threshold
582% increase to meet 34.5/10 000 threshold
1075% increase to meet 59.4/10 000 threshold
1.5Physicians
2.1Physicians
5.0Physicians
Population [all (000s); proportion under 15 (%); proportion over 60 (%)]
26.8; 36; 6 (2010)
Average annual rate of population change (%) 1.2 (2010-2015)
Population living in urban areas (%) 17 (2011)Gross national income per capita (PPP int. $) 1260 (2011)Population living on <$1 (PPP int. $) a day (%) 24.82 (2010)Total expenditure on health as a percentage of gross domestic product (%)
5.4 (2011)
General government expenditure on health as a percentage of total expenditure on health (%)
39 (2011)
External resources for health as a percentage of total expenditure on health (%)
14.6 (2011)
Life expectancy at birth (years) [all; female; male] 68; 69; 67 (2011)Total fertility rate (per woman) 2.7 (2010)Neonatal mortality rate (per 1 000 live births) 27 (2011)
Infant mortality rate (per 1 000 live births) 39 (2011)Under-five mortality rate (per 1 000 live births) 48 [45-57] (2011)
Maternal mortality ratio (per 100 000 live births) 170 [100-290] (2010)Births attended by skilled health personnel (%) 36.0 (2011)Antenatal care coverage - at least one visit (%) 58.3 (2011)Antenatal care coverage - at least four visits (%) 50.1 (2011)
Diphtheria tetanus toxoid and pertussis (DTP3) immunization coverage among 1-year-olds (%)
92 (2011)
Postnatal care visit within two days of birth (%) 44.5 (2011)
1.1 Nurses
0
10
20
30
40
20152010 2020 2025 2030 20350
120
140
100
80
60
40
20
Thresholds**
34.5/10 00022.8/10 000
59.4/10 000
160
6.4/10 000*
CURRENTDENSITY
-150 -100 -50 0 50 100 150
Diarrheal diseases
Chronic obstructive pulmonary disease
Low back pain
Tuberculosis
Preterm birth complications
Iron-deficiency anemia
Self-harm
Lower respiratoryinfections
Neonatal encephalopathy (birthasphyxia and birth trauma)
Ischemic heartdisease
/ ?The ratio of nurses to physicians is
BELOWthe OECD average (2.8:1).
*Equal to the total of physicians (N= 5 384; 2004), nurses (N= 5 664; 2004) and auxiliary nurse midwives (N= 6 161; 2004) divided by the 2010 population (N= 26 846 000). Source: (WHO Global Health Observatory - Global Health Workforce Statistics – 2012 update - http://apps.who.int/gho/data/view.main)
**See Annex 1 for full explanation on country profile methods and sources.

HRH POLICY AND STRATEGY
SUB-NATIONAL LOW
GEOGRAPHICAL DISTRIBUTION OF PHYSICIANS(density per 10 000 population)
NATIONAL AVERAGE SUB-NATIONAL HIGH
Female physicians
HUMAN RESOURCES FOR HEALTHPOPULATION AND HEALTH
FEASIBILITYDENSITY OF SHPs (Skilled Health Professional)
PER 10 000 POPULATION (Estimated 2010)POPULATION (MILLIONS)
Is there evidence that the country has mechanisms in place to:
TO
AVAILABILITY
ACCEPTABILITY
ACCESSIBILITY
QUALITY
Top 10 causes of morbidity and mortality (DALYs)Communicable, maternal, neonatal, and nutritional InjuriesNon-communicable
Disability-adjusted life years (DALYs) quantify both premature mortality (YLLS) and disability (YLDs) within a population. The top 10 causes of DALYs are ranked from top to bottom in order of the number of DALYs they contribute in 2010. Bars going right show the percent by which DALYs have increased since 1990. Bars going left show the percent by which DALYs have decreased.
Feasibility of achieving thresholds: Most likely Least likelySomewhat likely
Leadership and Partnership
Policy and Management
Strategy/Plan and Finance
HRH GOVERNANCE
Is there government leadership on health workforce policy and management?
Is there intersectoral and multi-stakeholder partnership to inform health workforce policy and management?
related to population health needs?
informed by data and strategic intelligence?
addressing pre-service education?
addressing geographical distribution and retention?
addressing health workforce performance (e.g. competence, responsiveness and productivity)?
addressing international mobility of health workers; and where relevant the WHO Code of Practice on the International Recruitment of Health Personnel?
Is there a national HRH strategy/plan resulting from the above mechanisms?
For which period?
Does the strategy/plan account for the financial costs and resource requirements to implement it?
= Yes = No = Insufficient data= Partial
Is there evidence that the country is adopting recommended good practices on HRH:
Is existing health workforce policy and human resource management:
?
ACCREDIT training institutions for:
Dentists
Midwives
Nurses
Pharmacists
Physicians
REGULATE:
Dentists
Midwives
Nurses
Pharmacists
Physicians
LICENSE/RE-LICENSE:
Dentists
Midwives
Nurses
Pharmacists
Physicians
A UNIVERSAL TRUTH: NO HEALTH WITHOUT A WORKFORCE68
1 Physician 40%
A social health insurance mechanism covers about 18% of the population. There is limited financial protection, and out-of-pocket costs are high. Certain communicable diseases remain important causes of mortality and morbidity, but noncommunicable diseases are the rising burden. The density of skilled health professionals is currently very low, but with relatively slow population growth, it may be feasible to meet the 22.8 per 10 000 population indicative threshold by 2035. The distribution of physicians also shows persistent regional disparities, posing challenges to accessibility; the financial incentives should be improved to address this challenge. Although the ratio of nurses to doctors presented here is above the OECD average, other evidence points to an excessive reliance on physicians and a scarcity of nurses. Quality control mechanisms of the workforce also appear to require improvement, in particular in relation to setting up accreditation mechanisms for health education institutions and strengthening the regulation and licensing of health workers.
NICARAGUA
TO MEET THRESHHOLDS BY 2030, REQUIRES:
122% increase to meet 22.8/10 000 threshold
236% increase to meet 34.5/10 000 threshold
479% increase to meet 59.4/10 000 threshold
1.0Physicians
3.7Physicians
7.0Physicians
The ratio of nurses to physicians is
ABOVEthe OECD average.
2.9Nurses
Population [all (000s); proportion under 15 (%); proportion over 60 (%)]
5.8; 34; 6 (2010)
Annual population growth rate (%) 1.4 (2010)Population living in urban areas (%) 58 (2011)Gross national income per capita (PPP int. $) 3730 (2011)Population living on <$1 (PPP int. $) a day (%) –Total expenditure on health as a percentage of gross domestic product (%)
10.1 (2011)
General government expenditure on health as a percentage of total expenditure on health (%)
54 (2011)
External resources for health as a percentage of total expenditure on health (%)
10.8 (2011)
Life expectancy at birth (years) [all; female; male] 73; 76; 70 (2011)Total fertility rate (per woman) 2.6 (2010)Neonatal mortality rate (per 1 000 live births) 12 (2011)
Infant mortality rate (per 1 000 live births) 22 (2011)Under-five mortality rate (per 1 000 live births) 26 [22-32] (2011)
Maternal mortality ratio (per 100 000 live births) 95 [54-170] (2010)Births attended by skilled health personnel (%) 73.7 (2007)Antenatal care coverage - at least one visit (%) 90.2 (2007)Antenatal care coverage - at least four visits (%) 77.7 (2007)
Diphtheria tetanus toxoid and pertussis (DTP3) immunization coverage among 1-year-olds (%)
98 (2011)
Postnatal care visit within two days of birth (%) 7.0 (2007)
0
20
40
60
80
20152010 2020 2025 2030 2035
13.6/10 000*
CURRENTDENSITY
0
120
140
100
80
60
40
20
Thresholds**
34.5/10 00022.8/10 000
59.4/10 000
160
-150 -100 -50 0 50 100 150
Congenital anomalies
Major depressive disorder
Preterm birth complications
Low back pain
Chronic kidney diseases
Diarrheal diseases
Diabetes mellitus
Cerebrovascular disease
Ischemic heartdisease
Lower respiratoryinfections
?
??
?
??
2010
/
*Equal to the total of physicians (N= 2 045; 2003) and nursing associate professionals (N= 5 862; 2003) divided by the 2010 population (N= 5 822 000). Source: (WHO Global Health Observatory - Global Health Workforce Statistics – 2012 update - http://apps.who.int/gho/data/view.main)
**See Annex 1 for full explanation on country profile methods and sources.

GEOGRAPHICAL DISTRIBUTION OF PHYSICIANS(density per 10 000 population)
Female physicians
HUMAN RESOURCES FOR HEALTHPOPULATION AND HEALTH
FEASIBILITYPOPULATION (MILLIONS)
Is there evidence that the country has mechanisms in place to:
TO
AVAILABILITY
ACCEPTABILITY
ACCESSIBILITY
QUALITY
Top 10 causes of morbidity and mortality (DALYs)Communicable, maternal, neonatal, and nutritional InjuriesNon-communicable
Disability-adjusted life years (DALYs) quantify both premature mortality (YLLS) and disability (YLDs) within a population. The top 10 causes of DALYs are ranked from top to bottom in order of the number of DALYs they contribute in 2010. Bars going right show the percent by which DALYs have increased since 1990. Bars going left show the percent by which DALYs have decreased.
Feasibility of achieving thresholds: Most likely Least likelySomewhat likely
ACCREDIT training institutions for:
Dentists
Midwives
Nurses
Pharmacists
Physicians
REGULATE:
Dentists
Midwives
Nurses
Pharmacists
Physicians
LICENSE/RE-LICENSE:
Dentists
Midwives
Nurses
Pharmacists
Physicians
HRH POLICY AND STRATEGY
Leadership and Partnership
Policy and Management
Strategy/Plan and Finance
HRH GOVERNANCE
Is there government leadership on health workforce policy and management?
Is there intersectoral and multi-stakeholder partnership to inform health workforce policy and management?
related to population health needs?
informed by data and strategic intelligence?
addressing pre-service education?
addressing geographical distribution and retention?
addressing health workforce performance (e.g. competence, responsiveness and productivity)?
addressing international mobility of health workers; and where relevant the WHO Code of Practice on the International Recruitment of Health Personnel?
Is there a national HRH strategy/plan resulting from the above mechanisms?
For which period?
Does the strategy/plan account for the financial costs and resource requirements to implement it?
= Yes = No = Insufficient data= Partial
Is there evidence that the country is adopting recommended good practices on HRH:
Is existing health workforce policy and human resource management:
?
69
DENSITY OF SHPs (Skilled Health Professional) PER 10 000 POPULATION (Estimated 2010)
SUB-NATIONAL LOW NATIONAL AVERAGE SUB-NATIONAL HIGH
1 Physician
COUNTRY PROFILES
0
2
4
6
8
20152010 2020 2025 2030 20350
120
140
100
80
60
40
20
Thresholds**
34.5/10 00022.8/10 000
59.4/10 000
160
149.0/10 000*
CURRENTDENSITY
39%
TO MEET THRESHOLDS BY 2035, REQUIRES:
0% increase to meet 22.8/10 000 threshold
0% increase to meet 34.5/10 000 threshold
0% increase to meet 59.4/10 000 threshold
3.5NursesThe ratio of nurses
to physicians is
ABOVEthe OECD average.
–Physicians
40.7Physicians
–Physicians
Population [all (000s); proportion under 15 (%); proportion over 60 (%)]
4.9; 19; 21 (2010)
Average annual rate of population change (%) 1.0 (2010-2015)
Population living in urban areas (%) 79 (2011)Gross national income per capita (PPP int. $) 61460 (2011)Population living on <$1 (PPP int. $) a day (%) –Total expenditure on health as a percentage of gross domestic product (%)
9.1 (2011)
General government expenditure on health as a percentage of total expenditure on health (%)
86 (2011)
External resources for health as a percentage of total expenditure on health (%)
–
Life expectancy at birth (years) [all; female; male] 81; 83; 79 (2011)Total fertility rate (per woman) 1.9 (2010)Neonatal mortality rate (per 1 000 live births) 2 (2011)
Infant mortality rate (per 1 000 live births) 3 (2011)Under-five mortality rate (per 1 000 live births) 3 [3-4] (2011)
Maternal mortality ratio (per 100 000 live births) 7 [4-12] (2010)Births attended by skilled health personnel (%) 99.1 (2010)Antenatal care coverage - at least one visit (%) –Antenatal care coverage - at least four visits (%) –
Diphtheria tetanus toxoid and pertussis (DTP3) immunization coverage among 1-year-olds (%)
94 (2011)
Postnatal care visit within two days of birth (%) –
Norway’s health system ensures universal health coverage through the tax-based National Insurance Scheme. Norway has one of the highest health expenditure in the world, at more than US$ 4000 per person in 2010. Government expenditure on health amounts to nearly 86% of total health expenditure; private out-of-pocket expenditure is mainly for outpatient dental care and pharmaceuticals. The overall availability of health personnel is good, with a high density of physicians and nurses and a ratio of nurses to physicians above the OECD average. However, the country’s demographic and geographical conditions create workforce distribution and recruitment challenges in rural areas, particularly in relation to dentists, contributing to health inequalities. Nevertheless, evidence indicates good performance across the domains of availability, acceptability and quality. Norway is one of the largest international development aid donors, exceeding the United Nation’s official development assistance target of 0.7% of GDP in 2012.
NORWAY
-50 0 50
Low back pain
Ischemic heart disease
Cerebrovascular disease
Falls
Chronic obstructive pulmonary disease
Diabetes mellitus
Anxiety disorders
Neck pain
Trachea, bronchus,and lung cancers
Major depressivedisorder
/
?
2011-2015
*Equal to the total of nurses (N= 70 334; 2010) and midwives (N= 2 530; 2010) divided by the 2010 population (N= 4 891 000). Source: (WHO Global Health Observatory - Global Health Workforce Statistics – 2012 update - http://apps.who.int/gho/data/view.main)
**See Annex 1 for full explanation on country profile methods and sources.

HRH POLICY AND STRATEGY
SUB-NATIONAL LOW
GEOGRAPHICAL DISTRIBUTION OF PHYSICIANS(density per 10 000 population)
NATIONAL AVERAGE SUB-NATIONAL HIGH
Female physicians
HUMAN RESOURCES FOR HEALTHPOPULATION AND HEALTH
FEASIBILITYDENSITY OF SHPs (Skilled Health Professional)
PER 10 000 POPULATION (Estimated 2010)POPULATION (MILLIONS)
Is there evidence that the country has mechanisms in place to:
TO
AVAILABILITY
ACCEPTABILITY
ACCESSIBILITY
QUALITY
Top 10 causes of morbidity and mortality (DALYs)Communicable, maternal, neonatal, and nutritional InjuriesNon-communicable
Disability-adjusted life years (DALYs) quantify both premature mortality (YLLS) and disability (YLDs) within a population. The top 10 causes of DALYs are ranked from top to bottom in order of the number of DALYs they contribute in 2010. Bars going right show the percent by which DALYs have increased since 1990. Bars going left show the percent by which DALYs have decreased.
Feasibility of achieving thresholds: Most likely Least likelySomewhat likely
Leadership and Partnership
Policy and Management
Strategy/Plan and Finance
HRH GOVERNANCE
Is there government leadership on health workforce policy and management?
Is there intersectoral and multi-stakeholder partnership to inform health workforce policy and management?
related to population health needs?
informed by data and strategic intelligence?
addressing pre-service education?
addressing geographical distribution and retention?
addressing health workforce performance (e.g. competence, responsiveness and productivity)?
addressing international mobility of health workers; and where relevant the WHO Code of Practice on the International Recruitment of Health Personnel?
Is there a national HRH strategy/plan resulting from the above mechanisms?
For which period?
Does the strategy/plan account for the financial costs and resource requirements to implement it?
= Yes = No = Insufficient data= Partial
Is there evidence that the country is adopting recommended good practices on HRH:
Is existing health workforce policy and human resource management:
?
ACCREDIT training institutions for:
Dentists
Midwives
Nurses
Pharmacists
Physicians
REGULATE:
Dentists
Midwives
Nurses
Pharmacists
Physicians
LICENSE/RE-LICENSE:
Dentists
Midwives
Nurses
Pharmacists
Physicians
A UNIVERSAL TRUTH: NO HEALTH WITHOUT A WORKFORCE70
1 Physician
ACCREDIT training institutions for:
Dentists
Midwives
Nurses
Pharmacists
Physicians
A UNIVERSAL TRUTH: NO HEALTH WITHOUT A WORKFORCE
REGULATE:
Dentists
Midwives
Nurses
Pharmacists
Physicians
LICENSE/RE-LICENSE:
Dentists
Midwives
Nurses
Pharmacists
Physicians
0
1
2
3
4
5
20152010 2020 2025 2030 20350
120
140
100
80
60
40
20
Thresholds**
34.5/10 00022.8/10 000
59.4/10 000
160
66.8/10 000*
CURRENTDENSITY
39%
TO MEET THRESHOLDS BY 2035, REQUIRES:
0% increase to meet 22.8/10 000 threshold
0% increase to meet 34.5/10 000 threshold
0% increase to meet 59.4/10 000 threshold
2.2Nurses
26Physicians
20.5Physicians
12.2Physicians
Population [all (000s); proportion under 15 (%); proportion over 60 (%)]
2.8; 27; 4 (2010)
Average annual rate of population change (%) 7.9 (2010-2015)
Population living in urban areas (%) 73 (2011)Gross national income per capita (PPP int. $) –Population living on <$1 (PPP int. $) a day (%) –Total expenditure on health as a percentage of gross domestic product (%)
2.3 (2011)
General government expenditure on health as a percentage of total expenditure on health (%)
81 (2011)
External resources for health as a percentage of total expenditure on health (%)
–
Life expectancy at birth (years) [all; female; male] 72; 76; 70 (2011)Total fertility rate (per woman) 2.3 (2010)Neonatal mortality rate (per 1 000 live births) 5 (2011)
Infant mortality rate (per 1 000 live births) 7 (2011)Under-five mortality rate (per 1 000 live births) 9 [7-12] (2011)
Maternal mortality ratio (per 100 000 live births) 32 [19-51] (2010)Births attended by skilled health personnel (%) 98.6 (2008)Antenatal care coverage - at least one visit (%) 99.4 (2010)Antenatal care coverage - at least four visits (%) 85.3 (2010)
Diphtheria tetanus toxoid and pertussis (DTP3) immunization coverage among 1-year-olds (%)
99 (2011)
Postnatal care visit within two days of birth (%) –
OMANThe government funds the health care system in Oman. The government provides more than 80% of the country’s health care services. Health care services are free of charge for Omani nationals, while foreign workers and expatriates have to be enrolled in an insurance system. The main health workforce policy is the Omanization policy, which aims to produce enough health workers to reduce dependence on foreign health professionals. There is an important deficit both of specialized doctors and of nurses. The staffing situation is periodically reviewed and readjusted. Health workers are distributed across Oman following Ministry of Health guidelines and indications, and rotation of workers from one region to other is common (in cycles of two years) under civil service law. There is a greater concentration of physicians in the capital city of Muscat. Women physicians are 39% of the total physician workforce. The nurse-to-physician ratio is below the OECD average.Mechanisms for regulating and licensing the health workforce are functioning adequately. Relicensing is mandatory for all health professionals. Most education institutions are in the process of obtaining accreditation.
-150 -100 -50 0 50 100 150
Road injury
Diabetes mellitus
Major depressive disorder
Low back pain
Ischemic heart disease
Iron-deficiency anemia
Cerebrovascular disease
Congenital anomalies
Drug use disorders
Lower respiratoryinfections
/
2011-2015
The ratio of nurses to physicians is
BELOWthe OECD average (2.8:1).
*Equal to the total of physicians (N= 5 862; 2010) and nurses (N= 12 865; 2010) divided by the 2010 population (N= 2 803 000). Source: (WHO Global Health Observatory - Global Health Workforce Statistics – 2012 update - http://apps.who.int/gho/data/view.main)
**See Annex 1 for full explanation on country profile methods and sources.

GEOGRAPHICAL DISTRIBUTION OF PHYSICIANS(density per 10 000 population)
Female physicians
HUMAN RESOURCES FOR HEALTHPOPULATION AND HEALTH
FEASIBILITYPOPULATION (MILLIONS)
Is there evidence that the country has mechanisms in place to:
TO
AVAILABILITY
ACCEPTABILITY
ACCESSIBILITY
QUALITY
Top 10 causes of morbidity and mortality (DALYs)Communicable, maternal, neonatal, and nutritional InjuriesNon-communicable
Disability-adjusted life years (DALYs) quantify both premature mortality (YLLS) and disability (YLDs) within a population. The top 10 causes of DALYs are ranked from top to bottom in order of the number of DALYs they contribute in 2010. Bars going right show the percent by which DALYs have increased since 1990. Bars going left show the percent by which DALYs have decreased.
Feasibility of achieving thresholds: Most likely Least likelySomewhat likely
ACCREDIT training institutions for:
Dentists
Midwives
Nurses
Pharmacists
Physicians
REGULATE:
Dentists
Midwives
Nurses
Pharmacists
Physicians
LICENSE/RE-LICENSE:
Dentists
Midwives
Nurses
Pharmacists
Physicians
HRH POLICY AND STRATEGY
Leadership and Partnership
Policy and Management
Strategy/Plan and Finance
HRH GOVERNANCE
Is there government leadership on health workforce policy and management?
Is there intersectoral and multi-stakeholder partnership to inform health workforce policy and management?
related to population health needs?
informed by data and strategic intelligence?
addressing pre-service education?
addressing geographical distribution and retention?
addressing health workforce performance (e.g. competence, responsiveness and productivity)?
addressing international mobility of health workers; and where relevant the WHO Code of Practice on the International Recruitment of Health Personnel?
Is there a national HRH strategy/plan resulting from the above mechanisms?
For which period?
Does the strategy/plan account for the financial costs and resource requirements to implement it?
= Yes = No = Insufficient data= Partial
Is there evidence that the country is adopting recommended good practices on HRH:
Is existing health workforce policy and human resource management:
?
71
DENSITY OF SHPs (Skilled Health Professional) PER 10 000 POPULATION (Estimated 2010)
SUB-NATIONAL LOW NATIONAL AVERAGE SUB-NATIONAL HIGH
1 Physician
COUNTRY PROFILES
0
8
16
24
32
40
20152010 2020 2025 2030 20350
120
140
100
80
60
40
20
Thresholds**
34.5/10 00022.8/10 000
59.4/10 000
160
22.2/10 000*
CURRENTDENSITY
TO MEET THRESHOLDS BY 2035, REQUIRES:
33% increase to meet 22.8/10 000 threshold
102% increase to meet 34.5/10 000 threshold
247% increase to meet 59.4/10 000 threshold
1Nurse
15.4Physicians
9.2Physicians
2.8Physicians
Population [all (000s); proportion under 15 (%); proportion over 60 (%)]
29.3; 30; 9 (2010)
Average annual rate of population change (%) 1.3 (2010-2015)
Population living in urban areas (%) 77 (2011)Gross national income per capita (PPP int. $) 9440 (2011)Population living on <$1 (PPP int. $) a day (%) 4.91 (2010)Total expenditure on health as a percentage of gross domestic product (%)
4.8 (2011)
General government expenditure on health as a percentage of total expenditure on health (%)
56 (2011)
External resources for health as a percentage of total expenditure on health (%)
1.1 (2011)
Life expectancy at birth (years) [all; female; male] 77; 78; 75 (2011)Total fertility rate (per woman) 2.5 (2010)Neonatal mortality rate (per 1 000 live births) 9 (2011)
Infant mortality rate (per 1 000 live births) 14 (2011)Under-five mortality rate (per 1 000 live births) 18 [16-19] (2011)
Maternal mortality ratio (per 100 000 live births) 67 [42-110] (2010)Births attended by skilled health personnel (%) 85.0 (2011)Antenatal care coverage - at least one visit (%) 95.4 (2011)Antenatal care coverage - at least four visits (%) 94.2 (2011)
Diphtheria tetanus toxoid and pertussis (DTP3) immunization coverage among 1-year-olds (%)
91 (2011)
Postnatal care visit within two days of birth (%) 91.5 (2011)
The Ministry of Health (60%) and the Seguro Social de Salud de Perú (EsSalud) (30%) cover 90% of the population. The remaining 10% receive services from the private sector, the Armed Forces and the National Police. The Integral Health Insurance (Seguro Integral de Salud – SIS) covers the informal economy workers, self-employed in rural areas and the unemployed and their families. Since Peru’s system is decentralized, basic health services are defined locally according to the financial resources available and organization of services. Peru has a low health workforce density and faces geographical distribution imbalances: there are 7.7 physicians per 10 000 habitants in Lima versus less than 4.0 in rural regions such as Andean and Amazon jungle. Other types of health workers such as nurses (1 per physician) and midwives have a similar situation. The country requires strengthening of the information system for human resources for health and of the regulation of the quality of health professional education and practice. A plan for human resources for health (2010–2014) has been designed to address these challenges.
PERU
NO DATA
-100 -75 -50 -25 0 25 50 75 100
Ischemic heart disease
Low back pain
Preterm birthcomplications
Neonatal encephalopathy(birth asphyxia and
birth trauma)
Lowerrespiratoryinfections
2010-2014
? / ?The ratio of nurses to physicians is
BELOWthe OECD average (2.8:1).
*Equal to the total of physicians (N= 27 272; 2009), nurses (N= 28 117; 2009) and midwives (N= 9 555; 2009) divided by the 2010 population (N= 29 263 000). Source: (WHO Global Health Observatory - Global Health Workforce Statistics – 2012 update - http://apps.who.int/gho/data/view.main)
**See Annex 1 for full explanation on country profile methods and sources.
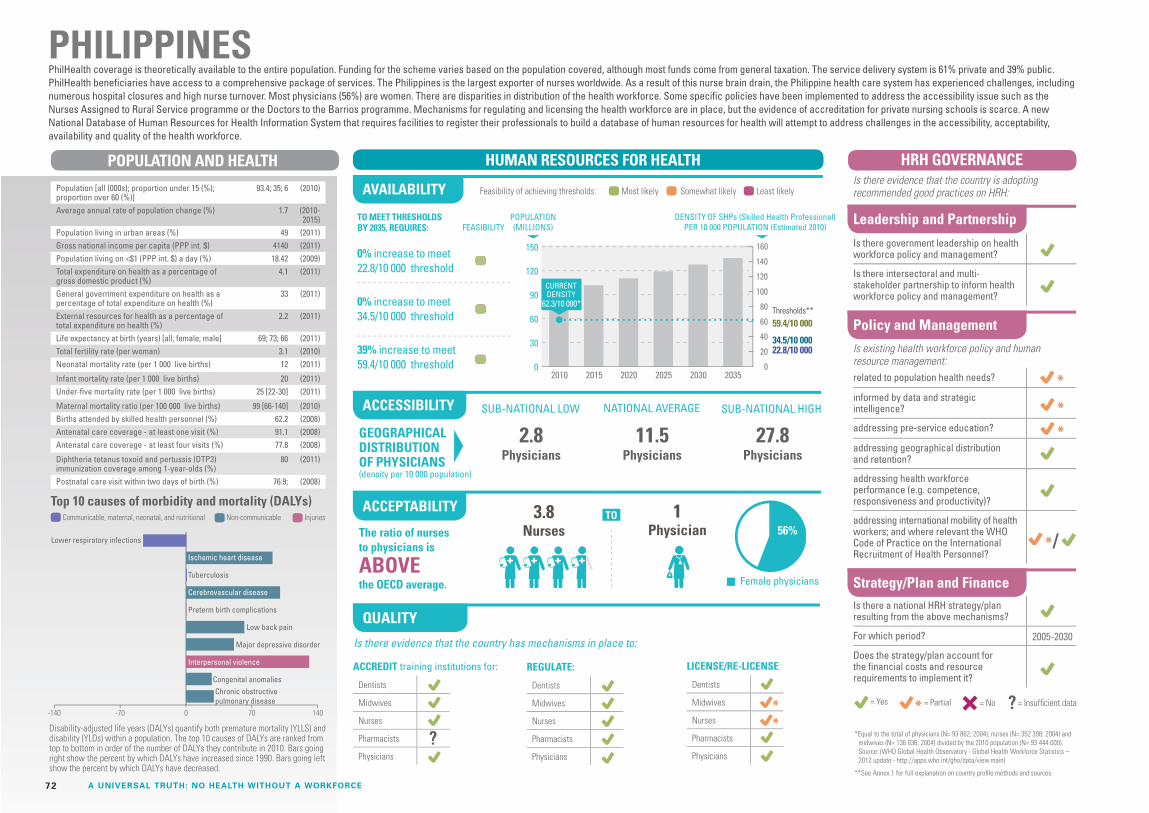
HRH POLICY AND STRATEGY
SUB-NATIONAL LOW
GEOGRAPHICAL DISTRIBUTION OF PHYSICIANS(density per 10 000 population)
NATIONAL AVERAGE SUB-NATIONAL HIGH
Female physicians
HUMAN RESOURCES FOR HEALTHPOPULATION AND HEALTH
FEASIBILITYDENSITY OF SHPs (Skilled Health Professional)
PER 10 000 POPULATION (Estimated 2010)POPULATION (MILLIONS)
Is there evidence that the country has mechanisms in place to:
TO
AVAILABILITY
ACCEPTABILITY
ACCESSIBILITY
QUALITY
Top 10 causes of morbidity and mortality (DALYs)Communicable, maternal, neonatal, and nutritional InjuriesNon-communicable
Disability-adjusted life years (DALYs) quantify both premature mortality (YLLS) and disability (YLDs) within a population. The top 10 causes of DALYs are ranked from top to bottom in order of the number of DALYs they contribute in 2010. Bars going right show the percent by which DALYs have increased since 1990. Bars going left show the percent by which DALYs have decreased.
Feasibility of achieving thresholds: Most likely Least likelySomewhat likely
Leadership and Partnership
Policy and Management
Strategy/Plan and Finance
HRH GOVERNANCE
Is there government leadership on health workforce policy and management?
Is there intersectoral and multi-stakeholder partnership to inform health workforce policy and management?
related to population health needs?
informed by data and strategic intelligence?
addressing pre-service education?
addressing geographical distribution and retention?
addressing health workforce performance (e.g. competence, responsiveness and productivity)?
addressing international mobility of health workers; and where relevant the WHO Code of Practice on the International Recruitment of Health Personnel?
Is there a national HRH strategy/plan resulting from the above mechanisms?
For which period?
Does the strategy/plan account for the financial costs and resource requirements to implement it?
= Yes = No = Insufficient data= Partial
Is there evidence that the country is adopting recommended good practices on HRH:
Is existing health workforce policy and human resource management:
?
ACCREDIT training institutions for:
Dentists
Midwives
Nurses
Pharmacists
Physicians
REGULATE:
Dentists
Midwives
Nurses
Pharmacists
Physicians
LICENSE/RE-LICENSE:
Dentists
Midwives
Nurses
Pharmacists
Physicians
A UNIVERSAL TRUTH: NO HEALTH WITHOUT A WORKFORCE72
1 Physician
0
30
60
90
120
150
20152010 2020 2025 2030 20350
120
140
100
80
60
40
20
Thresholds**
34.5/10 00022.8/10 000
59.4/10 000
160
62.3/10 000*
CURRENTDENSITY
56%
TO MEET THRESHOLDS BY 2035, REQUIRES:
0% increase to meet 22.8/10 000 threshold
0% increase to meet 34.5/10 000 threshold
39% increase to meet 59.4/10 000 threshold
3.8NursesThe ratio of nurses
to physicians is
ABOVEthe OECD average.
27.8Physicians
11.5Physicians
2.8Physicians
Population [all (000s); proportion under 15 (%); proportion over 60 (%)]
93.4; 35; 6 (2010)
Average annual rate of population change (%) 1.7 (2010-2015)
Population living in urban areas (%) 49 (2011)Gross national income per capita (PPP int. $) 4140 (2011)Population living on <$1 (PPP int. $) a day (%) 18.42 (2009)Total expenditure on health as a percentage of gross domestic product (%)
4.1 (2011)
General government expenditure on health as a percentage of total expenditure on health (%)
33 (2011)
External resources for health as a percentage of total expenditure on health (%)
2.2 (2011)
Life expectancy at birth (years) [all; female; male] 69; 73; 66 (2011)Total fertility rate (per woman) 3.1 (2010)Neonatal mortality rate (per 1 000 live births) 12 (2011)
Infant mortality rate (per 1 000 live births) 20 (2011)Under-five mortality rate (per 1 000 live births) 25 [22-30] (2011)
Maternal mortality ratio (per 100 000 live births) 99 [66-140] (2010)Births attended by skilled health personnel (%) 62.2 (2008)Antenatal care coverage - at least one visit (%) 91.1 (2008)Antenatal care coverage - at least four visits (%) 77.8 (2008)
Diphtheria tetanus toxoid and pertussis (DTP3) immunization coverage among 1-year-olds (%)
80 (2011)
Postnatal care visit within two days of birth (%) 76.9; (2008)
PhilHealth coverage is theoretically available to the entire population. Funding for the scheme varies based on the population covered, although most funds come from general taxation. The service delivery system is 61% private and 39% public. PhilHealth beneficiaries have access to a comprehensive package of services. The Philippines is the largest exporter of nurses worldwide. As a result of this nurse brain drain, the Philippine health care system has experienced challenges, including numerous hospital closures and high nurse turnover. Most physicians (56%) are women. There are disparities in distribution of the health workforce. Some specific policies have been implemented to address the accessibility issue such as the Nurses Assigned to Rural Service programme or the Doctors to the Barrios programme. Mechanisms for regulating and licensing the health workforce are in place, but the evidence of accreditation for private nursing schools is scarce. A new National Database of Human Resources for Health Information System that requires facilities to register their professionals to build a database of human resources for health will attempt to address challenges in the accessibility, acceptability, availability and quality of the health workforce.
PHILIPPINES
-140 -70 0 70 140
Lower respiratory infections
Ischemic heart disease
Tuberculosis
Cerebrovascular disease
Preterm birth complications
Low back pain
Major depressive disorder
Interpersonal violence
Congenital anomaliesChronic obstructivepulmonary disease
?
/
2005-2030
*Equal to the total of physicians (N= 93 862; 2004), nurses (N= 352 398; 2004) and midwives (N= 136 036; 2004) divided by the 2010 population (N= 93 444 000). Source: (WHO Global Health Observatory - Global Health Workforce Statistics – 2012 update - http://apps.who.int/gho/data/view.main)
**See Annex 1 for full explanation on country profile methods and sources.

GEOGRAPHICAL DISTRIBUTION OF PHYSICIANS(density per 10 000 population)
Female physicians
HUMAN RESOURCES FOR HEALTHPOPULATION AND HEALTH
FEASIBILITYPOPULATION (MILLIONS)
Is there evidence that the country has mechanisms in place to:
TO
AVAILABILITY
ACCEPTABILITY
ACCESSIBILITY
QUALITY
Top 10 causes of morbidity and mortality (DALYs)Communicable, maternal, neonatal, and nutritional InjuriesNon-communicable
Disability-adjusted life years (DALYs) quantify both premature mortality (YLLS) and disability (YLDs) within a population. The top 10 causes of DALYs are ranked from top to bottom in order of the number of DALYs they contribute in 2010. Bars going right show the percent by which DALYs have increased since 1990. Bars going left show the percent by which DALYs have decreased.
Feasibility of achieving thresholds: Most likely Least likelySomewhat likely
ACCREDIT training institutions for:
Dentists
Midwives
Nurses
Pharmacists
Physicians
REGULATE:
Dentists
Midwives
Nurses
Pharmacists
Physicians
LICENSE/RE-LICENSE:
Dentists
Midwives
Nurses
Pharmacists
Physicians
HRH POLICY AND STRATEGY
Leadership and Partnership
Policy and Management
Strategy/Plan and Finance
HRH GOVERNANCE
Is there government leadership on health workforce policy and management?
Is there intersectoral and multi-stakeholder partnership to inform health workforce policy and management?
related to population health needs?
informed by data and strategic intelligence?
addressing pre-service education?
addressing geographical distribution and retention?
addressing health workforce performance (e.g. competence, responsiveness and productivity)?
addressing international mobility of health workers; and where relevant the WHO Code of Practice on the International Recruitment of Health Personnel?
Is there a national HRH strategy/plan resulting from the above mechanisms?
For which period?
Does the strategy/plan account for the financial costs and resource requirements to implement it?
= Yes = No = Insufficient data= Partial
Is there evidence that the country is adopting recommended good practices on HRH:
Is existing health workforce policy and human resource management:
?
73
DENSITY OF SHPs (Skilled Health Professional) PER 10 000 POPULATION (Estimated 2010)
SUB-NATIONAL LOW NATIONAL AVERAGE SUB-NATIONAL HIGH
1 Physician
COUNTRY PROFILES
0
5
10
15
20
25
20152010 2020 2025 2030 20350
120
140
100
80
60
40
20
Thresholds**
34.5/10 00022.8/10 000
59.4/10 000
160
4.6/10 000*
CURRENTDENSITY
26%
TO MEET THRESHOLDS BY 2035, REQUIRES:
803% increase to meet 22.8/10 000 threshold
1307% increase to meet 34.5/10 000 threshold
2323% increase to meet 59.4/10 000 threshold
The ratio of nurses to physicians is
ABOVEthe OECD average.
6Nurses
26%
4.3Physicians
0.6Physicians
0.2Physicians
Population [all (000s); proportion under 15 (%); proportion over 60 (%)]
13; 44; 4 (2010)
Average annual rate of population change (%) 2.9 (2010-2015)
Population living in urban areas (%) 43 (2011)Gross national income per capita (PPP int. $) 1940 (2011)Population living on <$1 (PPP int. $) a day (%) –Total expenditure on health as a percentage of gross domestic product (%)
6.0 (2011)
General government expenditure on health as a percentage of total expenditure on health (%)
58 (2011)
External resources for health as a percentage of total expenditure on health (%)
14.0 (2011)
Life expectancy at birth (years) [all; female; male] 61; 62; 60 (2011)Total fertility rate (per woman) 4.8 (2010)Neonatal mortality rate (per 1 000 live births) 26 (2011)
Infant mortality rate (per 1 000 live births) 47 (2011)Under-five mortality rate (per 1 000 live births) 65 [59-91] (2011)
Maternal mortality ratio (per 100 000 live births) 370 [230-640] (2010)Births attended by skilled health personnel (%) 65.1 (2011)Antenatal care coverage - at least one visit (%) 93.3 (2011)Antenatal care coverage - at least four visits (%) 50 (2011)
Diphtheria tetanus toxoid and pertussis (DTP3) immunization coverage among 1-year-olds (%)
83 (2011)
Postnatal care visit within two days of birth (%) 68 (2011)
About 20% of the population is covered through the compulsory health insurance scheme for formal-sector workers or through private health insurance, mainly in the form of mutuelles. Health services are available free of charge in public facilities. Out-of-pocket expenditure, mainly for medicines and for private services, accounts for 34% of the national health expenditure. A compulsory universal insurance scheme, a priority for the President of the Republic, is in the process of being created, as a strategy for improving equity in access to health services. Senegal has made progress towards achieving Millennium Development Goal 4 and maternal mortality rates have been reduced, but Millennium Development Goal 5 is unlikely to be achieved. Skilled health personnel attended 65% of births between 2005 and 2012, but this varies considerably according to place of residence, economic status and educational level. The National Health Plan 2009–2018 recognizes that measures are needed to tackle the scarcity of health personnel and disparities in distribution across regions, by increasing training capacity at the national level and adopting measures to promote workforce retention.
SENEGAL
-100 -50 0 50 100
Malaria
Diarrheal diseases
Lower respiratory infections
Preterm birth complications
Iron-deficiency anemia
Meningitis
Tuberculosis
HIV/AIDS
Neonatal encephalopathy(birth asphyxia and birth trauma)
Sepsis and other infectiousdisorders of the newborn baby
?
???
/ ?
?
2009-2018
*Equal to the total of physicians (N= 741; 2008), assistant nurses (N= 248; 2008), matrons (N= 282; 2008), licensed nurses (N= 623; 2008), state nurses (N= 1 295; 2008), auxiliary nurses (N= 2 009; 2008) and midwives (N= 797; 2008) divided by the 2010 population (N= 12 951 000). Source: (WHO Global Health Observatory - Global Health Workforce Statistics – 2012 update - http://apps.who.int/gho/data/view.main)
**See Annex 1 for full explanation on country profile methods and sources.

HRH POLICY AND STRATEGY
SUB-NATIONAL LOW
GEOGRAPHICAL DISTRIBUTION OF PHYSICIANS(density per 10 000 population)
NATIONAL AVERAGE SUB-NATIONAL HIGH
Female physicians
HUMAN RESOURCES FOR HEALTHPOPULATION AND HEALTH
FEASIBILITYDENSITY OF SHPs (Skilled Health Professional)
PER 10 000 POPULATION (Estimated 2010)POPULATION (MILLIONS)
Is there evidence that the country has mechanisms in place to:
TO
AVAILABILITY
ACCEPTABILITY
ACCESSIBILITY
QUALITY
Top 10 causes of morbidity and mortality (DALYs)Communicable, maternal, neonatal, and nutritional InjuriesNon-communicable
Disability-adjusted life years (DALYs) quantify both premature mortality (YLLS) and disability (YLDs) within a population. The top 10 causes of DALYs are ranked from top to bottom in order of the number of DALYs they contribute in 2010. Bars going right show the percent by which DALYs have increased since 1990. Bars going left show the percent by which DALYs have decreased.
Feasibility of achieving thresholds: Most likely Least likelySomewhat likely
Leadership and Partnership
Policy and Management
Strategy/Plan and Finance
HRH GOVERNANCE
Is there government leadership on health workforce policy and management?
Is there intersectoral and multi-stakeholder partnership to inform health workforce policy and management?
related to population health needs?
informed by data and strategic intelligence?
addressing pre-service education?
addressing geographical distribution and retention?
addressing health workforce performance (e.g. competence, responsiveness and productivity)?
addressing international mobility of health workers; and where relevant the WHO Code of Practice on the International Recruitment of Health Personnel?
Is there a national HRH strategy/plan resulting from the above mechanisms?
For which period?
Does the strategy/plan account for the financial costs and resource requirements to implement it?
= Yes = No = Insufficient data= Partial
Is there evidence that the country is adopting recommended good practices on HRH:
Is existing health workforce policy and human resource management:
?
ACCREDIT training institutions for:
Dentists
Midwives
Nurses
Pharmacists
Physicians
REGULATE:
Dentists
Midwives
Nurses
Pharmacists
Physicians
LICENSE/RE-LICENSE:
Dentists
Midwives
Nurses
Pharmacists
Physicians
A UNIVERSAL TRUTH: NO HEALTH WITHOUT A WORKFORCE74
1 Physician
0
20
40
60
80
20152010 2020 2025 2030 20350
120
140
100
80
60
40
20
Thresholds**
34.5/10 00022.8/10 000
59.4/10 000
160
43.3/10 000*
CURRENTDENSITY
30%
TO MEET THRESHOLDS BY 2035, REQUIRES:
0% increase to meet 22.8/10 000 threshold
0% increase to meet 34.5/10 000 threshold
59% increase to meet 59.4/10 000 threshold
4.8NursesThe ratio of nurses
to physicians is
ABOVEthe OECD average.
14.7Physicians
7.6Physicians
1.8Physicians
Population [all (000s); proportion under 15 (%); proportion over 60 (%)]
51.5; 30; 7 (2010)
Average annual rate of population change (%) 0.8 (2010-2015)
Population living in urban areas (%) 62 (2011)Gross national income per capita (PPP int. $) 10710 (2011)Population living on <$1 (PPP int. $) a day (%) 13.77; 2009 (2010)Total expenditure on health as a percentage of gross domestic product (%)
8.5 (2011)
General government expenditure on health as a percentage of total expenditure on health (%)
48 (2011)
External resources for health as a percentage of total expenditure on health (%)
2.1 (2011)
Life expectancy at birth (years) [all; female; male] 58; 60; 57 (2011)Total fertility rate (per woman) 2.5 (2010)Neonatal mortality rate (per 1 000 live births) 19 (2011)
Infant mortality rate (per 1 000 live births) 35 (2011)Under-five mortality rate (per 1 000 live births) 47 [32-60] (2011)
Maternal mortality ratio (per 100 000 live births) 300 [150-500] (2010)Births attended by skilled health personnel (%) –Antenatal care coverage - at least one visit (%) –Antenatal care coverage - at least four visits (%) –
Diphtheria tetanus toxoid and pertussis (DTP3) immunization coverage among 1-year-olds (%)
72 (2011)
Postnatal care visit within two days of birth (%) –
South Africa’s health system comprises a public-private mix, characterized by entrenched maldistribution of resources dating back to the apartheid era, and with inefficiency and inequity that contribute to falling short of the health Millennium Development Goals. Steps have been taken to put the country on a trajectory of achieving universal health coverage through a national health insurance system. The focus on human resources for health has increased as part of a 2011 strategic plan, driven by the very high burden of HIV, tuberculosis and maternal and child diseases. The ratio of nurses to physicians is above the OECD average, and the percentage of women physicians is 30%. Mechanisms for accreditation, regulation and licensing of the health workforce are in place, and some evidence indicates their efficiency. Despite some good progress, availability and accessibility still present challenges. The density of physicians is well below OECD standards, with a great variation in density of physicians between regions. Migration flows to high-income countries are important, partially compensated by inflows from poorer neighboring countries. Recently these flows have been reduced significantly, especially for nurses.
SOUTH AFRICA
-100 -50 0 50 100
HIV/AIDS
Diarrheal diseases
Interpersonal violence
Lower respiratory infections
Tuberculosis
Diabetes mellitus
Cerebrovascular disease
Preterm birth complications
Major depressive disorder
Chronic obstructivepulmonary disease
/
2012-2017
*Equal to the total of physicians (N= 38 236; 2011), auxiliary/assistant nurses and midwives (N= 50 703; 2004), enrolled nurse/ midwives (N= 35 266; 2004) and professional / registered nurses/midwives (N= 98 490; 2004) divided by the 2010 population (N= 51 452 000). Source: (WHO Global Health Observatory - Global Health Workforce Statistics – 2012 update - http://apps.who.int/gho/data/view.main)
**See Annex 1 for full explanation on country profile methods and sources.
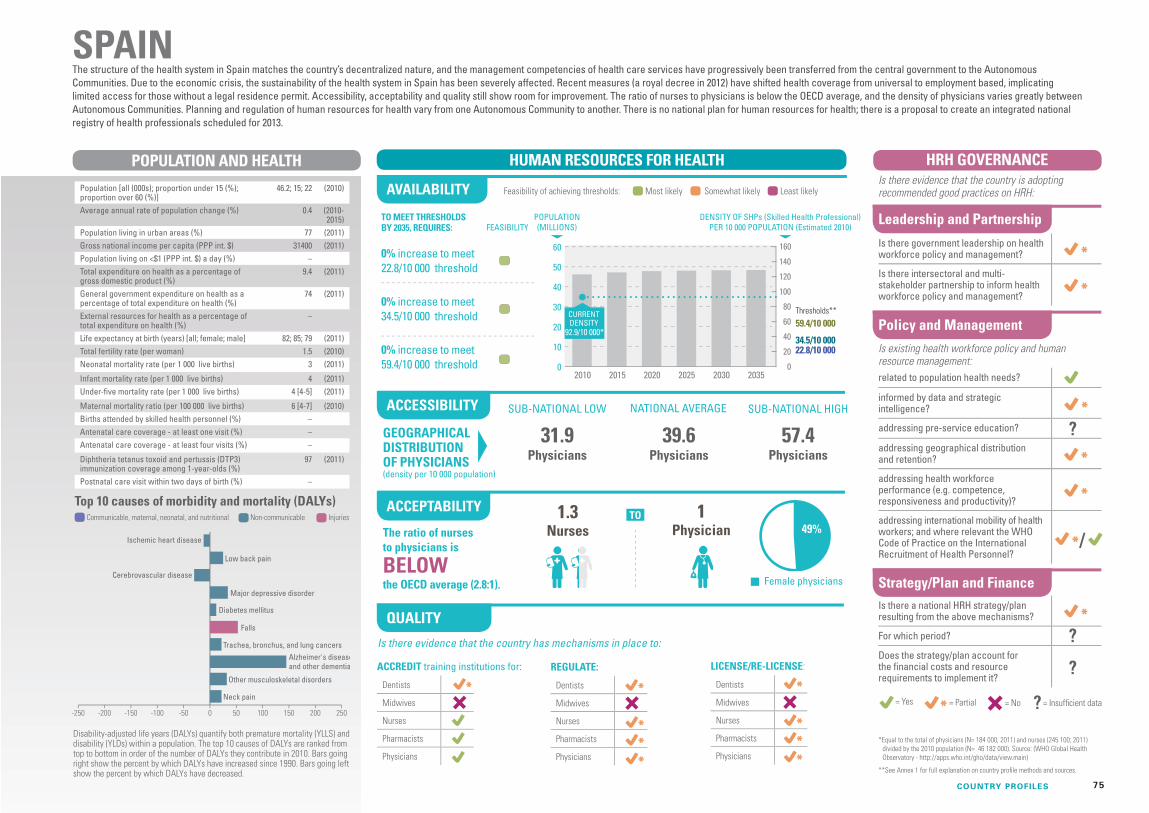
GEOGRAPHICAL DISTRIBUTION OF PHYSICIANS(density per 10 000 population)
Female physicians
HUMAN RESOURCES FOR HEALTHPOPULATION AND HEALTH
FEASIBILITYPOPULATION (MILLIONS)
Is there evidence that the country has mechanisms in place to:
TO
AVAILABILITY
ACCEPTABILITY
ACCESSIBILITY
QUALITY
Top 10 causes of morbidity and mortality (DALYs)Communicable, maternal, neonatal, and nutritional InjuriesNon-communicable
Disability-adjusted life years (DALYs) quantify both premature mortality (YLLS) and disability (YLDs) within a population. The top 10 causes of DALYs are ranked from top to bottom in order of the number of DALYs they contribute in 2010. Bars going right show the percent by which DALYs have increased since 1990. Bars going left show the percent by which DALYs have decreased.
Feasibility of achieving thresholds: Most likely Least likelySomewhat likely
ACCREDIT training institutions for:
Dentists
Midwives
Nurses
Pharmacists
Physicians
REGULATE:
Dentists
Midwives
Nurses
Pharmacists
Physicians
LICENSE/RE-LICENSE:
Dentists
Midwives
Nurses
Pharmacists
Physicians
HRH POLICY AND STRATEGY
Leadership and Partnership
Policy and Management
Strategy/Plan and Finance
HRH GOVERNANCE
Is there government leadership on health workforce policy and management?
Is there intersectoral and multi-stakeholder partnership to inform health workforce policy and management?
related to population health needs?
informed by data and strategic intelligence?
addressing pre-service education?
addressing geographical distribution and retention?
addressing health workforce performance (e.g. competence, responsiveness and productivity)?
addressing international mobility of health workers; and where relevant the WHO Code of Practice on the International Recruitment of Health Personnel?
Is there a national HRH strategy/plan resulting from the above mechanisms?
For which period?
Does the strategy/plan account for the financial costs and resource requirements to implement it?
= Yes = No = Insufficient data= Partial
Is there evidence that the country is adopting recommended good practices on HRH:
Is existing health workforce policy and human resource management:
?
75
DENSITY OF SHPs (Skilled Health Professional) PER 10 000 POPULATION (Estimated 2010)
SUB-NATIONAL LOW NATIONAL AVERAGE SUB-NATIONAL HIGH
1 Physician
COUNTRY PROFILES
0
10
20
30
40
50
60
20152010 2020 2025 2030 20350
120
140
100
80
60
40
20
Thresholds**
34.5/10 00022.8/10 000
59.4/10 000
160
92.9/10 000*
CURRENTDENSITY
49%
TO MEET THRESHOLDS BY 2035, REQUIRES:
0% increase to meet 22.8/10 000 threshold
0% increase to meet 34.5/10 000 threshold
0% increase to meet 59.4/10 000 threshold
1.3Nurses
57.4Physicians
39.6Physicians
31.9Physicians
Population [all (000s); proportion under 15 (%); proportion over 60 (%)]
46.2; 15; 22 (2010)
Average annual rate of population change (%) 0.4 (2010-2015)
Population living in urban areas (%) 77 (2011)Gross national income per capita (PPP int. $) 31400 (2011)Population living on <$1 (PPP int. $) a day (%) –Total expenditure on health as a percentage of gross domestic product (%)
9.4 (2011)
General government expenditure on health as a percentage of total expenditure on health (%)
74 (2011)
External resources for health as a percentage of total expenditure on health (%)
–
Life expectancy at birth (years) [all; female; male] 82; 85; 79 (2011)Total fertility rate (per woman) 1.5 (2010)Neonatal mortality rate (per 1 000 live births) 3 (2011)
Infant mortality rate (per 1 000 live births) 4 (2011)Under-five mortality rate (per 1 000 live births) 4 [4-5] (2011)
Maternal mortality ratio (per 100 000 live births) 6 [4-7] (2010)Births attended by skilled health personnel (%) –Antenatal care coverage - at least one visit (%) –Antenatal care coverage - at least four visits (%) –
Diphtheria tetanus toxoid and pertussis (DTP3) immunization coverage among 1-year-olds (%)
97 (2011)
Postnatal care visit within two days of birth (%) –
The structure of the health system in Spain matches the country’s decentralized nature, and the management competencies of health care services have progressively been transferred from the central government to the Autonomous Communities. Due to the economic crisis, the sustainability of the health system in Spain has been severely affected. Recent measures (a royal decree in 2012) have shifted health coverage from universal to employment based, implicating limited access for those without a legal residence permit. Accessibility, acceptability and quality still show room for improvement. The ratio of nurses to physicians is below the OECD average, and the density of physicians varies greatly between Autonomous Communities. Planning and regulation of human resources for health vary from one Autonomous Community to another. There is no national plan for human resources for health; there is a proposal to create an integrated national registry of health professionals scheduled for 2013.
SPAIN
-250 -200 -150 -100 -50 0 50 100 150 200 250
Low back pain
Major depressive disorder
Falls
Trachea, bronchus, and lung cancers
Other musculoskeletal disorders
Neck pain
Ischemic heart disease
Cerebrovascular disease
Alzheimer's diseaseand other dementias
Diabetes mellitus
?
?
/
?
The ratio of nurses to physicians is
BELOWthe OECD average (2.8:1).
*Equal to the total of physicians (N= 184 000; 2011) and nurses (245 100; 2011) divided by the 2010 population (N= 46 182 000). Source: (WHO Global Health Observatory - http://apps.who.int/gho/data/view.main)
**See Annex 1 for full explanation on country profile methods and sources.

HRH POLICY AND STRATEGY
SUB-NATIONAL LOW
GEOGRAPHICAL DISTRIBUTION OF PHYSICIANS(density per 10 000 population)
NATIONAL AVERAGE SUB-NATIONAL HIGH
Female physicians
HUMAN RESOURCES FOR HEALTHPOPULATION AND HEALTH
FEASIBILITYDENSITY OF SHPs (Skilled Health Professional)
PER 10 000 POPULATION (Estimated 2010)POPULATION (MILLIONS)
Is there evidence that the country has mechanisms in place to:
TO
AVAILABILITY
ACCEPTABILITY
ACCESSIBILITY
QUALITY
Top 10 causes of morbidity and mortality (DALYs)Communicable, maternal, neonatal, and nutritional InjuriesNon-communicable
Disability-adjusted life years (DALYs) quantify both premature mortality (YLLS) and disability (YLDs) within a population. The top 10 causes of DALYs are ranked from top to bottom in order of the number of DALYs they contribute in 2010. Bars going right show the percent by which DALYs have increased since 1990. Bars going left show the percent by which DALYs have decreased.
Feasibility of achieving thresholds: Most likely Least likelySomewhat likely
Leadership and Partnership
Policy and Management
Strategy/Plan and Finance
HRH GOVERNANCE
Is there government leadership on health workforce policy and management?
Is there intersectoral and multi-stakeholder partnership to inform health workforce policy and management?
related to population health needs?
informed by data and strategic intelligence?
addressing pre-service education?
addressing geographical distribution and retention?
addressing health workforce performance (e.g. competence, responsiveness and productivity)?
addressing international mobility of health workers; and where relevant the WHO Code of Practice on the International Recruitment of Health Personnel?
Is there a national HRH strategy/plan resulting from the above mechanisms?
For which period?
Does the strategy/plan account for the financial costs and resource requirements to implement it?
= Yes = No = Insufficient data= Partial
Is there evidence that the country is adopting recommended good practices on HRH:
Is existing health workforce policy and human resource management:
?
ACCREDIT training institutions for:
Dentists
Midwives
Nurses
Pharmacists
Physicians
REGULATE:
Dentists
Midwives
Nurses
Pharmacists
Physicians
LICENSE/RE-LICENSE:
Dentists
Midwives
Nurses
Pharmacists
Physicians
A UNIVERSAL TRUTH: NO HEALTH WITHOUT A WORKFORCE76
1 Physician
0
6
12
18
24
30
20152010 2020 2025 2030 20350
120
140
100
80
60
40
20
Thresholds**
34.5/10 00022.8/10 000
59.4/10 000
160
24.5/10 000*
CURRENTDENSITY
20152010 2020 2025 2030 2035
34%
TO MEET THRESHOLDS BY 2035, REQUIRES:
5% increase to meet 22.8/10 000 threshold
60% increase to meet 34.5/10 000 threshold
175% increase to meet 59.4/10 000 threshold
3.1NursesThe ratio of nurses
to physicians is
ABOVEthe OECD average.
–Physicians
4.9Physicians
–Physicians
Population [all (000s); proportion under 15 (%); proportion over 60 (%)]
20.8; 25; 12 (2010)
Average annual rate of population change (%) 0.8 (2010-2015)
Population living in urban areas (%) 15 (2011)Gross national income per capita (PPP int. $) 5520 (2011)Population living on <$1 (PPP int. $) a day (%) 7.04 (2007)Total expenditure on health as a percentage of gross domestic product (%)
3.4 (2011)
General government expenditure on health as a percentage of total expenditure on health (%)
45 (2011)
External resources for health as a percentage of total expenditure on health (%)
2.7 (2011)
Life expectancy at birth (years) [all; female; male] 75; 78; 71 (2011)Total fertility rate (per woman) 2.3 (2010)Neonatal mortality rate (per 1 000 live births) 8 (2011)
Infant mortality rate (per 1 000 live births) 11 (2011)Under-five mortality rate (per 1 000 live births) 12 [10-13] (2011)
Maternal mortality ratio (per 100 000 live births) 35 [25-49] (2010)Births attended by skilled health personnel (%) 98.6 (2007)Antenatal care coverage - at least one visit (%) 99.4 (2007)Antenatal care coverage - at least four visits (%) 92.5 (2007)
Diphtheria tetanus toxoid and pertussis (DTP3) immunization coverage among 1-year-olds (%)
99 (2011)
Postnatal care visit within two days of birth (%) 70.8 (2007)
Most public health services are available free of charge to all citizens. The main health challenge is the rising burden of noncommunicable diseases, including heart disease, stroke and diabetes. The performance of the workforce across the different dimensions is generally good, with some remaining challenges. The availability of skilled health professionals is currently above the 22.8 per 10 000 population threshold and requires only a slight increase to keep pace with population growth up to 2035; it might even be feasible to meet the higher 34.5 per 10 000 population threshold. There is, however, a skewed distribution of staff towards urban areas, which affects accessibility. The ratio of nurses to physicians is above the OECD average. In terms of indicators of quality, there may be scope for improvement in accreditation of educational institutions. Improving in-service training is another area in need of attention. There is a strong policy backing for developing human resources for health, including a costed strategic plan (2009–2018), but better information systems on human resources for health are required.
SRI LANKA
-220 -180 -140 -100 -60 -20 20 60 100 140 180 220
Ischemic heart disease
Self-harm
Diabetes mellitus
Cerebrovascular disease
Major depressive disorder
Low back pain
Iron-deficiency anemia
Lower respiratory infections
Road injury
Chronic obstructivepulmonary disease
?
??
?
?
? ?
?
? / ?
2009-2018
*Equal to the total of physicians (N= 10 279; 2006), matrons (N= 103; 2007), ward sisters (N= 627; 2007), principals/sister tutors (N= 184; 2007), nursing officers (N= 21 166; 2007), supervising public health nursing sisters/ public health nursing sisters (N= 290; 2007), pupil nurses (N= 9 096; 2007), supervising public health midwives (N= 217; 2007), public health midwives (N= 6 167; 2007) and hospital midwives (N= 2 828; 2007) divided by the 2010 population (N= 20 759 000). Source: (WHO Global Health Observatory - http://apps.who.int/gho/data/view.main)
**See Annex 1 for full explanation on country profile methods and sources.

GEOGRAPHICAL DISTRIBUTION OF PHYSICIANS(density per 10 000 population)
Female physicians
HUMAN RESOURCES FOR HEALTHPOPULATION AND HEALTH
FEASIBILITYPOPULATION (MILLIONS)
Is there evidence that the country has mechanisms in place to:
TO
AVAILABILITY
ACCEPTABILITY
ACCESSIBILITY
QUALITY
Top 10 causes of morbidity and mortality (DALYs)Communicable, maternal, neonatal, and nutritional InjuriesNon-communicable
Disability-adjusted life years (DALYs) quantify both premature mortality (YLLS) and disability (YLDs) within a population. The top 10 causes of DALYs are ranked from top to bottom in order of the number of DALYs they contribute in 2010. Bars going right show the percent by which DALYs have increased since 1990. Bars going left show the percent by which DALYs have decreased.
Feasibility of achieving thresholds: Most likely Least likelySomewhat likely
ACCREDIT training institutions for:
Dentists
Midwives
Nurses
Pharmacists
Physicians
REGULATE:
Dentists
Midwives
Nurses
Pharmacists
Physicians
LICENSE/RE-LICENSE:
Dentists
Midwives
Nurses
Pharmacists
Physicians
HRH POLICY AND STRATEGY
Leadership and Partnership
Policy and Management
Strategy/Plan and Finance
HRH GOVERNANCE
Is there government leadership on health workforce policy and management?
Is there intersectoral and multi-stakeholder partnership to inform health workforce policy and management?
related to population health needs?
informed by data and strategic intelligence?
addressing pre-service education?
addressing geographical distribution and retention?
addressing health workforce performance (e.g. competence, responsiveness and productivity)?
addressing international mobility of health workers; and where relevant the WHO Code of Practice on the International Recruitment of Health Personnel?
Is there a national HRH strategy/plan resulting from the above mechanisms?
For which period?
Does the strategy/plan account for the financial costs and resource requirements to implement it?
= Yes = No = Insufficient data= Partial
Is there evidence that the country is adopting recommended good practices on HRH:
Is existing health workforce policy and human resource management:
?
77
DENSITY OF SHPs (Skilled Health Professional) PER 10 000 POPULATION (Estimated 2010)
SUB-NATIONAL LOW NATIONAL AVERAGE SUB-NATIONAL HIGH
1 Physician
COUNTRY PROFILES
0
20
40
60
80
20152010 2020 2025 2030 20350
120
140
100
80
60
40
20
Thresholds**
34.5/10 00022.8/10 000
59.4/10 000
160
16.3/10 000*
CURRENTDENSITY
TO MEET THRESHOLDS BY 2035, REQUIRES:
220% increase to meet 22.8/10 000 threshold
383% increase to meet 34.5/10 000 threshold
732% increase to meet 59.4/10 000 threshold
3NursesThe ratio of nurses
to physicians is
ABOVEthe OECD average.
2.8Physicians
–Physicians
–Physicians
Population [all (000s); proportion under 15 (%); proportion over 60 (%)]
35.7; 40; 6 (2010)
Average annual rate of population change (%) 2.1 (2010-2015)
Population living in urban areas (%) 33 (2011)Gross national income per capita (PPP int. $) 2120 (2011)Population living on <$1 (PPP int. $) a day (%) 19.80 (2009)Total expenditure on health as a percentage of gross domestic product (%)
8.4 (2011)
General government expenditure on health as a percentage of total expenditure on health (%)
28 (2011)
External resources for health as a percentage of total expenditure on health (%)
4.5 (2011)
Life expectancy at birth (years) [all; female; male] 62; 64; 60 (2011)Total fertility rate (per woman) 4.4 (2010)Neonatal mortality rate (per 1 000 live births) 31 (2011)
Infant mortality rate (per 1 000 live births) 57 (2011)Under-five mortality rate (per 1 000 live births) 86 [66-117] (2011)
Maternal mortality ratio (per 100 000 live births) 730 [380-1400] (2010)Births attended by skilled health personnel (%) –Antenatal care coverage - at least one visit (%) –Antenatal care coverage - at least four visits (%) –
Diphtheria tetanus toxoid and pertussis (DTP3) immunization coverage among 1-year-olds (%)
93 (2011)
Postnatal care visit within two days of birth (%) –
Although there is a National Insurance Scheme for public and formal sector employees, user fees are charged for services, and out-of-pocket payments account for up to 70–80% of total health expenditure. Noncommunicable diseases are the greatest health challenge at present, and there has been limited progress towards achieving the health Millennium Development Goals. The availability of skilled health professionals is below the minimum international thresholds – but few data are available on the accessibility and acceptability dimensions of the workforce. In terms of quality, evidence indicates that, on the whole, mechanisms for accreditation of educational institutions and regulation and licensing of the workforce are in place and functioning. The recently developed plan for human resources for health (2012–2016) aims to address important aspects such as the distribution, retention, quality and performance of the health workforce.
SUDAN
no data
-100 -50 0 50 100
Lower respiratory infections
Diarrheal diseases
Malaria
HIV/AIDS
Preterm birth complications
Iron-deficiency anemia
Low back pain
Neonatal encephalopathy(birth asphyxia and birth trauma)
Protein-energymalnutrition
Sepsis and other infectiousdisorders of the newborn baby
2012-2016
/
*Equal to the total of physicians (N= 10 813; 2008), nursing and midwifery personnel (N= 32 439; 2008) and midwives (N= 14 921; 2006) divided by the 2010 population (N= 35 652 000). Source: (WHO Global Health Observatory - http://apps.who.int/gho/data/view.main)
**See Annex 1 for full explanation on country profile methods and sources.

HRH POLICY AND STRATEGY
SUB-NATIONAL LOW
GEOGRAPHICAL DISTRIBUTION OF PHYSICIANS(density per 10 000 population)
NATIONAL AVERAGE SUB-NATIONAL HIGH
Female physicians
HUMAN RESOURCES FOR HEALTHPOPULATION AND HEALTH
FEASIBILITYDENSITY OF SHPs (Skilled Health Professional)
PER 10 000 POPULATION (Estimated 2010)POPULATION (MILLIONS)
Is there evidence that the country has mechanisms in place to:
TO
AVAILABILITY
ACCEPTABILITY
ACCESSIBILITY
QUALITY
Top 10 causes of morbidity and mortality (DALYs)Communicable, maternal, neonatal, and nutritional InjuriesNon-communicable
Disability-adjusted life years (DALYs) quantify both premature mortality (YLLS) and disability (YLDs) within a population. The top 10 causes of DALYs are ranked from top to bottom in order of the number of DALYs they contribute in 2010. Bars going right show the percent by which DALYs have increased since 1990. Bars going left show the percent by which DALYs have decreased.
Feasibility of achieving thresholds: Most likely Least likelySomewhat likely
Leadership and Partnership
Policy and Management
Strategy/Plan and Finance
HRH GOVERNANCE
Is there government leadership on health workforce policy and management?
Is there intersectoral and multi-stakeholder partnership to inform health workforce policy and management?
related to population health needs?
informed by data and strategic intelligence?
addressing pre-service education?
addressing geographical distribution and retention?
addressing health workforce performance (e.g. competence, responsiveness and productivity)?
addressing international mobility of health workers; and where relevant the WHO Code of Practice on the International Recruitment of Health Personnel?
Is there a national HRH strategy/plan resulting from the above mechanisms?
For which period?
Does the strategy/plan account for the financial costs and resource requirements to implement it?
= Yes = No = Insufficient data= Partial
Is there evidence that the country is adopting recommended good practices on HRH:
Is existing health workforce policy and human resource management:
?
ACCREDIT training institutions for:
Dentists
Midwives
Nurses
Pharmacists
Physicians
REGULATE:
Dentists
Midwives
Nurses
Pharmacists
Physicians
LICENSE/RE-LICENSE:
Dentists
Midwives
Nurses
Pharmacists
Physicians
A UNIVERSAL TRUTH: NO HEALTH WITHOUT A WORKFORCE78
1 Physician
0
30
60
90
20152010 2020 2025 2030 20350
120
140
100
80
60
40
20
Thresholds**
34.5/10 00022.8/10 000
59.4/10 000
160
17.4/10 000*
CURRENTDENSITY
41%
TO MEET THRESHOLDS BY 2035, REQUIRES:
32% increase to meet 22.8/10 000 threshold
99% increase to meet 34.5/10 000 threshold
243% increase to meet 59.4/10 000 threshold
5.1NursesThe ratio of nurses
to physicians is
ABOVEthe OECD average.
10.5Physicians
3Physicians
1.2Physicians
Population [all (000s); proportion under 15 (%); proportion over 60 (%)]
66.4; 21; 13 (2010)
Average annual rate of population change (%) 0.3 (2010-2015)
Population living in urban areas (%) 34 (2011)Gross national income per capita (PPP int. $) 8360 (2011)Population living on <$1 (PPP int. $) a day (%) <2 (2008)Total expenditure on health as a percentage of gross domestic product (%)
4.1 (2011)
General government expenditure on health as a percentage of total expenditure on health (%)
76 (2011)
External resources for health as a percentage of total expenditure on health (%)
0.4 (2011)
Life expectancy at birth (years) [all; female; male] 74; 77; 71 (2011)Total fertility rate (per woman) 1.6 (2010)Neonatal mortality rate (per 1 000 live births) 8 (2011)
Infant mortality rate (per 1 000 live births) 11 (2011)Under-five mortality rate (per 1 000 live births) 12 [8-17] (2011)
Maternal mortality ratio (per 100 000 live births) 48 [33-70] (2010)Births attended by skilled health personnel (%) 99.4 (2009)Antenatal care coverage - at least one visit (%) 99.1 (2009)Antenatal care coverage - at least four visits (%) 79.6 (2009)
Diphtheria tetanus toxoid and pertussis (DTP3) immunization coverage among 1-year-olds (%)
99 (2011)
Postnatal care visit within two days of birth (%) –
Social health insurance mechanisms, the largest of which is the Universal Coverage Scheme, cover about 98% of the population. The benefits package includes inpatient, outpatient, curative and preventive care. Noncommunicable diseases are the greatest causes of DALYs and years of life lost, with the exception of HIV infection, which is the number one cause of mortality and morbidity. Of the dimensions of availability, accessibility, acceptability and quality of the workforce, accessibility is perhaps in greatest need of attention, as disparities are observed in the geographical distribution of health workers. Availability of skilled health professionals is below the thresholds but with a good chance of scaling up before 2035. Evidence indicates that good mechanisms are in place for accrediting, regulating and licensing the health workforce. The strategic plan for human resources for health (2007–2016) includes a focus on addressing the inequitable distribution as well as other measures for scaling up and improving quality and performance.
THAILAND
-120 -80 -40 0 40 80 120
HIV/AIDS
Ischemic heart disease
Road injury
Major depressive disorder
Lower respiratory infections
Liver cancer
Low back pain
Diabetes mellitusChronic obstructivepulmonary disease
Cerebrovasculardisease
/
2007-2016
*Equal to the total of physicians (N= 18 918; 2004), nurses (N= 95 834; 2004) and midwives (N= 870; 2004) divided by the 2010 population (N= 66 402 000). Source: (WHO Global Health Observatory - http://apps.who.int/gho/data/view.main)
**See Annex 1 for full explanation on country profile methods and sources.

GEOGRAPHICAL DISTRIBUTION OF PHYSICIANS(density per 10 000 population)
Female physicians
HUMAN RESOURCES FOR HEALTHPOPULATION AND HEALTH
FEASIBILITYPOPULATION (MILLIONS)
Is there evidence that the country has mechanisms in place to:
TO
AVAILABILITY
ACCEPTABILITY
ACCESSIBILITY
QUALITY
Top 10 causes of morbidity and mortality (DALYs)Communicable, maternal, neonatal, and nutritional InjuriesNon-communicable
Disability-adjusted life years (DALYs) quantify both premature mortality (YLLS) and disability (YLDs) within a population. The top 10 causes of DALYs are ranked from top to bottom in order of the number of DALYs they contribute in 2010. Bars going right show the percent by which DALYs have increased since 1990. Bars going left show the percent by which DALYs have decreased.
Feasibility of achieving thresholds: Most likely Least likelySomewhat likely
ACCREDIT training institutions for:
Dentists
Midwives
Nurses
Pharmacists
Physicians
REGULATE:
Dentists
Midwives
Nurses
Pharmacists
Physicians
LICENSE/RE-LICENSE:
Dentists
Midwives
Nurses
Pharmacists
Physicians
HRH POLICY AND STRATEGY
Leadership and Partnership
Policy and Management
Strategy/Plan and Finance
HRH GOVERNANCE
Is there government leadership on health workforce policy and management?
Is there intersectoral and multi-stakeholder partnership to inform health workforce policy and management?
related to population health needs?
informed by data and strategic intelligence?
addressing pre-service education?
addressing geographical distribution and retention?
addressing health workforce performance (e.g. competence, responsiveness and productivity)?
addressing international mobility of health workers; and where relevant the WHO Code of Practice on the International Recruitment of Health Personnel?
Is there a national HRH strategy/plan resulting from the above mechanisms?
For which period?
Does the strategy/plan account for the financial costs and resource requirements to implement it?
= Yes = No = Insufficient data= Partial
Is there evidence that the country is adopting recommended good practices on HRH:
Is existing health workforce policy and human resource management:
?
79
DENSITY OF SHPs (Skilled Health Professional) PER 10 000 POPULATION (Estimated 2010)
SUB-NATIONAL LOW NATIONAL AVERAGE SUB-NATIONAL HIGH
1 Physician
COUNTRY PROFILES
0
16
32
48
64
80
20152010 2020 2025 2030 20350
120
140
100
80
60
40
20
Thresholds**
34.5/10 00022.8/10 000
59.4/10 000
160
106.1/10 000*
CURRENTDENSITY
44%
TO MEET THRESHOLDS BY 2035, REQUIRES:
0% increase to meet 22.8/10 000 threshold
0% increase to meet 34.5/10 000 threshold
0% increase to meet 59.4/10 000 threshold
1.9Nurses
53.2Physicians
36.5Physicians
28.8Physicians
Population [all (000s); proportion under 15 (%); proportion over 60 (%)]
62.1; 17; 23 (2010)
Average annual rate of population change (%) 0.6 (2010-2015)
Population living in urban areas (%) 80 (2011)Gross national income per capita (PPP int. $) 36010 (2011)Population living on <$1 (PPP int. $) a day (%) –Total expenditure on health as a percentage of gross domestic product (%)
9.3 (2011)
General government expenditure on health as a percentage of total expenditure on health (%)
83 (2011)
External resources for health as a percentage of total expenditure on health (%)
–
Life expectancy at birth (years) [all; female; male] 80; 82; 79 (2011)Total fertility rate (per woman) 1.9 (2010)Neonatal mortality rate (per 1 000 live births) 3 (2011)
Infant mortality rate (per 1 000 live births) 4 (2011)Under-five mortality rate (per 1 000 live births) 5 [5-6] (2011)
Maternal mortality ratio (per 100 000 live births) 12 [10-14] (2010)Births attended by skilled health personnel (%) –Antenatal care coverage - at least one visit (%) –Antenatal care coverage - at least four visits (%) –
Diphtheria tetanus toxoid and pertussis (DTP3) immunization coverage among 1-year-olds (%)
95 (2011)
Postnatal care visit within two days of birth (%) –
England guarantees the right to health care access to all residents through its National Health Service. Public funding is supplemented by growing private medical insurance expenditure, particularly in recent years. Overall, focus on the performance of the health workforce is increasing. Various agencies and bodies such as Health Education England and the Centre for Workforce Intelligence have been set up to improve education, training and planning. Despite these concrete measures to improve the quality of the health workforce, there are still some challenges. The ratio of nurses to physicians is below the OECD average, and the density of physicians also varies across regions. Current financial constraints are creating further workforce challenges, and the passage of the new Health and Social Care Act may have implications for coherent workforce planning. In addition, England has heavily relied on professionals trained overseas to meet service demands for many years. However, in recent years measures have been taken to scale up the domestic production of health workers and move towards self-sufficiency.
UNITED KINGDOM*
-80 -40 0 40 80
Ischemic heart disease
Low back pain
Other musculoskeletal disorders
Neck pain
Trachea, bronchus,and lung cancers
Alzheimer's disease and other dementias
Falls
Major depressive disorder
Chronic obstructive pulmonary disease
Cerebrovascular disease
* the contextual HRH and policy indicators of this country profile refer to England only.
2013-2015
/ The ratio of nurses to physicians is
BELOWthe OECD average (2.8:1).
*Equal to the total of physicians (N= 172 553; 2011), nurses (N= 559 501; 2011) and midwives (N= 31 687; 2011) divided by the 2010 population (N= 62 066 000). Source: (WHO Global Health Observatory - http://apps.who.int/gho/data/view.main)
**See Annex 1 for full explanation on country profile methods and sources.

HRH POLICY AND STRATEGY
SUB-NATIONAL LOW
GEOGRAPHICAL DISTRIBUTION OF PHYSICIANS(density per 10 000 population)
NATIONAL AVERAGE SUB-NATIONAL HIGH
Female physicians
HUMAN RESOURCES FOR HEALTHPOPULATION AND HEALTH
FEASIBILITYDENSITY OF SHPs (Skilled Health Professional)
PER 10 000 POPULATION (Estimated 2010)POPULATION (MILLIONS)
Is there evidence that the country has mechanisms in place to:
TO
AVAILABILITY
ACCEPTABILITY
ACCESSIBILITY
QUALITY
Top 10 causes of morbidity and mortality (DALYs)Communicable, maternal, neonatal, and nutritional InjuriesNon-communicable
Disability-adjusted life years (DALYs) quantify both premature mortality (YLLS) and disability (YLDs) within a population. The top 10 causes of DALYs are ranked from top to bottom in order of the number of DALYs they contribute in 2010. Bars going right show the percent by which DALYs have increased since 1990. Bars going left show the percent by which DALYs have decreased.
Feasibility of achieving thresholds: Most likely Least likelySomewhat likely
Leadership and Partnership
Policy and Management
Strategy/Plan and Finance
HRH GOVERNANCE
Is there government leadership on health workforce policy and management?
Is there intersectoral and multi-stakeholder partnership to inform health workforce policy and management?
related to population health needs?
informed by data and strategic intelligence?
addressing pre-service education?
addressing geographical distribution and retention?
addressing health workforce performance (e.g. competence, responsiveness and productivity)?
addressing international mobility of health workers; and where relevant the WHO Code of Practice on the International Recruitment of Health Personnel?
Is there a national HRH strategy/plan resulting from the above mechanisms?
For which period?
Does the strategy/plan account for the financial costs and resource requirements to implement it?
= Yes = No = Insufficient data= Partial
Is there evidence that the country is adopting recommended good practices on HRH:
Is existing health workforce policy and human resource management:
?
ACCREDIT training institutions for:
Dentists
Midwives
Nurses
Pharmacists
Physicians
REGULATE:
Dentists
Midwives
Nurses
Pharmacists
Physicians
LICENSE/RE-LICENSE:
Dentists
Midwives
Nurses
Pharmacists
Physicians
A UNIVERSAL TRUTH: NO HEALTH WITHOUT A WORKFORCE80
1 Physician
0
80
160
240
320
400
20152010 2020 2025 2030 20350
120
140
100
80
60
40
20
Thresholds**
34.5/10 00022.8/10 000
59.4/10 000
160
117.7/10 000*
CURRENTDENSITY
30%
TO MEET THRESHOLDS BY 2035, REQUIRES:
0% increase to meet 22.8/10 000 threshold
0% increase to meet 34.5/10 000 threshold
0% increase to meet 59.4/10 000 threshold
3.9NursesThe ratio of nurses
to physicians is
ABOVEthe OECD average.
24.2Physicians
–Physicians
–Physicians
Population [all (000s); proportion under 15 (%); proportion over 60 (%)]
312.2; 20; 18 (2010)
Average annual rate of population change (%) 0.8 (2010-2015)
Population living in urban areas (%) 82 (2011)Gross national income per capita (PPP int. $) 48820 (2011)Population living on <$1 (PPP int. $) a day (%) –Total expenditure on health as a percentage of gross domestic product (%)
17.9 (2011)
General government expenditure on health as a percentage of total expenditure on health (%)
46 (2011)
External resources for health as a percentage of total expenditure on health (%)
–
Life expectancy at birth (years) [all; female; male] 79; 81; 76 (2011)Total fertility rate (per woman) 2.1 (2010)Neonatal mortality rate (per 1 000 live births) 4 (2011)
Infant mortality rate (per 1 000 live births) 6 (2011)Under-five mortality rate (per 1 000 live births) 8 [7-8] (2011)
Maternal mortality ratio (per 100 000 live births) 21 [18-23] (2010)Births attended by skilled health personnel (%) 99.4 (2010)Antenatal care coverage - at least one visit (%) –Antenatal care coverage - at least four visits (%) 97.4 (2009)
Diphtheria tetanus toxoid and pertussis (DTP3) immunization coverage among 1-year-olds (%)
94 (2011)
Postnatal care visit within two days of birth (%) –
In 2011, private expenditure comprised 54% of total health expenditure, of which about 21% was out of pocket. About 84% of the population has some insurance coverage, of whom 66% through their employer or personally, and the other 22% under various federal programmes. These are administered by states that are required to offer mandatory benefits; they can add other benefits such as dental services and prescription drugs. They can charge premiums and copayments. Medicare, the programme for people older than 65 years, covers about 50% of the costs of visits and surgeries, and supplies, but not long-term care or dental care. There is a 3.9 nurses-to-physicians ratio and a 24.2 per 10 000 population density of physicians with major variation between and within the 50 states and federal district. There are programmes to attract health workers to underserved areas. Shortages are expected to be high for general practitioners and for nurses, which may continue to stimulate recruitment abroad. Regulation of professional practice is state-based and therefore varies.
UNITED STATES OF AMERICA
-100 -50 0 50 100
Ischemic heart disease
Low back pain
Trachea, bronchus, and lung cancers
Major depressive disorder
Cerebrovascular disease
Diabetes mellitus
Road injury
Drug use disorders
Other musculoskeletaldisorders
Chronic obstructivepulmonary disease
? ? ?
/
2010-2015
?
*Equal to the total of physicians (N= 749 566; 2009), licensed practical nurses (N= 510 000; 2005) and registered nurses (N= 2 417 000; 2005) divided by the 2010 population (N= 312 247 000). Source: (WHO Global Health Observatory - http://apps.who.int/gho/data/view.main)
**See Annex 1 for full explanation on country profile methods and sources.

GEOGRAPHICAL DISTRIBUTION OF PHYSICIANS(density per 10 000 population)
Female physicians
HUMAN RESOURCES FOR HEALTHPOPULATION AND HEALTH
FEASIBILITYPOPULATION (MILLIONS)
Is there evidence that the country has mechanisms in place to:
TO
AVAILABILITY
ACCEPTABILITY
ACCESSIBILITY
QUALITY
Top 10 causes of morbidity and mortality (DALYs)Communicable, maternal, neonatal, and nutritional InjuriesNon-communicable
Disability-adjusted life years (DALYs) quantify both premature mortality (YLLS) and disability (YLDs) within a population. The top 10 causes of DALYs are ranked from top to bottom in order of the number of DALYs they contribute in 2010. Bars going right show the percent by which DALYs have increased since 1990. Bars going left show the percent by which DALYs have decreased.
Feasibility of achieving thresholds: Most likely Least likelySomewhat likely
ACCREDIT training institutions for:
Dentists
Midwives
Nurses
Pharmacists
Physicians
REGULATE:
Dentists
Midwives
Nurses
Pharmacists
Physicians
LICENSE/RE-LICENSE:
Dentists
Midwives
Nurses
Pharmacists
Physicians
HRH POLICY AND STRATEGY
Leadership and Partnership
Policy and Management
Strategy/Plan and Finance
HRH GOVERNANCE
Is there government leadership on health workforce policy and management?
Is there intersectoral and multi-stakeholder partnership to inform health workforce policy and management?
related to population health needs?
informed by data and strategic intelligence?
addressing pre-service education?
addressing geographical distribution and retention?
addressing health workforce performance (e.g. competence, responsiveness and productivity)?
addressing international mobility of health workers; and where relevant the WHO Code of Practice on the International Recruitment of Health Personnel?
Is there a national HRH strategy/plan resulting from the above mechanisms?
For which period?
Does the strategy/plan account for the financial costs and resource requirements to implement it?
= Yes = No = Insufficient data= Partial
Is there evidence that the country is adopting recommended good practices on HRH:
Is existing health workforce policy and human resource management:
?
81
DENSITY OF SHPs (Skilled Health Professional) PER 10 000 POPULATION (Estimated 2010)
SUB-NATIONAL LOW NATIONAL AVERAGE SUB-NATIONAL HIGH
1 Physician
COUNTRY PROFILES
25%
TO MEET THRESHOLDS BY 2035, REQUIRES:
288% increase to meet 22.8/10 000 threshold
488% increase to meet 34.5/10 000 threshold
912% increase to meet 59.4/10 000 threshold 0
8
16
24
32
40
20152010 2020 2025 2030 20350
120
140
100
80
60
40
20
Thresholds**
34.5/10 00022.8/10 000
59.4/10 000
160
9.4/10 000*
CURRENTDENSITY
2.6NursesThe ratio of nurses
to physicians is
BELOWthe OECD average.
5.5Physicians
2.0Physicians
0.4Physicians
Population [all (000s); proportion under 15 (%); proportion over 60 (%)]
22.8; 44; 4 (2010)
Average annual rate of population change (%) 2.3 (2010-2015)
Population living in urban areas (%) 32 (2011)Gross national income per capita (PPP int. $) 2170 (2011)Population living on <$1 (PPP int. $) a day (%) –Total expenditure on health as a percentage of gross domestic product (%)
5.5 (2011)
General government expenditure on health as a percentage of total expenditure on health (%)
21 (2011)
External resources for health as a percentage of total expenditure on health (%)
4.2 (2011)
Life expectancy at birth (years) [all; female; male] 64; 66; 63 (2011)Total fertility rate (per woman) 5.2 (2010)Neonatal mortality rate (per 1 000 live births) 32 (2011)
Infant mortality rate (per 1 000 live births) 57 (2011)Under-five mortality rate (per 1 000 live births) 77 [58-92] (2011)
Maternal mortality ratio (per 100 000 live births) 200 [110-370] (2010)Births attended by skilled health personnel (%) 35.7 (2006)Antenatal care coverage - at least one visit (%) 47 (2006)Antenatal care coverage - at least four visits (%) –
Diphtheria tetanus toxoid and pertussis (DTP3) immunization coverage among 1-year-olds (%)
81 (2011)
Postnatal care visit within two days of birth (%) –
About half of the population is estimated to have access to basic health services, and user fees are common. Although there are exemption policies for poor people, evidence indicates that these may not be properly functioning in practice. The burden of disease relates to a mix of communicable and noncommunicable causes. Some progress has been made towards meeting Millennium Development Goal 5, but child mortality is still a concern. There are challenges across all four domains of the availability, accessibility, acceptability and quality of the health workforce. The density of skilled health professionals is low and unlikely to meet indicative thresholds by 2035; inequities in geographical distribution and accessibility persist. The percentage of women doctors is 25%. Very limited information is available on the quality control mechanisms of the workforce. Governance and coordination for human resources for health require strengthening to effectively tackle these challenges.
YEMEN
-100 -50 0 50 100
Lower respiratory infections
Diarrheal diseases
Congenital anomalies
Ischemic heart disease
Iron-deficiency anemia
Major depressive disorder
Road injury
Malaria
Preterm birthcomplications
Cerebrovasculardisease
?
?
?
? /
*Equal to the total of physicians (N= 4 834; 2010), nurse technicians (N= 11 444; 2010), nurses (N= 1 003; 2010) and midwives (N= 4 143; 2010) divided by the 2010 population (N= 22 763 000). Source: (WHO Global Health Observatory - http://apps.who.int/gho/data/view.main)
**See Annex 1 for full explanation on country profile methods and sources.
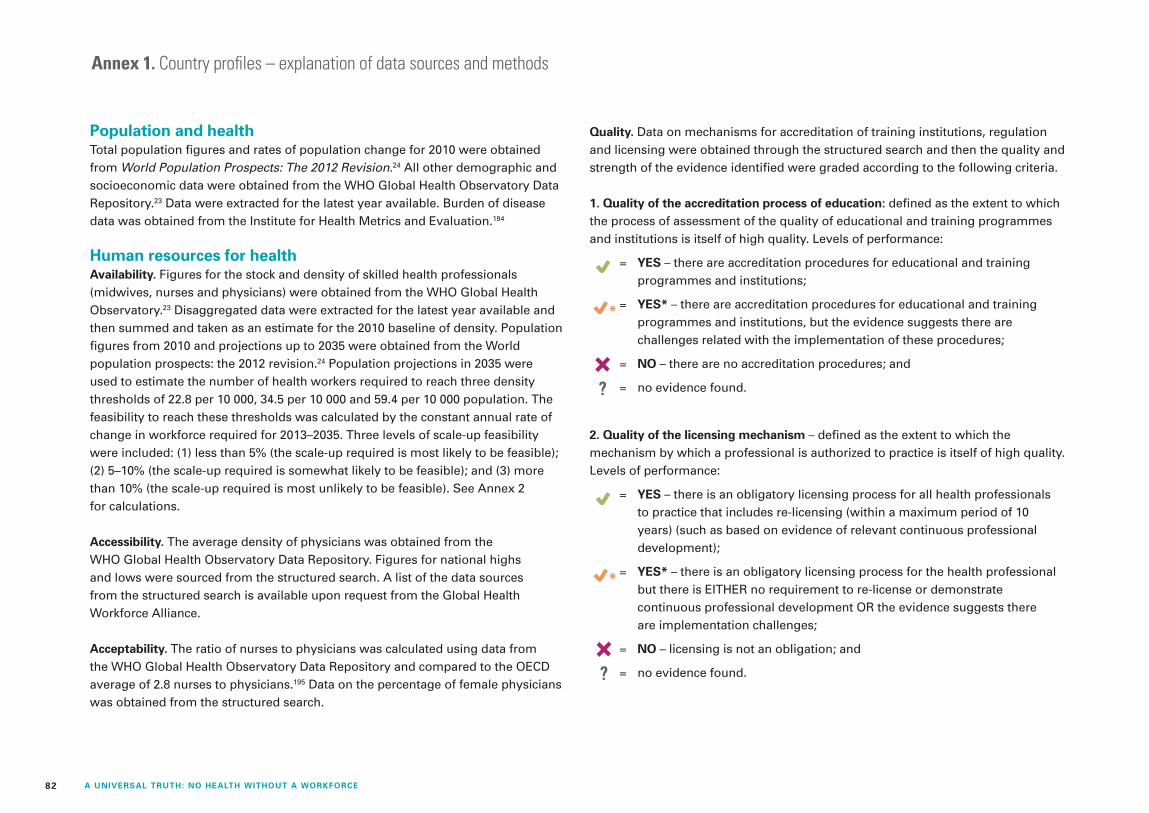
82 A UNIVERSAL TRUTH: NO HEALTH WITHOUT A WORKFORCE
Annex 1. Country profiles – explanation of data sources and methods
Population and healthTotal population figures and rates of population change for 2010 were obtained from World Population Prospects: The 2012 Revision.24 All other demographic and socioeconomic data were obtained from the WHO Global Health Observatory Data Repository.23 Data were extracted for the latest year available. Burden of disease data was obtained from the Institute for Health Metrics and Evaluation.194
Human resources for healthAvailability. Figures for the stock and density of skilled health professionals (midwives, nurses and physicians) were obtained from the WHO Global Health Observatory.23 Disaggregated data were extracted for the latest year available and then summed and taken as an estimate for the 2010 baseline of density. Population figures from 2010 and projections up to 2035 were obtained from the World population prospects: the 2012 revision.24 Population projections in 2035 were used to estimate the number of health workers required to reach three density thresholds of 22.8 per 10 000, 34.5 per 10 000 and 59.4 per 10 000 population. The feasibility to reach these thresholds was calculated by the constant annual rate of change in workforce required for 2013–2035. Three levels of scale-up feasibility were included: (1) less than 5% (the scale-up required is most likely to be feasible); (2) 5–10% (the scale-up required is somewhat likely to be feasible); and (3) more than 10% (the scale-up required is most unlikely to be feasible). See Annex 2 for calculations.
Accessibility. The average density of physicians was obtained from the WHO Global Health Observatory Data Repository. Figures for national highs and lows were sourced from the structured search. A list of the data sources from the structured search is available upon request from the Global Health Workforce Alliance.
Acceptability. The ratio of nurses to physicians was calculated using data from the WHO Global Health Observatory Data Repository and compared to the OECD average of 2.8 nurses to physicians.195 Data on the percentage of female physicians was obtained from the structured search.
Quality. Data on mechanisms for accreditation of training institutions, regulation and licensing were obtained through the structured search and then the quality and strength of the evidence identified were graded according to the following criteria.
1. Quality of the accreditation process of education: defined as the extent to which the process of assessment of the quality of educational and training programmes and institutions is itself of high quality. Levels of performance:
= YES – there are accreditation procedures for educational and training programmes and institutions;
= YES* – there are accreditation procedures for educational and training programmes and institutions, but the evidence suggests there are challenges related with the implementation of these procedures;
= NO – there are no accreditation procedures; and
= no evidence found.
2. Quality of the licensing mechanism – defined as the extent to which the mechanism by which a professional is authorized to practice is itself of high quality. Levels of performance:
= YES – there is an obligatory licensing process for all health professionals to practice that includes re-licensing (within a maximum period of 10 years) (such as based on evidence of relevant continuous professional development);
= YES* – there is an obligatory licensing process for the health professional but there is EITHER no requirement to re-license or demonstrate continuous professional development OR the evidence suggests there are implementation challenges;
= NO – licensing is not an obligation; and
= no evidence found.
?
?

83ANNEX 1: COUNTRY PROFILES – EXPLANATION OF DATA SOURCE AND METHODS
23 United Nations Department of Economic and Social Affairs. World population prospects: the 2012 revision. New York, United Nations, 2012 (http://esa.un.org/unpd/wpp/Excel-Data/population.htm, accessed 14 October 2013).
24 Global Health Observatory Data Repository [online database]. Geneva, World Health Organization, 2013 (http://apps.who.int/gho/data/view.main, accessed 14 October 2013).
194 GBD insight [online database]. Seattle, Institute for Health Metrics and Evaluation, 2013 (http://www.healthmetricsandevaluation.org/gbd/visualizations/gbd-insight, accessed 14 October 2013).
195 OECD/WHO. Health at a Glance: Asia/Pacific 2012. Paris, Organisation for Economic Co-operation and Development, 2012 doi:10.1787/9789264183902-en.
3. Quality of the mechanism of regulation of professional practice – defined as the extent to which the mechanism by which the quality of professional practice is assessed is itself of high quality. Levels of performance:
= YES – there is a regulatory body of professional practice with competencies in (1) surveillance of practice, (2) code of ethics and (3) exercise of discipline;
= YES* – there is a regulatory body of professional practice with competencies in at least one of the points above;
= NO – no regulatory body of professional practice; and
= ? – no evidence found.
Policy and strategy on human resources for healthData on the policy and strategy environment for human resources for health were obtained through the structured search and then the quality and strength of the evidence identified were graded accorded to the following criteria:
= YES – we have identified evidence through the structured search;
= YES* – we have identified evidence through the structured search AND additional evidence of implementation challenges;
= NO – we have identified evidence through the structured search that the current process is considered ineffective; and
= we have not identified evidence either way through the structured search.
NOTE: The grading criteria of YES and YES* provides an indicative measure of a country’s policy and strategy environment and should be interpreted as such. Neither YES nor YES* measure the current implementation strength (such as the quantity and quality of the policy/strategy as implemented since its adoption). Rather the identified evidence allows an objective assessment of whether policy is, and policy-makers are, responsive to the issue under observation.
In the countries where there is additional evidence, through regular monitoring and evaluation or specific research, and this is available in the public domain (and captured in the structured search), there is a higher likelihood that implementation challenges are reported and therefore informing the grading exercise. Countries that have not benefited from monitoring, evaluation and research to produce additional evidence may therefore be graded as YES, when in reality implementation may be experiencing considerable challenges.
For the question, “Is there a published human resources for health strategy or plan resulting from these mechanisms”, the following criteria were used:
= YES – a human resources for health plan or strategy has been identified through the structured search;
= YES* – no specific human resources for health plan or strategy has been identified through the structured search, but the national health policy or plan includes specific detail and/or complementary programmes on human resources for health; and
= from the structured search, we have not been able to identify either the human resources for health plan or a detailed section in national health or policy plan relating to human resources for health.
?
?
?
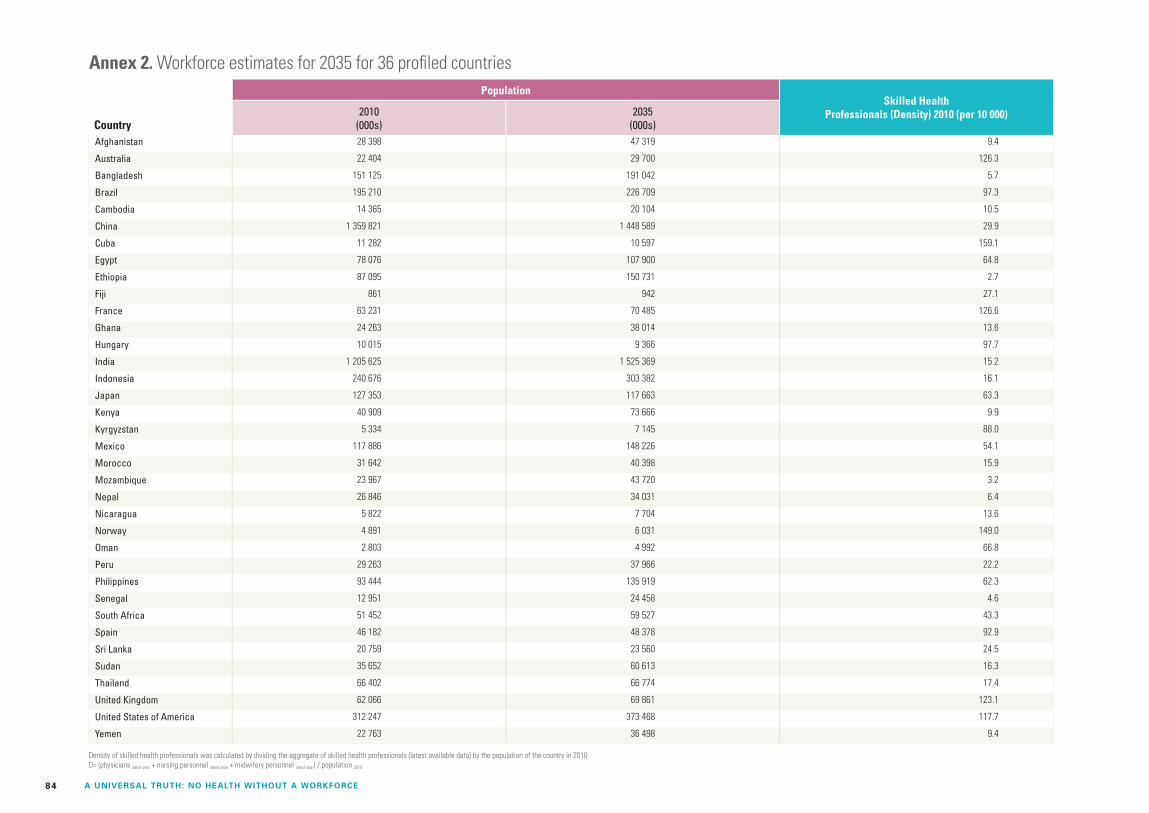
84 A UNIVERSAL TRUTH: NO HEALTH WITHOUT A WORKFORCE
Annex 2. Workforce estimates for 2035 for 36 profiled countriesPopulation
Skilled Health Professionals (Density) 2010 (per 10 000)
Country2010
(000s)2035
(000s) Afghanistan 28 398 47 319 9.4
Australia 22 404 29 700 126.3
Bangladesh 151 125 191 042 5.7
Brazil 195 210 226 709 97.3
Cambodia 14 365 20 104 10.5
China 1 359 821 1 448 589 29.9
Cuba 11 282 10 597 159.1
Egypt 78 076 107 900 64.8
Ethiopia 87 095 150 731 2.7
Fiji 861 942 27.1
France 63 231 70 485 126.6
Ghana 24 263 38 014 13.6
Hungary 10 015 9 366 97.7
India 1 205 625 1 525 369 15.2
Indonesia 240 676 303 382 16.1
Japan 127 353 117 663 63.3
Kenya 40 909 73 666 9.9
Kyrgyzstan 5 334 7 145 88.0
Mexico 117 886 148 226 54.1
Morocco 31 642 40 398 15.9
Mozambique 23 967 43 720 3.2
Nepal 26 846 34 031 6.4
Nicaragua 5 822 7 704 13.6
Norway 4 891 6 031 149.0
Oman 2 803 4 992 66.8
Peru 29 263 37 966 22.2
Philippines 93 444 135 919 62.3
Senegal 12 951 24 458 4.6
South Africa 51 452 59 527 43.3
Spain 46 182 48 378 92.9
Sri Lanka 20 759 23 560 24.5
Sudan 35 652 60 613 16.3
Thailand 66 402 66 774 17.4
United Kingdom 62 066 69 861 123.1
United States of America 312 247 373 468 117.7
Yemen 22 763 36 498 9.4
Density of skilled health professionals was calculated by dividing the aggregate of skilled health professionals (latest available data) by the population of the country in 2010 D= (physicians latest year + nursing personnel latest year + midwifery personnel latest year) / population 2010

85ANNEX 2: WORKFORCE ESTIMATE FOR 2035 FOR 36 PROFILED COUNTRIES
% change in workforce required to reach, by 2035 Constant annual rate of change in workforce required (2013-2035) to meet
Country 22.8
threshold 34.5
threshold59.4
threshold 22.8
threshold34.5
threshold59.4
threshold Afghanistan 1 036 1 619 2 860 47% 74% 130%
Australia 0 0 0 no need no need no need
Bangladesh 404 662 1 213 18% 30% 55%
Brazil 0 0 0 no need no need no need
Cambodia 203 358 689 9% 16% 31%
China 0 24 114 no need 1% 5%
Cuba 0 0 0 no need no need no need
Egypt 0 0 27 no need no need 1%
Ethiopia 1 354 2 100 3 687 62% 95% 168%
Fiji 0 40 140 no need 2% 6%
France 0 0 0 no need no need no need
Ghana 221 386 736 10% 18% 33%
Hungary 0 0 0 no need no need no need
India 83 176 376 4% 8% 17%
Indonesia 78 170 364 4% 8% 17%
Japan 0 0 0 no need no need no need
Kenya 315 528 981 14% 24% 45%
Kyrgyzstan 0 0 0 no need no need no need
Mexico 0 0 38 no need no need 2%
Morocco 83 177 376 4% 8% 17%
Mozambique 1 198 1 864 3 282 54% 85% 149%
Nepal 351 582 1 075 16% 26% 49%
Nicaragua 122 236 479 6% 11% 22%
Norway 0 0 0 no need no need no need
Oman 0 0 58 no need no need 3%
Peru 33 102 247 2% 5% 11%
Philippines 0 0 39 no need no need 2%
Senegal 830 1 307 2 323 38% 59% 106%
South Africa 0 0 59 no need no need 3%
Spain 0 0 0 no need no need no need
Sri Lanka 5 60 175 0% 3% 8%
Sudan 220 383 732 10% 17% 33%
Thailand 32 99 243 1% 5% 11%
United Kingdom 0 0 0 no need no need no need
United States of America 0 0 0 no need no need no need
Yemen 288 488 912 13% 22% 41%

86 A UNIVERSAL TRUTH: NO HEALTH WITHOUT A WORKFORCE
1 United Nations General Assembly. Res/55/2: United Nations Millennium Declaration. New York, United Nations, 2000 (http://www.un.org/millennium/declaration/ares552e.pdf, accessed 14 October 2013).
2 United Nations General Assembly. Global health and foreign policy. 67th session, Agenda item 123. A/67/L.36. New York, United Nations, 2012; 63051:1–6.
3 Social Protection Floors Recommendation (202), 2012: National Floors of Social Protection. Geneva, International Labour Office, 2012.
4 High Level Task Force ICPD. Health priorities post 2015: What is the priority health agenda for the 15 years after 2015? New York, World We Want 2015, 2013 (http://www.worldwewant2015.org/node/298824, accessed 14 October 2013).
5 Health in the post-2015 devel-opment agenda: report of the Global Thematic Consultation on Health. New York, World We Want 2015, 2013 (http://www.worldwe-want2015.org/health, accessed 14 October 2013).
6 UNAIDS, UNICEF, UNFPA and WHO. Health in the post-2015 UN development agenda: thematic think piece. New York, United Nations, 2012.
7 Abouzahr C. Health in the post-2015 development agenda. Identifying goals, indicators and targets: key questions. New York, World We Want 2015, 2012 (http://www.world-wewant2015.org/node/300588, accessed 14 October 2013).
8 Kenny C. A UN declaration on the post-2015 development agenda. Washington, DC, Center for Global Development, 2013 (http://interna-tional.cgdev.org/sites/default/files/un-declaration-post-2015-develop-ment-agenda.pdf, accessed 14 October 2013).
9 O’Connell T, Rasanathan K, Chopra M. What does universal health coverage mean? Lancet, 2013, 6736:13–15.
10 Joint Learning Initiative. Human resources for health: overcoming the crisis. Cambridge, MA, President and Fellows of Harvard College, 2004 (doi:10.1016/S0140-6736(04)17482-5).
11 Chen L et al. Human resources for health: overcoming the crisis. Lancet, 2004, 364:1984–1990.
12 The World Health Report 2006 – Working together for health. Geneva, World Health Organization, 2006.
13 Global Health Workforce Alliance and WHO. The Kampala Declaration and agenda for global action. Geneva, World Health Organization, 2008 (http://www.who.int/work-forcealliance/Kampala Declaration and Agenda web file. FINAL.pdf, accessed 14 October 2013).
14 Reviewing progress, renewing com-mitment. Progress report on the Kampala Declaration and Agenda for Global Action. Geneva, Global Health Workforce Alliance, 2011.
15 World Health Assembly. WHO Global Code of Practice on the International Recruitment of Health Personnel. Geneva, World Health Organization, 2010 (http://apps.who.int/gb/ebwha/pdf_files/WHA63-REC1/WHA63_REC1-P2-en.pdf, accessed 14 October 2013).
16 Global Health Workforce Alliance, WHO, Prince Mahidol Award Conference, JICA. From Kampala to Bangkok: reviewing progress, renewing commitments. Outcome Statement of the Second Global Forum on Human Resources for Health. Bangkok, 27–29 January 2011. Geneva, World Health Organization, 2011 (http://www.who.int/workforcealliance/forum/2011/Outcomestatement.pdf, accessed 14 October 2013).
17 The health workforce: advances in responding to shortages and migration, and in preparing for emerging needs. Report by the Secretariat (A66/25). Geneva, World Health Organization, 2013.
18 Universal health coverage: report by the Secretariat (EB132/22). Geneva, World Health Organization, 2013.
19 Global Health Workforce Alliance. Strategy 2013–2016: advancing the health workforce agenda within universal health coverage. Geneva, World Health Organization, 2012.
20 Dal Poz MR et al., eds. Handbook on monitoring and evaluation of human resources for health: with special applications for low- and middle-income countries. Geneva, World Health Organization, 2009.
21 Handbook for measurement and monitoring indicators of the regional goals for human resources for health. Washington, DC, Pan American Health Organization.
22 Campbell J, Cometto G, Sheikh MR. Human resources for health, universal health coverage and healthy life expectancy: framing the contemporary agenda for HRH. Geneva, Global Health Workforce Alliance, 2013.
23 Global Health Observatory Data Repository [online database]. Geneva, World Health Organization, 2013 (http://apps.who.int/gho/data/view.main, accessed 14 October 2013).
24 United Nations Department of Economic and Social Affairs. World population prospects: the 2012 revision. New York, United Nations, 2012 (http://esa.un.org/unpd/wpp/Excel-Data/population.htm, accessed 14 October 2013).
25 CapacityPlus. Washington, DC, HRH Global Resource Center, 2013 (http://www.hrhresourcecenter.org/taxonomy_menu/2, accessed 14 October 2013).
26 HNP Discussion Paper Series. Washington, DC, World Bank, 2013 (http://web.worldbank.org/WBSITE/EXTERNAL/TOPICS EXTHEALTHNUTRITION ANDPOPULATION/0,,content MDK:20131121~menuPK:578586~ pagePK:148956~piK:216618~theSitePK:282511,00.html, accessed 14 October 2013).
27 HRH country web profiles [online database]. Geneva, World Health Organization, 2013 (http://www.who.int/workforcealliance/coun-tries/countryprofiles/en/index.html, accessed 14 October 2013).
28 WHO, ICM, FIGO. Making preg-nancy safer: the critical role of the skilled attendant. A joint statement by WHO, ICM and FIGO. Geneva, World Health Organization, 2004.
29 Dados estatísticos 2000–2012. Lisbon, Nursing Council Portugal, 2013.
30 ICM international definition of the midwife. The Hague, International Confederation of Midwives, 2011.
31 Adegoke A et al. Skilled birth atten-dants: who is who? A descriptive study of definitions and roles from nine sub Saharan African countries. PloS One, 2012, 7:e40220.
32 Utz B et al. Definitions and roles of a skilled birth attendant: a mapping exercise from four South-Asian countries. Acta Obstetricia et Gynecologica Scandinavica, 2013, 92:1063–1069.
33 van den Broek A et al. Policies and practices of countries that are expe-riencing a crisis in human resources for health: tracking survey. Human Resources for Health Observer, 2010, 6 (http://apps.who.int/iris/bitstream/10665/44480/1/ 9789241500821_eng.pdf, accessed 14 October 2013).
34 Amouzou A et al. Measuring the strength of implementation of community case management of childhood illness within the Catalytic Initiative to Save a Million Lives. Unpublished, 2011.
35 Schellenberg JA, Bobrova N, Avan BI. Measuring implementation strength: literature review draft report 2012. London, London School of Hygiene and Tropical Medicine, 2012.
36 Kaplan AD et al. Human resource governance: what does governance mean for the health workforce in low- and middle-income countries? Human Resources for Health, 2013, 11:6.
37 Questions and answers on universal health coverage …and some more comments and open questions. Basle, Medicus Mundi International, 2013.
38 Giedion U, Alfonso EA, Díaz Y. The impact of universal coverage schemes in the developing world: a review of the existing evidence. Washington, DC, World Bank, 2013 (UNICO Studies Series 2013; http://siteresources.worldbank. org/HEALTHNUTRITIONAND POPULATION/Images/IMPACT ofuniversal health coverageSchem-esinDevelopingCountries-ARe-viewofExistingEvidence.pdf, accessed 14 October 2013).
39 Ahoobim O et al. The new global health agenda: universal health coverage. New York, Council on Foreign Relations, 2012.
40 Shimazaki K. The path to universal health coverage. Tokyo, Japan International Cooperation Agency, 2013.
41 Ooms G et al. Universal health coverage anchored in the right to health. Bulletin of the World Health Organization, 2013, 91:2–2A.
42 Latko B et al. The growing move-ment for universal health coverage. Lancet, 2011, 377:2161–2163.
43 The World Health Report 2010 – Health systems financing: the path to universal coverage. Geneva, World Health Organization, 2010 (http://whqlibdoc.who.int/whr/2010/9789241564021_eng.pdf, accessed 14 October 2013).
References

87REFERENCES
44 McKee M et al. Universal health coverage: a quest for all countries but under threat in some. Value in Health, 2013, 16:S39–S45.
45 Horton R. Offline: the advantages of universal health. Lancet, 2012, 380:1632.
46 Forum on Universal Health Coverage. Mexico City Political Declaration on Universal Health Coverage. Sustaining universal health coverage: sharing experi-ences and promoting progress. Geneva, World Health Organization, 2012.
47 Xu K, Saksena P, Evans DB. Health financing and access to effective interventions. World health report (2010) background paper, 8. Geneva, World Health Organization, 2010.
48 Kigali Ministerial Statement on Universal Health Coverage and Long Term Harmonization of Social Health Protection in the East African Community. Kigali, East African Community, 2012.
49 Moreno-Serra R, Smith PC. Does progress towards universal health coverage improve population health? Lancet, 2012, 380:917–923.
50 Shelton JD. Ensuring health in universal health coverage. Nature, 2013, 493:453.
51 Savedoff WD et al. Political and economic aspects of the transition to universal health coverage. Lancet, 2012, 380:924–932.
52 Rodin J, de Ferranti D. Universal health coverage: the third global health transition? Lancet, 2012, 380:861–862.
53 Vega J. Universal health coverage: the post-2015 development agenda. Lancet, 2013, 381:179–180.
54 Cattaneo A et al. The seven sins and the seven virtues of universal health coverage. 2013 (http://getinvolvedinglobalhealth.blogspot.com.es/2013/06/the-seven-sins-and-seven-virtues-of.html, accessed 14 October 2013).
55 The world health report 2013 – Research for universal health coverage. Geneva, World Health Organization, 2013 (http://apps.who.int/iris/bitstream/10665/85761/2/ 9789240690837_eng.pdf, accessed 14 October 2013).
56 Evans DB et al. Measuring progress towards universal coverage. Geneva, World Health Organization, 2012.
57 World Health Assembly. WHA 58.33. Sustainable health financing, universal coverage and social health. Geneva, World Health Organization, 2005 (http://apps.who.int/iris/bitstream/10665/20383/1/WHA58_33-en.pdf, accessed 14 October 2013).
58 World Health Assembly. WHA 64.9. Sustainable health financing structures and universal coverage. Geneva, World Health Organization, 2011 (http://apps.who.int/gb/ebwha/pdf_files/WHA64-REC1/A64_REC1-en.pdf#page=2, accessed 14 October 2013).
59 Chan M. Universal coverage is the ultimate expression of fairness. Address to the Sixty-fifth World Health Assembly. Geneva, World Health Organization, 2012 (http://www.who.int/dg/speeches/2012/wha_20120523/en/index.html#, accessed 14 October 2013).
60 Tanahashi T. Health service cov-erage and its evaluation. Bulletin of the World Health Organization, 1978, 56:295–303.
61 Shengelia B et al. Access, utiliza-tion, quality, and effective coverage: an integrated conceptual frame-work and measurement strategy. Social Science and Medicine, 2005, 61:97–109.
62 Victora CG et al. How changes in coverage affect equity in maternal and child health interventions in 35 Countdown to 2015 countries: an analysis of national surveys. Lancet, 2012, 6736:1–8.
63 Chopra M et al. Equity in child survival, health and nutrition. 1. Strategies to improve health cov-erage and narrow the equity gap in child survival, health, and nutrition. Lancet, 2012, 380:1331–1340.
64 Bhutta ZA, Reddy S. Achieving equity in global health: so near and yet so far. Journal of the American Medical Association, 2012, 307:2035–2036.
65 Closing the health equity gap: policy options and opportunities for action. Geneva, World Health Organization, 2013.
66 Resilience, equity, and opportunity: the World Bank 2012–2022 social protection and labour strategy. Washington, DC, World Bank, 2012.
67 Gwatkin DR, Ergo A. Universal health coverage: friend or foe of health equity? Lancet, 2011, 377:2160–2161.
68 Glassman A, Chalkidou K. Priority-setting in health: building institutions for smarter public spending. Washington, DC, Center for Global Development, 2012.
69 Future health markets : a meeting statement from Bellagio. Baltimore, Future Health Systems, 2012.
70 World Economic Forum and McKinsey & Company. Sustainable health systems: visions, strat-egies, critical uncertainties and scenarios. Geneva, World Economic Forum, 2013 (http://www3.weforum.org/docs/WEF_SustainableHealthSystems_Report_2013.pdf, accessed 14 October 2013).
71 Balabanova D et al. Good health at low cost 25 years on: lessons for the future of health systems strengthening. Lancet, 2013, 6736:1–16.
72 State of maternity services report 2012. London, Royal College of Midwives, 2013.
73 Fortney JC et al. A re-conceptual-ization of access for 21st century healthcare. Journal of General Internal Medicine, 2011, 26(Suppl 2):639–647.
74 Carter M et al. 2020 vision for a high-quality, high-value maternity care system. Women’s Health Issues, 2010, 20:S7–S17.
75 Dussault G. Assessing future health workforce needs. Copenhagen, WHO Regional Office for Europe, 2010.
76 Buchan J, Seccombe I. A decisive decade – mapping the future NHS workforce. Edinburgh, Royal College of Nursing, 2011.
77 Takata H et al. The current shortage and future surplus of doctors: a projection of the future growth of the Japanese medical workforce. Human Resources for Health, 2011, 9:14.
78 Buchan J. Using scenarios to assess the future supply of NHS nurses in England. Human Resources for Health, 2012, 10:16.
79 Ono T, Lafortune G, Schoenstein M. Health workforce planning in OECD countries: a review of 26 projection models from 18 countries. Paris, OECD, 2013 (http://www.oecd-ilibrary.org/docserver/download/5k44t787zcwb.pdf?expires=1372852424&id=id&accname=guest&checksum=BF154C76769B-3743407416DA862090BF, accessed 14 October 2013).
80 Matthews Z, Channon A. Will there be enough people to care ? Notes on workforce implications of demographic change 2005–2050. Geneva, World Health Organization, 2006.
81 Frenk J et al. Health professionals for a new century: transforming education to strengthen health systems in an interdependent world. Lancet, 2010, 376:1923–1958.
82 Van Olmen J et al. Analysing health systems dynamics: a framework. Antwerp, Institute for Tropical Medicine, 2012.
83 Marchal B, Cavalli A, Kegels G. Global health actors claim to support health system strengthen-ing: is this reality or rhetoric? PLoS Medicine, 2009, 6. doi:10.1371/journal.pmed.1000059.
84 Mutale W et al. Systems thinking in practice: the current status of the six WHO building blocks for health system strengthening in three BHOMA intervention districts of Zambia: a baseline qualitative study. BMC Health Services Research, 2013, 13:291.
85 Van Olmen J et al. Health systems frameworks in their political con-text: framing divergent agendas. BMC Public Health, 2012, 12:774.
86 Commission on the Social Determinants of Health. Closing the gap in a generation: health equity through action on the social determinants of health. Geneva, World Health Organization, 2008 (http://whqlibdoc.who.int/publica-tions/2008/9789241563703_eng.pdf, accessed 14 October 2013). 87 Ergo A et al. Strengthening health systems to improve MNCH out-comes: a framework. Washington, DC, MCHIP, United States Agency for International Development, 2011.
88 Campbell J et al. Human resources for health and universal health coverage: fostering equity and effective coverage. Bulletin of the World Health Organization, in press.
89 United Nations Committee on Economic, Social and Cultural Rights. CESCR General Comment No. 14: The Right to the Highest Attainable Standard of Health (Art. 12). New York, United Nations, 2000 (http://www.unhcr.org/refworld/pdfid/4538838d0.pdf, accessed 14 October 2013).
90 Every woman, every child: strengthening equity and dignity through health: the second report of the independent Expert Review Group (iERG) on Information and Accountability for Women’s and Children’s Health. Geneva, Expert Review Group (iERG) on Information and Accountability for Women’s and Children’s Health, 2013.

88 A UNIVERSAL TRUTH: NO HEALTH WITHOUT A WORKFORCE
91 Condon R et al. Health workforce development in the Pacific: striving for a workforce that is fit for purpose and fit to practice. Manila, WHO Regional Office for the Western Pacific, 2013 (http://www.wpro.who.int/southpacific/pic_meeting/2013/presentations/PHMM_HRH_Technical.pdf, accessed 14 October 2013).
92 Gorman DF. Towards a sustainable and fit-for-purpose health work-force– lessons from New Zealand. Medical Journal of Australia, 2012, 1:32–36.
93 Healthy lives, healthy people : a public health workforce strategy. London, Department of Health – United Kingdom, Public Health England, 2013 (https://www.gov.uk/government/uploads/system/uploads/attachment_data/file/204792/2900899_28781_Healthy_lives_v0.8.pdf, accessed 14 October 2013).
94 Fit for purpose and for practice: advice to the Minister of Health on the issues concerning the medical workforce in New Zealand. Wellington, Medical Reference Group Health Workforce Advisory Committee, 2006 (http://www.health.govt.nz/system/files/.../hwac-fit-for-purpose-practice.pdf, accessed 14 October 2013).
95 Securing future practice: shaping the new medical workforce for Scotland. Edinburgh, Scottish Executive, 2004 (http://www.scotland.gov.uk/Resource/Doc/47251/0013201.pdf, accessed 14 October 2013).
96 National Planning Team. Drivers for change in health care in Scotland. Edinburgh, National Health Service, 2005 (http://www.sehd.scot.nhs.uk/nationalframework/Documents/DRIVERSFORCHANGE.pdf, accessed 14 October 2013).
97 Imison C, Buchan J, Xavier S. NHS workforce planning: limitations and possibilities. London, Kings Fund, 2009 (http://www.kingsfund.org.uk/sites/files/kf/NHS-Workforce-Planning-Candace-Imison-James-Buchan-Su-Xavier-Kings-Fund-November-2009.pdf, accessed 14 October 2013).
98 Adams O, Dussault G. Preface. In: Ferrinho P, Dal Poz MR, eds. Towards a global health workforce strategy. Antwerp, Belgium, Studies in Health Services Organisation & Policy, 2003:1–3.
99 Buchan J. What difference does (“good”) HRM make ? Human Resources for Health, 2004, 7:1–7.
100 Wiskow C, Albreth T, Di Pietro C. How to create an attractive and supportive working environment for health professionals. Geneva, World Health Organization, 2010 (Policy Brief No. 15; http://www.euro.who.int/__data/assets/pdf_file/0018/124416/e94293.pdf, accessed 14 October 2013).
101 World Health Professions Conference on Regulation (WHPCR): final report. Geneva, Wold Medical Association, 2008 (http://www.wma.net/en/20activities/40healthsystems/20scopeofpractice/010402_WHPCR_report_A4_single_page_final.pdf, accessed 14 October 2013).
102 Evidence-informed human resources for health policies: the contribution of HRH observatories. Lisbon, 4–7 July 2011. Geneva, World Health Organization, 2011 (http://www.who.int/hrh/resources/observatories_meeting_report.pdf, accessed 14 October 2013).
103 The state of world’s midwifery 2011: delivering health, saving lives. New York, United Nations Population Fund, 2011 (http://www.unfpa.org/sowmy/report/home.html, accessed 14 October 2013).
104 Riley PL et al. Information systems on human resources for health: a global review. Human Resources for Health, 2012, 10:7.
105 WHO country assessment tool on the uses and sources for human resources for health (HRH) data. Geneva, World Health Organization, 2012 (http://www.who.int/hrh/resources/HRH_data-online_ver-sion_survey_use_sources.pdf, accessed 14 October 2013).
106 Kiwanuka S et al. Dual practice regulatory mechanisms in the health sector: a systematic review of approaches and implementa-tion. London, EPPI-Centre, Social Science Research Unit, Institute of Education, University of London, 2011.
107 Araújo E, Mahat A, Lemiere C. Managing dual job holding among health workers: a guidance note. Washington, DC, World Bank, forthcoming (Health, Nutrition and Population Discussion Paper).
108 Ferrinho P et al. Dual practice in the health sector: review of the evidence. Human Resources for Health, 2004, 2:14.
109 G8 UK. Lough Erne accountability report: keeping our promises. London, Government of the United Kingdom, 2013 (https://www.gov.uk/government/publications/lough-erne-accountability-report, accessed 14 October 2013).
110 Bossert TJ, Ono T. Finding afford-able health workforce targets in low-income nations. Health Affairs (Project Hope), 2010, 29:1376–1382.
111 Sousa A et al. Measuring the efficiency of human resources for health for attaining health outcomes across subnational units in Brazil. Geneva, World Health Organization, 2006.
112 Speybroeck N et al. Reassessing the relationship between human resources for health, intervention coverage and health outcomes. Geneva, World Health Organization, 2006.
113 Scheffler R, Fulton B. Needs-based estimates for the health workforce. In: Soucat A, Scheffler R, Donald K, eds. The labor market for health workers in Africa: a new look at the crisis. Washington, DC, World Bank, 2013.
114 Farahani M, Subramanian SV, Canning D. The effect of changes in health sector resources on infant mortality in the short-run and the long-run: a longitudinal economet-ric analysis. Social Science and Medicine, 2009, 68:1918–1925. 115 Fulton BD et al. Health workforce skill mix and task shifting in low income countries: a review of recent evidence. Human Resources for Health, 2011, 9:1.
116 Scheffler RM et al. Forecasting the global shortage of physicians: an economic- and needs-based ap-proach. Bulletin of the World Health Organization, 2008, 86:516B–523B.
117 Social health protection: an ILO strategy towards universal access to health care. Geneva, International Labour Organization, 2008 (Social Security Policy Briefings; http://www.ilo.org/secsoc, accessed 14 October 2013).
118 World Social Security Report 2010–2011: providing coverage in times of crisis and beyond. Geneva, International Labour Office, 2011.
119 Scheil-Adlung X et al. New approaches to measuring deficits in social health protection coverage in vulnerable countries. Geneva, World Health Organization, 2010 (http://www.who.int/healthsystems/topics/financing/healthreport/BP56MeasurementILO.pdf, accessed 14 October 2013).
120 Scheil-Adlung X. Health workforce benchmarks for universal health coverage and sustainable develop-ment. Draft.
121 Bustreo F et al. Ending preventable maternal deaths: the time is now. Lancet Global Health, 2013, 2010–2011.
122 Lagomarsino G et al. Moving towards universal health coverage: health insurance reforms in nine developing countries in Africa and Asia. Lancet, 2012, 380:933–943. 123 Channon AA et al. Maternal health inequalities over time: is there a common pathway? New York, World We Want 2015, 2012 (http://www.worldwewant2015.org/node/283339, accessed 14 October 2013).
124 Graham WJ, McCaw-Binns A, Munjanja S. Translating coverage gains into health gains for all women and children: the quality care opportunity. PLoS Medicine, 2013, 10:1–3.
125 Wismar M et al. Health professional mobility and health systems. Evidence from 17 European countries. Copenhagen, WHO Regional Office for Europe, 2011 (Observatory Studies Series, No. 23).
126 Tjadens F, Weilandt C, Eckert J. Mobility of health professionals. Bonn, WIAD – Scientific Institute of the Medical Association of German Doctors, 2012.
127 Needleman J et al. Nurse staffing in hospitals: is there a business case for quality? Health Affairs, 2006, 25:204–211.
128 Nursing shortage resources. Washington, DC, American Association of Colleges of Nursing, 2013 (http://www.aacn.nche.edu/media/shortageresource.htm, accessed 14 October 2013).
129 US could face shortage of 44 000 physicians. Science Blog, 2008 (http://scienceblog.com/16702/us-could-face-shortage-of-44000-physi-cians, accessed 14 October 2013).
130 Commission staff working document on an action plan for the EU health workforce. Brussels, European Commission, 2012.
131 Ishikawa T et al. Forecasting the absolute and relative shortage of physicians in Japan using a system dynamics model approach. Human Resources for Health, 2013, 11:41.

89REFERENCES
132 Doctors and nurses. Canberra, Australian Bureau of Statistics, 2013 (http://www.abs.gov.au/AUSSTATS/ [email protected]/Lookup/4102.0Main+ Features20April+2013, accessed 14 October 2013).
133 A summary of health workforce 2025 – volumes 1 to 3. Canberra, Health Workforce Australia 2012 (http://www.hwa.gov.au/sites/uploads/SummaryHW2025Vol1-3FINAL.pdf, accessed 14 October 2013).
134 Portal da Saúde. Mais médicos. Brasília, Ministry of Health, 2013 (http://portalsaude.saude.gov.br/portalsaude/area/417/mais-medicos.html, accessed 14 October 2013).
135 Dussault G, Perfilieva G, Pethick J. Implementing the WHO Global Code of Practice on International Recruitment of Health Personnel in the European Region. Copenhagen, WHO Regional Office for Europe, 2012.
136 Campbell J. Towards universal health coverage: a health workforce fit for purpose and practice. Bulletin of the World Health Organization, in press.
137 Taylor AL, Dhillon IS. The WHO Global Code of Practice on the International Recruitment of Health Personnel: the evolution of global health diplomacy. Global Health Governance, 2011, 5:1–24.
138 Lemière C et al. Reducing geograph-ical imbalances of health workers in sub-Saharan Africa: a labor market perspective on what works, what does not, and why. Africa Human Development Series, 2011, 209:1–50.
139 Tangcharoensathien V et al. Promoting universal financial protection: how the Thai universal coverage scheme was designed to ensure equity. Health Research Policy and Systems, 2013, 11:25.
140 Increasing access to health workers in remote and rural areas through improved retention. Geneva, World Health Organization, 2010.
141 McPake B et al. Removing financial barriers to access reproductive, maternal and newborn health services: the challenges and policy implications for human resources for health. Human Resources for Health, 2013, 11:46.
142 Cooke GS et al. Population uptake of antiretroviral treatment through primary care in rural South Africa. BMC Public Health, 2010, 10:585.
143 Black M et al. Using GIS to measure physical accessibility to health care. Geneva, World Health Organization, 2004.
144 Tatem AJ et al. Mapping popu-lations at risk: improving spatial demographic data for infectious disease modeling and metric deri-vation. Population Health Metrics, 2012, 10:8.
145 Amoako Johnson F, Madise NJ. Targeting women at risk of unin-tended pregnancy in Ghana: should geography matter? Sexual and Reproductive Healthcare: Official Journal of the Swedish Association of Midwives, 2011, 2:29–35.
146 Bailey PE et al. Using a GIS to model interventions to strengthen the emergency referral system for maternal and newborn health in Ethiopia. International Journal of Gynecology and Obstetrics, 2011, 115: 300–309.
147 Echoka E et al. Existence and func-tionality of emergency obstetric care services at district level in Kenya: theoretical coverage versus reality. BMC Health Services Research, 2013, 13:113.
148 Gabrysch S et al. The influence of distance and level of care on deliv-ery place in rural Zambia: a study of linked national data in a geographic information system. PLoS Medicine, 2011, 8:1000394.
149 Gjesfjeld CD, Jung J-K. How far?: Using geographical information systems (GIS) to examine maternity care access for expectant mothers in a rural state. Social Work in Health Care, 2011, 50:682–693.
150 Kyei NN, Campbell OMR, Gabrysch S. The influence of distance and level of service provision on antenatal care use in rural zambia. PloS One, 2012, 7:1–6.
151 Okwaraji YB et al. Effect of geo-graphical access to health facilities on child mortality in rural Ethiopia: a community based cross sectional study. PloS One, 2012, 7:e33564.
152 Simões PP, Almeida RMVR. Geographic accessibility to obstetric care and maternal mortality in a large metropolitan area of Brazil. International Journal of Gynaecology and Obstetrics: the Official Organ of the International Federation of Gynaecology and Obstetrics, 2011, 112:25–29.
153 Ebener S et al. The geography of maternal and newborn health: the state of the art. 5th International Conference on Health GIS, 21–23 August 2013, Bangkok, Thailand.
154 Respectful maternity care: the universal rights of childbearing women. Washington, DC, White Ribbon Alliance for Safe Motherhood, 2010.
155 WHO recommendations for optimizing health worker roles to improve access to key maternal and newborn health interventions through task shifting. Geneva, World Health Organization, 2012.
156 Assefa Y et al. Effectiveness and acceptability of delivery of antiret-roviral treatment in health centres by health officers and nurses in Ethiopia. Journal of Health Services Research and Policy, 2012, 17:24–29.
157 Callaghan M, Ford N, Schneider H. A systematic review of task-shifting for HIV treatment and care in Africa. Human Resources for Health, 2010, 8:8.
158 Rao KD, Bhatnagar A, Berman P. So many, yet few: human resources for health in India. Human Resources for Health, 2012, 10:19.
159 Institute of Medicine [web site]. Washington, DC, Institute of Medicine, 2013 (http://www.iom.edu, accessed 14 October 2013).
160 Mid Staffordshire NHS Foundation Trust Inquiry. Final report of the Independent Inquiry Into Care. London, The Stationery Office, 2010 (http://www.midstaffsinquiry.com/pressrelease.html, accessed 14 October 2013).
161 Karim AM et al. Effect of Ethiopia’s health extension program on maternal and newborn health care practices in 101 rural districts: a dose-response study. PloS One, 2013, 8:e0065160.
162 Project appraisal document for the grant to the Republic of Yemen for the Health and Population Project. Washington, DC, World Bank, 2010 (Report No: 53766-YE).
163 Rwanda Human Resources for Health Program, 2011–2019. Kigali, Ministry of Health, Rwanda, 2011.
164 MOOC List [online database] (http://www.mooc-list.com/#sthash.3eSde-itD.dpuf, accessed 14 October 2013).
165 Australian Medical Council Limited [web site]. Canberra, Australian Medical Council Limited, 2013 (http://www.amc.org.au, accessed 14 October 2013).
166 Liaison Committee on Medical Education [web site]. Chicago, Liaison Committee on Medical Education, 2013 (http://www.lcme.org, accessed 14 October 2013).
167 Regulating doctors, ensuring good medical practice. London, General Medical Council, 2013 (http://www.gmc-uk.org/education/index.asp, accessed 14 October 2013).
168 Caribbean Accreditation Authority for Education in Medicine and other Health Professions [web site]. Kingston, Caribbean Accreditation Authority for Education in Medicine and other Health Professions, 2013 (http://www.caam-hp.org, accessed 14 October 2013).
169 World Federation for Medical Education [web site]. Copenhagen, World Federation for Medical Education, 2013 (http://www.wfme.org, accessed 14 October 2013).
170 Conférence Internationale des Doyens et des Facultés de Médecine d’Expression Française [web site]. Paris, Conférence Internationale des Doyens et des Facultés de Médecine d’Expression Française, 2013 (http://www.cidmef.u-bordeaux2.fr, accessed 14 October 2013).
171 Association of Schools of Public Health in the European Region [web site]. Copenhagen, Association of Schools of Public Health in the European Region, 2013 (http://www.2011.aspher.org, accessed 14 October 2013).
172 Health Education England [web site]. London, National Health Service, 2013 (http://hee.nhs.uk, accessed 14 October 2013).
173 Commission on Higher Education [web site]. Manila, Commission on Higher Education, 2010 (http://www.ched.gov.ph/chedwww/index.php, accessed 14 October 2013).
174 Frenk J et al. Health professionals for a new century: transforming education to strengthen health systems in an interdependent world. Lancet, 2010, 376:1923–1958.
175 Contact information sheet. Geneva, International Council of Nurses, 2013 (http://www.icn.ch/pillars-and-programmes/regulation/activities/the-role-and-identity-of-the-regulator/global-database/contact-information-sheet.html, accessed 14 October 2013).
176 The world health report 2000 – Health systems: improving performance. Geneva, World Health Organization, 2000.
177 Garrett L. Existential challenges to global health. New York, New York University, 2013 (http://cic.nyu.edu/sites/default/files/garrett_challeng-es_global_health.pdf, accessed 14 October 2013).
178 Horton R. Offline: failing women and failing them badly. Lancet, 2013, 382:1082.
90 A UNIVERSAL TRUTH: NO HEALTH WITHOUT A WORKFORCE
179 World Bank and International Monetary Fund. Global monitoring report 2013. Rural-urban dynamics and the Millennium Development Goals. Washington, DC, World Bank, 2013.
180 Glassman A, Fan V, Over M. More health for the money: putting incentives to work for the Global Fund and its partners. Washington, DC, Center for Global Development, 2013 (http://www.cgdev.org/sites/default/files/More-Health-for-the-Money.pdf, accessed 14 October 2013).
181 Nicholson S, Propper C. Medical workforce. In: Pauly M, McGuire T, Barros P, eds. Handbook of health economics. Amsterdam, Elsevier, 2011:873–925.
182 Buchan J, Weller B. Understanding health care labour markets in the WHO Western Pacific Region. Manila, WHO Regional Office for the Western Pacific, forthcoming.
183 McPake B et al. Health labor markets in low- and middle-in-come countries – a policy brief. Washington, DC, World Bank, forthcoming (Human Resources for Health Policy Brief, No. 1).
184 World Bank and AFTHE. Togo country status report. Washington, DC, World Bank, 2011.
185 Lindelow M, Serneels P. The performance of health workers in Ethiopia: results from qualitative research. Social Science and Medicine, 2006, 62:2225–2235.
186 Vujicic M, Zurn P. The dynamics of the health labour market. International Journal of Health Planning and Management, 2006, 21:101–115.
187 Ministers of Foreign Affairs of Brazil, France, Indonesia, Norway, Senegal and Thailand. Foreign policy and global health – responding to new challenges and setting priorities for the future: the Oslo Ministerial Declaration three years later and beyond. Oslo, Government of Norway, 2010 (http://www.regjeringen.no/upload/UD/Temabilder/helse/globa_health101022.pdf, accessed 14 October 2013).
188 Ministers of Foreign Affairs of Brazil, France, Indonesia, Norway, Senegal and Thailand. Why we need a Commission on Global Governance for Health. Lancet, 2012, 379:1470–1471.
189 Zhao F et al. Investing in human resources for health: the need for a paradigm shift for the global health community over the next decade. Bulletin of the World Health Organization, in press.
190 Walker N et al. Patterns in coverage of maternal, newborn, and child health interventions: pro-jections of neonatal and under-5 mortality to 2035. Lancet, 2013, 382:1029–1038.
191 Campbell J, Jones I, Whyms D. “More money for health – more health for the money”: a human resources for health perspective. Human Resources for Health, 2011, 9:18.
192 Ministers of Finance and Ministers of Health of Africa. Tunis Declaration on Value for Money, Sustainability and Accountability in the Health Sector. Tunis, African Development Bank 2012.
193 Campbell J. The route to effective coverage is through the health worker: there are no shortcuts. Lancet, 2013, 381:725.
194 GBD insight [online database]. Seattle, Institute for Health Metrics and Evaluation, 2013 (http://www.healthmetricsandevaluation.org/gbd/visualizations/gbd-insight, accessed 14 October 2013).
195 OECD/WHO. Health at a Glance: Asia/Pacific 2012. Paris, Organisation for Economic Co-operation and Development, 2012 doi:10.1787/9789264183902-en.
Additional online annexeshttp://www.who.int/workforcealliance/knowledge/resources/hrhreport2013/
en/index.html
Annex 3: UHC status in 36 profiled countriesAnnex 4: Workforce data for 193 countries (adapted from the WHO Global Health Observatory Data Repository)Annex 5: Country profiles - data set


A UNIVERSAL TRUTH:
NO HEALTH WITHOUT A WORKFORCE
For further information, please contact:
Global Health Workforce Alliance
World Health Organization
Avenue Appia 20
CH-1211 Geneva 27
Switzerland
Tel: +41 -22- 791 26 21
Fax: +41 - 22 791 48 41
Email: [email protected]
Web: www.who.int/workforcealliance
A U
NIVERSA
L TRUTH
: NO
HEA
LTH W
ITHO
UT A
WO
RKFORCE