a two lead ecg
TRANSCRIPT

A Two-Lead ECG Using DAQ and Python
By
Biplab Dutta and Anshuman Dey
Report submitted to the Faculty of the Indian Instituteof Technology, Kanpur in partial fulfilment of the
requirements for the course PHY692
APPROVED :
————————————Dr. K. P. RajeevCourse Instructor
April 30, 2012Kanpur, Uttar Pradesh
India
Contents
1 Introduction 2
2 Project Objective 2
3 A bit of Electrical Theory 23.1 Measurement . . . . . . . . . . . . . . . . . . . . . . . . . . . . . . . . . . . . . . . . . . . 23.2 Amplification . . . . . . . . . . . . . . . . . . . . . . . . . . . . . . . . . . . . . . . . . . . 23.3 Noise . . . . . . . . . . . . . . . . . . . . . . . . . . . . . . . . . . . . . . . . . . . . . . . . 33.4 Data Acquisition . . . . . . . . . . . . . . . . . . . . . . . . . . . . . . . . . . . . . . . . . 3
4 Parts and Cost 3
5 ECG in the Making 35.1 ECG Circuit Diagram . . . . . . . . . . . . . . . . . . . . . . . . . . . . . . . . . . . . . . 45.2 The Electrodes . . . . . . . . . . . . . . . . . . . . . . . . . . . . . . . . . . . . . . . . . . 45.3 Setting Up the Complete Circuit . . . . . . . . . . . . . . . . . . . . . . . . . . . . . . . . 4
6 ECG Visualization 4
7 Diagrams and Pictures 5
8 ECG Setup 6
9 Plots of ECG 7
1
1 Introduction
Electrocardiograph(ECG) is a device that can be used to amplify, measure and record the naturalelectrical activity of the heart. It generally measures and records the electrical potential generated bythe natural pacemaker - Sinoatrial Node(SAN). Although all of the heart’s cells have the ability togenerate the electrical impulses(or action potentials) that trigger cardiac contraction, the SAN normallyinitiates it, simply because it generates impulses slightly faster than the other areas.
The ECG(sometimes EKG) is today used world over as a relatively simpler way of diagnosing heartconditions. The fundamental function of the ECG as known today was developed by the Dutch scientistWillem Einthoven in the beginning of the 20th century for which he was awarded the Nobel prize inPhysiology or Medicine ”...for his discovery of the mechanism of the electrocardiogram.”
One should note that the cardiac electrical signals are different from than the heart beats. ECG isused to study the electrical activity of the heart and heart sounds are listened to with a stethoscope. SANinitiates the electrical signal which serve to command and coordinate contraction of the four chambersat the heart at the appropriate intervals, and their analysis reveals a wealth of information about cardiacregulation, as well insights into the pathological conditions.
Each heartbeat produces a periodic pattern in the ECG signal, called a PQRST wave. The smoothcurve in the ECG(P) is caused by the simulation of the atria via the SAN in the right atrium. There isa brief pause, as the electrical impulse is slowed by the Atrioventricular node (AVN) and Purkinje fibersin the bundle of His. The prominent spike in the ECG(the QRS complex) is caused by this step, wherethe electrical impulse travels through the inter-ventricular septum and up through the outer walls of theventricles. The sharp peak is the R component, and exact heart rate can be calculated as the inverse ofR-to-R interval(RRi).
2 Project Objective
Our objective was to build a portable and extremely cheap ECG machine using a data acquisition (DAQ)card and Python (of course excluding the cost of a computer and a DAQ card!). There are some reasonswhich made us select this project:
1. Firstly, we wanted to do something different and very cool!
2. Secondly, we wanted to visualize and analyze our own heartbeat.
This project can be divided into two main parts:
1. Hardware - This consist of an Instrumentation amplifier, a DAQ card and a computer.
2. Software - Data and post-processing has been done using Python.
Before going into the details of the our own ECG machine, let us consider some of challenges whichhad to be overcome in order to build the ECG.
3 A bit of Electrical Theory
3.1 Measurement
The electrical signals generated in the heart is transmitted along with blood throughout the whole body.These signals can be detected on the surface of the skin. One can simply see these signals as voltagechange as their heartbeats if one holds the two leads of a multimeter, one on each hand. These fluctuationsare rapid and the signals reaching the skin become extremely weak(of the order of few millivolts) anddifficult to be detected without proper amplification.
3.2 Amplification
One can simply use an op-amp to amplify the signal. But due to too much background noise we needsomething which had a very high common-mode rejection ratio. In the beginning of the project we were
2
to use in-chip instrumentation amplifier which are built specially for medical instrumentation(AD624,AD620) but these chips were not easily available. So we decided to go chips which are easily available inan electronics lab. Our instructor suggested us to use op-amp OP07 for instrumentation amplifier andop-amp 741 for post amplification. These chips also operate at low voltages.
3.3 Noise
This was the biggest challenge of all! It is unfortunate that the heart is not the only source of voltageon the skin. Radiation from a variety of electrical devices is absorbed by our skin. Our body is a verygood receiver. These signals are also measured with our ECG, thus burying the ECG signal in a sea ofelectrical noise. One can use either hardware(bandpass filters) or software(post processing using python).We did not use any hardware filter. All the filtering is done using python.
3.4 Data Acquisition
For data acquisition we used PMD-1208FS - low-cost USB-based Personal Measurement device. ThisDAQ card has 8 channels, 12 bit input. For acquiring data we use PyUniversalLibrary (PyUL) whichis a Python wrapper for Measurement Computing’s Universal Library for data acquisition on MicrosoftWindows operating systems.
4 Parts and Cost
This section accounts for the parts and cost in making only the instrumentation amplifier and the skinelectrodes. Most of the parts we required were available in our Electronics lab. The list of parts used:
• 3× low voltage op-amp OP07
• 1× low voltage op-amp 741
• 6× 1kΩ resistors
• 1× 18kΩ resistor
• 1× 33kΩ resistor
• Electrodes - 2 coins with shampoo (Rs. 5) and 16× Skin Electrodes (Rs. 240)
• 2×Universal PCB (Rs. 90) - Although we didn’t use them in our final demo.
• 1×Stereo pin (Rs. 15) - To check our earlier signal from the instrumentation amplifier connectingit the sound card of the computer and using a sound editor (Goldwave) to process the signal.
5 ECG in the Making
In the beginning we tried setting up the circuit on a Universal PCB but due some error arising everytime we decided to use breadboard instead. The circuit for instrumentation amplifier was borrowed fromPaul Horowitz and Winfield Hill(see References). The schematics (Section 8) shows the circuit layout indetails. The gain for the instrumentation amplifier is given by [11]
Gain =vout
v2 − v1=
(1 +
2R1
Rgain
)R3
R2(1)
where vout - output voltage, v2 - +ve input, v1 - -ve input, R1, R2, R3, Rgain - resistors. In our case weobtained a gain of 3 from the instrumentation amplifier since we used R1 = R2 = R3 = Rgain and thenfed its output to the inverting amplifier(using op-amp 741) with a gain of 51. The total gain achieved is153. This is enough for us to visualize the signal coming from the skin.
3
5.1 ECG Circuit Diagram
The circuit shown in the figure is divided into parts - an instrumentation amplifier and an invertingamplifier. The instrumentation amplifier with a gain of 3 is used to amplify and reduce noise in thesignal coming from the skin. We could have used only the instrumentation amplifier to get the output ofdesired gain but using all equal resistors in the instrumentation amplifier made it easy to troubleshoot.In the beginning we had trouble with loose connections since the breadboards weren’t good enough.Taking the output from the instrumentation amplifier with a gain of 3 and feeding it to the input of aninverting amplifier with a gain of 51 made it easier to troubleshoot.
5.2 The Electrodes
In the beginning we got the skin electrodes from a medical store. But those weren’t good enough asthey were use-and-throw type. We had think of something which could be used over and over again.Although the skin electrodes gave the best results. For our preliminary testing purposes we used two Onerupee coins along with crocodile clips as our electrodes. Shampoo was applied to the skin and electrodeinterface to provide better conductivity. Electrical tapes were used to attach the electrodes to the skin.
5.3 Setting Up the Complete Circuit
Finally the output from the electronic circuit is connected to the input of DAQ card and the other inputof DAQ card is grounded. The circuit diagram shows the connections made.
6 ECG Visualization
The ECG signal is acquired by DAQ and a code written in python (ecg.py). This piece of code does thefollowing things:
• Acquires data from the card
• Plots the raw data in realtime
• Processes the raw data and outputs the filtered and smoothed data along with the heart rate.
The filtering is done digitally using a low pass filter code. The low pass filter reduces the influence of60 Hz interference and other background noise. The desirable passband to maximize the QRS energyis approximately 5-15 Hz [1]. But since our hardware is very simple with only two leads we cannot usea bandpass at that range(it completely distorts the ECG waveform). So we have to go with a low passfilter with cutoff frequency of 40 Hz. The electrodes have to be properly connected to skin otherwise weend up getting a bad signal.
The following steps were implemented to get the final ECG signal and the heart rate:
• Acquire the raw data and plot its time series.
• Filter the data using low pass (cutoff frequency 40 Hz) using scipy.signal module.
• Using Savitzky-Golay filter to smooth the filtered output.
All the plots are plotted in realtime with a time lag of the total post processing time of the raw data.
4
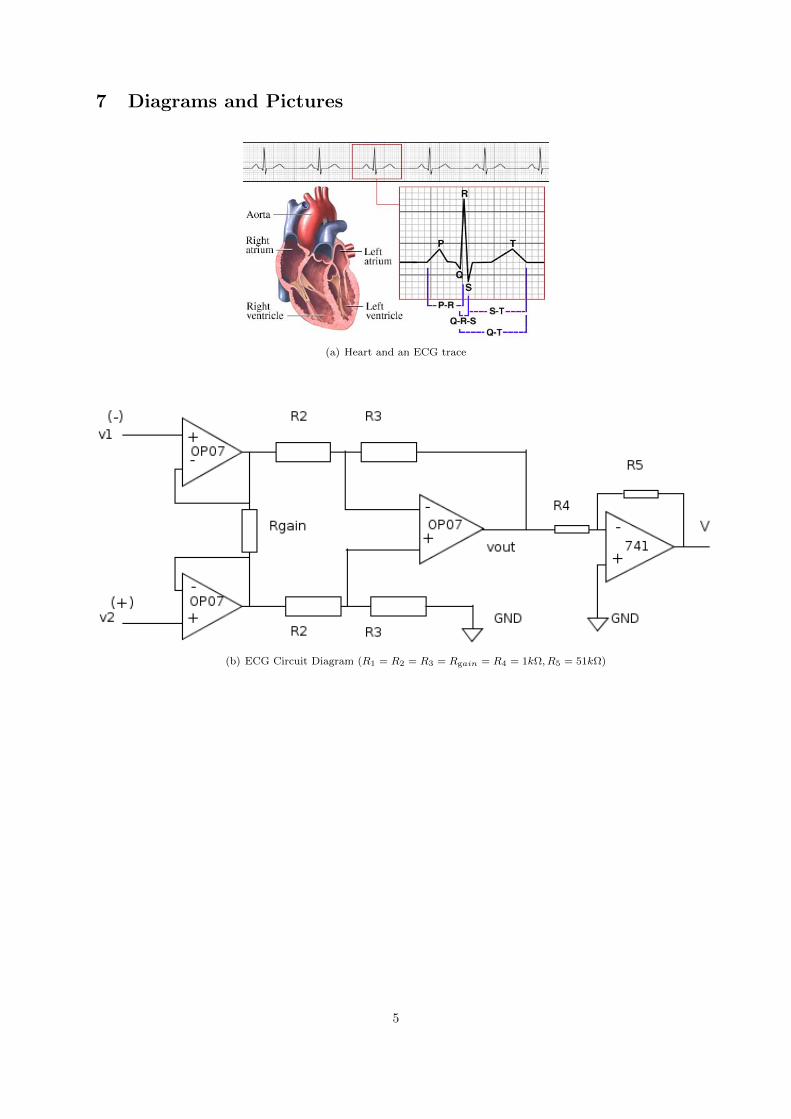
7 Diagrams and Pictures
(a) Heart and an ECG trace
(b) ECG Circuit Diagram (R1 = R2 = R3 = Rgain = R4 = 1kΩ, R5 = 51kΩ)
5
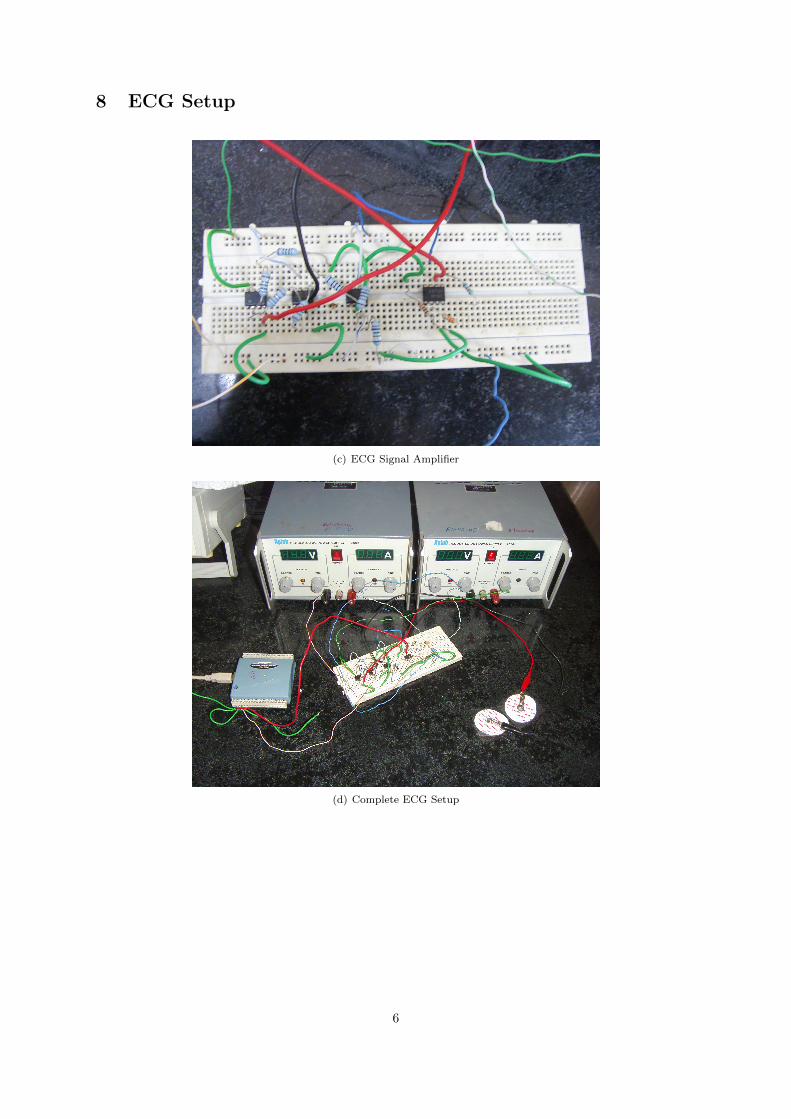
8 ECG Setup
(c) ECG Signal Amplifier
(d) Complete ECG Setup
6

9 Plots of ECG
Figure 1: Plots of Original Signal, Filtered Signal, Smoothed Signal (xlabel: Time (in seconds), ylabel:Voltage (in Volts))
7

Acknowledgements:The authors acknowledge Dr. K. P. Rajeev for his support and guidance.
References
[1] J. Pan, W. J. Tompkis, “A Real-Time QRS Detection Algorithm”, IEEE Transactions on BioMed-ical Engineering, Vol. BME-32, No. 3 (1985).
[2] P. K. Gakare, A. M. Patel, A. N. Cheeran “Real Time Analysis and Diagnosis of ECG Signal forTachycardia Condition”, International Journal of Computer Applications, (2012).
[3] P. Horowitz, W. Hill, “The Art of Electronics”, Second Edition, Cambridge University Press (2011)
[4] Electrocardiography, http://en.wikipedia.org/wiki/Electrocardiography.
[5] DIY ECG Machine on the Cheap, http://www.swharden.com/blog/
2009-08-14-diy-ecg-machine-on-the-cheap/.
[6] Measure Biopotential / ECG, http://www.emant.com/ecg.page.
[7] S. Raja, “QRS detection in ECGs”, http://ggeek.googlecode.com/svn/trunk/qrsdetect/
ecgpy.py.
[8] Savitzky-Golay-Smoothing with Python, http://public.procoders.net/sg_filter/sg_
filter.py.
[9] PyUniversalLibrary, https://code.astraw.com/projects/PyUniversalLibrary/
[10] Cookbook / Data Acquisition with PyUL, http://www.scipy.org/Cookbook/Data_
Acquisition_with_PyUL
[11] Instrumentation Amplifier, http://en.wikipedia.org/wiki/Instrumentation_amplifier
8