a technique for the retrospective and predictive analysis ... · safety article a technique for the...
TRANSCRIPT

A Technique for the Retrospective and Predictive Analysis of Cognitive Errors for the Oil and Gas Industry (TRACEr-OGI) Theophilus, S, Ifelebuegu, A, Arewa, A & Agyekum-Mensah, G Published PDF deposited in Coventry University’s Repository Original citation: Theophilus, S, Ifelebuegu, A, Arewa, A & Agyekum-Mensah, G 2017, 'A Technique for the Retrospective and Predictive Analysis of Cognitive Errors for the Oil and Gas Industry (TRACEr-OGI)' Safety, vol 3, no. 4, 23 https://dx.doi.org/10.3390/safety3040023 DOI 10.3390/safety3040023 ESSN 2313-576X Publisher: Elsevier This is an Open Access article distributed under the terms of the Creative Commons Attribution License (http://creativecommons.org/licenses/by/4.0/), which permits non-commercial re-use, distribution, and reproduction in any medium, provided the original work is properly cited. Copyright © and Moral Rights are retained by the author(s) and/ or other copyright owners. A copy can be downloaded for personal non-commercial research or study, without prior permission or charge. This item cannot be reproduced or quoted extensively from without first obtaining permission in writing from the copyright holder(s). The content must not be changed in any way or sold commercially in any format or medium without the formal permission of the copyright holders.

safety
Article
A Technique for the Retrospective and PredictiveAnalysis of Cognitive Errors for the Oil and GasIndustry (TRACEr-OGI)
Stephen C. Theophilus *, Ikpang E. Ekpenyong, Augustine O. Ifelebuegu, Andrew O. Arewa,George Agyekum-Mensah and Tochukwu O. Ajare
Faculty of Engineering, Environment and Computing, School of Energy Construction and Environment,Coventry University, Coventry CV1 5FB, UK; [email protected] (I.E.E.);[email protected] (A.O.I.); [email protected] (A.O.A.); [email protected] (G.A.-M.);[email protected] (T.O.A.)* Correspondence: [email protected]; Tel.: +44-(0)2476-888330
Received: 7 January 2017; Accepted: 12 September 2017; Published: 25 September 2017
Abstract: Human error remains a major cause of several accidents in the oil and gas (O&G) industry.While human error has been analysed in several industries and has been at the centre of many debatesand commentaries, a detailed, systematic and comprehensive analysis of human error in the O&Gindustry has not yet been conducted. Hence, this report aims to use the Technique for Retrospectiveand Predictive Analysis of Cognitive Errors (TRACEr) to analyse historical accidents in the O&Gindustry. The study has reviewed 163 major and/or fatal O&G industry accidents that occurredbetween 2000 and 2014. The results obtained have shown that the predominant context for errorswas internal communication, mostly influenced by factors of perception. Major accident events werecrane accidents and falling objects, relating to the most dominant accident type: ‘Struck by’. Themain actors in these events were drillers and operators. Generally, TRACEr proved very useful inidentifying major task errors. However, the taxonomy was less useful in identifying both equipmenterrors and errors due to failures in safety critical control barriers and recovery measures. Therefore,a modified version of the tool named Technique for the Retrospective and Predictive Analysis ofCognitive Errors for the Oil and Gas Industry (TRACEr-OGI) was proposed and used. This modifiedanalytical tool was consequently found to be more effective for accident analysis in the O&G industry.
Keywords: TRACEr; human error; task error; accident investigation; offshore oil and gas
1. Introduction
In the recent past, human error has been blamed for most of the serious disasters in the oil and gas(O&G) industry. Alexander L. Kielland (1980) with 123 fatalities, Ocean Ranger (1982) with 84 fatalities,Glomar Java Sea (1983) with 81 fatalities, Piper Alpha (1988) with 167 fatalities and Sea Crest (1989)with 91 fatalities all show that poor decisions and human error were at fault. Most of these errors weretraced to the structure, culture and procedures of the organisation [1]. Gordon [2] asserts that accidentssimilar to the examples above demonstrate that the interaction of human, technical, organisational,social and environmental factors all affect the output of a very complex system.
Lord Cullen’s recommendations following the Piper Alpha explosion and fire in 1988 were theorigin of the Offshore Installations (Safety Case) Regulation 1992 which is implemented to reducethe risk of hazards emerging from major accidents on offshore installations [3,4]. The Safety Caseregulation required offshore industries in the UK to perform risk assessments for new and existingplatforms. In the context of this requirement, the duty holder is responsible for identifying hazards,evaluating risk and carrying out accident analysis with the aim of demonstrating that measures are
Safety 2017, 3, 23; doi:10.3390/safety3040023 www.mdpi.com/journal/safety
Safety 2017, 3, 23 2 of 22
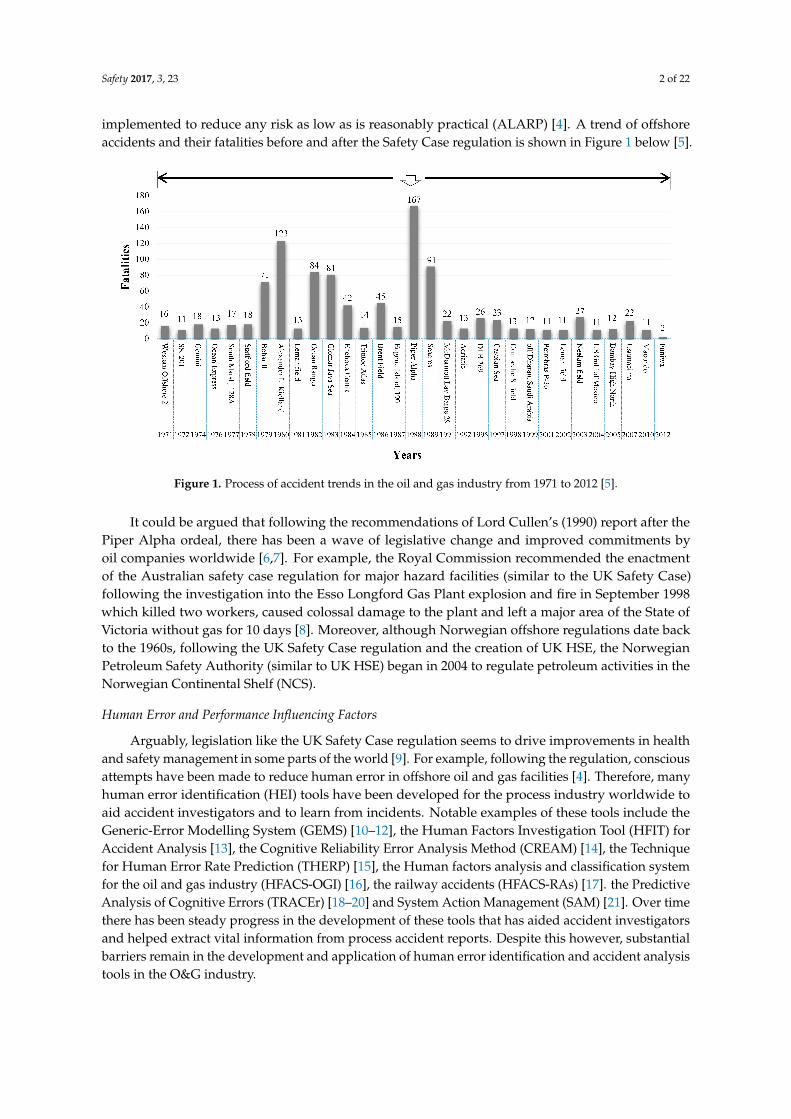
implemented to reduce any risk as low as is reasonably practical (ALARP) [4]. A trend of offshoreaccidents and their fatalities before and after the Safety Case regulation is shown in Figure 1 below [5].
Safety 2017, 3, 23 2 of 21
evaluating risk and carrying out accident analysis with the aim of demonstrating that measures are implemented to reduce any risk as low as is reasonably practical (ALARP) [4]. A trend of offshore accidents and their fatalities before and after the Safety Case regulation is shown in Figure 1 below [5].
Figure 1. Process of accident trends in the oil and gas industry from 1971 to 2012 [5].
It could be argued that following the recommendations of Lord Cullen’s (1990) report after the Piper Alpha ordeal, there has been a wave of legislative change and improved commitments by oil companies worldwide [6,7]. For example, the Royal Commission recommended the enactment of the Australian safety case regulation for major hazard facilities (similar to the UK Safety Case) following the investigation into the Esso Longford Gas Plant explosion and fire in September 1998 which killed two workers, caused colossal damage to the plant and left a major area of the State of Victoria without gas for 10 days [8]. Moreover, although Norwegian offshore regulations date back to the 1960s, following the UK Safety Case regulation and the creation of UK HSE, the Norwegian Petroleum Safety Authority (similar to UK HSE) began in 2004 to regulate petroleum activities in the Norwegian Continental Shelf (NCS).
Human Error and Performance Influencing Factors
Arguably, legislation like the UK Safety Case regulation seems to drive improvements in health and safety management in some parts of the world [9]. For example, following the regulation, conscious attempts have been made to reduce human error in offshore oil and gas facilities [4]. Therefore, many human error identification (HEI) tools have been developed for the process industry worldwide to aid accident investigators and to learn from incidents. Notable examples of these tools include the Generic-Error Modelling System (GEMS) [10–12], the Human Factors Investigation Tool (HFIT) for Accident Analysis [13], the Cognitive Reliability Error Analysis Method (CREAM) [14], the Technique for Human Error Rate Prediction (THERP) [15], the Human factors analysis and classification system for the oil and gas industry (HFACS-OGI) [16], the railway accidents (HFACS-RAs) [17]. the Predictive Analysis of Cognitive Errors (TRACEr) [18–20] and System Action Management (SAM) [21]. Over time there has been steady progress in the development of these tools that has aided accident investigators and helped extract vital information from process accident reports. Despite this however, substantial barriers remain in the development and application of human error identification and accident analysis tools in the O&G industry.
Figure 1. Process of accident trends in the oil and gas industry from 1971 to 2012 [5].
It could be argued that following the recommendations of Lord Cullen’s (1990) report after thePiper Alpha ordeal, there has been a wave of legislative change and improved commitments byoil companies worldwide [6,7]. For example, the Royal Commission recommended the enactmentof the Australian safety case regulation for major hazard facilities (similar to the UK Safety Case)following the investigation into the Esso Longford Gas Plant explosion and fire in September 1998which killed two workers, caused colossal damage to the plant and left a major area of the State ofVictoria without gas for 10 days [8]. Moreover, although Norwegian offshore regulations date backto the 1960s, following the UK Safety Case regulation and the creation of UK HSE, the NorwegianPetroleum Safety Authority (similar to UK HSE) began in 2004 to regulate petroleum activities in theNorwegian Continental Shelf (NCS).
Human Error and Performance Influencing Factors
Arguably, legislation like the UK Safety Case regulation seems to drive improvements in healthand safety management in some parts of the world [9]. For example, following the regulation, consciousattempts have been made to reduce human error in offshore oil and gas facilities [4]. Therefore, manyhuman error identification (HEI) tools have been developed for the process industry worldwide toaid accident investigators and to learn from incidents. Notable examples of these tools include theGeneric-Error Modelling System (GEMS) [10–12], the Human Factors Investigation Tool (HFIT) forAccident Analysis [13], the Cognitive Reliability Error Analysis Method (CREAM) [14], the Techniquefor Human Error Rate Prediction (THERP) [15], the Human factors analysis and classification systemfor the oil and gas industry (HFACS-OGI) [16], the railway accidents (HFACS-RAs) [17]. the PredictiveAnalysis of Cognitive Errors (TRACEr) [18–20] and System Action Management (SAM) [21]. Over timethere has been steady progress in the development of these tools that has aided accident investigatorsand helped extract vital information from process accident reports. Despite this however, substantialbarriers remain in the development and application of human error identification and accident analysistools in the O&G industry.

Safety 2017, 3, 23 3 of 22
2. TRACEr Taxonomy
Unlike other human error identification, TRACEr is a human error identification tool thatconsiders the human machine interface, the cognitive framework of the end user coupled withexternal factors that may affect the user’s performance. It takes into account the physical (e.g.,intoxication, fatigue), the psychological (e.g., state of mind, stress, decision-making) and the external(e.g., organisational factors, weather). This combination of characteristics presents an open imageof the event [20,22]. TRACEr was developed in line with two models, namely the Model ofHuman Information Processing (M-HIP) and the Simple Model of Cognition (SMOC). The firstmodel, the M-HIP developed by Wickens [23], was based on investigating how physical parametersaffect the cognitive process. In this model, human information processing is the basis of humanperformance as this determines how an individual perceives and processes information before makingdecisions [24]. The second model, the SMOC [14], contains elements of cognition and their interactions,including planning/choice, observation/identification and action/execution [14]. Although a detailedexplanation of the TRACEr taxonomy is beyond the scope of this paper, a brief explanation is offered.TRACEr has seven taxonomies divided into three major divisions (Table 1): (1) Context of the Accident;(2) Operator’s Context and (3) Error Recovery [20,22]. These are further divided into subdivisions fora more effective coding process as shown in Table 1 below.
Table 1. Levels and subdivisions of TRACEr taxonomy [20,22].
Major Divisions Categories
Context of the incident1. Task Error2. Error Information3. Casualty Level
Operator Context
4. External Error Mode (EEM)5. Cognitive Domain
I. Internal Error Mode (IEM)II. Psychological Error Mechanism (PEM)
6. Performance Shaping Factors (PSF)
Error Recovery 7. Error Recovery
Although TRACEr was initially developed for retrospective, predictive and real-time accidentanalyses in air traffic control [20], other high risk industries such as maritime and railways have usedsuccessfully modified versions of TRACEr [19,24–27]. However, there are scarcely any publishedaccounts where TRACEr has either been modified for the O&G industry or used in its original formfor accident analysis. A TRACEr taxonomy for the O&G industry therefore would be both usefuland obtainable, as in other high risk industrial sectors. Consequently, the aim of the present study istwofold: (1) to analyse retrospective accident cases using TRACEr to determine specific adaptationsnecessary to make it more effective for the O&G industry (Section I); (2) to propose a TRACEr taxonomyfor the O&G industry: TRACEr-OGI (Section II).
3. Analysis of Retrospective Offshore Accident Cases Using TRACEr (Section I)
3.1. Data Collation and Analysis
3.1.1. Data Collation
To analyse retrospective accident cases using TRACEr, 167 accident reports with at least onefatality or extensive damage to the facility were retrieved from the International Association ofOil & Gas Producers (IOGP) database. IOGP is the single association representing companies involved

Safety 2017, 3, 23 4 of 22
in the exploration and production of oil and gas at a global level to establish reliable data. IOGP data iscollected and analysed through known international practises, so there should be a high probability thatthe content and structure of the data provides reliable information about these accidents. Furthermore,only accidents with full details or those in which the investigation was completed were used inthis analysis.
3.1.2. Data Coding Process and Analysis
Publically available IOGP offshore accident reports were coded based on TRACEr’s sevensubdivisions (Table 2). The coding involved identifying the subdivisions associated with TRACErthat contributed to these accidents. Each report was read thoroughly before the coding process.The presence of any given ‘taxon’ was coded 1 to indicate the presence of a category or 0 to indicate theabsence of a category, as illustrated in Table 2 below. The coded data was cross-tabulated for statisticalanalysis and categories that were not present in any of the accidents were excluded.
Table 2. Illustration of the sequence of TRACEr categories/taxa identified from the accident reports.
Year No ofAccidents
Supervision
Drilling ProductionOperations
(Flaring,Completions)
WellLogging/TESTING
CraneOperations
Electrical/MechanicalOperations
LEVELTOTAL
2000 1 1 0 1 0 0 1 32000 1 1 0 0 0 0 0 12000 1 1 0 1 0 1 0 32000 1 0 0 0 0 0 0 02000 1 0 0 0 0 0 0 0
4. Result and Discussion of Analysis Using TRACEr
4.1. Context of the Incident
A total number of 2615 errors were coded from 163 accident reports between the years 2000 and2014 in Offshore Platforms. Following a thorough evaluation of the accident reports in three categories,the first level of the TRACEr taxonomy analysis was as follows: Task Error (56%), Error Information(24%) and Casualty Level (20%).
The percentages of main actors in the reviewed accident’s chain of events are shown in Figure 2below, while accident classifications are shown in Figure 3.
Safety 2017, 3, 23 4 of 21
Furthermore, only accidents with full details or those in which the investigation was completed were used in this analysis.
3.1.2. Data Coding Process and Analysis
Publically available IOGP offshore accident reports were coded based on TRACEr’s seven subdivisions (Table 2). The coding involved identifying the subdivisions associated with TRACEr that contributed to these accidents. Each report was read thoroughly before the coding process. The presence of any given ‘taxon’ was coded 1 to indicate the presence of a category or 0 to indicate the absence of a category, as illustrated in Table 2 below. The coded data was cross-tabulated for statistical analysis and categories that were not present in any of the accidents were excluded.
Table 2. Illustration of the sequence of TRACEr categories/taxa identified from the accident reports.
Year No of
Accidents
SupervisionLEVEL TOTAL Drilling Production
Operations (Flaring,
Completions)
Well Logging/TESTING
Crane Operations
Electrical/Mechanical Operations
2000 1 1 0 1 0 0 1 3 2000 1 1 0 0 0 0 0 1 2000 1 1 0 1 0 1 0 3 2000 1 0 0 0 0 0 0 0 2000 1 0 0 0 0 0 0 0
4. Result and Discussion of Analysis using TRACEr
4.1. Context of the Incident
A total number of 2615 errors were coded from 163 accident reports between the years 2000 and 2014 in Offshore Platforms. Following a thorough evaluation of the accident reports in three categories, the first level of the TRACEr taxonomy analysis was as follows: Task Error (56%), Error Information (24%) and Casualty Level (20%).
The percentages of main actors in the reviewed accident’s chain of events are shown in Figure 2 below, while accident classifications are shown in Figure 3.
Figure 2. Main actor in the chain of events.
Roughneck2%
Roustabout9% Crane Operators
6%
Banksman4%
Deck Crew Members
8%
Driller 32%
DerrickMan3%
Operator24%
Rigger2%
Others10%
Figure 2. Main actor in the chain of events.

Safety 2017, 3, 23 5 of 22Safety 2017, 3, 23 5 of 21
Figure 3. Accident Classification.
4.1.1. Task Errors
This paper has considered only offshore accidents. However, these accidents are also related to mobile drilling units (MODUs), mobile production units (MOPUs), Monohulls and all fixed offshore units. Monohulls include floating production storage and offloading (FPSOs), floating storage vessels (FSOs), Floating Offshore Production Units (FPUs) and Floating Storage Units (FSUs). The fixed offshore units considered were bottom-fixed installations (manned or unmanned) designated for accommodation, drilling, production, compression, injection/riser, pumping or a combination of these [28].
The Task Error Categories were as follows: supervision, standard operation procedure, external communication, internal communication and handover/takeover (Figure 4). Internal communication was found to be present in 55% of the 587 task errors coded. Supervision and external communication were present in 29% and 12% respectively, making them the second and third most significant trends.
Figure 4. Task Error Category Percentages Platforms.
4.1.2. Error Information
It is important to identify the equipment used in any activity that has led to an accident [22]. Much could be learned from technical equipment in the lead up to accidents, including improving the system of work, job procedures, industry standards and guidance and equipment design (ergonomics) among others. Results have shown that the main error information represents 24% of the accidents coded. However, details of the Technical Equipment shown in Figure 5 below shows that
Caught in or Between
19%
Fire/Explosion10%
Falls from Heights
5%Struckby39%
Other7%
Helicopter Crash
1%
Slips, Falls5%
Falling Objects 4%
Crushed by10%
29%
3%
12%
55%
2%0%
10%
20%
30%
40%
50%
60%
Supervision Standard OperationProcedure
ExternalCommunication
InternalCommunication
Handover,Takeover
Figure 3. Accident Classification.
4.1.1. Task Errors
This paper has considered only offshore accidents. However, these accidents are also related tomobile drilling units (MODUs), mobile production units (MOPUs), Monohulls and all fixed offshoreunits. Monohulls include floating production storage and offloading (FPSOs), floating storage vessels(FSOs), Floating Offshore Production Units (FPUs) and Floating Storage Units (FSUs). The fixedoffshore units considered were bottom-fixed installations (manned or unmanned) designated foraccommodation, drilling, production, compression, injection/riser, pumping or a combination ofthese [28].
The Task Error Categories were as follows: supervision, standard operation procedure, externalcommunication, internal communication and handover/takeover (Figure 4). Internal communicationwas found to be present in 55% of the 587 task errors coded. Supervision and external communicationwere present in 29% and 12% respectively, making them the second and third most significant trends.
Safety 2017, 3, 23 5 of 21
Figure 3. Accident Classification.
4.1.1. Task Errors
This paper has considered only offshore accidents. However, these accidents are also related to mobile drilling units (MODUs), mobile production units (MOPUs), Monohulls and all fixed offshore units. Monohulls include floating production storage and offloading (FPSOs), floating storage vessels (FSOs), Floating Offshore Production Units (FPUs) and Floating Storage Units (FSUs). The fixed offshore units considered were bottom-fixed installations (manned or unmanned) designated for accommodation, drilling, production, compression, injection/riser, pumping or a combination of these [28].
The Task Error Categories were as follows: supervision, standard operation procedure, external communication, internal communication and handover/takeover (Figure 4). Internal communication was found to be present in 55% of the 587 task errors coded. Supervision and external communication were present in 29% and 12% respectively, making them the second and third most significant trends.
Figure 4. Task Error Category Percentages Platforms.
4.1.2. Error Information
It is important to identify the equipment used in any activity that has led to an accident [22]. Much could be learned from technical equipment in the lead up to accidents, including improving the system of work, job procedures, industry standards and guidance and equipment design (ergonomics) among others. Results have shown that the main error information represents 24% of the accidents coded. However, details of the Technical Equipment shown in Figure 5 below shows that
Caught in or Between
19%
Fire/Explosion10%
Falls from Heights
5%Struckby39%
Other7%
Helicopter Crash
1%
Slips, Falls5%
Falling Objects 4%
Crushed by10%
29%
3%
12%
55%
2%0%
10%
20%
30%
40%
50%
60%
Supervision Standard OperationProcedure
ExternalCommunication
InternalCommunication
Handover,Takeover
Figure 4. Task Error Category Percentages Platforms.
4.1.2. Error Information
It is important to identify the equipment used in any activity that has led to an accident [22].Much could be learned from technical equipment in the lead up to accidents, including improving thesystem of work, job procedures, industry standards and guidance and equipment design (ergonomics)among others. Results have shown that the main error information represents 24% of the accidentscoded. However, details of the Technical Equipment shown in Figure 5 below shows that equipment

Safety 2017, 3, 23 6 of 22
involved in 58% of accidents are drilling tools, drilling pipes, risers and drill collars. Most of theseform part of the drilling string. Another example of technical equipment is the Control System at 34%.Attention was also given to alarm systems monitoring gas releases and other surveillance systems.These were involved in 4% of the total accidents coded. However, the coding of most equipment errorswas challenging.
Safety 2017, 3, 23 6 of 21
equipment involved in 58% of accidents are drilling tools, drilling pipes, risers and drill collars. Most of these form part of the drilling string. Another example of technical equipment is the Control System at 34%. Attention was also given to alarm systems monitoring gas releases and other surveillance systems. These were involved in 4% of the total accidents coded. However, the coding of most equipment errors was challenging.
Figure 5. Subtask for User Equipment.
4.1.3. Casualty Level
The final and coincidentally the lowest level within the Context of the Incident is the Casualty Level (Figure 6). This is because it occupies 20% of the Context of the Incident and the total number of accidents analysed.
Figure 6. Percentages of Casualty level.
The Primary High Casualty which characterised accidents that have led to fatalities or permanent disabilities was 10%. The Primary Low Level of Casualty involved accidents with significant but not necessarily permanent injuries. The Secondary High Level involved accidents that caused minor injuries but led to severe damage to equipment while the Secondary Low Level involved accidents with minor or no injuries and minor or no damage to equipment.
4.2. Operator Context
The first category of TRACEr taxonomy (Context of the Incident) focused more on identifying the errors, the location in which they took place and the people involved. The second category (Operator’s Context) is the largest level of the TRACEr taxonomy. As noted earlier, this category focuses on the factors that may or may not have influenced the performance of the operator. From Table 1 above, the operator context was analysed under three headings: External Error Mode (EEM), Cognitive Domain divided into Internal Error Mode (IEM) and Psychological Error Mechanism (PEM)) and Performance Shaping Factors (PSF). A total of 1326 errors were coded for the Operator’s
58%
4%
34%
4%
0%10%20%30%40%50%60%70%
Tools/Valves/DrillingPipes/Riser/Drill
Collars
Alarm System Control System Surveillance System
10%
71%
14%6%
0%
20%
40%
60%
80%
Primary High Primary Low Secondary High Secondary Low
Figure 5. Subtask for User Equipment.
4.1.3. Casualty Level
The final and coincidentally the lowest level within the Context of the Incident is the CasualtyLevel (Figure 6). This is because it occupies 20% of the Context of the Incident and the total number ofaccidents analysed.
Safety 2017, 3, 23 6 of 21
equipment involved in 58% of accidents are drilling tools, drilling pipes, risers and drill collars. Most of these form part of the drilling string. Another example of technical equipment is the Control System at 34%. Attention was also given to alarm systems monitoring gas releases and other surveillance systems. These were involved in 4% of the total accidents coded. However, the coding of most equipment errors was challenging.
Figure 5. Subtask for User Equipment.
4.1.3. Casualty Level
The final and coincidentally the lowest level within the Context of the Incident is the Casualty Level (Figure 6). This is because it occupies 20% of the Context of the Incident and the total number of accidents analysed.
Figure 6. Percentages of Casualty level.
The Primary High Casualty which characterised accidents that have led to fatalities or permanent disabilities was 10%. The Primary Low Level of Casualty involved accidents with significant but not necessarily permanent injuries. The Secondary High Level involved accidents that caused minor injuries but led to severe damage to equipment while the Secondary Low Level involved accidents with minor or no injuries and minor or no damage to equipment.
4.2. Operator Context
The first category of TRACEr taxonomy (Context of the Incident) focused more on identifying the errors, the location in which they took place and the people involved. The second category (Operator’s Context) is the largest level of the TRACEr taxonomy. As noted earlier, this category focuses on the factors that may or may not have influenced the performance of the operator. From Table 1 above, the operator context was analysed under three headings: External Error Mode (EEM), Cognitive Domain divided into Internal Error Mode (IEM) and Psychological Error Mechanism (PEM)) and Performance Shaping Factors (PSF). A total of 1326 errors were coded for the Operator’s
58%
4%
34%
4%
0%10%20%30%40%50%60%70%
Tools/Valves/DrillingPipes/Riser/Drill
Collars
Alarm System Control System Surveillance System
10%
71%
14%6%
0%
20%
40%
60%
80%
Primary High Primary Low Secondary High Secondary Low
Figure 6. Percentages of Casualty level.
The Primary High Casualty which characterised accidents that have led to fatalities or permanentdisabilities was 10%. The Primary Low Level of Casualty involved accidents with significant butnot necessarily permanent injuries. The Secondary High Level involved accidents that caused minorinjuries but led to severe damage to equipment while the Secondary Low Level involved accidentswith minor or no injuries and minor or no damage to equipment.
4.2. Operator Context
The first category of TRACEr taxonomy (Context of the Incident) focused more on identifying theerrors, the location in which they took place and the people involved. The second category (Operator’sContext) is the largest level of the TRACEr taxonomy. As noted earlier, this category focuses on thefactors that may or may not have influenced the performance of the operator. From Table 1 above,the operator context was analysed under three headings: External Error Mode (EEM), CognitiveDomain divided into Internal Error Mode (IEM) and Psychological Error Mechanism (PEM) andPerformance Shaping Factors (PSF). A total of 1326 errors were coded for the Operator’s Context

Safety 2017, 3, 23 7 of 22
which accounts for 50.71% of all errors coded. The Operator’s Context was further analysed basedon categories of observable outcomes presented in Figure 7 below: External Error mode (EEM) (18%),Cognitive Domain (IEM) (52%), Cognitive Domain (PEM) (25%) and Performance Shaping factors(PSF) (5%). Analyses of the Cognitive Domains (IEM, EEM and PEM) are shown in Figures 8–10 below.
Safety 2017, 3, 23 7 of 21
Context which accounts for 50.71% of all errors coded. The Operator’s Context was further analysed based on categories of observable outcomes presented in Figure 7 below: External Error mode (EEM) (18%), Cognitive Domain (IEM) (52%), Cognitive Domain (PEM) (25%) and Performance Shaping factors (PSF) (5%). Analyses of the Cognitive Domains (IEM, EEM and PEM) are shown in Figures 8–10 below.
Figure 7. Percentages for the Operators Context.
4.2.1. Cognitive Domain-External Error Mode
The External Error Mode evaluates the observable outcomes of the external errors shown in Figure 8: Communication, Selection/Quality and Timing/Sequence. The analysis showed poor selection/quality at (57%) of the EEM category, Poor communication at (26%) followed by inappropriate timing/sequence at (17%).
Figure 8. Percentages for the External Error Mode.
4.2.2. Cognitive Domain (Internal Error Mode)
A total of 692 errors were coded under the cognitive domain internal error mode representing 52% of the Operator’s Context (Figure 7 above). Further analyses of observable outcomes are shown in Figure 9 below. They cover action, decision-making, memory, perception and violation. The IEM considered in the first category, Action, are Selection error (32%), Timing error (31%) and Information transmission error (29%). Selection errors typically involve mistakes in the selection or choice of procedure, method or equipment for a particular task. The timing errors were due to time lapses. This could include actions that were not performed in time or errors performed coincidentally at a time when equipment failed, or an operator was found to be handling another task. Other errors in this category include information transmission error, errors due to actions not performed, data entry errors and the recording of unclear information.
The second category of the IEM is Decision-making, including Poor decisions and planning (41%) and Late decision/planning (36%), followed by No decision/planning (15%). Incorrect or reflex decisions
18%
52%
25%
5 %
0.00%
10.00%
20.00%
30.00%
40.00%
50.00%
60.00%
External Error Mode Cognitive Domain-Internal Error Mode
Cognitive Domain-Psychological Error
Mode
Performance ShapingFactor
26%
57%
17%
0%
10%
20%
30%
40%
50%
60%
Communication Selection/Quality Timing/Sequence
Figure 7. Percentages for the Operators Context.
4.2.1. Cognitive Domain-External Error Mode
The External Error Mode evaluates the observable outcomes of the external errors shown inFigure 8: Communication, Selection/Quality and Timing/Sequence. The analysis showed poorselection/quality at (57%) of the EEM category, Poor communication at (26%) followed by inappropriatetiming/sequence at (17%).
Safety 2017, 3, 23 7 of 21
Context which accounts for 50.71% of all errors coded. The Operator’s Context was further analysed based on categories of observable outcomes presented in Figure 7 below: External Error mode (EEM) (18%), Cognitive Domain (IEM) (52%), Cognitive Domain (PEM) (25%) and Performance Shaping factors (PSF) (5%). Analyses of the Cognitive Domains (IEM, EEM and PEM) are shown in Figures 8–10 below.
Figure 7. Percentages for the Operators Context.
4.2.1. Cognitive Domain-External Error Mode
The External Error Mode evaluates the observable outcomes of the external errors shown in Figure 8: Communication, Selection/Quality and Timing/Sequence. The analysis showed poor selection/quality at (57%) of the EEM category, Poor communication at (26%) followed by inappropriate timing/sequence at (17%).
Figure 8. Percentages for the External Error Mode.
4.2.2. Cognitive Domain (Internal Error Mode)
A total of 692 errors were coded under the cognitive domain internal error mode representing 52% of the Operator’s Context (Figure 7 above). Further analyses of observable outcomes are shown in Figure 9 below. They cover action, decision-making, memory, perception and violation. The IEM considered in the first category, Action, are Selection error (32%), Timing error (31%) and Information transmission error (29%). Selection errors typically involve mistakes in the selection or choice of procedure, method or equipment for a particular task. The timing errors were due to time lapses. This could include actions that were not performed in time or errors performed coincidentally at a time when equipment failed, or an operator was found to be handling another task. Other errors in this category include information transmission error, errors due to actions not performed, data entry errors and the recording of unclear information.
The second category of the IEM is Decision-making, including Poor decisions and planning (41%) and Late decision/planning (36%), followed by No decision/planning (15%). Incorrect or reflex decisions
18%
52%
25%
5 %
0.00%
10.00%
20.00%
30.00%
40.00%
50.00%
60.00%
External Error Mode Cognitive Domain-Internal Error Mode
Cognitive Domain-Psychological Error
Mode
Performance ShapingFactor
26%
57%
17%
0%
10%
20%
30%
40%
50%
60%
Communication Selection/Quality Timing/Sequence
Figure 8. Percentages for the External Error Mode.
4.2.2. Cognitive Domain (Internal Error Mode)
A total of 692 errors were coded under the cognitive domain internal error mode representing52% of the Operator’s Context (Figure 7 above). Further analyses of observable outcomes are shownin Figure 9 below. They cover action, decision-making, memory, perception and violation. The IEMconsidered in the first category, Action, are Selection error (32%), Timing error (31%) and Informationtransmission error (29%). Selection errors typically involve mistakes in the selection or choice ofprocedure, method or equipment for a particular task. The timing errors were due to time lapses.This could include actions that were not performed in time or errors performed coincidentally at atime when equipment failed, or an operator was found to be handling another task. Other errors inthis category include information transmission error, errors due to actions not performed, data entryerrors and the recording of unclear information.
The second category of the IEM is Decision-making, including Poor decisions and planning (41%)and Late decision/planning (36%), followed by No decision/planning (15%). Incorrect or reflex decisions

Safety 2017, 3, 23 8 of 22
are made instantaneously or in an attempt to save a situation, thereby jeopardizing safety. For example,an operator tries to stop a falling object but is crushed by it.
The next category, Memory, involves the failure to monitor a process that should be under scrutinythereby resulting in an accident. This includes Forgetting to monitor (46%) and Forgetting to request for orgive information (35%). The perception error which relates to the main internal error mode category hasa high relationship with the Not detected category (40%). This involves errors from failures that werenot detected, for example failures in the system or equipment. The last category of the IEM is violationand relates to routine violations. These occur due to complacency in job routines or an underestimationof the dangers involved.
Safety 2017, 3, 23 8 of 21
are made instantaneously or in an attempt to save a situation, thereby jeopardizing safety. For example, an operator tries to stop a falling object but is crushed by it.
The next category, Memory, involves the failure to monitor a process that should be under scrutiny thereby resulting in an accident. This includes Forgetting to monitor (46%) and Forgetting to request for or give information (35%). The perception error which relates to the main internal error mode category has a high relationship with the Not detected category (40%). This involves errors from failures that were not detected, for example failures in the system or equipment. The last category of the IEM is violation and relates to routine violations. These occur due to complacency in job routines or an underestimation of the dangers involved.
Figure 9. Percentages for Sub-levels of the Internal Error Mode (IEM).
4.2.3. Cognitive Domain (Psychological Error Mode)
Although there are two major branches of psychology that have a bearing on errors in safety and reliability, namely social and cognitive psychology, this paper is majorly on the cognitive aspects. The psychological error mode in the Cognitive Domain had 332 coded errors out of an overall 1326 for the Operator’s Context. The PEM is 25% of the Operator’s Context and is related to the perception category similar to the case of the IEM as seen in Figure 10 below.
The first category of the PEM, Action, is further broken down into Confused state (50%), Distraction (21%) and Fatigue (29%) as illustrated in Figure 10 below. The relationship between Action and Confused state is clearly illustrated. The Confused state is a state of mind in which
29%31%32%
7%
0% 1%
41%
15%
36%
2%6% 7%
46%
35%
13%
33%
40%
17%
1%
9%
53%
47%
0%
10%
20%
30%
40%
50%
60%
Info
rmat
ion
tran
smitt
ed e
rror
Tim
ing
Erro
r
Sele
ctio
n Er
ror
Actio
n no
t Per
form
ed
Data
Ent
ry E
rror
Reco
rdin
g w
rong
unc
lear
Info
Poor
dec
ision
/Pla
nnin
g
No
deci
sion/
Plan
ning
Late
Dec
ision
/ Pla
nnin
g
Hear
Am
iss
See
Amiss
Late
/Om
itted
Act
ion
Forg
ettin
g to
Mon
itor
Forg
ettin
g to
requ
est f
or o
r giv
e in
form
atio
n
Forg
ettin
g te
mpo
ral i
nfor
mat
ion
Phys
ical
Mis
Perc
eptio
n
Not
det
ecte
d
Late
Det
ectio
n
Hear
Am
iss
See
Amiss
Rout
ine
Viol
atio
n
Inte
nded
Vio
latio
n
Action Decision-Making Memory Perception Violation
Figure 9. Percentages for Sub-levels of the Internal Error Mode (IEM).
4.2.3. Cognitive Domain (Psychological Error Mode)
Although there are two major branches of psychology that have a bearing on errors in safetyand reliability, namely social and cognitive psychology, this paper is majorly on the cognitive aspects.The psychological error mode in the Cognitive Domain had 332 coded errors out of an overall 1326 forthe Operator’s Context. The PEM is 25% of the Operator’s Context and is related to the perceptioncategory similar to the case of the IEM as seen in Figure 10 below.
The first category of the PEM, Action, is further broken down into Confused state (50%), Distraction(21%) and Fatigue (29%) as illustrated in Figure 10 below. The relationship between Action andConfused state is clearly illustrated. The Confused state is a state of mind in which fatigue and stress

Safety 2017, 3, 23 9 of 22
are likely to be contributory factors. The second category of the PEM is Decision-Making, which relatesto the mindset category at 51%. Most decisions, especially in the context of incidents are stronglylinked to the mindset of the personnel involved. The third category of the psychological error modeis Memory at 11%, in relation to the sub-level miscommunication at 50% which involves errors incommunication during the various interactions between workers. The fourth and largest categoryof the PEM is Perception. Perception is linked with vigilance as evident in Figure 10 below at 78%.The category of vigilance evaluates the state of alertness and observance of the personnel on duty.Vigilance can also be influenced by a state of confusion or expectation which is evident when theemployee expects the error to be averted by any other factor. The final category of the PEM is Violationwhich relates to complacency (58%). Complacency is strongly influenced by states of overconfidence,pressure and stress while on duty.
Safety 2017, 3, 23 9 of 21
fatigue and stress are likely to be contributory factors. The second category of the PEM is Decision-Making, which relates to the mindset category at 51%. Most decisions, especially in the context of incidents are strongly linked to the mindset of the personnel involved. The third category of the psychological error mode is Memory at 11%, in relation to the sub-level miscommunication at 50% which involves errors in communication during the various interactions between workers. The fourth and largest category of the PEM is Perception. Perception is linked with vigilance as evident in Figure 10 below at 78%. The category of vigilance evaluates the state of alertness and observance of the personnel on duty. Vigilance can also be influenced by a state of confusion or expectation which is evident when the employee expects the error to be averted by any other factor. The final category of the PEM is Violation which relates to complacency (58%). Complacency is strongly influenced by states of overconfidence, pressure and stress while on duty.
Figure 10. Percentages for the Psychological Error Mode (PEM).
4.3. Further Discussion
The analysis covered all areas including the context of the incident, operator context and error recovery. It was found that poor communication remains a major precursor to offshore accidents. This involved internal communication between the officers in charge and the personnel on duty, communication between the crane operators, drillers, floor men, roustabouts and other operators working hand in hand to ensure productivity on offshore platforms. However, major communication issues also involved drillers and assistant drillers. In most of the drilling operations on the platform, several injuries arose from tasks carried out by more than one operator simultaneously with no adequate communication as to when each person’s task should be implemented. As noted by Graziano et al. [19] in the classification of human errors in grounding and collision accidents, it is difficult to use TRACEr to classify mechanical errors in the O&G industry caused by sudden facility failure without direct human participation.
50%
21%29%
21%26%
51%
2%
14%
25%
50%
9%2%
8%
78%
14% 13% 11%18%
58%
0%
10%
20%
30%
40%
50%
60%
70%
80%
90%
Conf
used
Sta
te
Dist
ract
ion
Fatig
ue
Com
pete
ncy/
Know
ledg
e
Failu
re to
con
sider
side
or l
ong
effe
ct
Min
d se
t
Mis-
Inte
rpre
tatio
n
Fatig
ue
Dist
ract
ion
Mis-
Com
mun
icat
ion
Ove
r Con
fiden
ce
Mem
ory
Ove
r loa
ded
Conf
used
Sta
te
Vigi
lanc
e
Expe
ctat
ion
Ove
r Con
fiden
ce
Stre
ss
Pres
sure
Com
plac
ency
Figure 10. Percentages for the Psychological Error Mode (PEM).
4.3. Further Discussion
The analysis covered all areas including the context of the incident, operator context and errorrecovery. It was found that poor communication remains a major precursor to offshore accidents.This involved internal communication between the officers in charge and the personnel on duty,communication between the crane operators, drillers, floor men, roustabouts and other operatorsworking hand in hand to ensure productivity on offshore platforms. However, major communicationissues also involved drillers and assistant drillers. In most of the drilling operations on the platform,several injuries arose from tasks carried out by more than one operator simultaneously with noadequate communication as to when each person’s task should be implemented. As noted byGraziano et al. [19] in the classification of human errors in grounding and collision accidents,it is difficult to use TRACEr to classify mechanical errors in the O&G industry caused by suddenfacility failure without direct human participation.

Safety 2017, 3, 23 10 of 22
The Operator’s Context revealed incorrect perception and therefore poor decision-making as itsmajor contributor. The Performance Shaping Factors also formed part of the Operator’s Context butit was revealed that its contribution to the whole was not significant. However, in this capacity,the major contributors to human error were the organisational factor Training and the personalfactor Competence which has had an effect on major events. TRACEr moreover appeared to neglectsome organisational factors contributing to error occurrence in the O&G industry. Baysari et al. [18]recommended modifications to include the following categories: environmental factors, infrastructuredesign/condition and safety. It may also be useful to consider these additional human factors as seenin the process industry: (1) personal/team factors (2) key job factors and (3) organisational factors.
The major contributors to Error Recovery were failures in the functional barrier system PrimaryLow Casualty level, in the context of the incident. It is recommended that the taxonomy be specificallyadapted to make it more effective for the O&G industry.
5. Development of TRACEr for the Oil and Gas Industry (TRACEr-OGI) (Section II)
The results of Section I showed that the three major divisions and seven categories of TRACEr areflexible and adaptable to the O&G industry. However, the tool could benefit from the addition of moretasks and sub-tasks specific to this industry. For example during the coding process, the followingcommon factors were difficult to code: failures due to inadequate facility (equipment error), nationaland international regulatory framework/standards, administrative duties such as inspections andenforcement of regulations and resources. Since the tool was designed to identify human factors whichfeed into human errors, the alignment of its taxonomy to the following major human factor contexts,namely job context, organisational/facility context and operator context would particularly enhanceits usability in the O&G industry.
To ensure that the core theoretical underpinnings and framework of TRACEr are not lost inthe development of the oil and gas version, existing versions (Table 3 below) and applications werereviewed to identify the taxonomy that would benefit the sector. The proposed modification also tookinto consideration oil and gas technical reports such as the 2014 Society of Petroleum Engineers (SPE)technical report The Human Factor: Process Safety and Culture. It was produced after a two-day summitheld in July 2012 on human factors affecting the O&G industry and the best way forward [29]. As anexample, the concept of offshore managed pressure drilling (MPD) or the MPD system and its effecton human performance was reviewed, focusing on human error. The communication structure duringMPD offshore drilling operation is shown if Figure 11 below.
Safety 2017, 3, 23 10 of 21
The Operator’s Context revealed incorrect perception and therefore poor decision-making as its major contributor. The Performance Shaping Factors also formed part of the Operator’s Context but it was revealed that its contribution to the whole was not significant. However, in this capacity, the major contributors to human error were the organisational factor Training and the personal factor Competence which has had an effect on major events. TRACEr moreover appeared to neglect some organisational factors contributing to error occurrence in the O&G industry. Baysari et al. [18] recommended modifications to include the following categories: environmental factors, infrastructure design/condition and safety. It may also be useful to consider these additional human factors as seen in the process industry: (1) personal/team factors (2) key job factors and (3) organisational factors.
The major contributors to Error Recovery were failures in the functional barrier system Primary Low Casualty level, in the context of the incident. It is recommended that the taxonomy be specifically adapted to make it more effective for the O&G industry.
5. Development of TRACEr for the Oil and Gas Industry (TRACEr-OGI) (Section II)
The results of Section I showed that the three major divisions and seven categories of TRACEr are flexible and adaptable to the O&G industry. However, the tool could benefit from the addition of more tasks and sub-tasks specific to this industry. For example during the coding process, the following common factors were difficult to code: failures due to inadequate facility (equipment error), national and international regulatory framework/standards, administrative duties such as inspections and enforcement of regulations and resources. Since the tool was designed to identify human factors which feed into human errors, the alignment of its taxonomy to the following major human factor contexts, namely job context, organisational/facility context and operator context would particularly enhance its usability in the O&G industry.
To ensure that the core theoretical underpinnings and framework of TRACEr are not lost in the development of the oil and gas version, existing versions (Table 3 below) and applications were reviewed to identify the taxonomy that would benefit the sector. The proposed modification also took into consideration oil and gas technical reports such as the 2014 Society of Petroleum Engineers (SPE) technical report The Human Factor: Process Safety and Culture. It was produced after a two-day summit held in July 2012 on human factors affecting the O&G industry and the best way forward [29]. As an example, the concept of offshore managed pressure drilling (MPD) or the MPD system and its effect on human performance was reviewed, focusing on human error. The communication structure during MPD offshore drilling operation is shown if Figure 11 below.
Figure 11. Communication structure during offshore drilling operation [30]. * Managed pressure drilling; ** Measurement while drilling. Figure 11. Communication structure during offshore drilling operation [30]. * Managed pressuredrilling; ** Measurement while drilling.

Safety 2017, 3, 23 11 of 22
Table 3. List of TRACEr modifications and field of study reviewed in the development of TRACEr for the Oil and Gas Industry (TRACEr-OGI).
Studies Title/Reference Technique (s)(TRACEr Version) Field of Study Predictive or
Retrospective Key Modifications, Recommendations and Use
Development and application of a human erroridentification tool for air traffic control [20] TRACEr (Original) Aviation (ATC) Both Comprehensive taxonomies describing context error,
operation error and error recovery.
Error Classification for Safety Management: Finding theRight Approach [31] TRACEr-lite (Derivative) Rail Retrospective Simplification of TRACEr (IEM) and (PEM) to create
TRACEr-lite’s internal (modes and mechanism).
Development, use and usability ofTRACER-RAV(technique for the retrospective analysisof cognitive errors—for Rail, Australian version) [26]
TRACEr-RAV (Derivative) Rail Retrospective
Modified to be more user-friendly and comprehensive thanThe original Rail. Addition of Psychological Error Mode.
Addition of classification (other rail personnel). Removal oferror correction performance factors.
A reliability and usability study of TRACEr-RAV: Thetechnique for the retrospective analysis of cognitive
errors e for rail, retrospective [25]
TRACEr-RAV Australianversion (Derivative) Rail Retrospective
Changed and simplified the original taxonomy categories tobe shorter. Two violations types were removed. Addition to
the information error category.
The classification and analysis of railway incidentreports [27]
TRACEr NottinghamUniversity version Rail Retrospective
Application of TRACEr in the railway context. Modificationof performance shaping factors category to capture widerissues such as procedure and documentation, training and
experience and communication.
Human error in European air traffic management: theHERA project [24]
TRACER- (the HERAproject) Derivate Original
Air trafficmanagement (ATM) Both TRACER is used for ‘HERA’—Human Error in Air Traffic
Management (ATM) project.
Classification of errors contributing to rail incidents andaccidents: A comparison of two human error
identification techniques [18]
A comparison of HFACSand TRACEr-rail version Rail Retrospective
• TRACEr is unable to capture factors associated witherror occurrence.
• TRACEr-rail appeared to neglect some organisationalfactors contributing to error occurrence. Baysari et al.[18] recommended modification to include categoriesfor environmental factors, infrastructuredesign/condition and safety culture (norms,organisational customs, etc.).
Predictive Analysis of Controllers’ Cognitive ErrorsUsing the TRACEr Technique: A Case Study in an
Airport Control Tower [32]TRACEr (Original) Aviation (Airport
control tower) Predictive • Application of TRACEr in airport control tower.
Structure of human errors in tasks of operators workingin the control room of an oil refinery unit [24] TRACEr (Original) Oil and Gas
(Refinery Unit) Retrospective • Application of TRACEr in the refinery unit context.
TRACEr-MAR—applying TRACEr in a maritimecontext [33] TRACEr-MAR Maritime Context Retrospective • Application of TRACEr in a maritime context.

Safety 2017, 3, 23 12 of 22
Furthermore, other techniques and taxonomies have been used in the O&G industry, for exampleHFACS-OGI, a modification by Theophilus et al. [16]. Investigation tools for the petroleum industry,human factors investigation tool (HFIT) developed by Gordon [13], were also reviewed. Followingteam discussions with 10 oil and gas professionals and 40 oil and gas scholars, it was determinedthat TRACEr for the O&G industry should retain three major divisions. These are: (1) Context of theAccident; (2) Operator’s Context and (3) Error Recovery which also take into account the physical,psychological and external factors. Following these reviews, the following TRACEr for the O&Gindustry (TRACEr-OGI) (Table 4 and Figure 12 below) has been proposed:
Table 4. Levels and subdivisions of TRACEr-OGI taxonomy.
Major Divisions Category Subdivisions Example (Not Exhaustive)
Context of theincident
1. Task Error
Task error relate to
I. WHAT is the task performed unsatisfactorily by (e.g., the drillingsupervisor, drilling engineer, mud engineer, driller, . . .(Supervision, Standard Operation, Handover/Takeover, welltesting, crane operations, electrical/mechanical operations, jobhazard analysis and material and equipment)? selection).
II. WHERE was the task performed (e.g., fixed platform, floatingproduction storage and offloading, FPSO, helidecks, etc.)?
III. WHO performed the task (e.g., the drilling supervisor, drillingengineer, etc)?
2. Error Information
Error Information relates to:
I. Equipment involved (e.g., drilling string, blow out preventer BOP,alarm system, control system, surveillance system, etc)
II. Information not taken into account (size, dimension, etc).
3. Equipment Error
Equipment Error relates to:
I. Mechanical integrity (e.g., design error, installation error,operational error, corrosion, poor maintenance, inadequateinspection, etc.)
4. Casualty Level
This defines the level of casual contribution.
I. MinorII. MajorIII. Catastrophic
Operator Context5. External Error Mode
(EEM)
This is potential external error. This is majorly:
I. Error of omissionII. Error of commissionIII. Extraneous error
6. Cognitive Domain
I. Internal Error Mode(IEM)
II. Psychological ErrorMechanism (PEM)
The subdivision relates to the five cognitive domains originallyproposed by Shorrock and Kirwan [20] and the addition of the sixthcalled sabotage. It focuses on the cognitive framework that potentiallyapplies to the error coded. The cognitive domains are:
I. Perception;II. Memory;III. Decision-Making;IV. Action;V. Violation andVI. Sabotage
In the first four categories the error is non-intentional while in the lasttwo categories “Violation and sabotage” the error is considered as anintended violation of rules.These two (IEM and PEM) represent the cognitive function that failed.For example:
I. risk recognition failureII. poor decision-makingIII. no decision

Safety 2017, 3, 23 13 of 22
Table 4. Cont.
Major Divisions Category Subdivisions Example (Not Exhaustive)
7. Performance ShapingFactors(PSF)/Human Factors
Relates to factors that influence the performance of the crew. The PSFcategories for TRACEr-OGI are based three key areas involved in the oiland gas industry as follows IOGP [34]:
I. Personal/Team factorsII. Job factorsIII. Organisational factors
Control Barriersand Recovery
Measure
8. Hardware Barriers
Relates to ‘primary containment, process equipment and engineeredsystems designed and managed to prevent loss of primary containment(LOPC) and other types of asset integrity or process safety events andmitigate any potential consequences of such events. These are checkedand maintained by people (in critical activity/tasks) [35]’. Categories ofhardware barriers implemented by the oil and gas industry are [35]:
I. Structural IntegrityII. Process ContainmentIII. Ignition ControlIV. Detection SystemsV. Protection Systems—including deluge and firewater systemsVI. Shutdown Systems—including operational well isolation and
drilling well control equipment.VII. Emergency ResponseVIII. Life-saving Equipment—including evacuation systems
9. Human Barriers
Relates to ‘barriers that rely on the actions of people capable of carryingout activities designed to prevent LOPC and other types of assetintegrity or process safety events and mitigate any potentialconsequences of such events [35]’. Categories of human barriersimplemented by the oil and gas industry are [35]:
I. Operating in accordance with procedures, e.g., Isolation ofequipment overrides and inhibits of safety systems, shift handover.
II. Surveillance, operator rounds and routine inspectionIII. Authorization of temporary and mobile equipmentIV. Acceptance of handover or restart of facilities or equipmentV. Response to process alarm and upset conditionsVI. Response to emergencies
Safety 2017, 3, 23 13 of 21
(PSF)/Human Factors
as follows IOGP [34]: I. Personal/Team factors
II. Job factors III. Organisational factors
Control Barriers and Recovery Measure
8. Hardware Barriers
Relates to ‘primary containment, process equipment and engineered systems designed and managed to prevent loss of primary containment (LOPC) and other types of asset integrity or process safety events and mitigate any potential consequences of such events. These are checked and maintained by people (in critical activity/tasks) [35]’. Categories of hardware barriers implemented by the oil and gas industry are [35]: I. Structural Integrity II. Process Containment III. Ignition Control IV. Detection Systems V. Protection Systems—including deluge and firewater systems VI. Shutdown Systems—including operational well isolation and drilling
well control equipment. VII. Emergency Response VIII. Life-saving Equipment—including evacuation systems
9. Human Barriers
Relates to ‘barriers that rely on the actions of people capable of carrying out activities designed to prevent LOPC and other types of asset integrity or process safety events and mitigate any potential consequences of such events [35]’. Categories of human barriers implemented by the oil and gas industry are [35]: I. Operating in accordance with procedures, e.g., Isolation of equipment
overrides and inhibits of safety systems, shift handover. II. Surveillance, operator rounds and routine inspection
III. Authorization of temporary and mobile equipment IV. Acceptance of handover or restart of facilities or equipment V. Response to process alarm and upset conditions
VI. Response to emergencies
Figure 12. Relationship between TRACEr-OGI classification systems (Adapted from Shorrock Kirwan [20]).
5.1. Analysis of the Proposed Taxonomy for the Oil and Gas Industry (TRACEr-OGI)
5.1.1. Context of the Incident
As noted in Table 1 above, Task Error deals with particular tasks, their locations and who performed them. In this paper, all information that helped to uncover any task error was taken into consideration. Categories based on the rig, the floating production storage and offloading (FPSO)
Figure 12. Relationship between TRACEr-OGI classification systems (Adapted from Shorrock Kirwan [20]).

Safety 2017, 3, 23 14 of 22
5.1. Analysis of the Proposed Taxonomy for the Oil and Gas Industry (TRACEr-OGI)
5.1.1. Context of the Incident
As noted in Table 1 above, Task Error deals with particular tasks, their locations and who performedthem. In this paper, all information that helped to uncover any task error was taken into consideration.Categories based on the rig, the floating production storage and offloading (FPSO) and the deckswere considered, among others. The user tasks classified for these locations are Supervision, StandardOperation Procedure, External Communication, Internal Communication, Hand-Over, and Take-Over.
The O&G industry is characterised by the rapid and steady technological development of essentialsafety critical equipment [36]. Examples are alarm systems, control systems and surveillance systems,etc. The second context of the incident Error Information was used to classify information not taken intoaccount (size, dimension, etc.) [4,21,22]. This information is usually connected to the exact locationwhere the error occurred, for example deck dimension, vessel size, etc. [22].
The third context of the incident and a major modification is the addition of Equipment Errorused to classify mechanical errors. Although TRACEr considers both equipment and information nottaken into account, Graziano et al. [22] noted that TRACEr could not code mechanical errors causedby sudden facility failure without direct human participation. In the O&G industry, there is a verystrong relationship between the contributory elements of asset integrity, namely personnel integrity,operational integrity and mechanical integrity [37]. Studies have shown that these three elementsare ‘interrelated and the performance of one element has a great influence on the others’. [37] Typicalexamples of equipment error in the O&G industry include corrosion, Struvite related pipe explosion,cavitation, hydrogen shock, thermal fracture and pressure burst, among many others [37,38].
The last context of the incident is the Casualty Level, which for TRACEr-OGI was divided intominor, major and catastrophic levels. The catastrophic level involves accidents that led to fatalities andextensive facility damage, the major level involves incidents that resulted in major facility damages orsevere/permanent injuries, while the minor levels involve accidents with minor damage to equipmentand slight injuries to personnel requiring first aid attention.
5.1.2. The Operator’s Context
As in the original TRACEr, this section of the taxonomy focused more on the internal andexternal factors that affect the performance of the operator. The Operator’s Context includes(1) the External Error Mode (EEM—Table 5) and (2) the Cognitive Domains encompassing InternalError Mode (IEM—Table 6) Psychological Error Modes (PEMs—Table 7) and Performance Shaping Factors(PSFs—Table 8) [22,39].
Table 5. External Error Mode Taxonomy of observable outcomes.
External Error Mode
Communication Selection/Quality Timing/Sequence
Transmitted Incomplete information Too little Action Prolonged ActionRecorded Incorrect Information Omission Late ActionFailure to transmit information Too much action Early ActionRecording unclear information Wrongly Directed Action
Transmitting unclear Information Right on Wrong Object ActionFailure to Record Information Wrong on Right Object Action
Failure to sort information or sorting wrongly Wrong on Wrong Object Action

Safety 2017, 3, 23 15 of 22
Table 6. Internal Error Mode Taxonomy observable outcomes.
Cognitive Domain: Example
Perception Not detected, Late Detection, Read Amiss, Hear Amiss, See Amiss
Memory Late/Omitted Action, Forgetting to Monitor, Forgetting to requestfor or give information, Forgetting temporal information.
Judgement, Planning andDecision-Making
Wrong decision/Planning, No decision/Planning, LateDecision/Planning, Read Amiss, Hear Amiss, See Amiss, etc.
Action Execution information transmitted error, timing error, selection error, actionnot performed, data entry error, recording wrong unclear info
Violation
Routine ViolationIntended Violation(In routine and intended violation, there is no intention to causedeliberate harm)
Sabotage In this form of violation, all layers of protection are deliberatelyremoved with the intention to cause harm.
Table 7. Psychological Error Mode taxonomy.
Cognitive Domain: Psychological Error Mode Observable OutcomesAction Decision-Making Memory Perception Violation
Confused State Mind-set Over Confidence Confused State Over Confidence
Intrusion of Habit Failure to considerside or long effect
MemoryOverloaded Vigilance Complacency
Table 8. Performance shaping factor/human factor [16,40].
Human FactorCategories
Performance InfluencingFactor Categories Performance Influencing Sub-Categories
Personal/Team Factors
Individual factors Health, Emotional tension, Age, Gender, etc.
Dependent factors
Skill level, Contractor adaptability, Knowledge andExperience, Motivation, Safety awareness,Personal/team factors/competence, Supervision,Tiredness, Stress, and Fatigue, Illness, Discomfort,Workload, Crew resource management, Personalreadiness, etc.
Job Factors
Anthropometry Basic layout of the working environment
Environment and Factors(e.g., working conditions)
Weather, Timing, Physical environment(e.g., physical conditions like temperature, humidity,light, noise, etc.), Contractor Environment,Technological Environment, etc.
Design of Human-MachineInterface (HMI)
Positioning and layout of HMI, Usability, Quality offeedback, etc.
Organisational Factors
Employee related factor
Organisational Policies, Process Safety Culture,Safety Climate, Resource management,Organisational process, Management of change,Inattention, Staffing (clearness in responsibilities),Level of training and instruction on work/task,Inadequate supervision, Supervisory violationsPlanned inappropriate operations, Failed to correctknown problem, etc.
Standard factorCompany standards, rules, and guidance,Task designPermit to work, Safe system of work procedure, etc.
External influencesInternational industry standardsNational regulatory framework, Approved Code ofPractice (ACoP)
Safety 2017, 3, 23 16 of 22
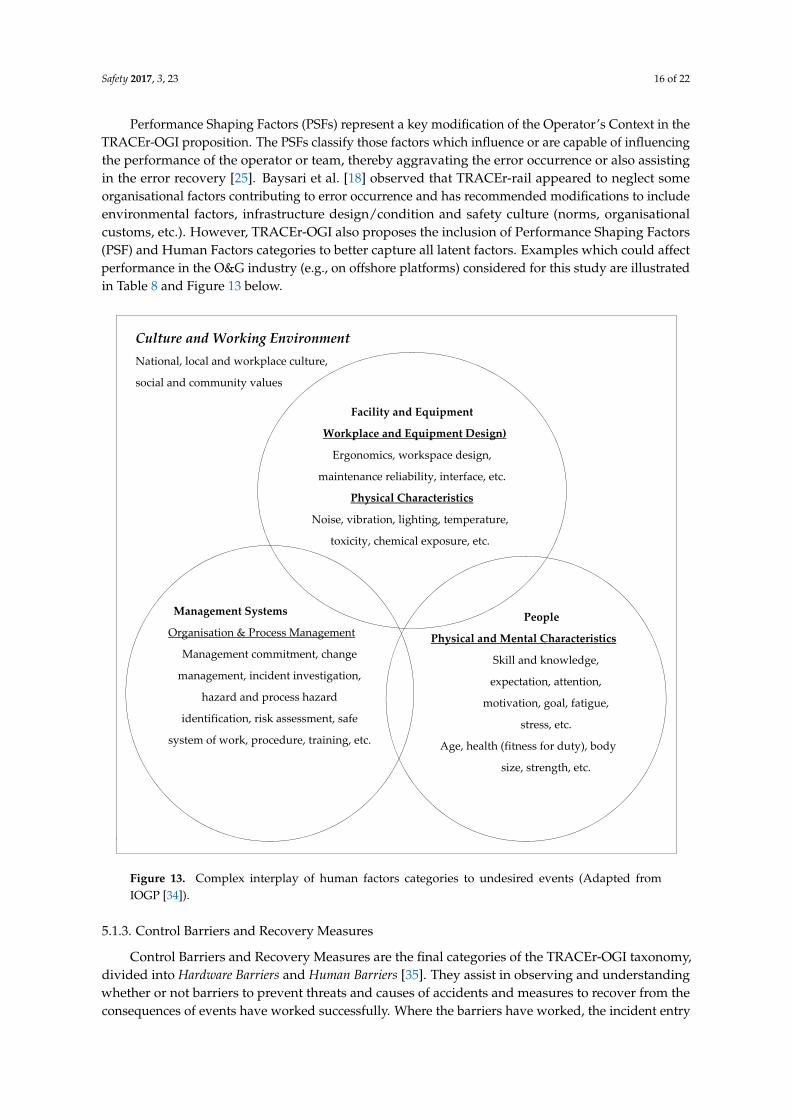
Performance Shaping Factors (PSFs) represent a key modification of the Operator’s Context in theTRACEr-OGI proposition. The PSFs classify those factors which influence or are capable of influencingthe performance of the operator or team, thereby aggravating the error occurrence or also assistingin the error recovery [25]. Baysari et al. [18] observed that TRACEr-rail appeared to neglect someorganisational factors contributing to error occurrence and has recommended modifications to includeenvironmental factors, infrastructure design/condition and safety culture (norms, organisationalcustoms, etc.). However, TRACEr-OGI also proposes the inclusion of Performance Shaping Factors(PSF) and Human Factors categories to better capture all latent factors. Examples which could affectperformance in the O&G industry (e.g., on offshore platforms) considered for this study are illustratedin Table 8 and Figure 13 below.
Safety 2017, 3, 23 16 of 21
\
Figure 13. Complex interplay of human factors categories to undesired events (Adapted from IOGP [34]).
5.1.3. Control Barriers and Recovery Measures
Control Barriers and Recovery Measures are the final categories of the TRACEr-OGI taxonomy, divided into Hardware Barriers and Human Barriers [35]. They assist in observing and understanding whether or not barriers to prevent threats and causes of accidents and measures to recover from the consequences of events have worked successfully. Where the barriers have worked, the incident entry is classified as a near miss and where they did not work, it becomes an accident. That said, near misses were not considered in the context of this study. Figure 14 below illustrates a generic arrangement of control barriers and recovery measures in the O&G industry.
People
Physical and Mental Characteristics
Skill and knowledge,
expectation, attention,
motivation, goal, fatigue,
stress, etc.
Age, health (fitness for duty), body
size, strength, etc.
Management Systems
Organisation & Process Management
Management commitment, change
management, incident investigation,
hazard and process hazard
identification, risk assessment, safe
system of work, procedure, training, etc.
Facility and Equipment
Workplace and Equipment Design)
Ergonomics, workspace design,
maintenance reliability, interface, etc.
Physical Characteristics
Noise, vibration, lighting, temperature,
toxicity, chemical exposure, etc.
Culture and Working Environment National, local and workplace culture,
social and community values
Figure 13. Complex interplay of human factors categories to undesired events (Adapted fromIOGP [34]).
5.1.3. Control Barriers and Recovery Measures
Control Barriers and Recovery Measures are the final categories of the TRACEr-OGI taxonomy,divided into Hardware Barriers and Human Barriers [35]. They assist in observing and understandingwhether or not barriers to prevent threats and causes of accidents and measures to recover from theconsequences of events have worked successfully. Where the barriers have worked, the incident entry

Safety 2017, 3, 23 17 of 22
is classified as a near miss and where they did not work, it becomes an accident. That said, near misseswere not considered in the context of this study. Figure 14 below illustrates a generic arrangement ofcontrol barriers and recovery measures in the O&G industry.Safety 2017, 3, 23 17 of 21
Figure 14. Generic arrangement of control barriers and recovery measures in the O&G industry (Adapted from IOGP [35]).
6. Reliability and Usability of the Proposed TRACEr-OGI
Following the modifications to TRACEr, it was anticipated that TRACEr-OGI would be less difficult to use, more suitable and more comprehensive in identifying errors and moreover, could be applied more consistently (i.e., show greater inter-rater reliability). The inter-rater reliability is the most critical criterion on which to judge a taxonomy [25]. Inter-rater is a measure of the extent to which different raters give the same coding for the same observed performance [13,41]. Another critical criterion when adopting a tool in a new context is its usability (is it ambiguous or easy to use?) [20,25,26,42]. Improved usability will mean less errors and improved consistency [25,42]. Therefore, the inter-rater reliability and usability of the two human error identification tools were compared: TRACEr and the proposed TRACEr-OGI. To achieve this, eighteen participants were required to use TRACEr and TRACEr-OGI to code a notable offshore accident following the procedure outlined in Section 3.1 above. The participants were nine Oil and Gas Engineering MSc students and nine Petroleum and Environmental Technology MSc students. All participants had oil and gas related undergraduate degree with some previous work experience in oil and gas industry. Before the coding process, participants took an 11 week long process safety module with specific topics on human factors (HF) and human error identification (HEI). They had also used TRACEr for a coursework exercise. IBM Statistical Package for the Social Sciences (SPSS) 24 was used to determine the inter-rater reliability for each of the rater pairs within a group. In line with the method outlined by Baysari et al. [25], the participants were given a usability questionnaire at the end of the coding process for both TRACEr and TRACEr-OGI. IBM SPSS 24 was also used to derive the proportion (%) in each group that agreed with the usability questionnaire statements.
Results
The most common error categories chosen by the raters were the Causality level (where 96% and 97% of raters chose this category); the Cognitive Domain (93% and 92%) and Error Information (93% and 92% ) for TRACEr and TRACEr-OGI respectively (Table 9 below). It should be noted that the new categories of Equipment Error and Control Barriers and Recovery Measures were consequently nil for TRACEr, but scored 72% for TRACEr-OGI in Table 9 below. It could be argued that subcategories of Control Barriers and Recovery Measures, which are divided into easily identifiable oil and gas barriers, simplified error identification at 90% (Table 9). Significantly, mechanical errors caused by sudden facility failure without direct human participation which had been difficult to capture using TRACEr [22], could now be captured with TRACEr-OGI. Raters noted that it was now easier to code errors due to failures in process equipment.
HardwareHardware Hardware Hardware
Human Human Human Human
Control Barriers Recovery Measure
Hardware Barriers
(Safety System Integrity)
Human Barriers
(Operation Discipline)
Consequence EventThreat/Cause
+
Figure 14. Generic arrangement of control barriers and recovery measures in the O&G industry(Adapted from IOGP [35]).
6. Reliability and Usability of the Proposed TRACEr-OGI
Following the modifications to TRACEr, it was anticipated that TRACEr-OGI would be lessdifficult to use, more suitable and more comprehensive in identifying errors and moreover, couldbe applied more consistently (i.e., show greater inter-rater reliability). The inter-rater reliability isthe most critical criterion on which to judge a taxonomy [25]. Inter-rater is a measure of the extentto which different raters give the same coding for the same observed performance [13,41]. Anothercritical criterion when adopting a tool in a new context is its usability (is it ambiguous or easyto use?) [20,25,26,42]. Improved usability will mean less errors and improved consistency [25,42].Therefore, the inter-rater reliability and usability of the two human error identification tools werecompared: TRACEr and the proposed TRACEr-OGI. To achieve this, eighteen participants wererequired to use TRACEr and TRACEr-OGI to code a notable offshore accident following the procedureoutlined in Section 3.1 above. The participants were nine Oil and Gas Engineering MSc students andnine Petroleum and Environmental Technology MSc students. All participants had oil and gas relatedundergraduate degree with some previous work experience in oil and gas industry. Before the codingprocess, participants took an 11 week long process safety module with specific topics on human factors(HF) and human error identification (HEI). They had also used TRACEr for a coursework exercise.IBM Statistical Package for the Social Sciences (SPSS) 24 was used to determine the inter-rater reliabilityfor each of the rater pairs within a group. In line with the method outlined by Baysari et al. [25],the participants were given a usability questionnaire at the end of the coding process for both TRACErand TRACEr-OGI. IBM SPSS 24 was also used to derive the proportion (%) in each group that agreedwith the usability questionnaire statements.
Results
The most common error categories chosen by the raters were the Causality level (where 96% and97% of raters chose this category); the Cognitive Domain (93% and 92%) and Error Information (93%and 92%) for TRACEr and TRACEr-OGI respectively (Table 9 below). It should be noted that the newcategories of Equipment Error and Control Barriers and Recovery Measures were consequently nilfor TRACEr, but scored 72% for TRACEr-OGI in Table 9 below. It could be argued that subcategoriesof Control Barriers and Recovery Measures, which are divided into easily identifiable oil and gasbarriers, simplified error identification at 90% (Table 9). Significantly, mechanical errors caused by

Safety 2017, 3, 23 18 of 22
sudden facility failure without direct human participation which had been difficult to capture usingTRACEr [22], could now be captured with TRACEr-OGI. Raters noted that it was now easier to codeerrors due to failures in process equipment.
Table 9. Average percentage agreement from all participants using TRACEr and TRACEr-OGI.
Categories % of Raters Who Found this Category to Be a Cause of the Accident
TRACEr TRACEr-OGI
Task error 94 78Error information 93 92Equipment Error - 72
External error modes 65 75Cognitive domain 91 93
Internal error modes 77 83Psychological error mechanisms 65 79
Performance shaping errors 89 80Causality level 96 97
Control Barriers and Recovery Measure - 90Mean 67 84
A key statistic for the measurement of inter-rater reliability was Cohen’s kappa, developed byJacob Cohen [43]. Values of Cohen’s kappa can vary from 0 to 1, where a value of 0 denotes noagreement between raters, while a value of 1 reflects perfect reliability between raters. The essence ofthis reliability test was to ascertain whether TRACEr-OGI would obtain a percentage agreement of atleast 70%. The results for the raters with Kappa values ≥ 0.6 (named R1 to R4) are displayed in Table 10below. Columns 3 and 6 show the rater pairs with a substantial level of agreement, having a Cohen’skappa value above 0.6. In instances where Cohen’s kappa values of 0.644 and 0.669 (TRACEr-OGI) and0.679 and 0.664 (TRACEr) were observed, for consistency these values are said to be at the threshold ofacceptability. The Kappa value was found to be satisfactorily consistent as there was at least 83.9%agreement between the rater pair under consideration and all the values were significant at a levelp < 0.05. However, TRACEr-OGI had a better overall percentage agreement.
Table 10. The percentage agreement among raters for TRACEr-OGI.
Raters * (R) PercentageAgreement
Kappa(k) * p-Value Percentage
AgreementKappa
(k) * p-Value
TRACEr-OGI TRACEr
R1 vs. R2 91.6% 0.746 0.00 86.7% 0.725 0.00R1 vs. R3 92.7% 0.764 0.00 84.6% 0.679 0.00R1 vs. R4 88.5% 0.644 0.00 83.9% 0.664 0.00R2 vs. R3 91.6% 0.724 0.00 86.7% 0.723 0.00R2 vs. R4 89.5% 0.669 0.00 87.4% 0.738 0.00R3 vs. R4 92.7% 0.753 0.00 89.5% 0.779 0.00
* Only inter-raters with Kappa values ≥ 0.6 were rename R1 to R4 and shown. Cohen suggested the Kappa resultbe interpreted as follows: values ≤ 0 as indicating no agreement and 0.01–0.20 as none to slight, 0.21–0.40 as fair,0.41–0.60 as moderate, 0.61–0.80 as substantial, and 0.81–1.00 as almost perfect agreement [44].
The majority of the raters as shown in Table 11 found the steps of both TRACEr (78%) andTRACEr-OGI (83%) easy. However, more raters found TRACEr recording form easier to use than thatof TRACER-OGI.
Safety 2017, 3, 23 19 of 22
Table 11. Participants rating of ease of use.
Questions TRACEr TRACEr-OGI
How easy did you find it while completing the steps? 78 83Where the instructions/directions easy to follow? 78 89
Did you find the category descriptions easy to use? 78 83Did the tool cover all of your errors/factors? 78 83
Were the categories independent? 56 61Were the examples included helpful? 94 89
Was the recording form easy to use/follow? 100 94
7. Discussion and Conclusions
Learning lessons from the analysis of a large set of offshore accident data could help to improvesafety performance. Hence, the present study aimed to apply TRACEr in the O&G industry todetermine changes required to make the tool more useful and effective and to propose TRACEr-OGI,a version specific to the industry. This tool was used for a systematic and retrospective analysisof 163 offshore accident reports. It was shown that the tool was useful in identifying task errors,predominant contexts in which these errors occurred and any contributory factors. Results foundthat poor communication remains a major precursor to offshore accidents, including internalcommunication between officers in charge and personnel on duty, communication between craneoperators, drillers, floor men, roustabouts, and other operators working on offshore platforms. Majorcommunication issues were also found to involve drillers and assistant drillers. Several injuries arosefrom a lack of communication between operators working simultaneously on drilling operations tasks.The Operator’s Context revealed errors in perception and subsequent poor decision-making as itsmajor contributors. The Performance Shaping Factors formed part of the Operator’s Context butits overall contribution was insignificant. Overall, the major contributors to human error were theorganisational factor Training and the personal factor Competence. The major contributors to ErrorRecovery were failures in the functional barrier system Primary Low Casualty level, in the context of theincident. It is recommended that the taxonomy be specifically adapted to makes it more effective forthe O&G industry or used with another human factor analytical tool.
This study was limited by a number of factors. Some of the reports were not sufficiently exhaustiveto reveal the true state of the accident. Hence, error detection was a challenge in these situations.Accident codes under violations, both routine and intended, were challenging as it was difficult toassess whether the employee acted deliberately or out of ignorance or reflex. Again, it was challengingto ascertain the state of mind of an individual before the violation leading to an accident had occurred.For example, it was difficult to identify when stress, pressure, confused state or overconfidence underthe psychological error mode was involved. Moreover, the classification of errors using the TRACERand TRACEr-OGI may sometimes be subject to interpretation with respect to accident reports. In suchcases, the experience and knowledge of the analyst are as important as the systematic coding ofthe events.
In conclusion, the results showed that the specific adaptation of the taxonomy for the O&Gindustry would be useful, or that it could be used with another human factor analysis tool. For example,although it proved difficult to use TRACEr to code equipment failures, TRACEr-OGI was not onlyable to identify human errors aligned to job context, organisational/facility context and operatorcontext, it was also able to capture equipment error. It was shown therefore that TRACEr issufficiently flexible and adaptable for the O&G industry. Although as expected the results of themodification made marginal difference in usability and reliability, TRACEr-OGI enhanced percentagerater agreement. It also made the coding of key aspects of oil and gas facility failures possible.The results of the modification therefore could inform potential decisions that will aid offshore processsafety development.

Safety 2017, 3, 23 20 of 22
Author Contributions: Stephen C. Theophilus conceived the study, supervised the project and wrote the paper.Ikpang E. Ekpenyong assisted in execution and the analysis of data. Augustine O. Ifelebuegu, Andrew O. Arewaand George Agyekum-Mensah reviewed the paper. Tochukwu O. Ajare assisted in further data collection followingreviewers’ comments.
Conflicts of Interest: The authors declare no conflict of interest.
References
1. Pate-Cornell, M.E. Learning from the piper alpha accident: A postmortem analysis of technical andorganizational factors. Risk Anal. 1993, 13, 215–232. [CrossRef]
2. Gordon, R.P.E. The contribution of human factors to accidents in the offshore oil industry. Reliab. Eng.Syst. Saf. 1998, 61, 95–108. [CrossRef]
3. HSE. A Human Factors Roadmap for the Management of Major Hazards. Available online: http://www.hse.gov.uk/humanfactors/resources/hf-roadmap.pdf (accessed on 8 Ocotber 2016).
4. Vinnem, J.-E. Lessons from Major Accidents. In Offshore Risk Assessment vol 1; Springer Series in ReliabilityEngineering; Springer: London, UK, 2014; pp. 95–163. ISBN 978-1-4471-5206-4.
5. International Association of Oil & Gas Producers (IOGP). Risk Assessment Data Directory; InternationalAssociation of Oil & Gas Producers (IOGP): Auderghem, Belgium, 2010.
6. Mearns, K.; Flin, R. Risk perception and attitudes to safety by personnel in the offshore oil and gas industry:A review. J. Loss Prev. Process Ind. 1995, 8, 299–305. [CrossRef]
7. Tang, D.K.H.; Leiliabadi, F.; Olugu, E.U.; Md Dawal, S.Z. binti Factors affecting safety of processes in theMalaysian oil and gas industry. Saf. Sci. 2017, 92, 44–52. [CrossRef]
8. Cooke, G.; Sheers, R. Safety case implementation—An Australian regulator’s experience. In Institutionof Chemical Engineers Symposium Series; Institution of Chemical Engineers: Rugby, UK, 2003; Volume 149,pp. 605–618.
9. Arewa, A.O.; Farrell, P. A review of compliance with health and safety regulations and economic performancein small and medium construction enterprises. In Proceedings of the 28th Annual ARCOM Conference,Edinburgh, UK, 3–5 September 2012; pp. 3–5.
10. Griffin, T.G.C.; Young, M.S.; Stanton, N.A. Human Factors Models for Aviation Accident Analysis and Prevention;Ashgate Publishing Company: Burlington, VT, USA, 2015; ISBN 978-1-4724-3275-9.
11. Reason, J. The contribution of latent human failures to the breakdown of complex systems. Philos. Trans. R.Soc. Lond. B Biol. Sci. 1990, 327, 475–484. [CrossRef] [PubMed]
12. Viale, A.; Reinach, S.J. A Pilot Examination of a Joint Railroad Management-Labor Approach to Root CauseAnalysis of Accidents, Incidents, and Close Calls in a Diesel and Car Repair Shop Environment; U.S. Department ofTransportation, Federal Railroad Administration, Office of Research and Development: Washington, DC,USA, 2006.
13. Gordon, R.; Flin, R.; Mearns, K. Designing and evaluating a human factors investigation tool (HFIT) foraccident analysis. Saf. Sci. 2005, 43, 147–171. [CrossRef]
14. Hollnagel, E. Chapter 9—The Quantification of Predictions. In Cognitive Reliability and Error Analysis Method(CREAM); Elsevier Science Ltd.: Oxford, UK, 1998; pp. 234–261, ISBN 978-0-08-042848-2.
15. Boring, R.L. Fifty years of THERP and human reliability analysis. In Proceedings of the Probabilistic SafetyAssessment and Management and European Safety and Reliability Conference (PSAM 11 & ESREL 2012),Helsinki, Finland, 25–29 June 2012.
16. Theophilus, S.C.; Esenowo, V.N.; Arewa, A.O.; Ifelebuegu, A.O.; Nnadi, E.O.; Mbanaso, F.U. Human factorsanalysis and classification system for the oil and gas industry (HFACS-OGI). Reliab. Eng. Syst. Saf. 2017, 167,168–176. [CrossRef]
17. Zhan, Q.; Zheng, W.; Zhao, B. A hybrid human and organizational analysis method for railway accidentsbased on HFACS-Railway Accidents (HFACS-RAs). Saf. Sci. 2017, 91, 232–250. [CrossRef]
18. Baysari, M.T.; Caponecchia, C.; McIntosh, A.S.; Wilson, J.R. Classification of errors contributing to railincidents and accidents: A comparison of two human error identification techniques. Saf. Sci. 2009, 47,948–957. [CrossRef]
19. Baysari, M.T.; McIntosh, A.S.; Wilson, J.R. Understanding the human factors contribution to railway accidentsand incidents in Australia. Accid. Anal. Prev. 2008, 40, 1750–1757. [CrossRef] [PubMed]

Safety 2017, 3, 23 21 of 22
20. Shorrock, S.T.; Kirwan, B. Development and application of a human error identification tool for air trafficcontrol. Appl. Ergon. 2002, 33, 319–336. [CrossRef]
21. Murphy, D.M.; Paté-Cornell, M.E. The SAM framework: Modeling the effects of management factors onhuman behavior in risk analysis. Risk Anal. 1996, 16, 501–515. [CrossRef] [PubMed]
22. Graziano, A.; Teixeira, A.P.; Guedes Soares, C. Classification of human errors in grounding and collisionaccidents using the TRACEr taxonomy. Saf. Sci. 2016, 86, 245–257. [CrossRef]
23. Wickens, C.D.; Hollands, J.G. Engineering Psychology and Human Performance, 3rd ed.; Prentice Hall:Upper Saddle River, NJ, USA, 2000; ISBN 978-0-321-04711-3.
24. Isaac, A.; Shorrock, S.T.; Kirwan, B. Human error in European air traffic management: The HERA project.Reliab. Eng. Syst. Saf. 2002, 75, 257–272. [CrossRef]
25. Baysari, M.T.; Caponecchia, C.; McIntosh, A.S. A reliability and usability study of TRACEr-RAV:The technique for the retrospective analysis of cognitive errors—For rail, Australian version. Appl. Ergon.2011, 42, 852–859. [CrossRef] [PubMed]
26. Caponecchia, C.; Baysari, M.T.; McIntosh, A.S. Development, use and usability of TRACEr-Rav:The technique for the retrospective analysis of cognitive errors—for rail, Australian version. In Rail HumanFactors around the World: Impacts on and of People for Successful Rail; CRC Press: Boca Raton, FL, USA, 2012;Volume 85.
27. Gibson, W.H.; Mills, A.; Hesketh, S. The Classification and Analysis of Railway Incident Reports. In RailHuman Factors around the World: Impacts on and of People for Successful Rail Operations; CRC Press: Boca Raton,FL, USA, 2012; Volume 11.
28. Great Britain Health and Safety Executive; Norske Veritas (Organization). RR566—Accident Statistics for FixedOffshore Units on the UK Continental Shelf 1980–2005; HSE Books: Sudbury, ON, Canada, 2007.
29. Technical Reports Committee. The Human Factor: Process Safety and Culture; Society of Petroleum Engineers:London, UK, 2014.
30. Grebstad, L. The Influence of Automation on Human Error in Managed Pressure Drilling Well Control; Institutt forIndustriell økonomi og Teknologiledelse: Trondheim, Norway, 2014.
31. Shorrock, S.T. Error classification for safety management: Finding the right approach. In Proceedings of theA Workshop on the Investigation and Reporting of Incidents and Accidents, Glasgow, UK, 17–20 July 2002;pp. 17–20.
32. Shirali, G.; Malekzadeh, M. Predictive Analysis of Controllers’ Cognitive Errors Using the TRACEr Technique:A Case Study in an Airport Control Tower. Jundishapur J. Health Sci. 2016, 8, e34268. [CrossRef]
33. Schröder-Hinrichs, J.; Graziano, A.; Praetorius, G.; Kataria, A. TRACEr-MAR?applying TRACEr in amaritime context. In Risk, Reliability and Safety: Innovating Theory and Practice; CRC Press: Boca Raton,FL, USA, 2016; pp. 120–126. ISBN 978-1-138-02997-2.
34. IOGP Human Factor. A Mean of Improving HSE Perfomance. Available online: http://www.ogp.org.uk/pubs/368.pdf (accessed on 13 April 2016).
35. International Association of Oil & Gas Producers (IOGP). Standardization of Barrier Definitions. Supplement toReport 415; International Association of Oil & Gas Producers (IOGP): Auderghem, Belgium, 2016.
36. Skogdalen, J.E.; Smogeli, Ø. Looking Forward—Reliability of Safety Critical Control Systems on Offshore DrillingVessels; Deepwater HorizonStudy Group: Berkeley, CA, USA, 2011.
37. Hassan, J.; Khan, F. Risk-based asset integrity indicators. J. Loss Prev. Process Ind. 2012, 25, 544–554. [CrossRef]38. Lauder, B. Major Hazard (Asset Integrity) Key Performance Indicators in use in the UK Offshore Oil and
Gas Industry—Oil & Gas UK Paper. In Proceedings of the Oil &Gas UK: CSB Meeting, Houston, TX, USA,23–24 July 2012.
39. Cheng, C.-M.; Hwang, S.-L. Applications of integrated human error identification techniques on the chemicalcylinder change task. Appl. Ergon. 2015, 47, 274–284. [CrossRef] [PubMed]
40. Theophilus, S.C.; Abikoye, O.G.; Arewa, A.O.; Ifelebuegu, A.O.; Esenowo, V. Application of AnalyticHierarchy Process to Identify the Most Influencing Human Factors (HFs) and Performance InfluencingFactors (PIFs) in Process Safety Accidents. In Proceedings of the SPE/AAPG Africa Energy and TechnologyConference, Nairobi City, Kenya, 5–7 December 2016.
41. Howell, D.C. Statistical Methods for Psychology; Cengage Learning: Boston, MA, USA, 2012; ISBN978-1-133-71327-2.

Safety 2017, 3, 23 22 of 22
42. Sless, D. Designing public documents. Inf. Des. J. 2004, 12, 24–35. [CrossRef]43. Cohen, J. A Coefficient of Agreement for Nominal Scales. Educ. Psychol. Meas. 1960, 20, 37–46. [CrossRef]44. McHugh, M.L. Interrater reliability: The kappa statistic. Biochem. Med. 2012, 22, 276–282. [CrossRef]
© 2017 by the authors. Licensee MDPI, Basel, Switzerland. This article is an open accessarticle distributed under the terms and conditions of the Creative Commons Attribution(CC BY) license (http://creativecommons.org/licenses/by/4.0/).