a study on - iit kanpurhome.iitk.ac.in/~dipak/final report_25052015.pdf · a study on requirment...
TRANSCRIPT

1

2
A STUDY ON REQUIRMENT AND AVAILABILITY OF
TECHNICAL MANPOWER FOR STEEL INDUSTRY
IN INDIA
Prof. Dipak Mazumdar and Prof. Indranil Manna
Department of Materials Science and Engineering Indian Institute of Technology
Kanpur, UP, 208016

3
TABLE OF CONTENTS
Preface 4 Executive summary 5 Chapter 1 : Overview 1.1 Introduction 7 1.2 Previous work 9 1.3 Scope of the present work 13 1.4 The layout 13 Chapter 2: Requirement of technical manpower 2.1. Introduction 15 2.2 Data collection 16 2.3 Analysis of data on productivity and technical manpower 18 2.4 Manpower requirement prediction: Principle and procedure 21 2.4.1 Assumptions in scale-up 22 2.4.2 The upper bound 24 2.4.3 The lower bound 25 2.5 Skill set- wise technical man power requirements 27
2.5.1 Requirement of ITI certificate holders 27 2.5.2 Requirement of Graduate and Diploma Engineers 27 2.5.3 Discipline-wise requirements of engineers for production 28 2.5.3.1 The upper bound 28 2.5.3.2 The lower bound 33 2.5.3.3 The final figures 34 2.6 Researchers in steel plants 37 Chapter 3: Availability of technical manpower 3. 1 Introduction 40 3.2 Growth of engineering/technical institutions 40 3.3. Availability of technical manpower from academic Institutions 41
3.3.1 Sanctioned intakes of under-graduate and Post-graduate students 41
3.4 Availability of Graduate Engineers for steel industry based on sanctioned strength 43
3.4.1 Estimated availability for steel industry 43 3.5 Employability of Graduate Engineers 45
3.5.1 Findings of various studies 45 3.5.2 Yearly effective intake of under graduate

4
students adjusted for “employability” 46 3.5.3 Estimated availability for steel industry considering employability of fresh graduates 47 3.5.4 Range of availability of Graduate Engineers 48
3.6 Polytechnic Institutes 49 3.6.1 Growth of Polytechnics 49 3.6.2 Availability of diploma holders for steel industry 49
3.7 Industrial Training Institutes 49 Chapter 4: Consolidation: observations, deliberations and recommendations
4.1. Introduction 51 4.2. Deliberations on manpower requirement, availability, analysis 51 and results 4.3. Summary of observations and recommendations 52 Appendix I 55 Appendix II 56 Appendix III 79 Appendix IV 87 Appendix V 90

5
Preface
Steel plays a vital role in the development of any modern economy. “Per capita consumption of steel” is generally accepted as a yardstick of socio-economic development and living standards of people. As such, no developing country can afford to ignore steel as the latter, owing to its strategic importance in development. Steel has diverse applications but is predominantly used as structural materials. Nearly 60% of steel produced in India is currently used in construction and remaining as automotive material, capital goods, consumer durables, packaging material and so on. Current level of steel production in the country is about 81 MTPA, projecting a dismal figure for per capita steel consumption1. Therefore, as India moves ahead to become a developed nation, steel, which is essential for infra structure development (along with cement and electricity), must be available in large quantity. This necessitates setting up of new energy and emission efficient steel plants, capacity enhancement of existing mills, adoption of new technology and removal of obsolesce from existing plants and so on. From a meagre 2 MT of crude steel produced in the country during 1950-51, nearly 81.69 MMT of crude steel was produced in 2014. This is expected to increase further, reaching a figure of about 300 MTPA by the year 2025. India is poised to emerge, by 2016 , as the second largest steel producer in the world2. Parallel to such, it is imperative that high quality technical manpower is available in the country to manage and run our steel mills as efficiently as possible. Therefore, in the changing scenario of steel production in the country, it is important to take stock of the prevailing situation as far requirement and availability of technical manpower for domestic steel and allied sectors are concerned. Consequently the purpose of the present study has been to make an assessment of requirement and availability of technical manpower at different skill sets needed to manage and sustain crude steel production of 300 MTPA by 2025. To this end, steel and allied industries in the country were contacted to provide manpower and production related figures, which formed the basis of the present study. Spontaneous and enthusiastic supports, followed from a large number of industries, throughout the course of the present investigation,. In undertaking the study we have been immensely helped by various organisations in the country, in particular, The Ministry of Steel, The Ministry of labour, The Indian Institute of Metals (Kolkata), INSDAG (Kolkata), IRMA (Kolkata), SIMA (New Delhi), NISST (Govindgarh) and AICTE. We gratefully acknowledge their assistance towards fruitions of the present work. Finally, we sincerely hope the estimates provided and directions indicated in this report come handy in making future plans as far as issues related to skilled technical manpower for domestic steel industry is concerned. May 31st, 2015 Kanpur Dipak Mazumdar and Indranil Manna
1 A 2010-11 estimates of per capita steel consumption is: South Korea (1077 kg), Germany (440 kg), China (427 kg), USA (258 kg), Russia (256 kg) and India (51 kg). The world average is about 202 Kg. It is estimated that in many villages in India per capital steel consumption is as low as 2 kg. 2 India’s real consumption of total finished steel in 2011-12 was 70.92 Million Tonnes. This represents a growth of 8.7% during 11th Plan. India remains the largest producer of sponge iron (DRI), emerged as the fourth largest steel producer and the third largest finished steel consumer in the world during the 11th Plan period (2007-2012).
6
Executive summary
The present study on the requirement and availability of technical manpower for domestic steel industry was carried out separately, on two distinct parts i.e., requirement and availability, at IIT Kanpur as well as at IIM head quarter at Kolkata. While the task of estimating requirement was carried out at IIT Kanpur, the same for availability was carried out at IIM, Kolkata. The exercise was initiated by framing a set of appropriate questionnaires for various industries and educational institutes in the country through an eleven member expert committee who met at IIT Kanpur during August 2014 to formulate and finalize the questionnaires. Feedback from industries and educational institutes as well as vital inputs obtained from INSDAG, SIMA and IRMA formed the basis of quantifying requirement and availability of technical manpower. On the basis of such, gap between the two, if any, was identified at each skill set as well for each individual stream/discipline. Following a brief introduction and a review of the previous work summarised in Chapter 1, requirements of technical manpower for steel and allied industries under different skill set is addressed in detail in Chapter 2. Towards estimating the requirement, 240 industries from nine different sectors including, steel producers (primary and secondary both) and allied industries (e.g., Merchant pig iron, Sponge iron, Ferroalloy, Rolling mill, Pelletisation etc.) were contacted and about 149 of these visited by the committee members and their associates. Data on productivity and the associated technical manpower (ITI trained personnel, Diploma engineers, graduate and post graduate engineers including doctorates) were obtained from 186 different industries and based on such, numbers of engineers required to produce a thousand ton product for each sector was determined. Since total annual productivity for each sector for the year 20143 is known, consequently, embodying the “engineers per thousand tonne of product”, total technical manpower currently associated with each sector has been estimated. This indicated that an overwhelming majority (almost 80%) of the engineers are associated with the steel plants (primary and secondary producers combined) while remaining 20%, with the allied industries. Furthermore, of the total technical manpower associated with steel plants and allied sector industries, nearly 62% are associated with the primary steel producers alone! Based on feedback and subsequent rationalisation, stream-wise (Metallurgical, Mechanical etc.) number of engineers employed presently in all nine sectors (including steel plants and allied industries) have also been simultaneously estimated. Given the current level of crude steel production (~81MMT) in the country, the number of graduate engineers required to produce 2404 tonne of liquid steel annually can be conveniently estimated through straightforward extrapolation. The number thus obtained can be further enhanced by 20% to accommodate employment in the allied sector in the ambit of present calculations. Subsequently, considering current employment as well as
3 INSDAG, Kolkata 4 One estimate available with INSDAG, Kolkata indicates that of the 300 MMT steel produced in 2025, nearly 240 million tonnes would be in the integrated sector and 60 million tonnes, in the secondary sector.

7
superannuation of a part of the present task force, a modified and more realistic estimate has been derived. The value thus obtained represents the number of graduate engineers required over a period of next ten year (2015-2025) in steelmaking and allied industries and correspond to the upper bound as possible modernisation and automation of steel industries could reduce such estimates drastically. Towards this, a lower bound on requirement has also been worked out embodying manpower and productivity related data from modern steel mills in advanced countries. It was assumed that future steelmaking industries in India would be at least at par with the present day Japanese steel industries. Following a similar approach, estimates of diploma engineers and their stream wise requirements as well as requirements of ITI certificate holders were made for the next ten years. Required number of graduate engineers, diploma engineers and ITI trained personnel were also normalised to present corresponding requirements per year, per million tonne of steel. Research and Development in steel plants and associated requirements of highly qualified technical personnel was also given adequate attention, under a separate heading, in Chapter 2
Parallel to the above availability of graduate and diploma engineers as well as ITI certificate holders were made by consulting a large number of institutions/ universities, AICTE and the Ministry of Labour and Employment and this is summarized and discussed elaborately in Chapter 3. The available numbers obtained from different sources were rationalised on the basis of the input that all graduate engineers are not keen to join the steel industries. A comparison of requirement with the effective available number of engineers ( deduced by considering suitable employability factor) indicate distinct gaps between supply and demand exist as far as metallurgical (graduate and diploma engineers) and ceramic engineers (only graduate engineers) is concerned. Such findings from the present study are essentially identical to that of the previous study (the 2007 study), though arrived at following distinctly different approaches. Finally, the current scenario of engineering education and employment in the country, particularly with reference to metallurgical engineering discipline and steel industries, were critically examined by experts in a workshop. Recommendations made by the committee for reversal of existing trends are the discussed in Chapter 4 of the report in detail.
8
1
Overview
1.1 Introduction Steel plays a vital role in the development of any modern economy. “Per capita consumption of steel” is generally accepted as a yardstick of socio-economic development and living standards of people. No wonder, crude steel production in the world, since the beginning of last century, has been increasing steadily touching the 1.5 Billion Metric Tonne mark in 2014! As such, no developing country can afford to ignore steel owing to its strategic importance in development. The world crude steel output grew steadily during the period 1940-1980 due to the growth of steel consumption in US, erstwhile USSR, Japan and other developed countries in Europe. However, the growth rate slumped for the next 15 years up to 1995 due to the world wide recession. It has been estimated by the International Iron and Steel Institute (IISI) that world crude steel production could reach 2000 Billion Metric Tonne by the year 2020! Steel has diverse applications but is predominantly used as structural materials. Nearly 60% of steel produced in India is currently used in construction and remaining as automotive material, capital goods, consumer durables, packaging material and so on. Current level of steel production in the country is about 81 Million Metric tonnes, projecting a dismal figure for per capita steel consumption. Therefore, as India moves ahead to become a developed nation, steel, which is essential for infra structure development (along with cement and electricity), must be available in large quantity. This necessitates setting up of new energy and emission efficient steel plants, capacity enhancement of existing mills, adoption of new technology and removal of obsolesce from existing plants and so on.
From a meagre 2 MMT of crude steel produced in the country during 1950-51, nearly 81 MMT of finished steel was produced in 2014. According to the Ministry of Steel, Govt. of India, this is expected to increase further, reaching a figure of about 300 MMTPA by the year 2025, to correspond to about 200 kg per capita steel consumption, that is well above the current global average! India is poised to emerge, by 2016 as the second largest steel producer in the world. The growth in steel production in India and corresponding per capita steel consumption for the past decade are shown in Figs. 1.1(a) and 1(b) respectively. There, projections by the Ministry of Steel, Govt. of India for immediate future years have also been included. As projected, India has a very high potential for growth in per capita consumption of steel when compared to BRIC countries which are having very high economic growth

9
and USA, a highly developed country. Figure 1.1 also shows a steady and moderate rise in production during the last fifteen years. However, beyond 2015-16 and up to 2025, the projection given by the Ministry of Steel Govt. of India shows step rise in crude steel production. Needless to mention, a completely overhauled strategy, in terms of land, material, energy, technology and manpower shall be needed to accomplish the Ministry specified desired target! Given the target of 300MT of steel by 2025, it is anticipated that there will be enormous demand for technical manpower to run and manage steel industries competitively. The scarcity of trained technical manpower, particularly graduate and diploma engineers in Metallurgical and Ceramic Engineering, as the 2007 report indicated5, may pose a stiff challenge to the proposed growth of steel industry. Immediately after independence, during 1950s and 1960s, high industrial growth in the country attracted a large number of geologists, mining engineers, metallurgists, chemical, mechanical and civil engineers to the steel plants. Almost simultaneously, number of academic institutes grew up. However, between 1975 and 2000, manufacturing industries, in general, and iron and steel industry in particular, experienced successive ups and downs and as a consequence, the priorities of the educational institutes, old as well as new, changed and their academic curricula were re-oriented to suit the needs of non-manufacturing sectors, emphasizing such subjects as Computer Science, Information Technology, Electronics, Telecommunication, Nanotechnology etc.
(a) (b) Figure 1.1 (a) Annual steel production figures including the proposed target and (b) Per capita
steel consumption in the country during the last ten years and future projection.
It is heartening to note that situation is changing and greater emphasis on manufacturing is being laid again, particularly with respect to the iron and steel industry. The challenge to accomplish the 2025 target is manifold and includes several complex issues such land acquisition, material and energy supply, availability of bright engineering graduates and diploma holders to run future steel mills
5 A study on technical manpower in steel industry: requirement and availability (2007-2012), IIM Kolkata.

10
efficiently. These are some of the major concerns, linked intricately to the future growth of the steel industry in the country, for the entrepreneurs as well as the Ministry of Steel, Govt. of India alike. Beyond land, material and energy, requirement and availability of technical manpower to run future steel mills and thus fulfil the mandate of 300 MMT by 2025, is an equally important issue. An assessment of the latter, at the behest of the Ministry of Steel, Govt. of India was undertaken in 2007 by an expert committee commissioned by the Indian Institute of Metals, Kolkata. Since the time the work was completed, many new developments have taken place. On the industrial front, ambitious capacity enhancements have been announced as well as new technology and large scale automation being contemplated. In the field of education, several new institutions have come up and capacity of existing institutes increased significantly. These necessitate that the 2007 report be re-visited and revised estimates of requirement and availability of technical manpower made considering the changed scenario. To this end, a new and revised target viz., 300 Million tonnes of steel by 2025 was set by the Ministry of Steel. The latter also proposed that IIT Kanpur takes up the aforesaid study by constituting an expert group/team. Consequently, the purpose of the present work is to collect pertinent data from steel (both primary and secondary producers) and allied industries ( including plants dealing with sponge iron, merchant pig iron, rolling mills, ferroalloys, refractory, pellets etc.) as well as from educational institutes across the country and analysing the same as rigorously as possible to quantify technical manpower requirement and availability for domestic steel and allied industries with reference to a target production of 300 Million tonnes by 2025. The study attempts to take stock of the current manpower situation, extrapolate rationally and suggests measures to provide suitable technically qualified manpower for efficient management of the domestic steel industry. 1.2 Previous work In 2007, Indian Institute of Metals completed a study for Ministry of Steel, Govt. of India, on the requirement and availability of technical manpower for steel producing sector including sponge iron and pig iron plants. The said study, on the basis of data obtained from various sources (viz., production units, the Ministry of Steel, JPC, Design, consultancy and R&D institutions, AICTE, media, web and published literature) projected an annual steel production in the range of 214 to 297 Million tonnes by 2020. The study also predicted significant gap between requirement and availability for Metallurgical and Ceramic engineering disciplines, both at the diploma and degree level. A brief account of the previous study is summarised below. To accomplish the objectives and execute the task commissioned by the Ministry of Steel at the Indian Institute of Metals, a five member core committee from industry, research, design, and academic institutions was constituted. Furthermore, to assist the core team in organizing and conducting the study, a project team comprising of five other members was formed. As a starting point, data formats specific to each of

11
the six sectors were formulated and these were sent to one hundred and thirty five different organisations including, (i) Blast Furnace/Corex-BOF steel plants (ii) Electric Arc Furnace units (iii) Induction Furnace units (iv)Sponge iron units (v) Pig iron plants and (vi)Support services organisations. Altogether eighty organisations responded to the questionnaire and these, together with the data collected directly from plant visits, constituted the basis of calculation, analysis and interpretation.
Table 1.1: Steel production/capacity in India during 2007-2020 as envisaged in the previous work (the 2007 study).
Year Production/Capacity (Million Tonne)
Brownfield Greenfield Total 2006-07 55.5 Nil 55.5 2011-12 96.0 42.5 138.5 2015-16 114.3 107.5 221.8 2019-20 132.1 165.8 297.9
Data were collected from various existing and proposed plants in the country, the Ministry of Steel, JPC and this indicated accelerated growth of steel production in the country as shown in Table 1.1. The figures shown in the foregone table were deduced on the basis of feedback which indicated that if all green field and brown field projects materialise, by 2020 India would be producing nearly 300 Million tonnes of steel. Technical manpower estimates were made for such a target considering two different options viz.,
(i) The optimistic option: 100% of brown field and green projects implemented and
(ii) The conservative option : 100% of brown field and 50% of green field projects implemented
The projected trends of steel production in the country made in 2007 considering the figures presented in Table 1.1 and the two options mentioned above are shown Fig.1.2. There, as seen, projected estimates reflect significantly higher growth rate for steel production in the country during 2007-2020 via either options. Interestingly, the current level of steel production is much lower (also included in the figure); the 2014 production figure standing at 81 Million tonnes! Sluggish economy coupled with low GDP growth rate, land and mines issues etc. combined seem to have derailed the previous estimates completely. Incorporating experiences from the industry and considering the following proportion of sponge iron in the steelmaking charge mix viz., EAF:50%, EIF:60% and BOF: 3%, corresponding estimated demand for sponge iron during the period 2011-2020 were derived. This is shown in Table 1.2. Analogous to the steelmaking trends (i.e., Fig.1.2), production of sponge iron was also predicted to follow a high growth rate path. None the less, sponge iron production, like steel production did not grow expectedly. It is important to mention that in 2014 nearly 22 Million tonnes of sponge iron was produced which is substantially smaller than the envisaged quantity shown in

12
Table 1.2. For the Pig iron sector, it was assumed that primary and secondary producers, shall in combination, yield about 9 Million tonnes of pig iron annually.
Figure 1.2 Envisaged growth of steelmaking capacity in India during the period 2007-2020 considering the optimistic and conservative approximations [ref. 2007 report].
Table I.2: Sponge iron production/capacity in India between 2011-2020 as envisaged in the
previous work [ref.2007 study]. Steelmaking
process Steelmaking capacity (Million
Tonnes) Demand for sponge iron (Million
Tonnes) 2011-12 2015-16 2019-20 2011-12 2015-16 2019-20
EAF 26.1 33.13 42.13 13.05 16.56 21.1 IF 16.5 17.5 18.5 9.9 10.5 11.1
BOF 95.9 171.2 237.3 2.88 5.14 7.12 Total 138.5 221.83 297.9 25.83 32.2 39.32
Given the future productivity target and the associated technical manpower per million tonne of steel (obtained through feedback), the total manpower requirement for steel industries for each skill set (Graduate and diploma engineers, ITI certificate holders and B.Sc. /M.Sc.) was estimated in the earlier study. These has been further modified and made more realistic considering the following relevant issues:
(i) Brown field steel plants were considered to be more human intensive than green field plants. Towards this, actual plant productivity and manpower data were applied to estimate respective manpower per Million Tonne of steel.
(ii) Negligible superannuation was assumed for green field plants and (iii) A yearly uniform 3% attrition till 2020 was assumed for the brown field plants.
The study concluded that by 2020, net additional technical manpower requirement for steel plants alone shall be to the tune of 175467 under the optimistic option and 121497 under the conservative options. On the basis of such, discipline-wise

13
requirements were also estimated for each skill set viz., graduate and diploma engineers, ITI certificate holders as well as BSc./M.Sc. To this end, data provided by industries for each discipline (for example, proportion of metallurgical engineers per million tonne currently in the task force) was embodied to deduce the corresponding requirement for the given future capacity). In this way, requirements of technical manpower for each skill set were obtained for different disciplines. Practically the same methodology was used to infer the numbers (discipline wise at all skill sets) for the support services organisations (R&D laboratories and design organisations), sponge iron and pig iron plants. The analysis revealed many interesting aspects of technical manpower in the steel, allied and support service organisations. For example while support sector organisations are run and managed predominantly by engineers, the EIF based plants, pig iron and sponge iron units are dominated by diploma holders and ITI trained personnel. Furthermore ratio of graduate engineers to diploma holders between Corex-BOF vs. EAF plants was found to be close to unity. The study predicted that by 2020, support sector organisations, sponge iron units and pig iron plants shall require technical manpower to the tune of 5164, 35467 and 4590 respectively. Parallel to the above, an extensive exercise was undertaken to assess the availability of graduate engineers, diploma holders and ITI trained personnel across the country through interactions with engineering institutions, polytechnics as well as industrial training institutes. Publications of AICTE (All India Council of Technical Education) were consulted in details for compiling necessary information. In addition through interaction with the Directorate of Employment and Training, useful information on ITI trained personnel was obtained. On the basis of such, discipline wise (Mechanical, Electrical, metallurgical etc.) availability of technical manpower for different skill set (engineers and diploma holders) were obtained. Similarly, number of yearly pass outs from different ITI’s across the country was also estimated. The analysis indicated that during the period 2002-2012, number of Engineering institutes have grown remarkably and so as their intakes. In 2002 while nearly 2.5 lakhs of students were enrolled in undergraduate (B.Tech./B.E./B.Sc.(Engg.)) engineering programs, the same number grew almost 2.5 times touching a figure of 6.3 lakhs in 2012. It is important to mention that intake did not grow uniformly across all disciplines; certain specific disciplines, such as, IT, CSE, Mechanical Engineering etc. were the primary beneficiaries. On the basis of placement records obtained from various institutes it was further assumed that of the total number of students graduating per year, nearly 1.25% from CSE and IT and 6.25% from other disciplines are generally available for the iron and steel industry. Similarly, it was found out from AICTE sources that nearly 1,30,000 students were admitted on a yearly basis to different polytechnics across the country and 25% of these would be typically available for the iron and steel industry. It was also found out that nearly 671941 seats are available annually in Industrial Training Institutes and about 5% of the sanctioned strength (~33,000) shall be generally available to serve the domestic steel industry. Based on the estimates of requirement and availability, it was shown that there exist gap (requirement > availability) as far as graduate engineers are concerned in the discipline of Metallurgical and Ceramic Engineering. For Metallurgical engineering

14
graduates while the yearly gap is significant (between 200 and 400) the same is less pronounced for the discipline of ceramic engineering (between 60 and 90). While only marginal gap for metallurgical engineering diploma holders was predicted, no shortage for ITI trained personnel was envisaged for all years. 1.3 Scope of the present work As reflected from the review and analysis summarised in the preceding section, it is evident that steel production since 2007 did not grow in the country at the envisaged rate. Despite such there is indication by 2015-2016 India is poised to emerge as the second largest Steel producer in the world and according to the Ministry of Steel press release, expected to touch a production of figure of nearly 300 Million tonnes by the year 2025. The figure is presumably arrived from the corresponding per capita steel consumption of nearly 200 Kg, which is equivalent or marginally higher than the current global average. It is also estimated that of the 300 Million tonnes of steel likely to be produced by 2025, nearly 240 Million shall be produced by the integrated sector and 40 Million Tonnes by the secondary sector, including EAF based alloy steel plants. Considerable parallel expansion in the production of sponge iron, hot rolled coils and slabs, pig iron, ferroalloys, pellets etc. are also naturally anticipated. The support service organisations are also expected to grow considerably over the next decade, particularly if India has to emerge as a globally competitive and innovative steel producing nation. In such context, not only the number of graduate engineers but also that of diploma holders and ITI trained personnel matters. This is so as manufacturing sectors such as rolling mills, sponge iron units, pelletisation plants etc., that are connected intricately to the steel plants tend to rely heavily on diploma holders and ITI trained personnel to manage such units. During the last few years, many new educational institutes have come up in the country but only a handful of these appear to have undergraduate metallurgical engineering education program. Furthermore, more and more metallurgical engineering department are re-orienting their curricula towards materials rather than traditional metallurgy and that is of concern to the iron and steel and the allied manufacturing sectors. Given that 2007 report had predicted a shortfall of metallurgical engineering graduates and diploma holders, the above mentioned issues become naturally a matter of concern particularly for the sustenance and growth of the iron and steel industries in the country. Looked at from stand points, it is worthwhile to re-visit the earlier study and make a fresh assessment of the subject of technical manpower requirement and availability for the future steel industry in the country. 1.4 The layout The present study was launched at IIT Kanpur on the 1st of August, 2014. The first combined meeting of the core and project committee was held in the institute during August 18th and 19th (see Fig.3) during which, questionnaires were developed for 10 different sectors connected directly and indirectly with the management of iron and steel industries in the country. A set of questionnaire was also framed for the

15
educational institutes to seek data on intake, number of pass outs and number of graduates/diploma holders taking up jobs with steel and allied industries. Based on the feedback obtained from industries, laboratories and educational institutes, an in-depth analysis was carried out to quantify technical manpower requirement and availability at all relevant skill sets. Details of data collected from industry and their consequent analysis, including some international benchmarking, applied to quantify requirement of technical manpower have been elaborated in Chapter 2. Similarly, data from educational institutes and the corresponding numbers of available graduate and diploma engineers as well as ITI trained personnel are presented in Chapter 3. Chapter 4 presents a consolidation of the two earlier chapters. Based on the results and discussion presented in Chapters 2 and 3 as well as an extensive brain storming exercise carried out at IIT Kanpur on April 13th, 2015, a set of recommendations have been made and these are also summarised at the end in Chapter 4 of the report.

16
2
Requirement of technical manpower
2.1 Introduction
To study the requirement and availability of technical manpower for the steel industry, a task force comprising of members drawn from industry, research and education has been constituted. The members were grouped in two different committees namely, a project committee for executing the project and bringing the same to a logical conclusion as well as a core committee, whose primarily responsibility was to provide technical input and guiding the project team. At the outset, it was further envisaged that visiting industries, rationalisation of data together with analysis of raw data and preparation of a final report shall all be the responsibility of the project committee. Following a detailed consultation with the Ministry, members for the two committees were identified. For expert guidance and useful input, in addition to the above, an expert committee comprising of eight distinguished personalities, well conversant with the issue under consideration was also constituted. The constitution of the three committees is shown in Appendix I. Following the meeting of the core and project committee held at IIT Kanpur during August 18th and 19th (see Fig.2.1), appropriate set of questionnaires were developed for ten different sectors, connected directly and indirectly with iron and steel production in the country. These, for example included:
(i) Integrated steel plants (ii) Alloy steel plants (iii) Induction furnace based plants (iv) Ferro alloy plants (v) Sponge iron making units (vi) Merchant Pig iron plants (vii) Rolling and rerolling mills including coating units (viii) Mineral beneficiation and pelletisation plants (ix) Refractory industries and (x) R&D, design and consulting organisations
A set of questionnaires were also framed for the educational institutes to seek data on intake, number of pass outs and number of graduates/diploma holders taking up jobs with steel and allied industries. The questionnaires formulated to execute the present study are summarised in Appendix II. It is to be noted here that the questionnaires for the manufacturing sector were so formulated that information on the number and

17
distribution of technical manpower engaged in manufacturing as well as R&D+QA vis a vis annual production can be gathered from each organisation. The feedback provided by various organisations formed the starting point of calculations for requirement of technical manpower for domestic steel and allied sectors. This is outlined in detail in the subsequent sections.
Figure 2.1 Members present during the first project meeting held at IIT Kanpur in August 2014 ((L): Mr. B.Roy, Mr. RN Parbat, Dr. T.Venugopalan, Mr. D.Kashiva , Mr. R.N. Bagchi, Dr.
S.Banerjee, Mr. ACR Das, Dr. VK Gupta, Dr. A Ghosh, Mr. S. Ghosh and Dr. A.K.Sing:(R)). 2.2 Data collection Questionnaires, supported with letters from the PI as well as from the Joint Secretary, Ministry of Steel were sent to two hundred and forty organisations from ten different sectors as shown in Table 2.1. Industries/organisation in each sector to whom questionnaires were sent is summarised in Appendix III. The organisations were given sufficient time to respond to the questionnaire and option to provide feedback electronically as well as through post were given. Almost simultaneously, some members of the core and project committee visited several industries under each sector so that reliable data could be gathered expeditiously. The exercise also facilitated rationalisation of data. A reasonably large numbers of responses were obtained within three months from the day questionnaires were mailed. As seen from Table 2.2, two hundred and forty one organisations from different sectors were contacted and questionnaires were mailed to these organisations. By post, through electronic mails as well as site visits, feedback from one hundred and ninety organisations could be obtained. Of all the sectors, the participation of the primary steelmaking sector was overwhelming. Under this category, all but one organisation responded. Table 2.2 also includes the feedback statistics of the previous study. These are included within parenthesis in the last column. In comparison to the 2007 study, more industries/organisations participated in the present survey.

18
Table 2.1 Ten different sectors and the corresponding number of industries/organisation in each sector to whom questionnaires were sent6.
No. Name of the sectors Number of industries to
whom questionnaires have been mailed
Number of industries visited
01 Integrated Steel Plants 14 06
02 Alloy Steel Plants 25 05 03 Induction Furnace 46 23 04 Sponge Iron Plants 45 03 05 Re-Rolling Mills 46 110 06 Refractory Industries 08 - 07 Ferro Alloy Plants 17 02 08 Merchant Pig Iron Plants 23 - 09 Mineral Beneficiation &
Pelletizing Plants 05 -
10 R & D and Design Organizations
12 -
Table 2.2 Number of industries who responded to the questionnaires for all ten sectors considered in the study.
No. Name of Sectors Number of industries
to whom questionnaires were
sent
Number of industries from
whom Information received
01 Integrated Steel Plants 14 13 (10) 02 Alloy Steel Plants 25 13 (11) 03 Induction Furnace 46 24 (19) 04 Sponge Iron Plants 45 09 (24) 05 Re-Rolling Mills 46 114 (-) 06 Refractory Industries 08 05 (-) 07 Ferro Alloy Plants 17 04 (-) 08 Merchant Pig Iron Plants 23 03 (07) 09 Mineral Beneficiation &
Pelletizing Plants 05 02 (-)
10 R & D Sectors 12 03 (10) TOTAL 241 190 (81)
6 Steel plants having capacity above 1 MTPA has been included under the integrated sector. On the other hands steel plants having EAF technology and producing less than 1MTPA have been included under alloy steel plants. Alloy steel plants + Induction furnace steelmakers together constitute the so called secondary sector

19
Table 2.3 A summary of sector wise annual production and associated technical manpower as reflected from the figures provided by different organisations.
No. Sectors( no of
organization) Production, ‘000 Tonne
Total technical manpower in production7
Technical personnel per
thousand tonne of product
01 Integrated steel plants(13)
53047 64938 1.2241
02 Alloy steel plants(13) 7436 9563 1.286 03 Induction furnace
steelmakers(24) 893 662 0.7413
04 Sponge iron plants(09)
992 210 0.2116
05 Re-rolling mills(114) 4602 1392 0.3024 06 Refractory
industries(05) 409 324 0.7921
07 Ferro alloy pants(04) 279 160 0.5734 08 Merchant pig iron
plants(03) 1288 570 0.4425
09 Mineral beneficiation & pelletizing plants(02)
8300 258
Total: 78077
0.0311
2.3 Analysis of data on productivity and technical manpower On the basis of the responses obtained from steel and the various allied industries, sector-wise total annual production vis a vis technical manpower has been estimated. This is shown in Table 2.3. Since all organisations in any given sector have not participated or responded to the survey, information pertaining to sector–wise production and associated technical manpower shown in Table 2.3 is incomplete. Data presented in Table 2.3 indicates that nearly 80% of the total technical manpower is engaged with the primary steel producers. This, as one would note is somewhat skewed and follows from the fact that comparatively few secondary producers, sponge iron units etc. have responded to the survey. As a result, data presented in Table 2.3 cannot be extrapolated in a straightforward manner or used to carry out a meaningful analysis of future requirement of technical manpower in steel and the allied sectors. Despite such, the data provides useful insight and were employed to deduce important sector specific information (used as relevant scalable parameter later) such as, “technical personnel per thousand tonnes of product”. Since organisations have provided information on skill set-wise and discipline-wise information on technical manpower as well, similar discipline specific parameters such as “diploma or graduate engineers per thousand tonnes”, “metallurgical engineers per thousand tonne of product”, “mechanical engineers per thousand tonne of product” etc. can also be conveniently estimated and employed in subsequent
7 Throughout, technical personnel engaged in maintenance and other allied services of steel plants are included in the head.

20
calculations/extrapolations. These i.e., the sector specific as well as discipline specific scalable parameters are illustrated in Appendix IV.
Table 2.4 Actual total production of different sectors in 2014 and the estimated associated technical manpower.
Sectors Data from survey Actual
production in 2014,
’000 Tonne
Estimated technical
manpower in production
Production in 2014, ‘000
Tonne
Total technical
manpower in production
Integrated steel plants
53047 64938 55000 67328
Alloy steel plants 7436 9563 12000 15432 Induction furnace
steelmakers 893 662 14000 10378
Sponge iron plants 992 210 22900 4848 Re-rolling mills 4602 1392 41200 12462
Refractory industries
409 324 1150 911
Ferro alloy plants 279 160 2000 1147 Merchant pig iron
plants 1288 570 7950 3518
Mineral beneficiation and pelletisation units
8300 258 25000 777
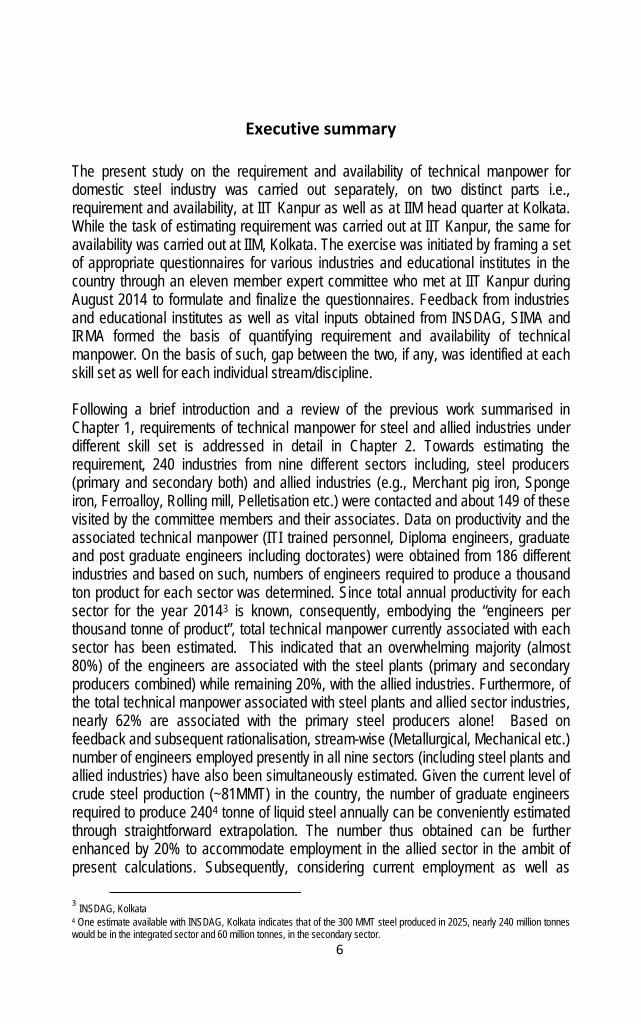
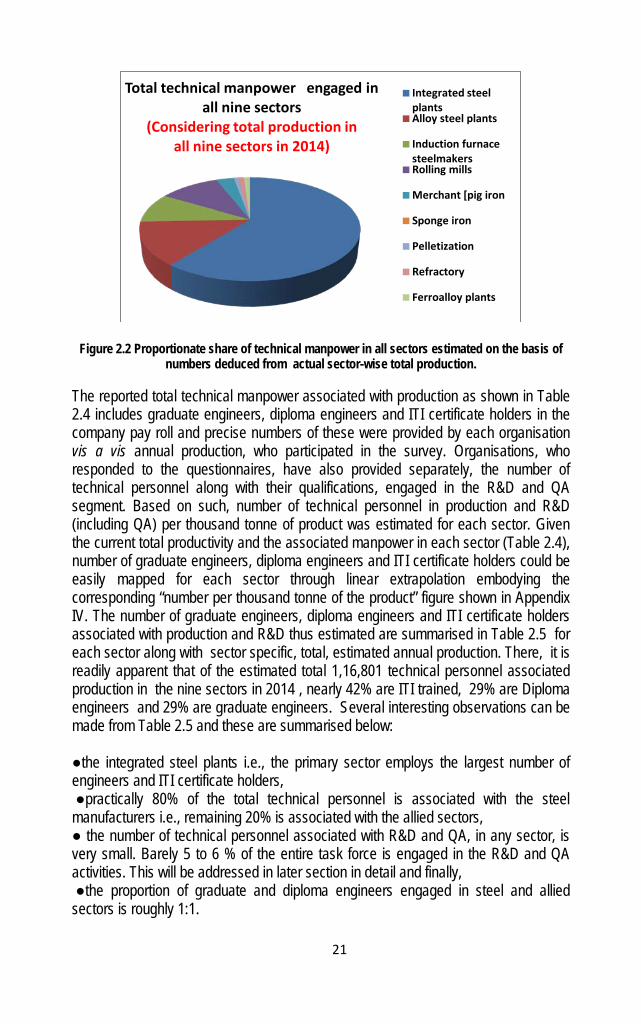
Total: 78077 Total: 116801 Since sector wise productivity and manpower shown in Table 2.3 are not truly representative, consequently, to proceed further, organisations like INSDAG, SIMA, IRMA, NISST as well as Ministry of Steel were contacted to obtain sector wise actual productivity in 2014. Information thus obtained are summarised in Table 2.4. There, for the sake of comparison, sector-wise annual productivity and the corresponding number of associated technical manpower, which were presented already in Table 2.3, have also included. Given the actual sector specific productivity in 2014, on the basis of numbers shown in the first two columns, estimates of technical personnel associated with each sector can be easily made trough linear extrapolation and this is shown in the last column of Table 2.4. As seen, currently, nearly 116801 technical personnel are expected to be there in the pay roll of various organisations taken to constitute the nine different sectors in the study. Results presented in Table 2.4 are illustrated via a pi-diagram in Fig. 2.2. This indicates that almost 80% of the technical manpower is with the steel plants (integrated and secondary producers combined) while remaining 20% are with the allied industries. Furthermore, integrated steel plants employ nearly 58% of the entire technical task force.
21
Figure 2.2 Proportionate share of technical manpower in all sectors estimated on the basis of numbers deduced from actual sector-wise total production.
The reported total technical manpower associated with production as shown in Table 2.4 includes graduate engineers, diploma engineers and ITI certificate holders in the company pay roll and precise numbers of these were provided by each organisation vis a vis annual production, who participated in the survey. Organisations, who responded to the questionnaires, have also provided separately, the number of technical personnel along with their qualifications, engaged in the R&D and QA segment. Based on such, number of technical personnel in production and R&D (including QA) per thousand tonne of product was estimated for each sector. Given the current total productivity and the associated manpower in each sector (Table 2.4), number of graduate engineers, diploma engineers and ITI certificate holders could be easily mapped for each sector through linear extrapolation embodying the corresponding “number per thousand tonne of the product” figure shown in Appendix IV. The number of graduate engineers, diploma engineers and ITI certificate holders associated with production and R&D thus estimated are summarised in Table 2.5 for each sector along with sector specific, total, estimated annual production. There, it is readily apparent that of the estimated total 1,16,801 technical personnel associated production in the nine sectors in 2014 , nearly 42% are ITI trained, 29% are Diploma engineers and 29% are graduate engineers. Several interesting observations can be made from Table 2.5 and these are summarised below: ●the integrated steel plants i.e., the primary sector employs the largest number of engineers and ITI certificate holders, ●practically 80% of the total technical personnel is associated with the steel manufacturers i.e., remaining 20% is associated with the allied sectors, ● the number of technical personnel associated with R&D and QA, in any sector, is very small. Barely 5 to 6 % of the entire task force is engaged in the R&D and QA activities. This will be addressed in later section in detail and finally, ●the proportion of graduate and diploma engineers engaged in steel and allied sectors is roughly 1:1.
Total technical manpower engaged in all nine sectors
(Considering total production in all nine sectors in 2014)
Integrated steel plants Alloy steel plants
Induction furnace steelmakers Rolling mills
Merchant [pig iron
Sponge iron
Pelletization
Refractory
Ferroalloy plants

22
Table 2.5 Estimated sector–wise numbers of graduate engineers, diploma engineers and ITI trained personnel engaged in production and R&D (including QA) in all nine sectors as in 2014.
2.4 Manpower requirement prediction: principle and procedure In estimating requirement of technical manpower to manage and sustain 300 MMTPA steel production by 2025, a report by MECON (acquired through INSDAG) has been considered. This suggests that by 2025, nearly 240 million tonnes of steel is likely to be produced in the integrated sector and about 60 million tonnes in the secondary sector (alloy steel plants + EIF steelmakers combined). Therefore, estimates of required manpower for primary and secondary sectors are possible through linear extrapolation, given the numbers in Table 2.5. In contrast, evolution of the allied sectors during the next ten years, parallel to the growing steel production, is less certain. Furthermore, there is currently no basis to firmly assert and thereby assign meaningful future annual productivity figures against the various allied sectors. Since production levels in the allied sectors are uncertain, estimates of manpower for allied industries cannot be derived through extrapolation. The present analysis, as already pointed out, has indicated that technical manpower in steel and allied industries is currently in proportion to 80:20. The 80:20 ratio of technical manpower at each skill set has been further investigated and established through careful analysis. This is demonstrated in Fig. 2.3. There, it is readily apparent that between the steel and allied industries, the ratio of total technical manpower as
Sectors Total produc-
tion
Graduate Engineers
Diploma Engineers
ITI Trained
Prod. R & D + QA
Total Prod. R & D + QA
Total
Integrated Steel Plant
55000 19854 1072 20927 18502 1650 20152 28972
Alloy Steel Plant
12000 4299 285 4584 4218 403 4622 6915
Induction Furnace units
14000 3103 16 3119 3040 375 3415 4232
Sponge Iron Plant
22900 577 23 600 1822 00 1822 2446
Re-rolling Mills 41200 3437 143 3580 2963 241 3202 6060
Refractory Industries
1150 224 194 418 444 00 444 241
Ferro Alloy Plant
2000 107 00 106 222 00 222 817
Merchant Pig Iron
7950 1733 74 1795 907 25 931 876
Mineral beneficiation+ Pelletissation
25000 290 38 330 318 12 331 165
Total 33619 1845 35459 32436 2706 35141 50724

23
well as engineers is nearly in the ratio of 80:20 (i.e., 42814:10604 is equivalent to 81:19). Naturally therefore, these two segments will show the same 80:20 ratio of ITI trained personnel as well!
(a) (b)
Figure 2.3 Relative proportion of technical manpower in steel and allied industries. (a) total technical manpower distribution and (b) distribution of graduate + diploma engineers.
The preceding figures appear to indicate that if technical manpower requirement for steel plants is mapped through linear extrapolation as stated earlier, It is possible to reasonably approximate the corresponding requirement for the allied sector as well considering the 80:20 distribution between the two segments. Summing up the two, the total manpower requirement for steel and allied industries can be conveniently determined. The number thus established can be further split down in proportion to 42:29:29 (see Sec.2.3) to find out the distribution and corresponding numbers of ITI certificate holders, graduate as well as diploma engineers. Given such, we need to consider in detail the requirement of technical manpower for the steel producing sector only (primary as well as secondary producers). This is outlined in the following section.
Table 2.6 Distribution of technical manpower at different skill set in the three steel producing sectors.
No. Name of steel
producing sector
Total prod., ‘000 Tonne
Technical manpower
Total Graduate Diploma ITI 01 Integrated 55000 67328 19853 18502 28973 02 Alloy Steel 12000 15432 4299 4218 6915 03 EIF 14000 10378 3104 3041 4233
Total 93138 27256 25761 40121 2.4.1 Assumptions in scale-up In Table 2.4, total technical manpower engaged in production in the primary and secondary steel sectors have been shown. Corresponding, skill set-wise distribution,

24
for each of the three types of steel plants viz., integrated, alloy steel and EIF based steel plants vis a vis their current production is shown in Table 2.6. There, as one would note, alloy steel plants and EIF based units, appearing at serial numbers 02 and 03 in the first column, represent in combination the so called secondary producers. We shall club them together at an appropriate stage later. Table 2.6 indicates that practically 72% of the total technical manpower is associated with the primary producers and the remaining 28% with secondary (alloy steel plants +EIF units). This distribution is illustrated in Fig. 2.4. It is to be mentioned here that practically similar conclusion follows if, instead of total technical manpower, for example, graduate or diploma engineers or ITI certificate holders were considered for elucidation in Fig.2.5.
Figure 2.4 Distribution of total technical manpower, engaged in production, in the primary and
secondary steelmaking sectors. Since in 2025, production in the primary and secondary sectors are likely to be about 240 and 60 MMTPA respectively, therefore, data presented in Table 2.6 can be extrapolated in a straightforward fashion to determine the corresponding number of technical personnel (graduate engineers + diploma engineers + ITI certificate holders) likely to be engaged in production. But is the extrapolation or scale up process so simple? Complexities arise due to many issues, for example, ●Will a steel plant in 2025 be operated with same machinery or have similar level of automation as of the present time? ● How manpower intensive shall a steel plant be in 2025? ● Will the secondary sector evolve as efficiently as the primary sector? ●What is the likely effect of presently employed technical personnel and superannuation on the estimated numbers? ●How shall the allied industries evolve over the next 10 years? There are indeed numerous uncertainties involved in the scale up process. Modernisation of existing steel plants and level of automation in the new plants are perhaps likely to exert most profound influence on the number of technical personnel required to produce any given amount of steel in the future. To arrive at plausible numbers, two extreme possibilities are considered. These allow us to extrapolate to
Total technical manpower distribution in primary and secondary sectors as on date
Total technical manpower in primary sector
Total technical manpower in secondary sector

25
the future and help arrive at a maximum as well as a minimum number, so far as the requirement of technical personnel in future steel industries is concerned. These are, for example: (i) the upper bound model: this assumes that steel plants in 2025 shall be as man power intensive as these are today implying very little or no modernisation and (ii) the lower bound model: this assumes that future steel plants in 2025 shall be modern and efficient, comparable to those of advanced steelmaking nations, such as, Japan. To obtain some data on productivity and technical manpower, and to carry out extrapolation via approach (ii), Japanese Universities and industries were contacted. A professor from Tohuku University, who was in India during November 2014, also visited IIT Kanpur for discussion. Some numbers on manpower and production were also obtained from the respective company website. In the analysis presented in the following, it has been assumed that while the number of engineers and researchers shall vary according to the two above mentioned bounds, the number of ITI trained personnel shall largely remain independent of these. In other words, present day steel mills and future modern steel mills shall roughly employ the same number of ITI certificate holders referenced to per million tonne of steel produced
Table 2.7 Extrapolated maximum numbers (upper bound) of technical manpower at different skill set required in the primary and secondary steel producing sectors.
No. Steel
producing sector
Total prod., ‘000
Tonne
Technical manpower
Total Graduate Engineers
Diploma Engineers
ITI certificate
holders 01 Integrated
or primary producers
240,000 2,93,795 86636 80736 1,26,423
02 Secondary producers
60,000 59554 17,081 16749 25,724
Total 3,53,349 1,03,717 97485 1,52,147 2.4.2 The upper bound Since skill set wise technical manpower per thousand tonne of steel (see Appendix IV) for integrated, alloy and induction furnace based steel plants is already established , consequently given the target productivity of the two sectors (240 and 60 MMMTPA respectively), straightforward extrapolation can be done to deduce the corresponding numbers. This is shown in Table 2.7. Thus, to produce 300 Million tonne of steel in the next 10 years, nearly three and a half lack (exactly 3,53,349)

26
technical personnel shall be required8. As seen, numbers of graduate and diploma engineers required are roughly in 1:1 proportion reflecting the very nature of current employment statistics summarised earlier. It is important to note that the figure under the head “total” in Table 2.7 represents only 80% of the total manpower requirement since remaining 20% is lies with the allied sectors. Furthermore, effect of presently employed technical personnel and their superannuation is required to be accommodated in the calculation scheme in order to arrive at more pragmatic and accurate figures. These will be addressed subsequently at appropriate sections.
Table 2.8 A comparison of productivity vs. manpower in steel plants (integrated and alloy steels
plants) in India and Japan in 2014 Japanese steel plants
Production, MTPA
Total Engineers
Total engineers per thousand
Tonnes
Total Mechanical Engineers
Total Metallurgical
Engineers
31 (Integrated steel plants)
2247 0.0729 820 737
3.7 (Alloy Steel
plants
985 0.27 350 250
Indian steel plants 53 (Integrated steel plants)
20188 0.38 7500 3488
7 (Alloy Steel plants
2841 0.39 1400 431
2.4.3 The lower bound The lower bound on technical manpower, as pointed out already, was estimated considering productivity and technical manpower in Japanese steel plants. Both integrated and alloy steel plants were considered and relevant data were collected through personal contacts /communications/discussions. In Table 2.8, a comparison of present day status of technical manpower, associated with steel mills in India and Japan is presented. As seen, Japanese integrated as well as alloy steel plants, employ far too less technical manpower, in comparison to ours, to manage their steel production. As seen, engineers needed to produce a thousand tonnes of steel differ by more than a factor of 4, between the two countries. Extensive automation, efficient process control and modern technology naturally make Japanese steel mills less
8 This corresponds to roughly 118 technical personnel per million ton per year. With allied sectors included, a more realistic estimate stands at 147 per million tonne per year (effect of existing employees and thier superannuation not included). 9 Shougang Jingtang united iron and steel works in China, a very modern ~7 MTPA steel plant employs about 800 engineers in its task force. This corresponds to 0.11 engineers per thousand tonne of steel produced. This was found out during a visit by the co-PI to the said industry during ICS2015 at Beijing.

27
technical manpower intensive. Interestingly, while Japanese steel plants employ mechanical and metallurgical engineers roughly in 1:1 proportion, the ratio is significantly larger for Indian steel plants. As will be shown latter and discussed, Indian steel plants are predominantly managed by mechanical and electrical engineers rather than metallurgical engineers, since the former types are relatively more needed to sustain daily production.
Table 2.9 Extrapolated minimum numbers (lower bound) of technical manpower at different skill
set required in the primary and secondary steel producing sectors in the next ten years for a target production of 300 MT of steel.
No. Ssectors Total
production, ‘000 Tonne
Technical manpower (deduced on the basis of appropriate factor
from Table 2.8)
Total Graduate engineer
Diploma engineer
ITI trained
01 Integrated or primary producers
240,000 158135 16415
15297
126423
02 Secondary producers
60,000 48187 11825
11595
25724
Total 214348 28240 26892 152147
Thus, if all Indian steel mills in the primary and secondary sectors in 2025 are taken to be as modern and efficient as the Japanese steel plants of today, we may assume similar “number of engineers per thousand tonnes of steel” (as shown in Table 2.8) and deduce the corresponding number of engineers (graduate + diploma engineers, a part of the total technical manpower) required to manage 300 MT of steel production annually. The resultant numbers, as one might anticipate here, are going to substantially smaller than those presented in Table 2.7. The lower bound numbers thus obtained are shown in Table 2.9. It is interesting to note that there is, as expected, substantial difference between the upper and the lower bounds (see Tables 2.7 and 2.9 respectively; number of total engineers there almost by a factor of 3 or so). It is anticipated that in the years to come, as more steel plants are set up and the existing ones modernise, the final figure shall settle somewhere in the range between those shown in Tables 2.7 and 2.9. A firm and more definitive number perhaps cannot be derived and should not be advocated due to numerous uncertainties and complexities associated with the very nature of the task. It is reiterated that the number of ITI trained personnel, which was deduced through straightforward extrapolation (viz., 152147 in Table 2.7), remains unchanged and is irrespective of the bounds.

28
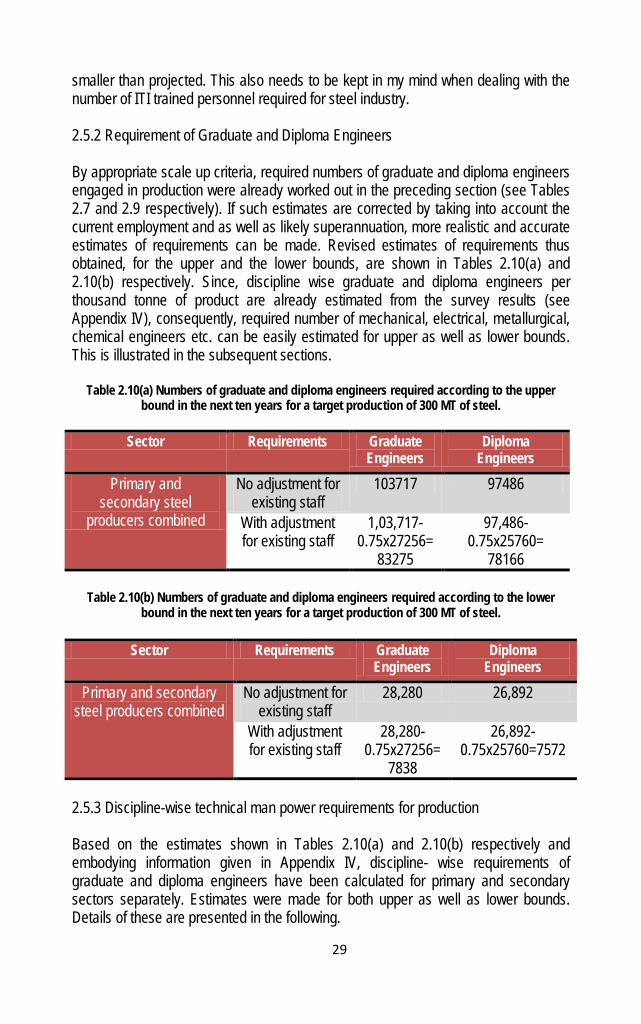
2.5 Skill set- wise technical man power requirements As pointed out already, regardless of the bounds, nearly 152147 ITI trained personnel shall be required to run steel mills (primary and secondary sectors combined) in 2025 to produce 300 MTPA steel in the country. In contrast, depending on how developments take place in various fronts and modernisation of steel plants progresses, graduate and diploma engineers in the range 55136 and 2,01,202 shall be required over a period of next ten years shall. However, related issues such as (i) employment is allied sectors and (ii) existing employees as well as their superannuation are required to be considered to arrive at the final figures. It is to these we now turn our attention to.
2.5.1 Requirement of ITI certificate holders
In section 2.4 ( see Fig.2.3), it was analytically demonstrated that currently about 80% of total technical manpower is associated with the steel plants ( primary and secondary combined) while remaining 20% with the relevant allied sectors such as sponge iron plants, ferroalloy plants, rolling mills etc. This, as a consequence, implies that number of ITI trained personnel required for the steel and allied sectors combined can be readily obtained by multiplying the corresponding numbers for steel industries alone ( see Table 2.7) by a factor of 1.25 (i.e., =1.25*152147). Therefore considering allied sectors together with primary and secondary steel producing sectors, nearly 190184 numbers of ITI trained personnel shall be required. However, according to Table 2.5, there are already 50,724 number of ITI personnel employed already in steel plants and allied industries. Feedback obtained from various quarters suggested that almost 25% of the technical staff members employed in the steel and allied industries are in the age group of 50 to 60, who will not be available in the work place in 2025. This implies an annual attrition of about 2.5% due to superannuation. It is instructive to note that the 2007 study considered an overall annual attrition rate of 3% due to superannuation. Given such, it is legitimate to consider that 75% of the existing ITI certificate holders (0.75*50724=38043) shall continue to be in the company payroll during the next ten years. Hence the effective number of ITI trained personnel required during the next ten years to produce 300 MT of steel can be obtained by subtracting 38043 from 190184. This is equivalent to 152141. Hence it is concluded that per annum, per million tonne, nearly 692 ITI trained personnel holders shall be required by the steel and the relevant allied industries combined. As discussed in Chapter 3, the requirement and the above mentioned number is far too smaller than the annual number available from ITI’s nationwide.
There is an apprehension that the required number of ITI trained personnel indicated above is far too small than the actual. Many of the organizations outsource jobs (viz., welding, plumbing, electrical etc.) and hence it is likely that ITI trained personnel actually serving steel industries is not truly reflected in the numbers indicated by the companies. However, in the absence of concrete data on the point, projected numbers cannot be changed. Looking at the issue from a different angle, with future automation in modern steel plants, requirement of ITI trained personnel shall be
29
smaller than projected. This also needs to be kept in my mind when dealing with the number of ITI trained personnel required for steel industry. 2.5.2 Requirement of Graduate and Diploma Engineers By appropriate scale up criteria, required numbers of graduate and diploma engineers engaged in production were already worked out in the preceding section (see Tables 2.7 and 2.9 respectively). If such estimates are corrected by taking into account the current employment and as well as likely superannuation, more realistic and accurate estimates of requirements can be made. Revised estimates of requirements thus obtained, for the upper and the lower bounds, are shown in Tables 2.10(a) and 2.10(b) respectively. Since, discipline wise graduate and diploma engineers per thousand tonne of product are already estimated from the survey results (see Appendix IV), consequently, required number of mechanical, electrical, metallurgical, chemical engineers etc. can be easily estimated for upper as well as lower bounds. This is illustrated in the subsequent sections.
Table 2.10(a) Numbers of graduate and diploma engineers required according to the upper bound in the next ten years for a target production of 300 MT of steel.
Sector Requirements Graduate
Engineers Diploma
Engineers
Primary and secondary steel
producers combined
No adjustment for existing staff
103717 97486
With adjustment for existing staff
1,03,717-0.75x27256=
83275
97,486-0.75x25760=
78166
Table 2.10(b) Numbers of graduate and diploma engineers required according to the lower bound in the next ten years for a target production of 300 MT of steel.
Sector Requirements Graduate
Engineers Diploma
Engineers
Primary and secondary steel producers combined
No adjustment for existing staff
28,280 26,892
With adjustment for existing staff
28,280-0.75x27256=
7838
26,892-0.75x25760=7572
2.5.3 Discipline-wise technical man power requirements for production Based on the estimates shown in Tables 2.10(a) and 2.10(b) respectively and embodying information given in Appendix IV, discipline- wise requirements of graduate and diploma engineers have been calculated for primary and secondary sectors separately. Estimates were made for both upper as well as lower bounds. Details of these are presented in the following.

30
Figure 2.5 Discipline –wise distribution of graduate engineers in integrated steel plants in 2014.
Table 2.11 Discipline wise requirement of graduate engineers in the primary steel producing sector according to the upper bound
Engineering
discipline %
share of
total
(2)
Gross number in production
(3)
Number in R&D and QA (4% of
3) (4)
Manpower in Prod.
+QA (3+4)
(5)
Requirement for allied
Sector (20% of 5)
(6)
Net required
(5+6)
(7)
Metallurgy 16 11479 459 11938 2388 14326 Mechanical. 39 27981 1119 29100 5820 34920
Electrical 22 15784 631 16415 3283 19698 Chemical 05 3587 144 3731 746 4477 Ceramic 01 718 29 747 149 896 IT & CSE 03 2152 86 2238 448 2686
Environmental 01 718 29 747 149 896 Mineral 03 2152 86 2238 448 2686
Civil 04 2870 115 2985 597 3582 Others 06 4305 172 4477 895 5372 Total 100 71746 2870 74616 14923 89539
2.5.3.1 The upper bound By translating the information contained in the Appendix IV into a pi diagram, Fig.2.5 has been constructed to show the discipline–wise distribution of graduate engineers in the existing technical manpower in steel industries. This indicates that integrated mills in India are overwhelmingly managed by mechanical and electrical engineers. Since the total number of graduate engineers required for primary sector is 71746 (= 86636 - 0.75 X19854 in which, 19854 is the currently employed graduate engineers and 0.75 is their availability considering superannuation), consequently, the latter
Discipline wise distribution of graduate engineers in the
integrated mills as on 2014
Metallurgical Engg.(16%)
Mechanical Engg.(39%)
Electrical Engg.(21%)
Chemical Engg.(5%)
Ceramic Engg.(1%)
IT and CSE(3%)
Environm. Engg.(1%)
Mineral Engg.(2%)
Civil Engg.(4%)
Others(6%)

31
number can be proportionately distributed according to Fig.2.5 to deduce discipline-wise requirement of graduate engineers. This is shown in Table 2.11. Since the percentage (%) numbers shown in Fig.2.5, corresponds to the production only, consequently discipline wise numbers were first calculated for production only. This is shown in column 3 of Table 2.11. Since approximately 4% of technical staff is shown to be involved in Q&A ( and too some extent, in routine, R&D activities), consequently estimated values in column 3 were further increased by 4% to represent the number of total graduate engineers in the primary steel producing sector (column 5) . Finally, to accommodate the allied sectors and to estimate the net requirement, numerical values in column 5 were enhanced by 20%. The resultant final numbers are shown in column 7 of Table 2.11. Exactly similar procedure was adopted to determine the net numbers of graduate engineers for the secondary sector which is illustrated through Fig.2.6 and Table 2.12 respectively.
Figure 2.6 Discipline –wise distribution of graduate engineers in secondary steel producing sector in 2014.
Table 2.12 Discipline- wise projected requirement of graduate engineers in the secondary steel
producing sector, according to the upper bound.
Engineering discipline
% share of total (2)
Gross number in production (3)
Number in R&D and QA (4% of 3) (4)
Manpower in Prod. +QA (3+4) (5)
Requirement for allied Sector (20% of 5) (6)
Net required (5+6) (7)
Metallurgy 10 1153 46 1199 240 1439 Mechanical 53 6111 244 6355 1271 7626 Electrical 22 2537 101 2638 527 3165 Chemical 3 346 14 360 72 432 IT & CSE 1 115 5 120 24 144 Others 11 1268 51 1319 264 1583 Total 100 1153010 461 11991 2398 14389
10 11530 is equal to 17081 (see Table 2.7) minus 0.75x 7402 in which 7402 is the existing number of graduate engineers in the secondary sectors.
Discipline wise distribution of graduate engineers in the
secondary steel mills as on 2014
Metallurgical Engg.(10%) Mechanical Engg.(53%) Electrical Engg.(22%) Chemical Engg.(2%) IT&CSE(1%)
Others(11%)

32
Once again, these clearly indicate that secondary sector too is primarily managed by mechanical & electrical engineers. Practically 75% of the total graduate engineers are from mechanical and electrical engineering disciplines! Equivalent requirements of diploma engineers for the primary and secondary sectors are illustrated through Figs. 2.7 and 2.8 as well as Tables 2.13 and 2.14.
Figure 2.7 Discipline –wise distribution of diploma engineers in the primary steel producing sector as in 2014.
Table 2.13 Discipline- wise projected requirement of diploma engineers in the primary steel
producing sector according to the upper bound Discipline % share
of total
(2)
Gross number in production
3)
Number in R&D and
QA (4% of 3)
(4)
Manpower in Prod.
+QA (3+4)
(5)
Requirement for allied Sector
(20% of 5)
(6)
Net requirement
(5+6)
(7) Metallurgy 12 8023 321 8344 1669 10013
Mechanical 46 30756 1230 31986 6397 38383 Electrical 25 16715 669 17384 3477 20861 Chemical 2 1337 53 1390 278 1668 IT & CSE 1 669 27 696 139 835 Mineral 1 669 27 696 139 835 Civil 3 2006 80 2086 417 2503 Others 10 6686 267 6953 1391 8344 Total 100 6686111 2674 69535 13907 83442
11 66861 is equal to 80737 ( see Table 2.7) minus 0.75x 18502 in which 18502 is the existing number of diploma engineers in the primary sectors.
Discipline wise distribution of diploma engineers in the
integrated mills as on 2014
Metallurgical Engg.(12%) Mechanical Engg.(46%) Electrical Engg.(25%)
Chemical Engg.(2%)
IT and CSE(1%)
Mineral Engg.(1%)
Civil Engg.(3%)
Others(10%)

33
Figure 2.8 Discipline –wise projected distribution of diploma engineers in the secondary steel producing sector as in 2014.
Table 2.14 Discipline- wise projected requirement of diploma engineers in the secondary steel
producing sector according to the upper bound
Engineetring discipline
% share of total
(2)
Gross number in production
(3)
Number in R&D and QA
(4% of 3)
(4)
Manpower in Prod.
+QA (3+4)
(5)
Requirement for allied Sector
(20% of 5)
(6)
Net required
(5+6)
(7)
Metallurgy 6 678 27 705 141 846 Mechanical 53 5992 240 6232 1247 7479 Electrical 22 2488 100 2588 518 3106 Chemical 1 113 4 117 23 140 IT & CSE 1 113 4 117 23 140 Others 17 1922 77 1999 400 2399 Total 100 1130612 452 11758 2352 14110
The two preceding tables and figures also reflect that mechanical and electrical disciplines constitute the major portion of diploma engineers both in the primary and secondary steel producing sectors. Furthermore, projected requirements of graduate and diploma engineers, as per the upper bound, are roughly in 1:1 proportion (103928 vs. 97552) reflecting essentially the composition of the current engineering task force and the consequence of straightforward scale up. An interesting feature that comes out of the analysis in this section is mechanical, electrical and metallurgical engineers constitute roughly 80% of the technical task force in the steel plants (both primary and secondary combined).
12 11306 is equal to 16749 ( see Table 2.7) minus 0.75x 7258 in which 7258 is the existing number of diploma engineers in the secondary sectors.
Discipline wise distribution of diploma engineers in the scondary
mills as on 2014 Metallurgical Engg.(6%) Mechanical Engg.(53%) Electrical Engg.(22%) Chemical Engg.(1%) IT and CSE(1%)
Others(17%)
34
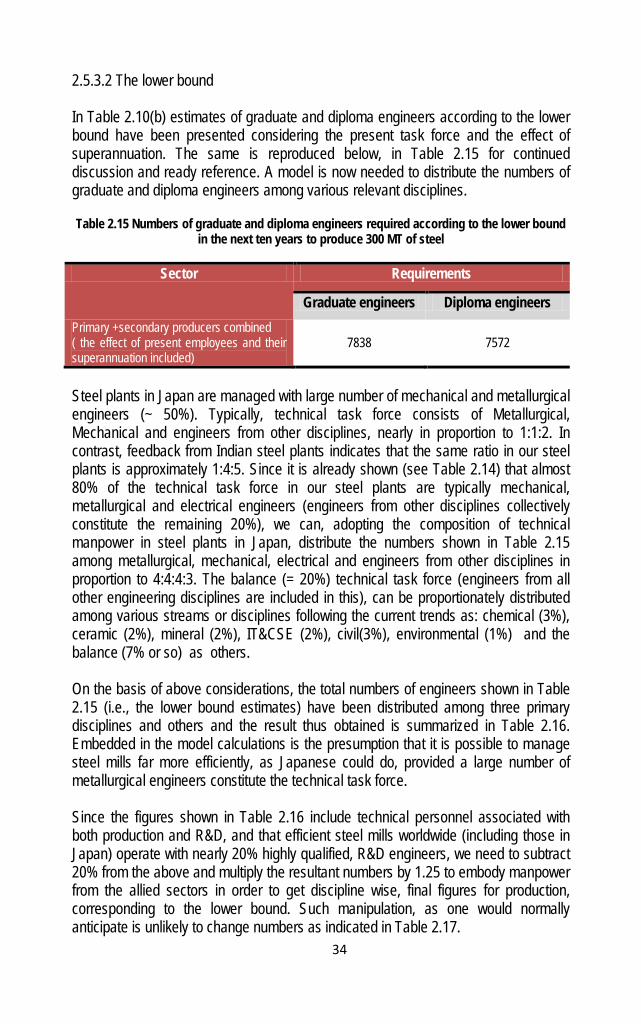
2.5.3.2 The lower bound In Table 2.10(b) estimates of graduate and diploma engineers according to the lower bound have been presented considering the present task force and the effect of superannuation. The same is reproduced below, in Table 2.15 for continued discussion and ready reference. A model is now needed to distribute the numbers of graduate and diploma engineers among various relevant disciplines. Table 2.15 Numbers of graduate and diploma engineers required according to the lower bound
in the next ten years to produce 300 MT of steel
Sector Requirements
Graduate engineers Diploma engineers Primary +secondary producers combined ( the effect of present employees and their superannuation included)
7838
7572
Steel plants in Japan are managed with large number of mechanical and metallurgical engineers (~ 50%). Typically, technical task force consists of Metallurgical, Mechanical and engineers from other disciplines, nearly in proportion to 1:1:2. In contrast, feedback from Indian steel plants indicates that the same ratio in our steel plants is approximately 1:4:5. Since it is already shown (see Table 2.14) that almost 80% of the technical task force in our steel plants are typically mechanical, metallurgical and electrical engineers (engineers from other disciplines collectively constitute the remaining 20%), we can, adopting the composition of technical manpower in steel plants in Japan, distribute the numbers shown in Table 2.15 among metallurgical, mechanical, electrical and engineers from other disciplines in proportion to 4:4:4:3. The balance (= 20%) technical task force (engineers from all other engineering disciplines are included in this), can be proportionately distributed among various streams or disciplines following the current trends as: chemical (3%), ceramic (2%), mineral (2%), IT&CSE (2%), civil(3%), environmental (1%) and the balance (7% or so) as others. On the basis of above considerations, the total numbers of engineers shown in Table 2.15 (i.e., the lower bound estimates) have been distributed among three primary disciplines and others and the result thus obtained is summarized in Table 2.16. Embedded in the model calculations is the presumption that it is possible to manage steel mills far more efficiently, as Japanese could do, provided a large number of metallurgical engineers constitute the technical task force. Since the figures shown in Table 2.16 include technical personnel associated with both production and R&D, and that efficient steel mills worldwide (including those in Japan) operate with nearly 20% highly qualified, R&D engineers, we need to subtract 20% from the above and multiply the resultant numbers by 1.25 to embody manpower from the allied sectors in order to get discipline wise, final figures for production, corresponding to the lower bound. Such manipulation, as one would normally anticipate is unlikely to change numbers as indicated in Table 2.17.
35
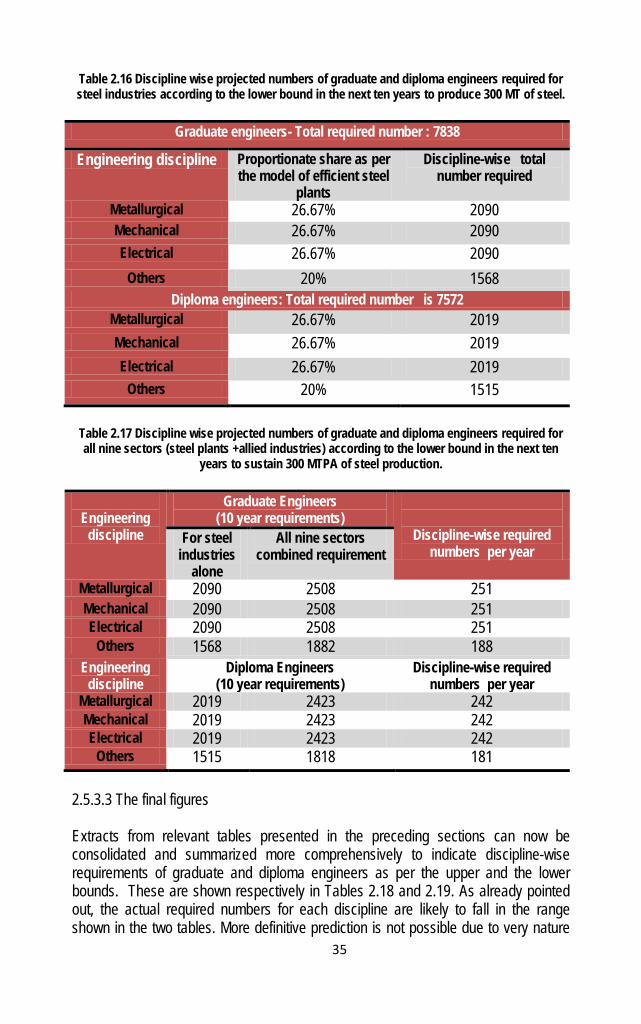
Table 2.16 Discipline wise projected numbers of graduate and diploma engineers required for steel industries according to the lower bound in the next ten years to produce 300 MT of steel.
Graduate engineers- Total required number : 7838
Engineering discipline Proportionate share as per the model of efficient steel
plants
Discipline-wise total number required
Metallurgical 26.67% 2090 Mechanical 26.67% 2090 Electrical 26.67% 2090
Others 20% 1568 Diploma engineers: Total required number is 7572
Metallurgical 26.67% 2019 Mechanical 26.67% 2019 Electrical 26.67% 2019
Others 20% 1515
Table 2.17 Discipline wise projected numbers of graduate and diploma engineers required for all nine sectors (steel plants +allied industries) according to the lower bound in the next ten
years to sustain 300 MTPA of steel production.
Engineering
discipline
Graduate Engineers (10 year requirements)
Discipline-wise required numbers per year
For steel industries
alone
All nine sectors combined requirement
Metallurgical 2090 2508 251 Mechanical 2090 2508 251 Electrical 2090 2508 251
Others 1568 1882 188 Engineering
discipline Diploma Engineers
(10 year requirements) Discipline-wise required
numbers per year Metallurgical 2019 2423 242 Mechanical 2019 2423 242 Electrical 2019 2423 242
Others 1515 1818 181 2.5.3.3 The final figures Extracts from relevant tables presented in the preceding sections can now be consolidated and summarized more comprehensively to indicate discipline-wise requirements of graduate and diploma engineers as per the upper and the lower bounds. These are shown respectively in Tables 2.18 and 2.19. As already pointed out, the actual required numbers for each discipline are likely to fall in the range shown in the two tables. More definitive prediction is not possible due to very nature

36
of the problem and the various uncertainties associated with extrapolation. It is important to note that on top of the graduate and diploma engineers shown in the two aforementioned tables, nearly fifteen thousand two hundred fourteen (15214) ITI trained personnel shall also be needed annually to manage steel and allied industries of the future.
Table 2.18 A summary of projected discipline wise requirement of engineers in the steel and allied sectors according to the upper bound.
Engineering discipline
Graduate Engineers
Diploma Engineers
Yearly requirements
Yearly requirements
Graduate Engineers
Diploma Engineers 10 year requirements
Metallurgy 15765 10859 1577 1086 Mechanical 42546 45862 4255 4586 Electrical 22863 23967 2286 2397 Chemical 4909 1808 491 181 Ceramic 896 insignificant 90 insignificant IT & CSE 2830 975 283 97 Environtal 896 insignificant 90 insignificant Mineral 2686 835 268 84 Civil 3582 2503 358 250 Others 6955 10743 696 1074 Total 103928 97552 10394 9755 Results presented in Tables 2.18 and 2.19 indicate that relatively large number of mechanical, electrical and metallurgical engineers shall be required to manage steel plants and allied industries of the future. It is important to mention that annual projected requirement for each discipline is substantially smaller than the annual GATE examinees implying essentially that availability of engineers for steel and allied industries is generally not a matter of concern. This is however not as simple. In Chapter 3, a detailed analysis on the availability of technical manpower has been presented to address possible gap between requirement and availability. It is rather well known that Indian steel plants though are productive, certainly not largely innovative. This has been analysed at length in the 2011 and 2012 reports13. In the following section, R&D in steel industry and the associated man power related issues are addressed in detail.
Table 2. 19 A summary of projected discipline wise requirement of engineers in the steel and
allied sectors according to the lower bound
13 1. A Roadmap for Research and Development and Technology for Indian Iron and Steel Industry: Ministry of Steel, Govt.of India, 2011 2. Success and Gaps in our Metallurgical RD Efforts, Indian National Academy of Engineering, New Delhi, 2012.

37
Engineering discipline
Graduate Engineers
Diploma Engineers
Yearly requirements
Yearly requirements
Graduate engineers
Diploma engineers 10 year requirements
Metallurgy 2508 2423 251 242 Mechanical 2508 2423 251 242 Electrical 2508 2423 251 242 Chemical 283 273 28 27 Ceramic 188 182 18 18 IT & CSE 188 182 19 18 Mineral 188 182 19 19 Civil 283 273 28 27 Others 752 726 75 73 Total 9406 9087 940 908 Requirement per year, per million tonne for upper as well as lower bounds is shown in Tables 2.20 and 2.21 respectively
Table 2.20 A summary of projected discipline wise requirement of engineers in the steel and
allied sectors according to the upper bound
Engineering discipline
Graduate Engineers
Diploma Engineers
Yearly requirements per million Tonne
Graduate Engineers
Diploma Engineers 10 year requirements
Metallurgy 15765 10859 72 50 Mechanical 42546 45862 193 208 Electrical 22863 23967 104 109 Chemical 4909 1808 22 08 Ceramic 896 insignificant 04 insignificant IT & CSE 2830 975 13 04 Environmental 896 insignificant 04 insignificant Mineral 2686 835 12 04 Civil 3582 2503 16 11 Others 6955 10743 32 49 Total
103928
97552
472
443

38
Table 2. 21 A summary of projected discipline wise requirement of engineers in the steel and allied sectors according to the lower bound
Engineering discipline
Graduate Engineers
Diploma Engineers
Yearly requirements per million Tonne
Graduate Engineers
Diploma Engineers 10 year requirements
Metallurgy 2508 2423 11 11 Mechanical 2508 2423 11 11 Electrical 2508 2423 11 11 Chemical 283 273 02 ~01 Ceramic 188 182 ~01 ~01 IT & CSE 188 182 ~01 ~01 Mineral 188 182 ~01 ~01 Civil 283 273 ~02 ~01 Others 752 726 03 03 Total
9406
9087
43
41
2.6 Researchers for steel plants Word class steel mills not only produce quality steel at cheaper price (owing to state of the art technology, material and energy recycling etc.) these also provide effective solutions for managing less efficient steel mills worldwide. Nippon steel, JFE, Bao steel etc. are classic examples and represent the premier class of steel plants14 on which not only Indian promoters rely heavily for technology but others as well. These industries could provide leadership and help drive steel industries forward because of a strong R&D. Tables 2.22 (a) and (b) show the nature of technical manpower division in a steel plant in Japan. There, as seen, 20% of the total technical personnel are the researchers. Furthermore, as gathered through personal communication, half of such research engineers in steel plants are metallurgists, who are highly qualified having generally a Ph.D. or a master degree in metallurgical engineering!! In contrast, steel plants in India barely have 5~ 6% of their technical staff working in R&D as well as quality assurance (QA) jobs. These engineers often do not have the requisite background to initiate and execute innovative R&D exercises. This as a consequence has resulted into little or no innovation. Truly therefore, It is legitimate to consider the 6% technical personnel against QA rather than R&D. Given this, we can conclude that there is a serious deficiency of highly qualified R&D personnel in domestic steel industries. Evidently, the present situation has to change for sustaining future, world class steel industries and this necessitates that R&D is significantly strengthened in both primary and secondary steel producing sectors. To accomplish the objective, a large number of Ph.D. and master degree holders in engineering
14 There are other solution providers as well such as Primetals (a wing of Siemens), Danieli etc. which work on future technology and help erect and modernise steel plants.

39
disciplines (specially in iron and steel metallurgy) shall be needed in the next ten years and beyond. The present situation, as shown in Fig.2.9, is indeed dismal indicating essentially the absence of highly qualified technical personnel in the present day task force of steel industry.
Table 2. 22(a) Characteristics of technical manpower division in steel plants in Japan.
Nippon Steel +
Sumitomo Metals
Corporation
Total Engineers + Researchers
Total Engineers in production
Total Researchers
Others
25-30MMT 5000 3500 1000 500
Table 2. 22(b) Characteristics of technical manpower division in Indian steel industries (primary and secondary combined).
Steel
industries in India
Total Engineers + Researchers
Total Engineers in production + maintenance
etc.
Engineers in R&D+QA
78-81MMT 56189 52388 3801
(a) (b)
Figure 2.9 Relative proportion of engineers in R&D and QA vis a vis the total number of
engineers in production and (b) the number of doctorate and masters degree holders among engineers employed in the R&D and QA.
In the light of the above, it is important to have an idea of the number of researchers that would be necessary to manage R&D activities effectively in future steel industries in the country. Once again, the existing scenario in steel plants in Japan can be used as a reference to work out the relevant numbers. According to the lower bound estimates shown in Table 2.9, 28240 graduate engineers and 26892 diploma engineers shall be needed to manage modern and efficient steel plants of the country

40
for producing 300 MTPA ( primary and secondary sectors combined). Since 20% of the total engineers in any efficient steel plants are supposed to be researchers, this implies that eleven thousand twenty six [11026 (= 0.20x55132)] researchers shall be needed in the country to manage and sustain 300 MTPA of steel production. Furthermore, since of the total researchers, nearly 50% are expected to be metallurgists, this implies that approximately 5513 master and doctoral degree holders shall be needed over next ten years to run the domestic steel industries efficiently. Therefore, annual demand over the next ten years for master and doctoral degree holders in metallurgical engineering alone is nearly 550. Such estimates shall not change significantly since only a handful of master and Ph.D. degree holders have been shown to be currently employed in steel industries.Since the above mentioned figure has been arrived at from the lower bound considerations, this is the least that is required. A web based survey of IITs and NITs as well as IISc. has indicated that presently not even 5 Ph.D.’s and 30 M.Tech.’s in the area of iron and steel metallurgy are produced in the country annually. As examples, IIT Kanpur since inception, during the last 60 years, has produced altogether 750 M.Tech. and 95 Ph.D.’s. Similarly, during the past ten years, in the area of iron and steel metallurgy, IIT BHU has produced 28 M.Tech.’s and 4 Ph.D.’s. Alarmingly, there are not even ten professors left in the academia who are truly specialized in iron and steel metallurgy! Given such, ensuring such a large number of M.Tech.’s and Ph.D.’s, needed to drive future, innovative domestic steel mills, is truly a challenging task. Search for a radically different paradigm is needed to address this critical issue.

41
3
Availability of technical manpower
3.1 Introduction The chapter discusses the present status of technical education in the
country, and makes an assessment of the likely availability of technical manpower from academic institutions based on current sanctioned intake for different types of institutions. The employability of fresh graduate engineers by the industry, based on their skill levels, is reviewed and the availability of graduate engineers suitably adjusted.
3.2 Growth of engineering/technical institutions
There has been a marked growth in the number of engineering institutes over the last few years. This has been largely due to the surge in demand for qualified technical manpower, in view of the industrial growth being witnessed by the country. The growth in the number of engineering institutions in the country between 2006-07 and 2013-14 is illustrated in Fig.3.1.
Figure 3.1 Growth in number of engineering institutions (Source: AICTE).
As a consequence of the growth in the number of technical institutions, the total sanctioned intake of under graduate students in the engineering institutes has also grown considerably in the past, as illustrated in Fig.3.2.

42
3.3. Availability of technical manpower from academic institutions In order to assess the availability of engineers, diploma holders and ITI trained personnel across the country, interactions were held with many of the leading engineering institutes, as well as Government agencies. The Directorate of Employment & Training was contacted for information on availability of trained personnel from ITIs and ITCs. The publications and web site of All India Council of Technical Education (AICTE) were consulted for compiling the information. Figure 3.2 Growth in sanctioned intake of under graduate students (Source: AICTE). 3.3.1 Sanctioned intakes of under graduate and post-graduate students
The current sanctioned intakes of students in all disciplines at the under graduate and post-graduate levels, by the different institutions, are given in Table 3.1.
Table 3.1 Sanctioned intakes of under graduate and post graduate students (all
disciplines) 15. Institution Under graduate Post graduate Total
Number % Number % Number % IITs 8,360 0.5 1,388 0.6 9,748 0.5 NITs 15,484 0.9 7,840 3.6 23,324 1.2
Others (1) 17,07,283 98.6 2,12,084 95.8 19,19,367 98.3 Total 17,31,127 100.0 2,21,312 100.0 19,52,439 100.0
From the above table it is observed that over 98 per cent of fresh graduates would be from institutes other that IITs and NITs. In the case of post graduates, contribution of IITs and NITs is somewhat higher (about 4 per
15(1)From AICTE web site. Also, www.slideshare.net/anushrikocher/intake-of-iit-and-ism and csab.nic.in/csabseatinfo/root/BranchInst.aspx were consulted to construct the table.
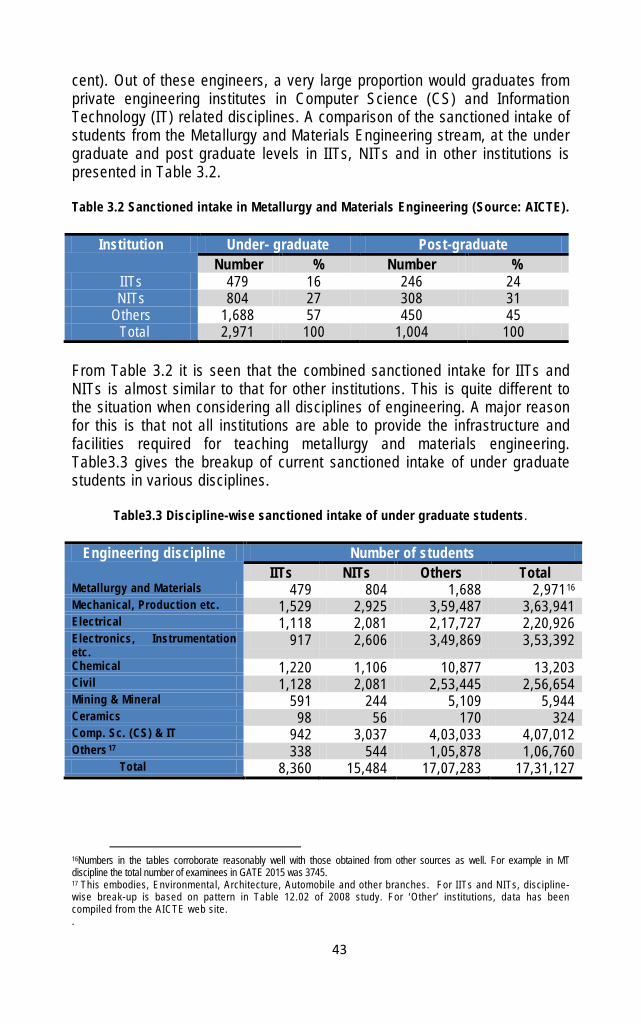
43
cent). Out of these engineers, a very large proportion would graduates from private engineering institutes in Computer Science (CS) and Information Technology (IT) related disciplines. A comparison of the sanctioned intake of students from the Metallurgy and Materials Engineering stream, at the under graduate and post graduate levels in IITs, NITs and in other institutions is presented in Table 3.2.
Table 3.2 Sanctioned intake in Metallurgy and Materials Engineering (Source: AICTE).
Institution Under- graduate Post-graduate
Number % Number % IITs 479 16 246 24 NITs 804 27 308 31
Others 1,688 57 450 45 Total 2,971 100 1,004 100
From Table 3.2 it is seen that the combined sanctioned intake for IITs and NITs is almost similar to that for other institutions. This is quite different to the situation when considering all disciplines of engineering. A major reason for this is that not all institutions are able to provide the infrastructure and facilities required for teaching metallurgy and materials engineering. Table3.3 gives the breakup of current sanctioned intake of under graduate students in various disciplines.
Table3.3 Discipline-wise sanctioned intake of under graduate students.
Engineering discipline Number of students IITs NITs Others Total
Metallurgy and Materials 479 804 1,688 2,97116 Mechanical, Production etc. 1,529 2,925 3,59,487 3,63,941 Electrical 1,118 2,081 2,17,727 2,20,926 Electronics, Instrumentation etc.
917 2,606 3,49,869 3,53,392 Chemical 1,220 1,106 10,877 13,203 Civil 1,128 2,081 2,53,445 2,56,654 Mining & Mineral 591 244 5,109 5,944 Ceramics 98 56 170 324 Comp. Sc. (CS) & IT 942 3,037 4,03,033 4,07,012 Others 17 338 544 1,05,878 1,06,760
Total 8,360 15,484 17,07,283 17,31,127
16Numbers in the tables corroborate reasonably well with those obtained from other sources as well. For example in MT discipline the total number of examinees in GATE 2015 was 3745. 17 This embodies, Environmental, Architecture, Automobile and other branches. For IITs and NITs, discipline-wise break-up is based on pattern in Table 12.02 of 2008 study. For ‘Other’ institutions, data has been compiled from the AICTE web site. .

44
Based on the discipline-wise breakup given in Table3.3, the summarized sanctioned intakes for CS & IT related disciplines as well as for non-CS & IT related disciplines are given in Table 3.4. 3.4 Availability of Graduate Engineers for steel industry based on sanctioned strength On the basis of the discipline-wise sanctioned intake of under graduate students, which is expected to be a reasonable estimate of graduating engineers that will be annually available for employment, as given in Table3.3 earlier, an attempt has been made to assess the likely availability of graduate engineers for the steel industry. This has been done on certain considerations/assumptions, as listed out below, based on feedback obtained from some of the institutions regarding pattern of placement of their graduating students. To arrive at the relevant values, the following assumptions were invoked: i) For graduates from CS & IT related streams, 80 per cent from IITs, NITs and other institutions will find placement in IT related sectors; 5 per cent graduates from IITs, and 10 per cent from NITs and other institutions will proceed for higher studies; balance 15 per cent from IITs, and 10 per cent from NITs and other institutions will join the core/manufacturing sectors, which includes the steel industry. ii) For graduates from non CS & IT related streams, 55 per cent from IITs, NITs and other institutions will find placement in IT related sectors; 10 per cent graduates from IITs, and 20 per cent from NITs and other institutions will proceed for higher studies; balance 35 per cent from IITs, and 25 per cent from NITs and other institutions will join the core/manufacturing sectors, which includes the steel industry. The above considerations/assumptions are summarized in Table 3.5.
Table 3.4 Summarised sanctioned intakes of under graduate students.
3.4.1 Estimated availability for steel industry Based on the estimated likely total availability of graduate engineers from different disciplines, as given in Table 3.3 and the anticipated placement
Institutions Number of students CS & IT related
disciplines
Non CS & IT related
disciplines
Total
IITs 1,859 6,501 8,360 NITs 5,643 9,841 15,484
Others 7,52,902 9,54,381 17,07,283 Total 7,60,404 9,70,723 17,31,127

45
pattern given in Table 3.5, the likely availability of fresh engineering graduates, seeking employment in the steel industry, is presented in Table3.6. In estimating the availability, it is assumed that 40 per cent of graduates from Metallurgy & Materials Science and Mining & Mineral Engineering disciplines, and 25 per cent of graduates from all other disciplines, seeking employment in the core/manufacturing sectors, will opt for the steel industry.
Table3.5 Considerations/assumptions for estimating availability of graduate
Engineers for steel industry.
Table 3.6 Likely availability of graduate engineers for steel industry
Engineering
discipline % Deployment Number 18
In core or manuf. In steel industry
From IITs
From NITs & others
Total IITs NITs &
others Metallurgy and
materials 35 25 40 67 249 316
Mechanical, production etc.
35 25 25 134 22,651 22,785
Electrical 35 25 25 98 13,738 13,836 Electronics,
Instrumentation etc.
15 10 25 34 8,812 8,846
Chemical 35 25 25 107 749 856 Civil 35 25 25 99 15,970 16,069
Mining & Mineral 35 25 40 83 535 618 Ceramics 35 25 25 9 14 23 CS & IT 15 10 25 35 10,152 10,187
Others (1) 35 25 25 30 6,651 6,681 Total 696 79,521 80,217
18 Computed as (% in core/mfg sector) x (% in steel industry) x (sanctioned intake)
Graduating Institutions
Placement In IT and related
sectors For higher
studies In core or
manuf. sectors CS & IT related disciplines
IITs 80% 5% 15%
NITs & others 80% 10% 10%
Non CS & IT related disciplines IITs 55% 10% 35%
NITs & others 55% 20% 25%

46
3.5 Employability of Graduate Engineers 3.5.1Findings of various studies A number of studies have been carried out from time to time to assess the employability of fresh graduates from Indian institutions, including engineers. These include: (i) The National Employability Report, Engineers, Annual Report 2014 by Aspiring Minds. (ii) The India Skills Report 2014, jointly prepared by PeopleStrong, Wheebox and CII and (iii) Employability and Skills of Newly Graduated Engineers in India, Policy Research Working Paper 5640 by World Bank, Washington DC. The salient findings of these studies are summarized in Table 3.7. All the studies conclude that the skill sets and innovative qualities in the fresh graduates are generally far below the expectations of the prospective employers.
Table 3.7 Major findings of studies on employability.
Studies Agency Major findings National Employability Report, Engineers, Annual Report 2014
Aspiring Minds (i) About 50% engineers prefer software jobs; 45% core engineering jobs. (ii) Less than 20% engineers employable for software jobs; about 7% for core engineering jobs. (iii)Employability for top colleges ~80%; almost 40% colleges have employability below 11%.
The India Skills Report 2014
People Strong Wheebox CII
(i)Anticipated skill gap of 75-80% across industry sectors. (ii)In age group 18-29 years, employability varied between 40% and 20%. (iii)Employability of BE/BTech ~52%; BSc ~42%; ITI ~47%; Polytechnics ~12%.
Employability and Skills of Newly Graduated Engineers in India, Policy Research Working Paper 5640
World Bank, Washington, DC
(i) Shortage of skills a major constraint to continued growth of economy. (ii) Employers complain new graduate engineers lack suitable skills. (iii) Engineering schools should focus more on higher order skills and creativity in graduates.

47
3.5.2 Yearly effective intake of under graduate students adjusted for ‘employability’ Based on the above mentioned findings in respect of employability of fresh graduates, the sanctioned intakes have been adjusted downwards adopting the following ‘employability factors which are summarised in Table 3.8 below’:
Table 3.8 Employability factor considered in this work.
Source
institution Discipline Employability factor 19
IITs
All disciplines 90%
NITs
All disciplines 70%
Others
Metallurgy 70% Others 50%
Adopting the above ‘employability factors’, the discipline-wise adjusted intakes of under graduate students are presented in Table 3.9.
Table3.9 Discipline-wise ‘effective’ intake of under graduate students (adjusted for employability) 20.
Engineering discipline
Number of students IITs(1) NITs(1) Others(1) Total
Metallurgy and materials 431 563 1,182 2,176 Mechanical, Production etc. 1,376 2,048 1,79,744 1,83,168 Electrical 1,006 1,457 1,08,864 1,11,327 Electronics, Instrumentation, etc.
825 1,824 1,74,935 1,77,584 Chemical 1,098 774 5,439 7,311 Civil 1,015 1,457 126,723 1,29,195 Mining & Mineral 532 171 2,555 3,258 Ceramics 88 39 85 212 Computer Sc. & IT 848 2,126 2,01,517 2,04,491 Others 304 381 52,939 53,624
Total
7,523 10,840 8,53,983 8,72,346
19 % of sanctioned intake 20 (1) Computed as (Sanctioned intake) x (Employability factor)

48
Table3.10 Placement patterns from all engineering colleges/institutions for two distinct categories of students viz., CS and IT related as well as non-CS and IT
related disciplines.
Graduating Institutions
Placement In IT related
sectors For higher
studies In core or
manuf. sectors CS & IT related disciplines
IITs, NITs and others 80% 5% 15%
Non CS & IT related IITs, NITs and others
55% 10% 35%
3.5.3 Estimated availability for steel industry considering employability of fresh graduates Based on the ‘effective’ intakes given in Table 3.9 above, the likely availability of graduate engineers for the steel industry is given in Table3.11. In doing so, the placement pattern considered is summarised in Table 3.10.It is to be noted that the placement patterns for IITs, NITs and other institutions have been taken as similar for each broad stream of study since the sanctioned intakes have been suitably adjusted for employability.
Table 3.11 Likely availability of graduate engineers for steel industry (adjusted for employability)
Engineering
discipline % Deployment Number 21
In core or manuf. In steel industry
From IITs
From NITs & others
Total IITs NITs &
others Metallurgy and Materials
35 35 40 60 244 304 Mechanical , production etc.
35 35 25 120 15,907 16,027 Electrical 35 35 25 88 9,653 9,741 Electronics, Instrumentations etc.
15 15 25 31 6,628 6,659 Chemical 35 35 25 96 544 640 Civil 35 35 25 89 11,216 11,305 Mining & Mineral 35 35 40 74 382 456 Ceramics 35 35 25 8 11 19 CS & IT 15 15 25 32 7,637 7,669 Others (1) 35 35 25 27 4,665 4,692
Total 625 56,887 57,512
21 Computed as (% in core/mfg sector) x (% in steel industry) x (effective intake)

49
3.5.4 Range of availability of Graduate Engineers The likely availabilities of graduate engineers for the steel industry based on sanctioned intake, and after factoring in ‘employability’ of fresh graduates, are compared in Table 3.12.
Table 3.12 Range of availability of graduate engineers.
Engineering discipline Range of availability
Based on sanctioned intake only
Considering employability aspect
Metallurgy and Materials 316 304 Mechanical, Production etc. 22,785 16,027 Electrical 13,836 9,741 Electronics, Instrumentations etc.
8,846 6,659 Chemical 856 640 Civil 16,069 11,305 Mining & Mineral 618 456 Ceramics 22 23 19 Comp. Sc. (CS) & IT 10,187 7,669 Others 6,681 4,692
Total 80,217 57,512
Figure 3.3 Growth of polytechnics and sanctioned intake (Source: AICTE)
22 An independent feedback obtained from college of glass and ceramic engineering Kolkata, puts the figure at 50.

50
3.6 Polytechnic Institutes 3.6.1 Growth of Polytechnics In keeping with the spurt in demand for qualified diploma holders in engineering, AICTE has been approving the setting up of new polytechnic institutes. Fig.3.3 illustrates the growth in the number of polytechnic institutes and their corresponding sanctioned number of intakes between 2006-07 and 2013-14. The current sanctioned intake is 11.35 lakh. The discipline-wise breakup of sanctioned intake is given in Table 3.13.
Table 3.13 Sanctioned intake in polytechnics (Source: AICTE).
Engineering discipline Number % Civil 2,83,795 25
Mechanical 2,83,795 25 Electrical, IT, Electronics &
Telecommunications 3,40,554 30
Others including Metallurgy 2,27,035 20
Total
11,35,179
100
3.6.2 Availability of diploma holders for steel industry Considering the discipline-wise sanctioned intake given in Table 3.13 and factoring in the level of employability indicated in the study ‘The India Skills Report 2014’, the likely availability of diploma holders for the steel industry is given in Table 3.14.
Table 3.14 Likely availability of diploma holders for steel industry.
Engineering discipline Number Sanctioned
intake Likely availability
Civil 2,83,795 34,055 Mechanical 2,83,795 34,055 Electrical, IT, Electronics & Telecommunications
3,40,554 40,866
Others including Metallurgy 2,27,035 27,244
Total
11,35,179
1,36,220

51
3.7 Industrial Training Institutes As per the Annual Report 2013-14 of the Ministry of Labour & Employment, Government of India, there are 10,750 Government and private ITI’s in the country, with a sanctioned intake of 15,23,696. Of the total intake, 50 per cent is reserved for women, disabled, Defence personnel and OBCs. It is anticipated that only 25 per cent of the sanctioned intake (i.e.,3,80,924) relates to disciplines that are relevant for the steel industry.
52
4
Consolidation: observations, deliberations and recommendations
4.1 Introduction
Estimation of requirement and availability of technical manpower for the future is complex. Future prediction, as such, is difficult and often turns out to be far from the reality. In chapters 2 and 3, based on data collected from industry and academic bodies and their consequent rationalisation, an attempt has been made to deduce relevant numbers to address requirement and availability of technical manpower with reference to domestic steel industries in the country. Various assumptions as well as uncertainties associated with the exercise have been stated explicitly. Because of the complexity of the issue at hand, it was further decided to discuss and deliberate the entire exercise (essentially the contents of Chapters 2 and 3) in an expert group such that outcome from the study can be presented in a meaningful manner to essentially benefit government agencies, industries and academia, concerned with steel production and education. In the following, results of the deliberations are presented. This can be summarily taken as the conclusions and recommendations from the present study. Beyond such, as pointed out in subsequent sections, many interesting view points and different perspectives of the complex problem followed, which are also summarised to help future shaping of steel industries and academic institutions in the country.
4.2. Deliberation on manpower requirement, availability, analysis and results Results presented in Chapters 2 and 3 have indicated that in comparison to the annual requirement of graduate/diploma engineers in steel industry, almost all engineering disciplines in undergraduate program attract considerably more number students every year. However, all students graduating from any particular discipline are not available for immediate employment because of different reasons and these for example include, personal ambitions as well as various socio-economic reasons. Once various factors are included in the analysis through a suitable “employability factor”, available number of graduate engineers for steel industries can be computed It is thus found out that substantially smaller numbers are actually available (particularly for materials and metallurgy for which the availability is roughly 10% of the intake). Results presented in Chapters 3 and 4 have also indicated that if future steel plants embody modern technology and automation, no shortfall of graduate engineers for any discipline is likely. This follows since the lower bound numbers

53
shown in Table 2.19 are smaller than the computed effective availability of graduate/diploma engineers shown in Tables 3.12 and 3.14 respectively. In contrast, if steel mills continue to remain as these are today and do not modernize as expected, there is likely to be some shortfall in the supply of graduate metallurgical engineers (compare for example the numbers shown in Tables 2.18 and 3.12) and to some extent, for ceramic engineers.
To address the above and to analyse critically various related issues, a brain storming session was conducted at IIT Kanpur on the 13th of April, 2015 involving various stake holders. In this meeting, key personnel from steel industries (integrated and secondary sectors), academia, R&D laboratories, manufacturing associations etc. were invited. Altogether 28 personnel from various quarter attended the meeting to deliberate the exercise carried out at IIT Kanpur since August 2014. A list of participating members together with their affiliation is summarized in Appendix V. During the meeting the co-investigator made a detailed presentation (see Fig.4.1). Several suggestions were advocated by members and these were subsequently embodied in the study to improve the accuracy and quality of the present exercise.
Figure 4.1 A moment captured photographically during the brainstorming session held at IIT
Kanpur on the 13th of April, 2015.
4.3. Summary of observations and recommendations: The entire work on the subject of requirement and availability of technical manpower for domestic steel industries was deliberated extensively for a full day. Numerous observations and recommendations have been made. The generally agreed observations /conclusions from the study are summarised in the following:

54
(i) Based on employability, although a gap between requirement and availability of B.Tech./BE in Metallurgical engineering was shown to exist, practically all members opined that the gap is more in terms of knowledge than numbers. It was noted that the number of engineers graduating in metallurgical engineering is far more than the yearly required numbers for the steel and allied industries combined. It is unfortunate that a very small number of graduating students take up career in steel industries. (ii) It is suggested that, with curriculum in many institutions tilting towards materials science and engineering, the component of process /extractive metallurgy has decreased significantly over the years. To reverse the effect of such changes, educational institutes should engage experts from industry as adjunct professors who could offer and teach, from time to time, tailored made elective courses on plant relevant topics. Such endeavour, in turn, is likely to bridge the gap in knowledge that exists currently in graduating engineers, particularly in the discipline of metallurgical engineering. In general, expectations of steel plants are not fulfilled to a large extent from currently available metallurgical engineering graduates in the country. Industry relevant subjects such as automation, emission and environment must also be emphasized in the metallurgical engineering curricula to make engineers more relevant to the metals processing industry. (iii) Metallurgical engineers find it less attractive to join steel processing and allied industries following graduation. Compensation package, harsh industrial environment, plant location etc. are some of the issues of concern and key factors that tend to discourage graduating students from making a career in steel plants. Furthermore, for metallurgical engineers, there is not much scope to flourish in the plant. These are also important factors in the retention of newly recruited engineers in steel plants. It is suggested that job content and compensation packages be improved to attract and retain bright minds. Steel plants must play a proactive role in this direction. (iv)Undergraduate projects relevant to steel industry must be offered to students to increase interest and creativity among metallurgical engineering students. Paid summer internship programs must be vigorously pursued. In addition to these, teachers must be exposed to industry so that knowledge can be imparted in the class room more realistically and effectively. Similarly, deferred learning or participation of practicing engineers in continuing education program is a must such that full potential of “theory assisted practice” could be exploited on the shop floor. (v) In view of the large attrition rate as well as unwillingness on the part of technically qualified personnel (mostly graduate engineers) to join steel industry, it is advocated that new, model polytechnics and ITI’s be located in the vicinity of steel plants. These can balance technical manpower supply to steel plants somewhat. (vi) Although quality/skill of pass outs from polytechnics and ITI’s is a general matter of concern to steel industries, such technical personnel should be, as a routine, imparted practical training on shop floor prior to their full deployment in the task force. It is suggested that National Skill Development Council (NSDC) established by the

55
Govt. India is likely to fill this gap and thereby enhance the quality of polytechnic and ITI pass outs further, who could effectively contribute to the prosperity of steel industries. (vii) Steel plants in India tend to be managed by more mechanical than metallurgical engineers. Unless we become an innovative steelmaking nation, such a trend is likely to continue since to sustain daily production by smooth running of various machineries, large number of mechanical and electrical engineers are generally required. It is suggested that significant and meaningful R&D actives in the plant as well as a change in the aspiration of the management can alter the prevailing scenario to a large extent. (viii) Steel plants in India in general do not tend to nurture research and development activities. Barring routine inspection and quality jobs, hardly a handful of engineers are engaged in R&D activities. Often expectations from R&D personnel are also not spelt out. To this end it is pointed out that a large number of M.Tech.’s and Ph.D.’s in iron and steel metallurgy are not presently available in the country. Furthermore, he quality of mater and Ph.D students are often not up to the mark. As there is no additional incentive in joining R&D, relatively bright students are naturally reluctant towards making a career in R&D in steel plant. The situation aggravates since technical personnel working in production are generally given relatively more attention/importance. Finally, R&D and plant personnel rarely work together, hand in hand, making researchers in steel plants look somewhat irrelevant. Industry must take a proactive role to make plant R&D more relevant and attractive. (ix) While industries have to change aspiration from a mere money making establishment to an “innovative, money making set up”, existing academic institutes must also be strengthen to bolster R&D activities in iron and steel metallurgy. To this end, Industry and government must come forward to support academic institutions in terms of industry oriented projects, manpower, equipment etc. Certainty in post education employment is important and is likely to make such efforts more attractive. (x) Setting up of a graduate school in ferrous metallurgy on the same line as POSTECH can help generate more master and doctorates needed to effectively serve steel plant R&D. However, the concept may be difficult to work out given that country is presently lacking a critical manpower in iron and steel metallurgy, required to initiate such ambitious projects and bring it to fruition. In summary, the discussion points out that academia, industry and the Ministry of Steel have many important roles to play and must collectively make decisive efforts in many fronts in order to change the existing scenario. Well defined area of improvements for stake holders have been enumerated and highlighted above.

56
APPENDIX I Members of various committees constituted to execute the present work
A. Core committee
Member Affiliation Area of expertise
Dr.Indranil Manna IIT, Kanpur Education & Metallurgy Dr. Dipak Mazumdar IIT, Kanpur Education and Metallurgy
Dr.T Venugopal Tata Steel Iron and Steel and manpower
Dr.Vinay K.Gupta RDCIS, SAIL Mineral processing
Dr. Arup Ghosh CGCRI, Kolkata Refractory Mr.R.K.Bagchi NISST, Govindgarh Metallurgy/industry/
education Mr. Sushim Banerjee INSDAG, Kolkata Metallurgy/manpower
Mr. D.Kashiva Sponge iron manufacturers
association (SIMA)
Metallurgy/Sponge iron
B. Project committee
Member Affiliation Area of expertise Dr. Dipak Mazumdar IIT Kanpur Education and Metallurgy Dr.Amarendra Singh IIT Kanpur Iron and Steel Mr.Saktimoy Ghosh JSPL Iron and Steel
Mr.Bhaskar Roy IIM Manpower
C. Expert committee
Name Affiliation Dr. Baldev Raj President INAE, Former President IIM
Dr. Sanak Mishra Vice president INAE; Former President IIM Dr. T.Mukherjee Former DMD, Tata Steel: Former President IIM
Dr. Subir Bhattacharya Former ED, SAIL RDCIS; Former President IIM Mr. R.N.Parbat Former President , IIM
Mr. Sashi Sekhar Mohanty Director (Technical) SAIL;Vice President IIM Dr. Srikant Director NML, Jamshedpur
Mr. A.C.R.Das Advisor, Ministry of Steel, New Delhi
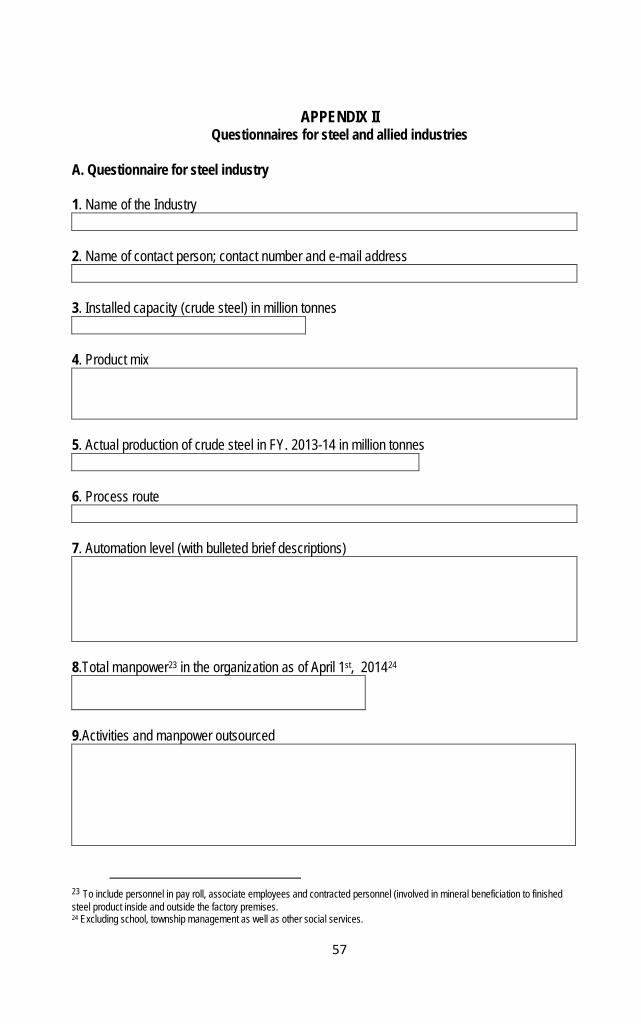
57
APPENDIX II Questionnaires for steel and allied industries
A. Questionnaire for steel industry 1. Name of the Industry
2. Name of contact person; contact number and e-mail address
3. Installed capacity (crude steel) in million tonnes
4. Product mix
5. Actual production of crude steel in FY. 2013-14 in million tonnes
6. Process route
7. Automation level (with bulleted brief descriptions)
8.Total manpower23 in the organization as of April 1st, 201424
9.Activities and manpower outsourced
23 To include personnel in pay roll, associate employees and contracted personnel (involved in mineral beneficiation to finished steel product inside and outside the factory premises. 24 Excluding school, township management as well as other social services.
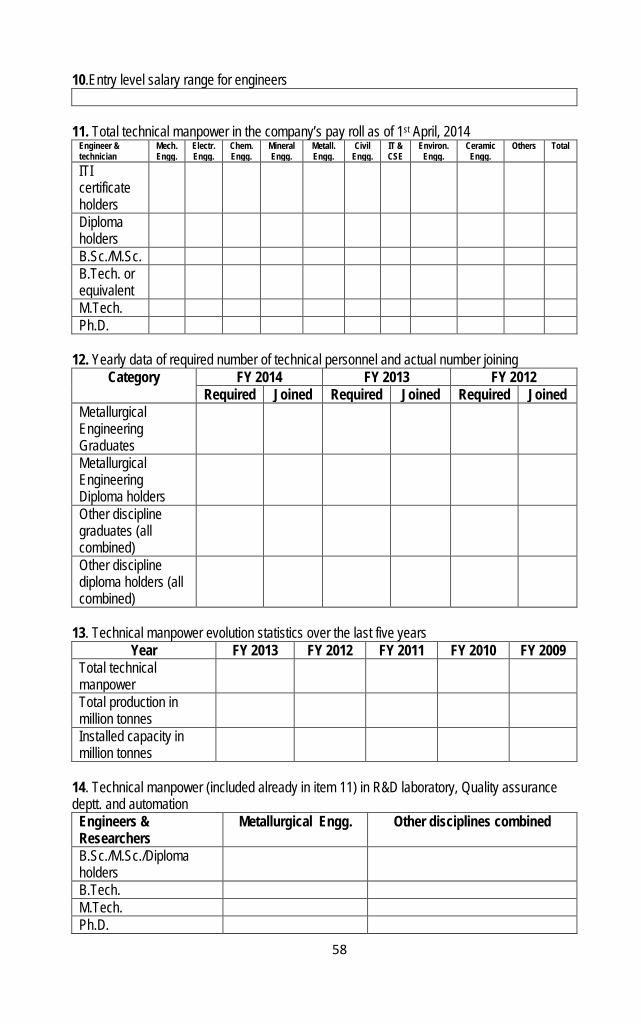
58
10.Entry level salary range for engineers
11. Total technical manpower in the company’s pay roll as of 1st April, 2014
Engineer & technician
Mech. Engg.
Electr. Engg.
Chem. Engg.
Mineral Engg.
Metall. Engg.
Civil Engg.
IT & CSE
Environ. Engg.
Ceramic Engg.
Others Total
ITI certificate holders
Diploma holders
B.Sc./M.Sc. B.Tech. or equivalent
M.Tech. Ph.D.
12. Yearly data of required number of technical personnel and actual number joining
Category FY 2014 FY 2013 FY 2012 Required Joined Required Joined Required Joined
Metallurgical Engineering Graduates
Metallurgical Engineering Diploma holders
Other discipline graduates (all combined)
Other discipline diploma holders (all combined)
13. Technical manpower evolution statistics over the last five years
Year FY 2013 FY 2012 FY 2011 FY 2010 FY 2009 Total technical manpower
Total production in million tonnes
Installed capacity in million tonnes
14. Technical manpower (included already in item 11) in R&D laboratory, Quality assurance deptt. and automation
Engineers & Researchers
Metallurgical Engg. Other disciplines combined
B.Sc./M.Sc./Diploma holders
B.Tech. M.Tech. Ph.D.

59
15. Future capacity enhancement statistics
Year Up to 2020 For the period 2020-2030
Projected capacity in million tonnes
Projected technology up-gradation/New Technology
16. Any other relevant information that you would like to add to make the survey more effective (Please attach sheet if necessary)

60
B. Questionnaire for Sponge Iron plants 1. Name of the Industry
2. Name of contact person; contact number and e-mail address
3. Area of activity ( Tick appropriate ones)
I. Sponge iron ii. Beneficiation iii.Captive power plant (CPP) 4. Installed capacity
I. Sponge iron (in million tonnes) ii. beneficiation ( in million tonnes) iii.CPP (MW)
5. Actual production in FY. 2013-14
I. Sponge iron (in million tonnes) ii. beneficiation ( in million tonnes) iii.CPP(MW)
6. Process route (Tick one)
Coal based / gas based/ others 7. Automation level (with bulleted brief descriptions)
8. Total manpower25 in the organization as of April 1st, 201426
9.Activities and manpower outsourced
10.Entry level salary range for engineers
25 To include personnel in pay roll, associate employees and contracted personnel (involved in mineral beneficiation to finished steel product inside and outside the factory premises. 26 Excluding school and township management as well as other social services.

61
11. Total technical manpower in the company’s pay roll as of 1st April, 2014
Engineers & technicians
Mech. Engg.
Electr. Engg.
Chemical Engg.
Metallurgical. engineering
Civil Engg.
IT Environ. Engg.
Mineral engg.
Others Total
ITI certificate holders
Diploma holders
B.Sc./M.Sc. B.Tech. or equivalent
M.Tech. Ph.D.
12. Yearly data of required number of technical personnel and actual number joining
Category FY 2014 FY 2013 FY 2012 Required Joined Required Joined Required Joined
Metallurgical Engineering Graduates
Metallurgical Engineering Diploma holders
Other discipline graduates (all combined)
Other discipline diploma holders (all combined)
12. Technical manpower evolution statistics over the last five years
Year FY 2013 FY 2012 FY 2011 FY 2010 FY 2009 Total technical manpower
Total production in million tonnes
Installed capacity in million tonnes
13. Technical manpower (Included already in item 11) in R&D laboratory, Quality assurance dept. and automation
Engineers & Researchers
Metallurgical Engg. Other disciplines combined
B.Sc./M.Sc./Diploma holders
B.Tech. M.Tech. Ph.D.

62
14. Future capacity enhancement statistics
Year Up to 2020 For the period 2020-2030
Projected capacity in million tonnes/MW
Sponge iron Beneficiation CPP
Projected technology up-gradation/New Technology/Innovations
15. Any other relevant information that you would like to add to make the survey more effective

63
C. Questionnaire for Merchant pig iron industries 1. Name of the Industry
2. Name of contact person; contact number and e-mail address
4. Area of activity
3. Installed capacity in thousand/ lakh tonnes
5. Total actual production of pig iron alloy in FY. 2013-14 in thousand / lakh tonnes
6. Process route
7. Total manpower27 in the organization as of April 1st, 201428
8. Total technical manpower in the company’s pay roll as of 1st April, 2014
Engineers & technicians
Mech. Engg.
Electr. Engg.
Chemical Engg.
Metall. Engg.
Civil Engg.
IT/CSE Environ. Engg.
Mineral Engg.
Others Total
ITI certificate holders
Diploma holders
B.Sc./M.Sc. B.Tech. or equivalent
M.Tech. Ph.D.
9.Activities and manpower outsourced:
27 To include personnel in pay roll, associate employees and contracted personnel (involved in mineral beneficiation to finished steel product inside and outside the factory premises. 28 Excluding school and township management as well as other social services.

64
10. Yearly data of required number of technical personnel and actual number joining
Category FY 2014 FY 2013 FY 2012 Required Joined Required Joined Required Joined
Metallurgical Engineering Graduates
Metallurgical Engineering Diploma holders
Other discipline graduates (all combined)
Other discipline diploma holders (all combined)
11. Technical manpower evolution statistics over the last five years
Year FY 2013 FY 2012 FY 2011 FY 2010 FY 2009 Total technical manpower
Total production in thousand tonnes
Installed capacity in thousand tonnes
12. Technical manpower (included already in item 9) in R&D laboratory, Quality assurance deptt. and automation
Engineers & Researchers
Metallurgical Engg. Other disciplines combined
B.Sc./M.Sc./Diploma holder
B.Tech. M.Tech. Ph.D.
13. Future capacity enhancement statistics
Year Up to 2020 For the period 2020-2030 Projected capacity in thousand / lakh tonnes
Projected technology up-gradation/New Technology
14. Any other relevant information that you would like to add to make the survey more effective

65
D. Questionnaire for Rolling Mills, re-rolling mills and coating units 1. Name of the Industry
2. Name of contact person; contact number and e-mail address
3. Product mix (Tick appropriate ones)
I. HR long ii. HR flats III. CR iv. Coated 4. Item wise Installed capacity in thousand (000) tonnes
I. HR long ii. HR flats III. CR iv. Coated
5.Itemwise actual production in FY. 2013-14 in thousand (000) tonnes
I. HR long ii. HR flats III. CR iv. Coated
6. Automation level (with bulleted brief descriptions)
7. Total manpower29 in the organization as of April 1st, 201430
8. Total technical manpower in the company’s pay roll as of 1st April, 2014:
Engineers & technicians
Mech. Engg.
Electr. Engg.
Metallurg. Engg.
Civil Engg. Environ. Engg.
Others Total
ITI certificate holders
Diploma holders
B.Sc./M.Sc.
B.Tech. or equivalent
M.Tech. Ph.D.
29 To include personnel in pay roll, associate employees and contracted personnel (involved in mineral beneficiation to finished steel product inside and outside the factory premises. 30 Excluding school and township management as well as other social services.

66
9.Activities and manpower outsourced
10. Yearly data of required number of technical personnel and actual number joining
Category FY 2014 FY 2013 FY 2012 Required Joined Required Joined Required Joined
Metallurgical Engineering Graduates
Metallurgical Engineering Diploma holders
Other discipline graduates (all combined)
Other discipline diploma holders (all combined)
11. Technical manpower evolution statistics over the last five years
Year FY 2013 FY 2012 FY 2011 FY 2010 FY 2009 Total technical manpower Total production in ‘000 tonnes
HR long HR Flats CR Coated
Installed capacity in ‘000 tonnes
HR long HR Flats CR Coated
12. Technical manpower (Included already in item no.9) in R&D laboratory, Quality assurance deptt. and automation
Engineers & Researchers
Metallurgical Engg. Other disciplines combined
B.Sc./M.Sc./Diploma holders
B.Tech. M.Tech. Ph.D.

67
13. Future capacity enhancement statistics Year Up to 2020 For the period 2020-
2030 Projected capacity in ‘000 tonnes
HR long HR flat CR Coated
Projected technology up-gradation/New Technology
14. Any other relevant information that you would like to add to make the survey more effective

68
E. Questionnaire for Refractory industries 1. Name of the Industry
2. Name of contact person; contact number and e-mail address
3. Product ranges ( Tick as appropriate)
I. Monolithic II. Shaped 4.Itemwise Installed capacity in thousand/lakh tonnes
I. Monolithic II. Shaped 5.Itemwise Actual production in FY. 2013 in thousand /lakh tonnes
I. Monolithic II. Shaped 6. Total manpower31 in the organization as of April 1st, 201432
7.Activities and manpower outsourced
8. Total technical manpower in the company’s pay roll as of 1st April, 2014:
Engineers & technicians
Mech. Engg.
Electr. Engg.
Chemical Engg.
Mineral Engg.
Metallurgical. engineering
Ceramic engg.
Others Total
ITI certificate holders
Diploma holders
B.Sc./M.Sc. B.Tech. or equivalent
M.Tech. Ph.D.
31 To include personnel in pay roll, associate employees and contracted personnel (involved in mineral beneficiation to finished steel product inside and outside the factory premises. 32 Excluding school and township management as well as other social services.

69
9. Yearly data of required number of technical personnel and actual number joining
Category FY 2014 FY 2013 FY 2012 Required Joined Required Joined Required Joined
Ceramic Engineering Graduates
Ceramic Engineering Diploma holders
Metallurgical Engineering Graduates
Metallurgical Engineering Diploma holders
Other discipline graduates (all combined)
Other discipline diploma holders (all combined)
10. Technical manpower evolution statistics over the last five years
Year FY 2013 FY 2012 FY 2011 FY 2010 FY 2009 Total technical manpower Total production in thousand/lakh tonnes
Monolithic
Shaped
Installed capacity in thousand/lakh tonnes
Monolithic
Shaped
11. Technical manpower (included already in item No.8) in R&D laboratory, Quality assurance deptt. and automation
Engineers & Researchers
Ceramic engg. Metallurgical Engg. Other disciplines combined
B.Sc./M.Sc./Diploma Holders
B.Tech. M.Tech. Ph.D.

70
12. Future capacity enhancement statistics
Year Up to 2020 For the period 2020-2030
Projected capacity thousand/lakh tonnes
Monolithic Shaped
Projected technology up-gradation/New Technology
13. Any other relevant information that you would like to add to make the survey more effective

71
F. Questionnaire for mineral beneficiation industries 1. Name of the Industry
2. Name of contact person; contact number and e-mail address
3.Area of activity ( Tick as appropriate)
I Iron ore beneficiation II. Pelletisation 4. Installed capacity in million tonnes
I Iron ore beneficiation II. Pelletisation (throughput) 5. Actual amount of beneficiation I million tones in FY. 2013-14
I Iron ore beneficiation II. Pelletisation (output) 6. Process route
7. Total manpower33 in the organization as of April 1st, 201434
8. Total technical manpower in the company’s pay roll as of 1st April, 2014
Engineers & technicians
Mech. Engg.
Electr. Engg.
Chemical/ Engg.
Metallurgical. engineering
Civil Engg.
Mineral Engg.
Environ. Engg.
Ceramic Engg.
Others Total
ITI certificate holders
Diploma holders
B.Sc./M.Sc. B.Tech. or equivalent
M.Tech. Ph.D.
9.Activities and manpower outsourced:
33 To include personnel in pay roll, associate employees and contracted personnel (involved in mineral beneficiation to finished steel product inside and outside the factory premises. 34 Excluding school and township management as well as other social services.

72
10. Yearly data of required number of technical personnel and actual number joining Category FY 2014 FY 2013 FY 2012
Required Joined Required Joined Required Joined Metallurgical Engineering Graduates
Metallurgical Engineering Diploma holders
Mineral engineering graduates
Mineral engineering diploma holders
Other discipline graduates (all combined)
Other discipline diploma holders (all combined)
11. Technical manpower evolution statistics over the last five years
Year FY 2013 FY 2012 FY 2011 FY 2010 FY 2009 Total technical manpower Total production in million tonnes
Beneficiation Pelletisation
Installed capacity in million tonnes
Beneficiation Pelletisation
12. Technical manpower (Included already in item 9) in R&D laboratory, Quality assurance deptt. and automation
Engineers & Researchers
Metallurgical Engg.
Mineral Engineering
Other disciplines combined
B.Sc./M.Sc./Diploma Holders
B.Tech. M.Tech. Ph.D.
13. Future capacity enhancement statistics:
Year Up to 2020 For the period 2020-2030
Projected capacity in million tonnes
Beneficiation Pelletisation
Projected technology up-gradation/New Technology

73
14. Any other relevant information that you would like to add to make the survey more effective

74
G. Questionnaire for Ferroalloy plants 1. Name of the Industry
2. Name of contact person; contact number and e-mail address
4. Area of activity
Ferroalloy types produced ( Tick one or more) : FeMn, FeSi, SiMn, FeCr
3. Installed capacity in thousand tonnes
I. FeMn II.FeSi III.SiMn IV.FeCr
5. Total actual production of ferro alloy in FY. 2013-14
I. FeMn II.FeSi III.SiMn IV.FeCr
6. Total manpower35 in the organization as of April 1st, 201436
7. Total technical manpower in the company’s pay roll as of 1st April, 2014:
Engineers & technicians
Mech. Engg.
Electr. Engg.
Chemical engg.
Metall. Engg.
Civil Engg.
IT/CSE Environ. Engg.
Mineral Engg.
Others Total
ITI certificate holders
Diploma holders
B.Sc./M.Sc. B.Tech. or equivalent
M.Tech. Ph.D.
8.Activities and manpower outsourced:
35 To include personnel in pay roll, associate employees and contracted personnel (involved in mineral beneficiation to finished steel product inside and outside the factory premises. 36 Excluding school and township management as well as other social services.

75
9. Yearly data of required number of technical personnel and actual number joining
Category FY 2014 FY 2013 FY 2012 Required Joined Required Joined Required Joined
Metallurgical Engineering Graduates
Metallurgical Engineering Diploma holders
Other discipline graduates (all combined)
Other discipline diploma holders (all combined)
12. Technical manpower evolution statistics over the last five years
Year FY 2013 FY 2012 FY 2011 FY 2010 FY 2009 Total technical manpower
Total production in thousand tonnes
Installed capacity in thousand tonnes
13. Technical manpower (included already in item 8) in R&D laboratory, Quality assurance deptt. and automation
Engineers & Researchers
Metallurgical Engg. Other disciplines combined
B.Sc./M.Sc./Diploma holder
B.Tech. M.Tech. Ph.D.
14. Future capacity enhancement statistics
Year Up to 2020 For the period 2020-2030 Projected capacity in thousand tonnes
Projected technology up-gradation/New Technology
15. Any other relevant information that you would like to add to make the survey more effective

76
H. Questionnaire for Service, Design and R&D organisation 1. Name of the Organization
2. Name of contact person; contact number and e-mail address
3. Industrial Sectors to which services are extended
4. Types of services extended
5. Proportion of services extended to Iron and steel and allied industries (such as mineral beneficiation, coke making, iron and steel making, smelting reduction, rolling mills, sponge iron production, material development etc.):
6.Total manpower37 in the organization as of April 1st, 201438
7.Entry level Qualification and salary range for engineers
37 To include personnel in pay roll, associate employees and contracted personnel (involved in mineral beneficiation to finished steel product inside and outside the factory premises. 38 Excluding school and township management as well as other social services.

77
8. Total technical manpower in the company’s pay roll as of 1st April, 2014
Engineer & technician
Mech. Engg.
Electr. Engg.
Chem. Engg.
Mineral Engg.
Metall. Engg.
Civil Engg.
IT & CSE
Environ. Engg.
Ceramic Engg.
Others Total
ITI certificate holders
Diploma holders
B.Sc./M.Sc. B.Tech. or equivalent
M.Tech. Ph.D.
9. Yearly data of required number of technical personnel and actual number joining
Category FY 2014 FY 2013 FY 2012 Required Joined Required Joined Required Joined
Metallurgical Engineering Graduates
Metallurgical Engineering Diploma holders
Other discipline graduates (all combined)
Other discipline diploma holders (all combined)
10. Future growth programs in terms of manpower and area of expertise
Year Up to 2020 For the period 2020-2030
11. Any other relevant information that you would like to add to make the survey more effective (Please attach sheet if necessary)

78
I. Questionnaire for educational institutes 1. Name of the Institute/university /college
2. Contact person, cell number and e-mail address
3. Current UG and PG intake
UG (Total): UG ( Met): M.tech.Total) : M.Tech. (Met.) Ph.D.(Total) Ph.D.(Met)
4. Current yearly number of graduating engineers
UG (Total): UG ( Met): M.tech.Total) : M.Tech. (Met.) Ph.D.(Total) Ph.D.(Met)
5. Existing disciplines and seat distributions
Level Mechanical Electrical Matls &Met. Chemical IT & CSE
Ceramics Civil & environmental
Others
UG M.Tech. Ph.D.
6. PG research students currently working in the area of iron and steel
M.Tech. Ph.D.
7. Number of compulsory courses in the UG curriculum and their title (mention those only in the in the area of Metallurgical Engg.)
8. Discipline wise graduating engineers and corresponding number getting employed in the Iron and steel as well as , manufacturing sector: (i) Number of students graduating yearly: Level Mechanical Electrical Metallurgical Ceramic Others
2012 2013 2014 2012 2013 2014 2012 2013 2014 2012 2013 2014 2012 2013 2014
UG M.Tech. Ph.D.

79
(i) Number of students getting employed in different sectors Level Iron and Steel Manufacturing Others
2012 2013 2014 2012 2013 2014 2012 2013 2014 UG M.Tech. Ph.D. 9. Any other relevant information that you would like to add to make the survey more effective
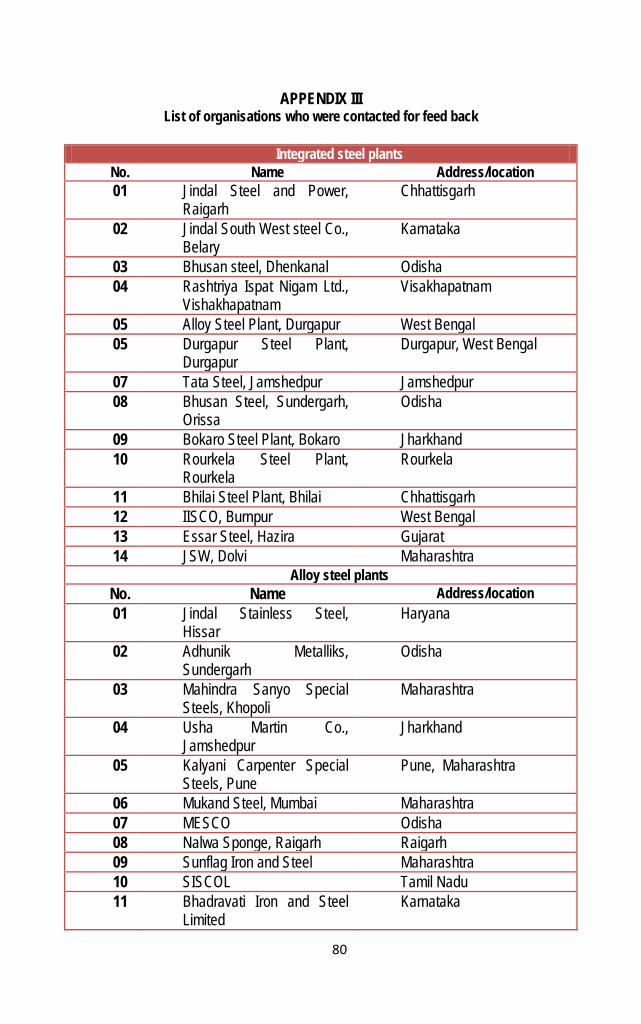
80
APPENDIX III
List of organisations who were contacted for feed back
Integrated steel plants No. Name Address/location 01 Jindal Steel and Power,
Raigarh Chhattisgarh
02 Jindal South West steel Co., Belary
Karnataka
03 Bhusan steel, Dhenkanal Odisha 04 Rashtriya Ispat Nigam Ltd.,
Vishakhapatnam Visakhapatnam
05 Alloy Steel Plant, Durgapur West Bengal 05 Durgapur Steel Plant,
Durgapur Durgapur, West Bengal
07 Tata Steel, Jamshedpur Jamshedpur 08 Bhusan Steel, Sundergarh,
Orissa Odisha
09 Bokaro Steel Plant, Bokaro Jharkhand 10 Rourkela Steel Plant,
Rourkela Rourkela
11 Bhilai Steel Plant, Bhilai Chhattisgarh 12 IISCO, Burnpur West Bengal 13 Essar Steel, Hazira Gujarat 14 JSW, Dolvi Maharashtra
Alloy steel plants No. Name Address/location 01 Jindal Stainless Steel,
Hissar Haryana
02 Adhunik Metalliks, Sundergarh
Odisha
03 Mahindra Sanyo Special Steels, Khopoli
Maharashtra
04 Usha Martin Co., Jamshedpur
Jharkhand
05 Kalyani Carpenter Special Steels, Pune
Pune, Maharashtra
06 Mukand Steel, Mumbai Maharashtra 07 MESCO Odisha 08 Nalwa Sponge, Raigarh Raigarh 09 Sunflag Iron and Steel Maharashtra 10 SISCOL Tamil Nadu 11 Bhadravati Iron and Steel
Limited Karnataka
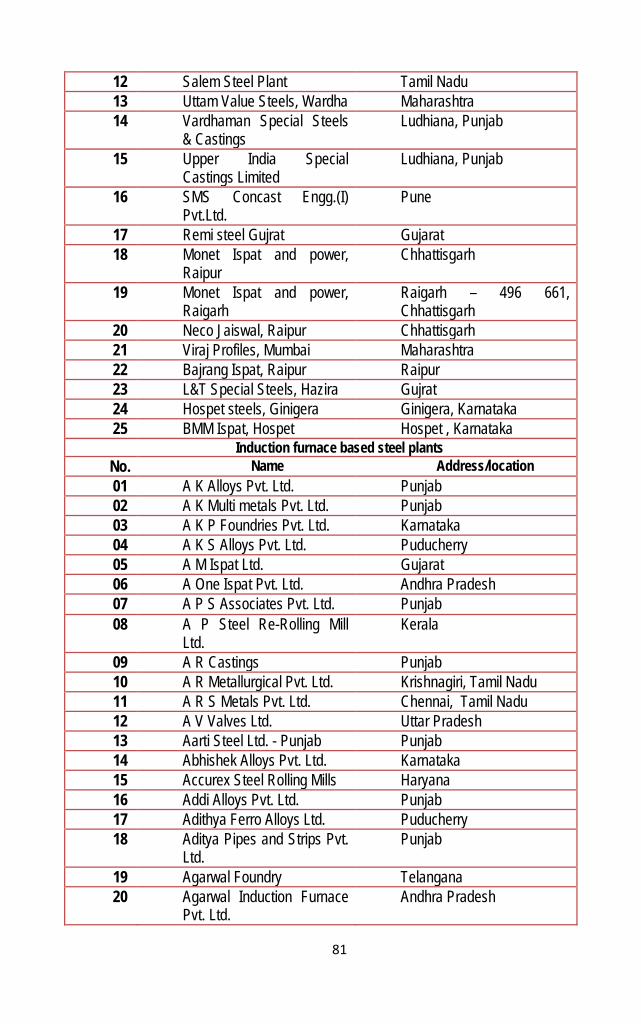
81
12 Salem Steel Plant Tamil Nadu 13 Uttam Value Steels, Wardha Maharashtra 14 Vardhaman Special Steels
& Castings Ludhiana, Punjab
15 Upper India Special Castings Limited
Ludhiana, Punjab
16 SMS Concast Engg.(I) Pvt.Ltd.
Pune
17 Remi steel Gujrat Gujarat 18 Monet Ispat and power,
Raipur Chhattisgarh
19 Monet Ispat and power, Raigarh
Raigarh – 496 661, Chhattisgarh
20 Neco Jaiswal, Raipur Chhattisgarh 21 Viraj Profiles, Mumbai Maharashtra 22 Bajrang Ispat, Raipur Raipur 23 L&T Special Steels, Hazira Gujrat 24 Hospet steels, Ginigera Ginigera, Karnataka 25 BMM Ispat, Hospet Hospet , Karnataka
Induction furnace based steel plants No. Name Address/location 01 A K Alloys Pvt. Ltd. Punjab 02 A K Multi metals Pvt. Ltd. Punjab 03 A K P Foundries Pvt. Ltd. Karnataka 04 A K S Alloys Pvt. Ltd. Puducherry 05 A M Ispat Ltd. Gujarat 06 A One Ispat Pvt. Ltd. Andhra Pradesh 07 A P S Associates Pvt. Ltd. Punjab 08 A P Steel Re-Rolling Mill
Ltd. Kerala
09 A R Castings Punjab 10 A R Metallurgical Pvt. Ltd. Krishnagiri, Tamil Nadu 11 A R S Metals Pvt. Ltd. Chennai, Tamil Nadu 12 A V Valves Ltd. Uttar Pradesh 13 Aarti Steel Ltd. - Punjab Punjab 14 Abhishek Alloys Pvt. Ltd. Karnataka 15 Accurex Steel Rolling Mills Haryana 16 Addi Alloys Pvt. Ltd. Punjab 17 Adithya Ferro Alloys Ltd. Puducherry 18 Aditya Pipes and Strips Pvt.
Ltd. Punjab
19 Agarwal Foundry Telangana 20 Agarwal Induction Furnace
Pvt. Ltd. Andhra Pradesh

82
21 Agarwal Ispat Udyog Karnataka 22 Agni Steels Pvt. Ltd. Erode, Tamil Nadu 23 Jagdamba Ispat Rajasthan 24 Jagdambay Concast Pvt
Ltd. Punjab
25 J R Ispat Pvt. Ltd. Gujarat 26 Juneja Casting Pvt. Ltd. Punjab 27 Jothi Melters (India) Pvt.
Ltd. Tamil Nadu
28 JPEE Alloys Tamil Nadu 29 Jogindra Castings Pvt. Ltd. Punjab 30 Jineshwar Malleable and
Alloys Karnataka
31 Jindal Steel and Power Ltd. Chhattisgarh 32 Jeevaka Industries Ltd. Telangana 33 Jayalakshmi Alloys India
Pvt. Ltd. Tamil Nadu
34 Jatin Ispat Pvt. Ltd. Punjab 35 Jain Steels Pvt. Ltd. Uttar Pradesh 36 Jai Raj Ispat Ltd –
Telangana Telangana
37 Jai Jagdamba Malleable Pvt. Ltd.
Uttar Pradesh
38 Jai Hind Wire Rod Mills Tamil Nadu 39 Jagdamba Ispat Rajasthan 40 Jagdambay Concast Pvt.
Ltd. Punjab
41 Jagat Metals Pvt. Ltd. Punjab 42 Jagannath Steel Pvt. Ltd. Uttar Pradesh 43 J T G Alloys Pvt. Ltd. Punjab 44 J S Khalsa Steels Pvt. Ltd. Punjab 45 J R Smelters Pvt. Ltd. Tamil Nadu
Re–rolling mills No. Name Address/location 01 Tapal Steel Pvt. Ltd.
(Lakshmi Kalyani Ingots) Karnataka
02 Concast Ispat Ltd. West Bengal 03 Radha Smelters Ltd. -
Shankarampet Telangana
04 Southern Ferro Ltd. – Hubli Karnataka 05 Dayal Steel Industries Punjab 06 Bhagawathi Steel Industries Chennai , Tamil Nadu 07 Shri Sugas Steels Salem, Tamil Nadu 08 Madras Steel and Wire
Products Chennai , Tamil Nadu

83
09 Balaji Steels (Shri Ram Ispat Pvt.Ltd.)
Chennai , Tamil Nadu
10 Everest Industries Tiruchirappalli, Tamil Nadu 11 Shri Alamell Steels Salem, Tamil Nadu 12 Shree Lakshmiram Wires
Pvt. Ltd. Chennai , Tamil Nadu
13 Dhanlaxmi Iron Industries Ltd.
Medak, Telangana
14 Prime Gold International Pvt. Ltd.
Krishnagiri, Tamil Nadu
15 Nithya Steels and Alloys Pvt. Ltd.
Andhra Pradesh
16 Shyam Sel and Power Ltd.- Katwa
West Bengal
17 Sul Steel Pvt. Ltd. Selest, West Bengal 18 V D S R Rolling Mills Tiruvannamalai , Tamil
Nadu 19 Shree Vela Smelters Pvt.
Ltd. Namakkal, Tamil Nadu
20 J B Steel Industries Chennai , Tamil Nadu 21 Periyar Steels Pvt. Ltd. Kerala 22 BEEKAY Steel industries
Ltd. Tamil Nadu
23 Kannappan Iron and Steel Co. Ltd.
Puducherry
24 Lasaum Steel Rolling Mills Kerala 25 Hari Om Steel Industries Jhansi, Uttar Pradesh 26 Rasik Industries Punjab 27 H R Steel Rolling Mills Punjab 28 Ganpati Steels PB Punjab 29 Jupiter Enterprises Rajasthan 30 Rama Sheets Pvt. Ltd. Rajasthan 31 Mega Exim Pvt. Ltd. Punjab 32 Sharu Steels Pvt. Ltd. Punjab 33 B P Alloys Ltd. Punjab 34 Shree Prathvi Steel Rolling
Mill Rajasthan
35 Arun Vyopar Udyog Ltd. Tamil Nadu 36 Sardar Engineering Works Telangana 37 Thangam Steels Ltd. Tamil Nadu 38 V M T Steel Rolling Mills (P)
Ltd. Tamil Nadu
39 Popular Iron and Steel Co. Uttar Pradesh 40 Minar Ispat Pvt. Ltd. Kerala
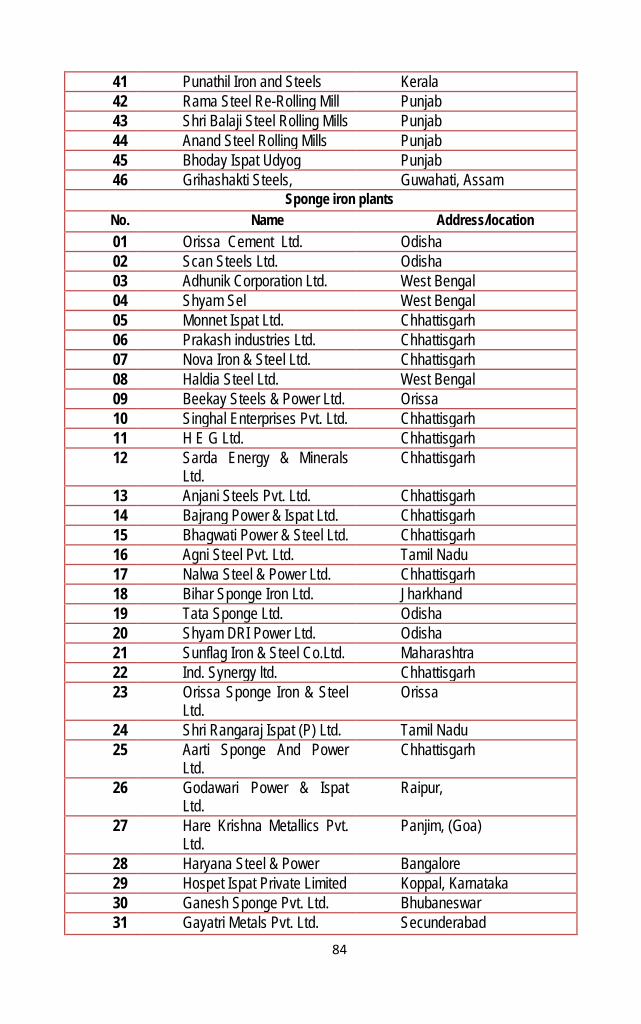
84
41 Punathil Iron and Steels Kerala 42 Rama Steel Re-Rolling Mill Punjab 43 Shri Balaji Steel Rolling Mills Punjab 44 Anand Steel Rolling Mills Punjab 45 Bhoday Ispat Udyog Punjab 46 Grihashakti Steels, Guwahati, Assam
Sponge iron plants No. Name Address/location 01 Orissa Cement Ltd. Odisha 02 Scan Steels Ltd. Odisha 03 Adhunik Corporation Ltd. West Bengal 04 Shyam Sel West Bengal 05 Monnet Ispat Ltd. Chhattisgarh 06 Prakash industries Ltd. Chhattisgarh 07 Nova Iron & Steel Ltd. Chhattisgarh 08 Haldia Steel Ltd. West Bengal 09 Beekay Steels & Power Ltd. Orissa 10 Singhal Enterprises Pvt. Ltd. Chhattisgarh 11 H E G Ltd. Chhattisgarh 12 Sarda Energy & Minerals
Ltd. Chhattisgarh
13 Anjani Steels Pvt. Ltd. Chhattisgarh 14 Bajrang Power & Ispat Ltd. Chhattisgarh 15 Bhagwati Power & Steel Ltd. Chhattisgarh 16 Agni Steel Pvt. Ltd. Tamil Nadu 17 Nalwa Steel & Power Ltd. Chhattisgarh 18 Bihar Sponge Iron Ltd. Jharkhand 19 Tata Sponge Ltd. Odisha 20 Shyam DRI Power Ltd. Odisha 21 Sunflag Iron & Steel Co.Ltd. Maharashtra 22 Ind. Synergy ltd. Chhattisgarh 23 Orissa Sponge Iron & Steel
Ltd. Orissa
24 Shri Rangaraj Ispat (P) Ltd. Tamil Nadu 25 Aarti Sponge And Power
Ltd. Chhattisgarh
26 Godawari Power & Ispat Ltd.
Raipur,
27 Hare Krishna Metallics Pvt. Ltd.
Panjim, (Goa)
28 Haryana Steel & Power Bangalore 29 Hospet Ispat Private Limited Koppal, Karnataka 30 Ganesh Sponge Pvt. Ltd. Bhubaneswar 31 Gayatri Metals Pvt. Ltd. Secunderabad
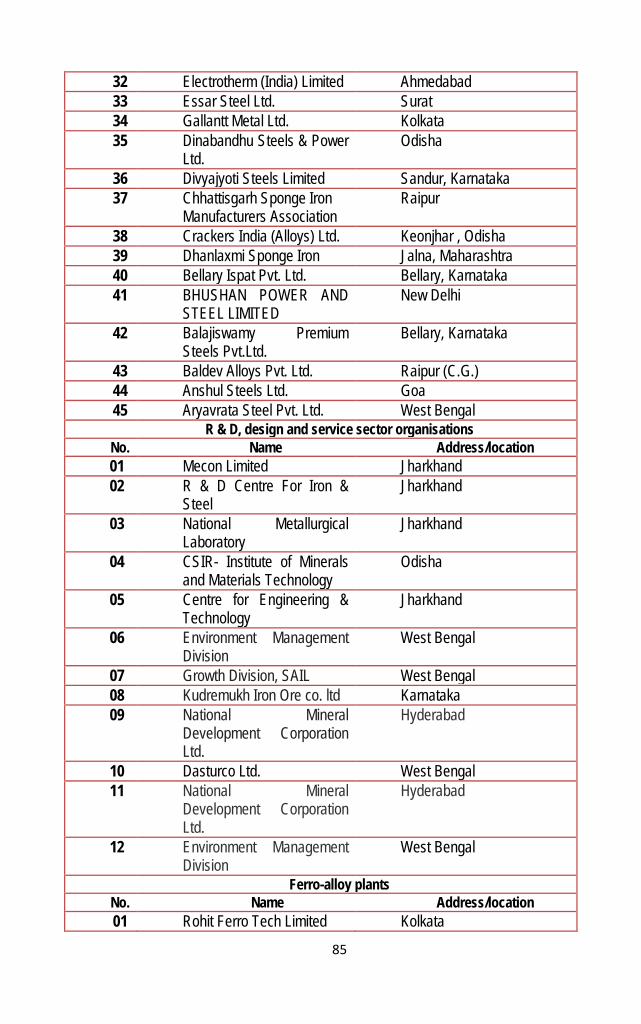
85
32 Electrotherm (India) Limited Ahmedabad 33 Essar Steel Ltd. Surat 34 Gallantt Metal Ltd. Kolkata 35 Dinabandhu Steels & Power
Ltd. Odisha
36 Divyajyoti Steels Limited Sandur, Karnataka 37 Chhattisgarh Sponge Iron
Manufacturers Association Raipur
38 Crackers India (Alloys) Ltd. Keonjhar , Odisha 39 Dhanlaxmi Sponge Iron Jalna, Maharashtra 40 Bellary Ispat Pvt. Ltd. Bellary, Karnataka 41 BHUSHAN POWER AND
STEEL LIMITED New Delhi
42 Balajiswamy Premium Steels Pvt.Ltd.
Bellary, Karnataka
43 Baldev Alloys Pvt. Ltd. Raipur (C.G.) 44 Anshul Steels Ltd. Goa 45 Aryavrata Steel Pvt. Ltd. West Bengal
R & D, design and service sector organisations No. Name Address/location 01 Mecon Limited Jharkhand 02 R & D Centre For Iron &
Steel Jharkhand
03 National Metallurgical Laboratory
Jharkhand
04 CSIR- Institute of Minerals and Materials Technology
Odisha
05 Centre for Engineering & Technology
Jharkhand
06 Environment Management Division
West Bengal
07 Growth Division, SAIL West Bengal 08 Kudremukh Iron Ore co. ltd Karnataka 09 National Mineral
Development Corporation Ltd.
Hyderabad
10 Dasturco Ltd. West Bengal 11 National Mineral
Development Corporation Ltd.
Hyderabad
12 Environment Management Division
West Bengal
Ferro-alloy plants No. Name Address/location 01 Rohit Ferro Tech Limited Kolkata

86
02 Lalwani Industries Limited Kolkata 03 Cosmic Ferro Alloys Limited Kolkata 04 Maithan Alloys Limited Kolkata 05 Tata Steel Kolkata 06 Rashmi GROUP Kolkata 07 VISA Steel Kolkata 08 Mortex Group Kolkata 09 V H P Group Kolkata 10 Shyam Group Kolkata 11 Amit Ferro-Alloys & Steel
Pvt. Ltd. Kolkata
12 Abhijeet Group Kolkata 13 S R C Group Kolkata 14 Indian Metals and Ferro
Alloys Ltd. Odisha
15 Jai Balaji Group Kolkata 16 Ferro Alloys Corporation
Ltd. Kolkata
17 Balasore Alloys Ltd. Kolkata Refractory industries
No. Name Address/location 01 TRL Krosaki Refractories
Limited Kolkata
02 Calderys India Refractories Limited
Nagpur
03 Maithan Ceramic Ltd. Dhanbad 04 OCL India LTD. Odisha 05 IFGL Refractories Ltd. Kolkata 06 Sarvesh Refractories
Limited Odisha
07 Premier Refractories of India Pvt. Ltd.
M.P
08 Carborundum Universal Ltd. Chennai 09 Orient Refractories Limited Bhiwadi, Rajasthan
Merchant pig iron industries No. Name Address/location 01 Aparant Iron & Steel Ltd. Panaji, Goa 02 Electro Steel Castings Ltd. Kolkata 03 IDCOL Kalinga Iron Works
Ltd. Keonjhar, Orissa
04 Jindal Saw Mills Ltd. New Delhi 05 Kirloskar Ferrous Industries
Ltd. New Delhi
06 Kudremukh Iron Ore Company Ltd.
Bangalore

87
07 Lanco Industries ltd. Chennai 08 Sathavahana Ispat Ltd. Hyderabad 09 Southern Iron & Steel Co.
Ltd. Tamil Nadu
10 Tata Metaliks Ltd Kolkata 11 Concast Ispat Ltd Kolkata Srikakulam (A.P.) 12 Sesa Industries Ltd Ltd Panjim, Goa 13 KIC Metaliks Ltd West Bengal 14 Malavika Steel Ltd Jagdishpur, Sultanpur (U.P.) 15 Neelanchal Ispat Nigam Ltd Odisha 16 Mesco Steel Ltd Odisha 17 Visa Industries Ltd Kolkata, India 18 Sona Alloys Pvt Ltd Maharashtra 19 Neo Metaliks Ltd Kolkata 20 Rashmi Group Kolkata 21 SBQ Steels Ltd Chennai 22 Kalyani Gerrdau Steels Ltd Bangalore 23 VSL Steels Limited Bangalore

88
APPENDIX IV
Engineers (Graduate and Diploma holders) and ITI certificate holders per thousand
tonne of product as well as discipline wise engineers per thousand tonnes of product deduced from the survey results
(i) Characteristic distribution of technical manpower engaged in production in the steel and
relevant allied sectors
Sectors Total production, thousand
tonne
Total technical manpower in production
Graduate engineers per
thousand tonne
Diploma engineers
per thousand tonne
ITI certificate holders per
thousand tonne
Integrated Steel Plant
53047 64924 0.3609 0.3363 0.5267
Alloy Steel Plants
7436 9561 0.3582 0.3515 0.5762
Induction Furnace
893 661 0.2217 0.2172 0.3023
Sponge Iron Plants
992 209 0.0252 0.0796 0.1068
Re-Rolling Mills 4602 1391 0.0834 0.0719 0.1471 Refractory Industries
409 323 0.1955 0.3863 0.2102
Ferro Alloy Plants
279 159 0.0537 0.1111 0.4086
Merchant Pig Iron
1288 569 0.2181 0.1141 0.1102
Mineral Beneficiation &
Pelletizing
8300 257 0.01168 0.0127 0.0066
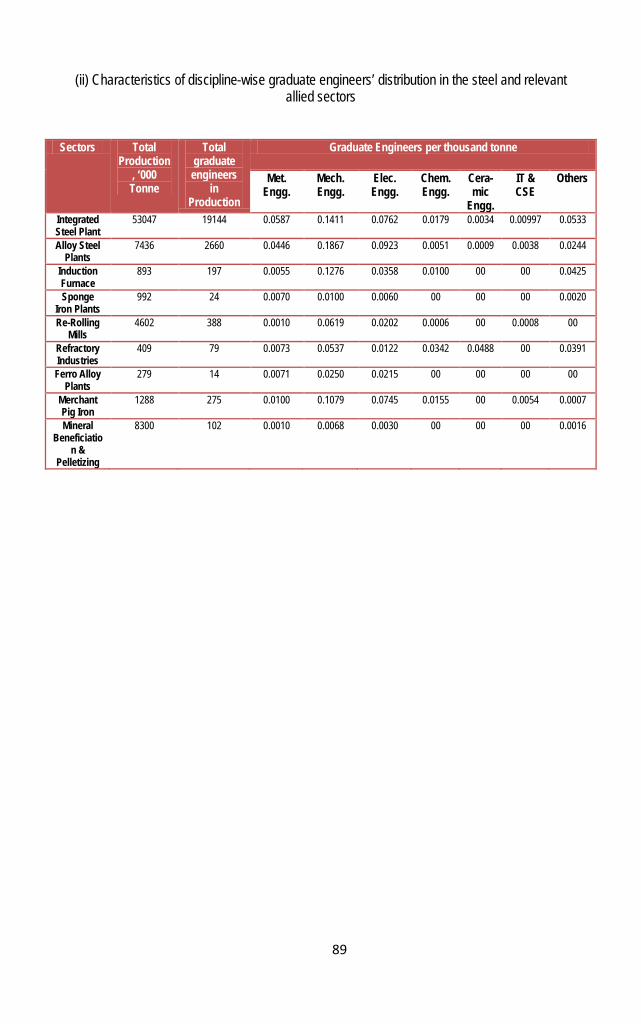
89
(ii) Characteristics of discipline-wise graduate engineers’ distribution in the steel and relevant allied sectors
Sectors Total Production
, ‘000 Tonne
Total graduate engineers
in Production
Graduate Engineers per thousand tonne
Met. Engg.
Mech. Engg.
Elec. Engg.
Chem. Engg.
Cera-mic
Engg.
IT & CSE
Others
Integrated Steel Plant
53047 19144 0.0587 0.1411 0.0762 0.0179 0.0034 0.00997 0.0533
Alloy Steel Plants
7436 2660 0.0446 0.1867 0.0923 0.0051 0.0009 0.0038 0.0244
Induction Furnace
893 197 0.0055 0.1276 0.0358 0.0100 00 00 0.0425
Sponge Iron Plants
992 24 0.0070 0.0100 0.0060 00 00 00 0.0020
Re-Rolling Mills
4602 388 0.0010 0.0619 0.0202 0.0006 00 0.0008 00
Refractory Industries
409 79 0.0073 0.0537 0.0122 0.0342 0.0488 00 0.0391
Ferro Alloy Plants
279 14 0.0071 0.0250 0.0215 00 00 00 00
Merchant Pig Iron
1288 275 0.0100 0.1079 0.0745 0.0155 00 0.0054 0.0007
Mineral Beneficiatio
n & Pelletizing
8300 102 0.0010 0.0068 0.0030 00 00 00 0.0016

90
(iii) Characteristics of discipline-wise diploma engineers’ distribution in the steel and relevant
allied sectors
Sector Total Production, ‘000 tonne
Total diploma
engineers in production
Discipline-wise diploma engineers per thousand tonne
Met. Engg.
Mech. Engg.
Elect. Engg.
Chem. Engg.
Ceramic Engg.
IT & CSE
Others
Integrated Steel Plant
53047 17923 0.0398 0.1532 0.0846 0.0059 ~0.002 0.0038 0.0493
Alloy Steel Plants
7436 2623 0.0258 0.2017 0.0855 0.0008 ~0.0001 0.00134 0.0375
Induction Furnace
893 193 0.0100 0.1063 0.0369 0.0022 00 0.0022 0.0593
Sponge Iron Plants
992 78 0.0060 0.0483 0.0221 00 00 0.0030 00
Re-Rolling Mills
4602 329 0.0010 0.0441 0.0193 0.0010 00 0.0008 0.0054
Refractory Industries
409 157 0.0024 0.1931 0.0317 0.0122 0.090 00 0.0562
Ferro Alloy Plants
279 30 0.0107 0.0609 0.0358 00 00 00 0.0035
Merchant Pig Iron
1288 146 0.0131 0.0566 0.0310 0.0031 00 0.003 0.0069
Mineral Beneficiation & Pelletizing
8300 104 00 0.0081 0.0032 00 ~0 00 0.0012

91
APPENDIX V
List of attendees and their affiliation in the workshop held at IIT Kanpur on the 13th of April 2015.
Serial number Member Affiliation
1 Dr.Indranil Manna IIT Kanpur 2 Dr. Dipak Mazumdar IIT Kanpur 3 Dr.Amarendra Singh IIT Kanpur 4 Dr.T Venugopal Tata Steel, Jamshedpur 5 Dr.Vinay K.Gupta Formerly with RDCIS, SAIL 6 Dr. Arup Ghosh CGCRI, Kolkata 7 Mr.R.K.Bagchi NISST, Govindgarh 8 Mr. Sushim Banerjee INSDAG, Kolkata 9 Mr.Shaktimoy Ghosh Formerly with JSPL, Raigarh 10 Mr.Bhaskar Roy Formerly with IIM Kolkata 11 Dr. PJ Rochowdhury Formerly , Professor BE College 12 Dr. Tridibesh Mukherjee Former IIM President 13 Shri P.L.Satish Hospet Steels, Karnataka 14 Mr. Siddhartha Shah HR, Tata Steel Jamshedpur 15 Dr. B.B.Agarwal RDCIS, SAIL, Ranchi 16 Prof. G.Gupta IISc., Bangalore 17 Mr. Nitin Amte Essar Steel, Hazira 18 Mr. Kamal Aggarwal AIIFA, New Delhi 19 Dr. Marutiram Kaza JSW, Bellary 20 Sadhan K. Roy IIM Kolkata 21 SK Bhatnagar Ministry of Steel, New Delhi 22 Dr. Soumitra Tarafdar NML, Jamshedpur 23 Mr. V.Srinivas RINL, Vishakhapatnam 24 Shri Amarendu Prakash, SAIL, Bokaro 25 Shri Manish Jalota, DAIL, Bokaro 26 Dr. M.Venkatraman Essar Steel, Hazira 27 Prof. R.Shekhar IIT Kanpur 28 Prof. K Biswas IIT Kanpur