a study on hydrodynamic and morphological … · a study on hydrodynamic and morphological behavior...
TRANSCRIPT

Proceedings of the 3rd International Conference on Civil Engineering for Sustainable Development
(ICCESD 2016), 12~14 February 2016, KUET, Khulna, Bangladesh (ISBN: 978-984-34-0265-3)
ICCESD 2016 561
A STUDY ON HYDRODYNAMIC AND MORPHOLOGICAL BEHAVIOR OF
PADMA RIVER USING DELFT3D MODEL
Binata Roy*1, Muhammad Rezaul Haider
2 and Anika Yunus
3
1 Graduated Student, Department of Water Resources Engineering, BUET, Bangladesh, e-mail:
[email protected] 2 Assistant Professor, Department of Water Resources Engineering, BUET, Bangladesh, e-mail:
[email protected] 3 Associate Professor, Department of Water Resources Engineering, BUET, Bangladesh, e-mail:
ABSTRACT
The Padma, traditionally considered a dominantly meandering river, is switching over into a braided river due
to its highly susceptible nature of erosion and deposition. To identify proper behavior of the Padma River, a
hydrodynamic and morphological study is done by developing a 2D model using Delft3D. The selected reach is
120 km and spans from Baruria Transit at u/s to Tarpasha at d/s. Different hydrodynamic characteristics such
as variation in water level due to tidal effect, change in velocity, discharge and morphological characteristics
such as sediment transport rate, cumulative erosion/deposition at three specific locations of Padma River –
Goalundo, Bhagyakul and Wari for the year 2010 are assessed. Results reveal that tidal range is high during
dry season and increases from upstream to downstream of the river. The model shows that the downstream
section - Wari faces more tidal effect than the upstream section - Goalundo. The velocity is found maximum
near the middle section of the river - Bhagyakul and minimum near the downstream of the river - Wari. As it is
known that sediment transport rate is closely related to the velocity, the model verifies the phenomenon and
shows that during wet season high velocity results high sediment transport rate and ultimately contributes in
erosion/deposition of river bed. From this study it is hoped that the findings of this assessment will be helpful to
understand the overall hydrodynamic and morphological nature of the Padma River and suggest possible future
development works to be implemented on this river.
Keywords: Behaviour, Delft3D, hydrodynamic, morphological, Padma river
1. INTRODUCTION
Bangladesh is a deltaic country located at lower part of the basins of the three mighty rivers of the world -
Ganga, Brahmaputra and Meghna. The huge amount of discharge and heavy sediment load cause the rivers to be
unstable and the channels are constantly migrating laterally (Coleman, 1969). This instability of the river regime
coupled with huge discharge and sediment load cause erosion and deposition and a chain action proceeds. The
Padma, traditionally considered a dominantly meandering system, is switching over into a braided system due to
its highly susceptible nature of erosion and deposition. The mean annual rate of erosion along Padma is found to
be very high. The Padma River has roughly a straight course in the upper reaches and a double-thread braided
lower arch (Khan, 2000). It is found that the river has widened considerably. According to ISPAN in the lower
reaches 46% widening took place between 1984 and 1993 and the middle reach is widened by 21% during the
same period (ISPAN, 1993c). The upper reach remained relatively stable. On the other hand, the right bank of
the middle and the lower reaches, is experiencing considerable erosion with some 200 m/year in the lower reach
to 110 m/year in the middle reach (ISPAN, 1993). The mean annual erosion along the Padma River was 1,400
ha/year, while it increased to 2200 ha/year in 1990s (IRIN, 2008).
BIWTA claimed that the depth of the Padma River is nowadays 1.5 to 2 meters at different place. But at least
2.5 to 3.00 meters depth of water has necessary for movement of river transports. BIWTA also reported that
water level is decreasing by 20 centimeters every day. And if this process continues, Padma River will be turned
into a wetland which will affect the navigation, agricultural, fishing, transportation facilities of nearby areas.
Finally it will damage the biodiversity and ecological balance of the southern part of Bangladesh. These
problems could be solved only when we will be able to know the actual hydrodynamic and morphological
behavior of this river. So a hydro morphological study of Padma River is utmost necessity to identify the
hydrodynamic and associated morphological changes of the river.

3rd International Conference on Civil Engineering for Sustainable Development (ICCESD 2016)
ICCESD 2016 562
Previously Habibullah (1987), Klassen and Massenlink (1992), Afroz (2012), Halder (2013), Farzana (2014)
and Khan (2014) studied the changes in channel pattern of Jamuna, Teesta, Kobodak and Karnafuli River.
Rahman (1978) studied the erosion deposition process of Padma River. His study was to establish the
relationship between sinuosity and meandiering River. Later Islam et al. (2009) and Yeasmin and Islam (2011)
studied char-lands of Padma River basin in Ganges delta and changing trends of channel pattern of Ganges-
Padma River respectively.
Though several modeling studies have been conducted to understand the behavior of the rivers of Bnagladesh.
But most of these models are very expensive and time consuming. Delft 3D is a powerful open source tool for
the understanding and forecasting river morpho-dynamic behavior. It takes into account the most relevant
factors involved in this process (as input parameters) and gives a broad range of results (as output parameters)
presented in an accessible manner. Previously Laz (2012) observed the morphological change of Jamuna River
using Delft3D model. She studied the sediment transport rate, erosion and deposition and bed level changes and
also the shifting process of the river. Then Alam (2013) studied the response of lower Karnafuli River using
Delft3D model. The study was to assess the river response due to dredging works under capital dredging project
and to quantify the erosion/deposition impact due to capital dredging.
In this reserach the hydrodynamic and morphological assessment of Padma river is done using Delft3D model.
A hydrodynamic study on Padma River will help us to know its flow characteristics like rise and fall of water
level due to tides, velocity and discharge. On the other hand morphological analysis will help to know the
sediment transport rate, rate of erosion, deposition, bed level changes etc.
The specific objectives of my study are :
� To observe the variation of water level at different points of the river due to daily, monthly and seasonal
tidal effect.
� To observe the variation of velocity and discharge of the river over the year.
� To observe the sediment transport rate and cumulative erosion/deposition at different locations of the
river.
2. METHODOLOGY
2.1 Study Area
The selected reach is approximately 120 km long starting from Baruria Transit at U/S to Tarpasha at D/S.
Figure 1 : Google image of Padma River (Source: Google Earth)

3rd International Conference on Civil Engineering for Sustainable Development (ICCESD 2016)
ICCESD 2016 563
2.2 Data Collection
Table 1: Types of Data Collected and their Sources
Data Location Period Source
Bathymetry Station ID RMP 0.1- RMP7 2010 BWDB & WARPO
U/S discharge Baruria Transit 91.9 L 2010, 2011 BWDB
Water Level Mawa 93.5L & Tarpasha 94L 2010, 2011 BWDB
Sediment Baruria Transit 91.9L and
Mawa 93.5 L Most Recent BWDB
The discharge time series at u/s boundary Baruria transit and water level time series at d/s boundary Tarpasha
found from BWDB are plotted for the simulated year 2010 and presented in Figure 2 and Figure 3 respectively.
Figure 2 : Discharge at u/s Baruria Transit (2010) Figure 3 : WL at d/s Tarpasha (2010)
2.3 Data Processing
The bathymetry data obtained from BWDB and WARPO were measured from one bank line in form of distance
and depth. But Delft3D operates with X, Y (latitude and longitude) ordinates. So first of all the bathymetry data
were extracted into X, Y ordinates by Arc-GIS. Then The X, Y points are extracted from Arc-GIS attribute table
to excel sheet by using Table to Excel tool.
2.4 Model Setup
2.4.1 Grid Generation
Figure - 4 shows the grid generated covering the Padma river using Delft3D. After several trial and error and
checking the orthogonality and aspect ratio finally a grid of M = 223 by N =56 is taken.
Figure 4 (a): Spline Figure 4 (b) : Final Grid

3rd International Conference on Civil Engineering for Sustainable Development (ICCESD 2016)
ICCESD 2016 564
2.4.2 Bathymetry Development
Figure - 5 shows the bathymetry developed for Padma river using delft3D.
Figure 5 : Bathymetry with Depth
2.4.3 Delft 3D FLOW Set Up
2.4.3.1 Boundary Conditions and Boundary Set-up
Table 2 presents the boundary conditions set for the model development.
Table 2 : Boundary Locations
Data Location
U/S Discharge Baruria Transit 91.9L
D/S WL Tarpasha 94L
2.4.3.2 Hydrodynamic Parameters
Table 3 presents Hydrodynamic parameters used in the model where, Manning’s roughness n is used as the
calibration parameter for the model.
Table 3: Hydrodynamic Parameters
Parameters Value
Gravity 9.81m/s2
Water Density 1000 kg/m3
Roughness 0.018 to 0.027
Horizontal Eddy viscosity 1 m2/s
2.5.3.3 Morphological Parameter
Table 4 presents the morphological parameters used in the model.

3rd International Conference on Civil Engineering for Sustainable Development (ICCESD 2016)
ICCESD 2016 565
Table 4: Sediment and Morphological Parameters
Parameters Value
Specific density 2650 kg/m3
Dry bed density 1600 kg/m3
D50 0.200 mm
Van Rijn’s reference height factor 1
Threshold sediment thickness 0.05
2.4 Calibration and Validation
2.4.1 Calibration
The model is calibrated and validated against the water level at Mawa for two months April (dry season) and
July (wet season) of 2010 and 2011 respectively.
2.4.1.1 Calibration for April 2010 and July 2010
Figure 6 (a) and (b) show the model calibration results for dry season and wet season respectively. The model is
calibrated using different manning’s n ranged from 0.018 to 0.027.
Figure 6 (a) : Calibration for April, 2010 (dry season) Figure 6 (b) : Calibration for July, 2010 (wet season)
2.6.2 Validation
2.6.2.1.Validation for April 2011 and July 2011
After calibration the model is validated for the month of april and july, 2011. Figure 7 (a) and (b) show the
validation results. From the figures it is seen that the model shows good agreement with the observed data.
Figure 7 (a) : Validation at Mawa for April, 2011 Figure 7 (b) : Validation at Mawa for month July, 2011
3rd International Conference on Civil Engineering for Sustainable Development (ICCESD 2016)
ICCESD 2016 566
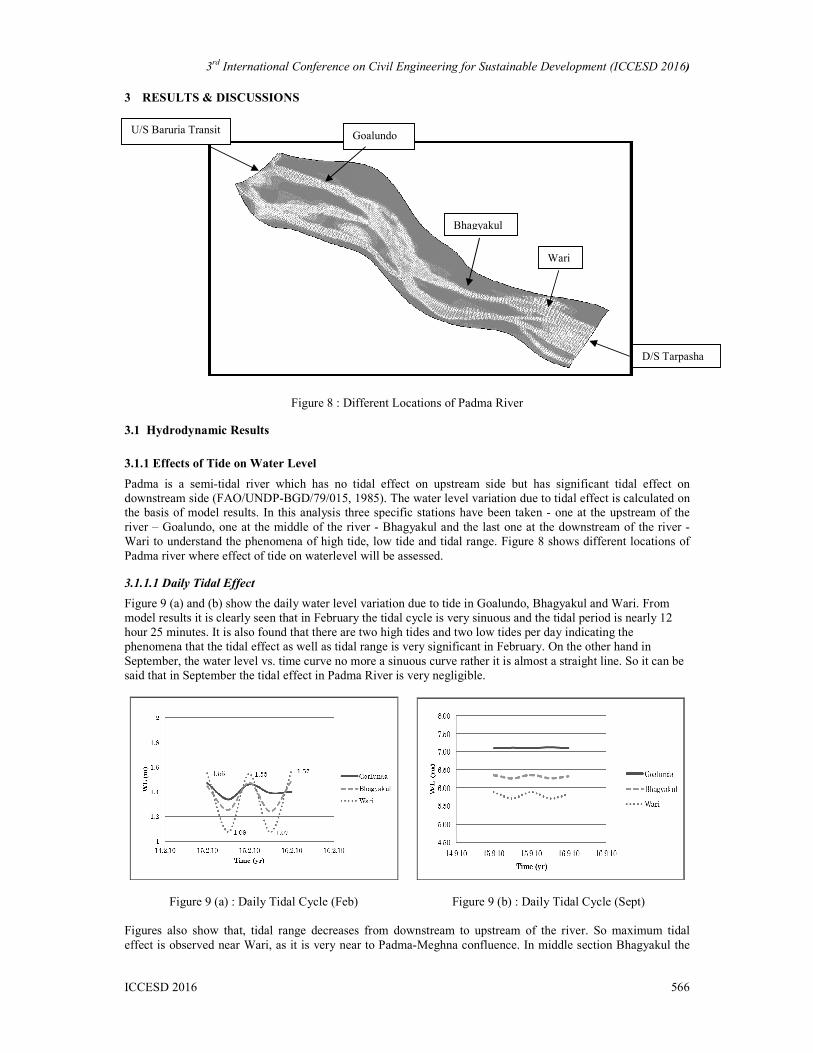
3 RESULTS & DISCUSSIONS
Figure 8 : Different Locations of Padma River
3.1 Hydrodynamic Results
3.1.1 Effects of Tide on Water Level
Padma is a semi-tidal river which has no tidal effect on upstream side but has significant tidal effect on
downstream side (FAO/UNDP-BGD/79/015, 1985). The water level variation due to tidal effect is calculated on
the basis of model results. In this analysis three specific stations have been taken - one at the upstream of the
river – Goalundo, one at the middle of the river - Bhagyakul and the last one at the downstream of the river -
Wari to understand the phenomena of high tide, low tide and tidal range. Figure 8 shows different locations of
Padma river where effect of tide on waterlevel will be assessed.
3.1.1.1 Daily Tidal Effect
Figure 9 (a) and (b) show the daily water level variation due to tide in Goalundo, Bhagyakul and Wari. From
model results it is clearly seen that in February the tidal cycle is very sinuous and the tidal period is nearly 12
hour 25 minutes. It is also found that there are two high tides and two low tides per day indicating the
phenomena that the tidal effect as well as tidal range is very significant in February. On the other hand in
September, the water level vs. time curve no more a sinuous curve rather it is almost a straight line. So it can be
said that in September the tidal effect in Padma River is very negligible.
Figure 9 (a) : Daily Tidal Cycle (Feb) Figure 9 (b) : Daily Tidal Cycle (Sept)
Figures also show that, tidal range decreases from downstream to upstream of the river. So maximum tidal
effect is observed near Wari, as it is very near to Padma-Meghna confluence. In middle section Bhagyakul the
Goalundo
U/S Baruria Transit
D/S Tarpasha
Wari
Bhagyakul

3rd International Conference on Civil Engineering for Sustainable Development (ICCESD 2016)
ICCESD 2016 567
tidal effect is medium. The upstream section Goalundo has very low daily tidal effect. Because the tide observed
in Bangladesh is mainly generated in Indian Ocean. It travels across the Bay of Bengal and then approaches
towards inlands of Bangladesh. So the amplitude of tide gradually diminishes as it propagates towards inland
(FAO/UNDP-BGD/79/015, 1985).
3.1.1.2 Monthly Tidal Effect
Figure 10 shows monthly tidal range at Gaolundo, Bhagyakul and Wari of Padma river. From figurs it is
observed that tidal range increases from November, attains highest value during February – March and then
again starts falling. It is nearly zero in high flow months especially in July to September. The maximum tidal
ranges are 0.04 m in Goalundo, 0.23 in Bhagyakul and 0.44 m in Wari.
Figure 10 : Tidal Range (m) at Goalundo, Bhagyakul and Wari
3.1.1.3 Seasonal Tidal Effect
Figure 11 shows the seaonal variation of tidal range at three specific location of Padma river – Goalundo,
Bhagyakul and Wari. The figure shows that high tidal range trend during dry season (November to April) and
comparatively low during wet season (May to October). This may be due to the fact that during wet season the
flow in the river is very high so the tide producing seawater cannot enter into the river, even if it enters, it is very
low in amount. So the tidal range is minimum in wet season. On the other hand during dry season the water
level is very low in river which allows more sea water to enter into the river resulting significant tidal effect. So
the tidal range is higher in wet season than dry season (FAO/UNDP-BGD/79/015, 1985).
Figure 11 : Seasonal Tidal Range (m) at Goalundo, Bhagyakul and Wari

3rd International Conference on Civil Engineering for Sustainable Development (ICCESD 2016)
ICCESD 2016 568
3.1.1.4 Variation in Velocity
Figure 12 (a) and (b) show montly and seasonal variation of velocity at Goalundo, Bhagyakul and Wari
respectively. Figure 12 (a) shows that velocity is highest in September, than it starts falling and it is lowest in
January at all the three locations. Further analysis shows that, velocity is found maximum in Bhagyakul due to
its narrow cross-sectional area and minimum in Wari. The velocity at Goalunda is in between that of Bhagyakul
and Wari. In wet season the average velocity is found 1.06 m/s at upstream section - Goalunda, 1.52 m/s at
midsection – Bhagyakul and 0.67 m/s at downstream section – Wari (figure 12(b)).
Figure 12 (a) : Velocity (m/s) at Goalundo, Bhagyakul and Wari
Figure 12 (b) : Seasonal Avg. Velocity (m/s) at Goalundo, Bhagyakul and Wari
3.1.1.5 Variation in Discharge
Figure 13 (a) and (b) present monthly and seasonal discharge at Goalundo, Bhagyakul and Wari. It is clearly
observed that the variation of discharge over location is not significant but the seasonal variation is very high.
The discharge is much higher in wet season than in dry season. In Padma, the discharge is maximum in
September and minimum in February – March. It is very consistent with the natural seasonal flow pattern of
Padma River (Neill et al., 2010).

3rd International Conference on Civil Engineering for Sustainable Development (ICCESD 2016)
ICCESD 2016 569
Fig 13 (a) : Monthly Discharge (m3/s) at Goalundo, Bhagyakul and Wari
Figure 13 (b) : Seasonal Variation of Discharge (m3/s) at Goalundo, Bhagyakul and Wari
3.2 Morphological Results
3.2.1 Variation in Sediment Transport Rate
Figure 14 shows the variation of sediment trasnport rate and table 5 shows the Suspended Transport, Bed Load
Transport and Total Transport at Goalundo, Bhagyakul and Wari over the year. From the figure and table it is
observed that the sediment transport rate exhibits a seasonal pattern and it is maximum in July (wet season) and
is minimum in December (dry season).
From the figure and table it is also clearly seen that, the sediment transport rate of Bhagyakul is the maximum
and minimum in Wari. These results show consistency with the velocity results mentioned in figure 12 (a) and
(b). From Figure 12(a) and 12 (b) it is clearly observed that in wet season the velocity is high and this is the
reason of high sediment trasnport rate in wet season. On the other hand low velocity in dry season leads to low
sediment trasnport rate in dry season. The reason behind high sediment trasnport rate in Bhagyakul is also
explainable from figure 12 (a). In Bhagyakul due to high velocity the sediment transport is high whereas low
velocity in wari leads to low sediment trasnport rate at wari.

3rd International Conference on Civil Engineering for Sustainable Development (ICCESD 2016)
ICCESD 2016 570
Figure 14 : Variation of Sediment Transport (m3/s) over the Year (Bhagyakul)
Table 5 : Suspended Transport, Bed Load Transport and Total Transport at Goalundo, Bhagyakul and Wari
Suspended Transport (m3/s) Bed Load Transport (m
3/s) Total Transport (m
3/s)
Goalundo Bhagyakul Wari Goalundo Bhagyakul Wari Goalunda Bhagyakul Wari
Dry season 0.0012 0.0148 0.009 0.0001 0.002 .0003 0.002 0.0168 0.01
Wet season 0.0392 0.405 0.106 0.0085 0.027 0.008 0.0472 0.432 0.118
3.2.2 Erosion/Deposition Process
Cumulative erosion/deposition for different months – april, june, august, october and december are presented in
figure 15 (a- e) respectively. The deep blue color shown in the figures are the areas of erosion while the yellow-
red color shows the areas subject to deposition.
From the figures it is clear that erosion/deposition is not much significant at first 4 months. This may be due to
the fact that the model requires some time to get adjusted with the given sediment load and from January to
April the sediment transport rate is also very low. The maximum erosion/deposition occurs from July to
September. Then the rate decreases and it is almost negligible in December. Because during dry season the
sediment transport rate is very small amount so the erosion/deposition is very minor too. This result is very
consistent with the results found in velocity variaton and sediment trasnport rate in figure 12 and 14
respectively.
To understand the cumulative erosion/deposition process in Padma river clearly over the year, three vulnerable
sections are taken all through the river - one at Goalundo, one at Bhagyakul and last one at Wari and shown in
Figure 16. This figure represents cumulative erosion / deposition at Goalundo, Bhagyakul and Wari. It is
observed that at upstream reach - Goalundo the erosion/deposition both occurs but is not severe. In the middle-
narrow reach – Bhagyakul mainly erosion occurs. And the downstream reach of Padma - Wari is very
vulnerable and subjected to deposition mainly but erosion also occurs at some points.

3rd International Conference on Civil Engineering for Sustainable Development (ICCESD 2016)
ICCESD 2016 571
*Figure 15 (a) : Cumulative Erosion / Deposition *Figure 15 (b) : Cumulative Erosion/Deposition
at the End of April at the end of June
*Figure 15 (c) : Cumulative Erosion / Deposition *Figure 15 (d) : Cumulative Erosion./Deposition
at the End of August at the end of October
*Figure 15 (e) : Cumulative Erosion / Deposition at the End of December
*Figure 16 : Cumulative Erosion / Deposition at Goalundo, Bhagyakul and Wari
Goalundo
Bhagyakul
Wari

3rd International Conference on Civil Engineering for Sustainable Development (ICCESD 2016)
ICCESD 2016 572
4 CONCLUSIONS
In this study a 2D model is developed using Delft3D and using Baruria Transit as the u/s boundary and Tarpasha
as the d/s boundary, the model is simulated for the year 2010 and then used to study the hydrodynamic and
morphological behavior of the Padma River. The findings are concluded briefly in following points :
• Tidal effect as well as tidal range is high during dry season i.e. from November to April and is comparatively
low during wet season i.e. from May to October. The tidal range increases from upstream to downstream. So
the downstream section Wari faces more tidal effect than the upstream section Goalundo.
• The velocity is higher in wet season than dry season. And velocity is found maximum in middle section -
Bhagyakul and minimum in downstream section - Wari. The velocity of upstream section – Goalundo is in
between those of Bhagyakul and Wari.
• From model results it is clearly seen that the discharge is much higher in wet season than in dry season.
Monthly analysis of discharge shows discharge is maximum in September and minimum in March.
• It is found that sediment transport rate is very closely related to the velocity of the river. High velocity results
high sediment transport rate, this ultimately contributes in significant erosion/deposition of bed level and
vice versa. The sediment transport rate is maximum in Bhagyakul due to high velocity, while Wari is
subjected to low sediment transport rate as a result of low velocity. The sediment transport rate in Goalundo
is in between those of Bhagyakul and Wari.
• The erosion/deposition is higher in wet season than in dry season. So the change of bed level is insignificant
during dry season compared to monsoon season.
• The cumulative erosion is found maximum in middle section - Bhagyakul and maximum in the downstream
section - Wari. Upstream section - Goalundo is subjected to minor erosion/deposition.
ACKNOWLEDGEMENTS
I want to express my deepest thanks and appreciation to BWDB and WARPO for their cooperation in collecting
required data and information.
REFERENCES
Afroz, S. (2012). A study on morphological characteristics, sediment transport characteristics, mitigation
behaviour and erosion – deposition rate of Teesta River.
Alam, S. (2013). A study on the river response of lower Karnafuli River using Delft3D model.
Coleman, J.M. (1969). Brahmaputra River: Channel processes and sedimentation. In Sedimentary Geology,
Volume 3, Issue 2, 129-239.
Neill, C. R., Oberhagemann, K. and McLean, D. (2010). Northwest Hydraulic Consultants, Edmonton and
Vancouver, Canada and Dhaka, Bangladesh, Q. M. Ferdous Bangladesh Bridge Authority, Dhaka,
Bangladesh. A Report on River training works for Padma multipurpose bridge, Bangladesh.
FAO/UNDP-BGD/79/015 (1985). Report on Tidal Area Study. Retrived from
http://www.fao.org/3/contents/e868f088-ab02-57fd-8087-cd9ce1d76a8b/AC352E04.htm#ch25.
Farzana, S. (2014). Hydromorphogical assessment of Teesta River using HEC-RAS 1D model.
Habibullah (1987). A study on the changes in channel pattern of the Jamuna River.
Halder, U.K. (2013). The morphological change of Kobodak River.
Integrated Regional Information Networks. (2008).
Irrigation Support Project for Asia and the Near East (ISPAN). (1993).
Irrigation Support Project for Asia and the Near East (ISPAN). (1993c).
Islam, S. N., Singh, S. and Shaheed, H. (2009). The settlement relocations in the char-lands of Padma River
basin in Ganges delta.
Khan, F. (2014). A study on the morphological changes of Karnafuli River using HEC-RAS 1D model.
Khan, S. R. (2000). Three mighty rivers dying. The Independent. Retrieved from
http://ruchichowdhury.tripod.com/three_mighty_rivers_dying.htm
Klassen, Massenlink. (1992). Assessment of bank erosion rate of the Jamuna River using satellite image.
Laz, O. U. (2012). Morphological Assessment of Jamuna River using Delft3D model.
Rahman (1978). A study on the erosion of the Padma River from Goalunda to confluence of Padma-Meghna
near Chandpur.
Yeasmin, A. and Islam, N. (2011). A study on Changing trends of channel pattern of the Ganges-Padma River.