hydrodynamic and morphological … module hydrodynamic simulation has been accomplished. model has...
TRANSCRIPT

Proceedings of the 3rd International Conference on Civil Engineering for Sustainable Development
(ICCESD 2016), 12~14 February 2016, KUET, Khulna, Bangladesh (ISBN: 978-984-34-0265-3)
ICCESD 2016 647
HYDRODYNAMIC AND MORPHOLOGICAL ANALYSIS OF GORAI RIVER
USING DELFT3D MATHEMATICAL MODEL
Mariam Khanam*1 and Umme Kulsum Navera
2
1 Graduated Student, Department of Water Resources Engineering, Bangladesh University of Engineering and
Technology, Bangladesh, e-mail: [email protected] 2 Professor, Department of Water Resources Engineering, Bangladesh University of Engineering and
Technology, Bangladesh, e-mail: [email protected]
ABSTRACT
Gorai River is in the principal distributary of the Ganges River, the main source of fresh water from Ganges to
the south-west region of Bangladesh. Gorai has been facing very low flow in the dry period due to withdrawal
of water in the upstream of Ganges. Therefore, it is a vital urge to keep the river live to shed necessary amount
of discharge to the southwestern region of Bangladesh. This study focuses on analysis of hydrodynamic and
morphological characteristics of a selected reach of Gorai River and response of the river due to different
dredged sections using Delft3D mathematical model for evaluating the best section which will help the river to
revive. The river reach from the Rail Road Bridge, Talbaria to Kamarkhali Transit has been selected to for the
model set up. For boundary condition time series discharge and water level data has been used. For calibration
and validation Kamarkhali is selected as an intermediate point and water level data is used. With the model
simulation results different hydrodynamic and morphological analysis like variation of velocity, erosion and
deposition, sediment transport and bed level changes have been studied. The model has been further used to
generate three dredged sections having different dimensions along the selected reach. Simulated results with
dredged sections for dry period have been used to compare the changes in different hydrodynamic and
morphological phenomenon. The outcome from the model simulation is wished to be helpful for any future
dredging work on this river.
Keywords: Delft3D, dredged section, hydrodynamic, mathematical model, morphological comparison
1. INTRODUCTION
Gorai is a meandering alluvial perennial river. It is the principal distributary of the Ganges River, the main
source of fresh water from Ganges to the south-west region of Bangladesh (Islam and Gnauck, 2011). The
Gorai-Madhumati river system has a flood discharge of nearly 7,000 cubic meters in the monsoon period but in
winter the flow goes down from five cubic meters to nearly zero. These characteristics have made the river the
element of concern because the agriculture, wildlife and fresh water supply to the south-west region are at risk
and salinity has increased to an alarming rate.
Gorai possesses a significant role in Bangladesh’s river system in the south western region and is subjected to
enormous changes due to natural and manmade changes; numbers of studies have been initiated since Farakka
Dam was constructed in the upstream of its tributary, Ganges in India. Different kinds of analysis of various
characteristics of this river have been done using either 1D and 2D mathematical model or statistical means. The
Gorai River Restoration Project (GRRP) was initiated under Government of People’s Republic of Bangladesh,
Ministry of Water Resources, planned by BWDB (Bangladesh Water Development Board) and cooperated by
Danish Hydraulic Institute (DHI) in the mid-nineties and during the study period there have a range of
researches done using statistical methods, 1D Mathematical Models including Hec-RAS and a special developed
model for GRRP by SWMC and 2D Model named MIKE 21C.
This study has mainly done to notice and analyse the response of various hydrodynamic and morphological
processes of Gorai River using a different 2D mathematical model named Delft3D. Delft3D consists of different
modules such as Flow, MOR, Wave, and WAQ. For this study the Flow module is used which is a
multidimensional (2D or 3D) hydrodynamic and transport simulation program. The simulated data has helped to
analyse how velocity, sediment transport and bed level changes with or without dredging.

3rd International Conference on Civil Engineering for Sustainable Development (ICCESD 2016)
ICCESD 2016 648
Using Delft3D mathematical model we can acquire numerous different features of Hydrodynamics and
Morphology of the river which cannot be observed in the field. We can also obtain simulated data and compare
them by changing different parameters. Amongst them, the following have been mainly concentrated on:
• To setup Calibrated and validated model of Gorai River in Delft3D mathematical model
• To analyse hydrodynamic and morphological characteristics of the river
• To analyse river response due to dredging in the dry period
2. THEORY
At the level of “fluid elements”, in any domain, the equations of fluid dynamics must be solved subjected to a
set of conditions that act at the domain boundary. The main flow equations that are to be solved by Delft3D
model as follows:
Equation (1) represents the “Continuity equation” based on the law of conservation of mass:
(1)
Equation (2) represents the “Momentum equation” based on the law of conservation of momentum:
(2)
Equation (3) and (4) represents the Navier- Stokes equation of viscosity. Equation (4) is the vector form of
Navier-Stokes equation:
(3)
(4)
Here u, v and w denote the velocity components in three perpendicular directions, P is pressure generated by
force F and Vv is the vertical eddy viscosity, fu, fv are coriollis parameters which are neglected in this case.
are the viscosity in the perpendicular direction.
3. METHODOLOGY
The work in the research is mainly accomplished in two sections, first and very important phase was to collect
and process the data for input in the model, secondly and actual work was done with Delft3D. The cross-
sectional data for geometry set up, discharge and water level data for boundary condition in Delft3D have been
collected from WARPO and Google Earth. The geometry has been setup with the help of observed data and
using Arc GIS. Calibration and validation has been done for setting up the model of the Gorai River. Then using
Delft3D-Flow module hydrodynamic simulation has been accomplished. Model has been run for several times
using different co-efficient of roughness for calibration and then the validated with the same co-efficient of
roughness. After calibration and validation the model was used for morphological simulation. The methodology
that has been followed in this study is as follows:
3.1 Study Area Selection
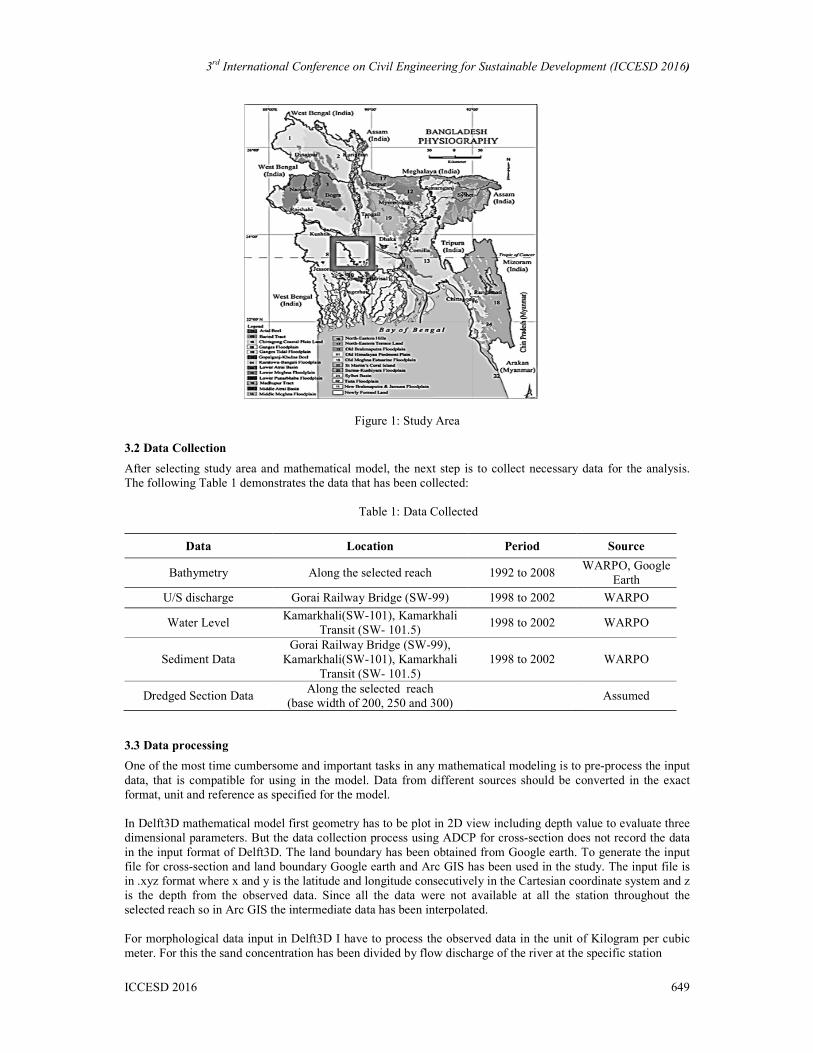
In this work upper reach of Gorai-Madhumati river system has been selected as the study area [Figure 1], where
upstream boundary is located at the Gorai Railway Bridge (BWDB station ID 99 for discharge) and downstream
boundary is located at the Kamarkhali Transit (BWDB station ID 101.5 for water level) .Total length of the
selected reach is about 90 kilometers. An Intermediate location at Kamarkhali (BWDB station ID 101 for water
level) has been selected for calibration and validation purpose. In the Figure 1, the bold squared portion
represents the study area.
3rd International Conference on Civil Engineering for Sustainable Development (ICCESD 2016)
ICCESD 2016 649
Figure 1: Study Area
3.2 Data Collection
After selecting study area and mathematical model, the next step is to collect necessary data for the analysis.
The following Table 1 demonstrates the data that has been collected:
Table 1: Data Collected
Data Location Period Source
Bathymetry Along the selected reach 1992 to 2008 WARPO, Google
Earth
U/S discharge Gorai Railway Bridge (SW-99) 1998 to 2002 WARPO
Water Level Kamarkhali(SW-101), Kamarkhali
Transit (SW- 101.5) 1998 to 2002 WARPO
Sediment Data
Gorai Railway Bridge (SW-99),
Kamarkhali(SW-101), Kamarkhali
Transit (SW- 101.5)
1998 to 2002 WARPO
Dredged Section Data Along the selected reach
(base width of 200, 250 and 300) Assumed
3.3 Data processing
One of the most time cumbersome and important tasks in any mathematical modeling is to pre-process the input
data, that is compatible for using in the model. Data from different sources should be converted in the exact
format, unit and reference as specified for the model.
In Delft3D mathematical model first geometry has to be plot in 2D view including depth value to evaluate three
dimensional parameters. But the data collection process using ADCP for cross-section does not record the data
in the input format of Delft3D. The land boundary has been obtained from Google earth. To generate the input
file for cross-section and land boundary Google earth and Arc GIS has been used in the study. The input file is
in .xyz format where x and y is the latitude and longitude consecutively in the Cartesian coordinate system and z
is the depth from the observed data. Since all the data were not available at all the station throughout the
selected reach so in Arc GIS the intermediate data has been interpolated.
For morphological data input in Delft3D I have to process the observed data in the unit of Kilogram per cubic
meter. For this the sand concentration has been divided by flow discharge of the river at the specific station
3rd International Conference on Civil Engineering for Sustainable Development (ICCESD 2016)
ICCESD 2016 650
3.4 Model Set up
3.4.1 Grid Generation
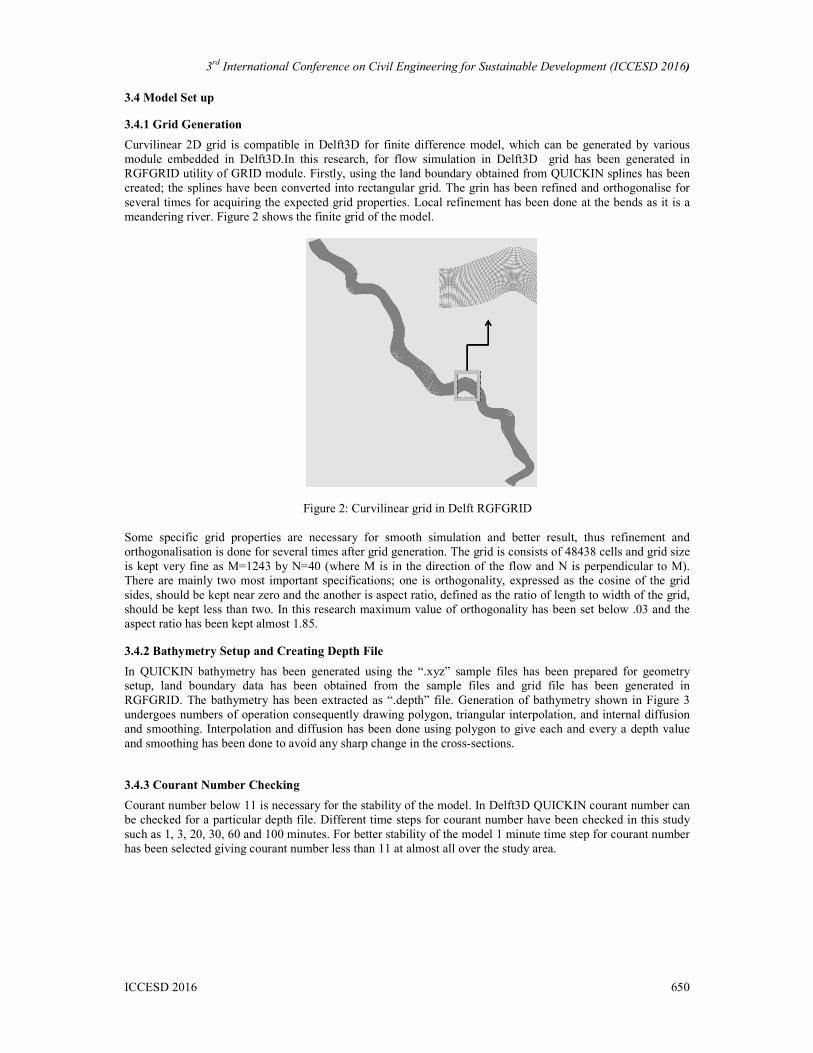
Curvilinear 2D grid is compatible in Delft3D for finite difference model, which can be generated by various
module embedded in Delft3D.In this research, for flow simulation in Delft3D grid has been generated in
RGFGRID utility of GRID module. Firstly, using the land boundary obtained from QUICKIN splines has been
created; the splines have been converted into rectangular grid. The grin has been refined and orthogonalise for
several times for acquiring the expected grid properties. Local refinement has been done at the bends as it is a
meandering river. Figure 2 shows the finite grid of the model.
Figure 2: Curvilinear grid in Delft RGFGRID
Some specific grid properties are necessary for smooth simulation and better result, thus refinement and
orthogonalisation is done for several times after grid generation. The grid is consists of 48438 cells and grid size
is kept very fine as M=1243 by N=40 (where M is in the direction of the flow and N is perpendicular to M).
There are mainly two most important specifications; one is orthogonality, expressed as the cosine of the grid
sides, should be kept near zero and the another is aspect ratio, defined as the ratio of length to width of the grid,
should be kept less than two. In this research maximum value of orthogonality has been set below .03 and the
aspect ratio has been kept almost 1.85.
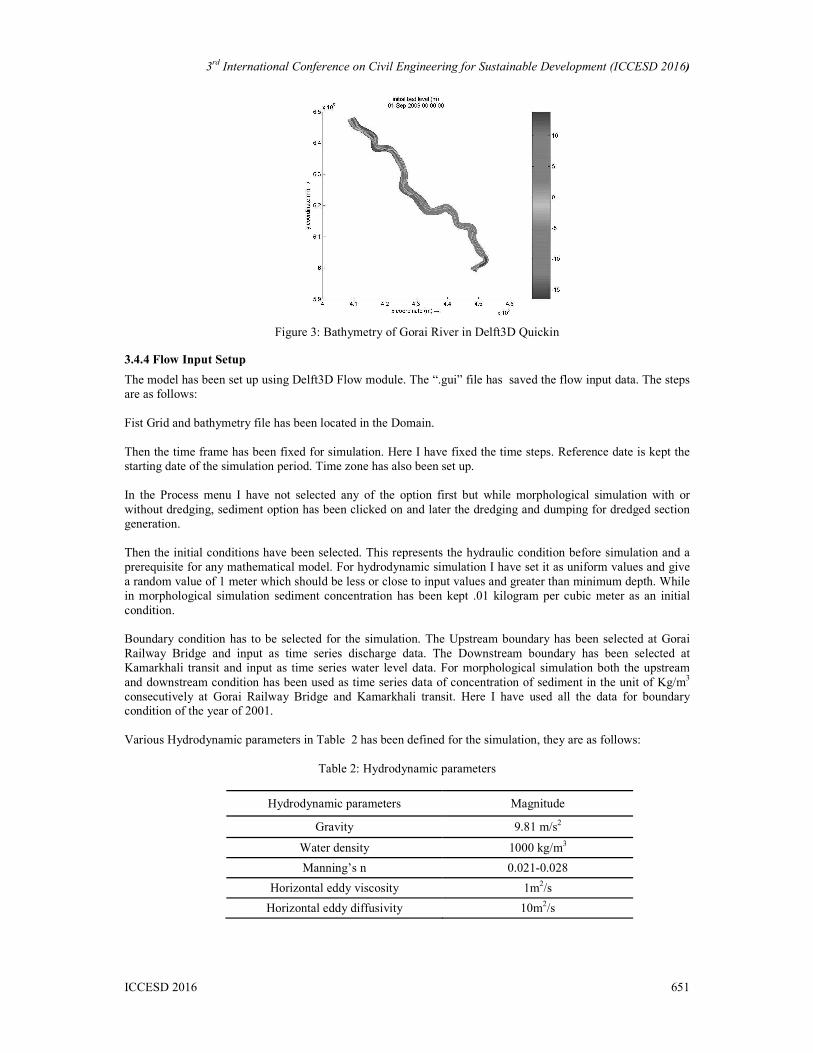
3.4.2 Bathymetry Setup and Creating Depth File
In QUICKIN bathymetry has been generated using the “.xyz” sample files has been prepared for geometry
setup, land boundary data has been obtained from the sample files and grid file has been generated in
RGFGRID. The bathymetry has been extracted as “.depth” file. Generation of bathymetry shown in Figure 3
undergoes numbers of operation consequently drawing polygon, triangular interpolation, and internal diffusion
and smoothing. Interpolation and diffusion has been done using polygon to give each and every a depth value
and smoothing has been done to avoid any sharp change in the cross-sections.
3.4.3 Courant Number Checking
Courant number below 11 is necessary for the stability of the model. In Delft3D QUICKIN courant number can
be checked for a particular depth file. Different time steps for courant number have been checked in this study
such as 1, 3, 20, 30, 60 and 100 minutes. For better stability of the model 1 minute time step for courant number
has been selected giving courant number less than 11 at almost all over the study area.
3rd International Conference on Civil Engineering for Sustainable Development (ICCESD 2016)
ICCESD 2016 651
Figure 3: Bathymetry of Gorai River in Delft3D Quickin
3.4.4 Flow Input Setup
The model has been set up using Delft3D Flow module. The “.gui” file has saved the flow input data. The steps
are as follows:
Fist Grid and bathymetry file has been located in the Domain.
Then the time frame has been fixed for simulation. Here I have fixed the time steps. Reference date is kept the
starting date of the simulation period. Time zone has also been set up.
In the Process menu I have not selected any of the option first but while morphological simulation with or
without dredging, sediment option has been clicked on and later the dredging and dumping for dredged section
generation.
Then the initial conditions have been selected. This represents the hydraulic condition before simulation and a
prerequisite for any mathematical model. For hydrodynamic simulation I have set it as uniform values and give
a random value of 1 meter which should be less or close to input values and greater than minimum depth. While
in morphological simulation sediment concentration has been kept .01 kilogram per cubic meter as an initial
condition.
Boundary condition has to be selected for the simulation. The Upstream boundary has been selected at Gorai
Railway Bridge and input as time series discharge data. The Downstream boundary has been selected at
Kamarkhali transit and input as time series water level data. For morphological simulation both the upstream
and downstream condition has been used as time series data of concentration of sediment in the unit of Kg/m3
consecutively at Gorai Railway Bridge and Kamarkhali transit. Here I have used all the data for boundary
condition of the year of 2001.
Various Hydrodynamic parameters in Table 2 has been defined for the simulation, they are as follows:
Table 2: Hydrodynamic parameters
Hydrodynamic parameters Magnitude
Gravity 9.81 m/s2
Water density 1000 kg/m3
Manning’s n 0.021-0.028
Horizontal eddy viscosity 1m2/s
Horizontal eddy diffusivity 10m2/s

3rd International Conference on Civil Engineering for Sustainable Development (ICCESD 2016)
ICCESD 2016 652
For the morphological simulation some sediment parameters have been defined in Table 3. For the
morphological parameters, Van Rijn’s reference height factor has been used as 1 and Threshold sediment depth
thickness has been kept .05 meter.
Table 3: Morphological parameters
Morphological parameters Magnitude
Specific density 2650 kg/m3
Dry bed density 1600 kg/m3
Median sediment diameter (D50) 200 µm
Initial sediment layer thickness at bed 5 m
Some observation points and cross section has been introduces to the study area for evaluation of the output of
simulation which is visible in Figure 4. With these I have compare various time dependent water level,
discharge, sediment transport and bed level at particular cross sections.
Figure 4: Observation and Monitoring points and sections
3.4.5 Unsteady Hydrodynamic Simulation
After all the input and defining all the parameters unsteady hydrodynamic run has been done without
morphological input for the model stability checking for time period of one year of 2001. The model is later
used in morphological simulation and for calibration and validation.
3.4.6 Unsteady Morphological Flow Simulation
After calibration and validation the model is already been setup. Then the sediment data along with
hydrodynamic boundary condition has been input and a morphological simulation has been conducted. This
simulation has given the simulated parameters that have been analysed in the output and discussions section.
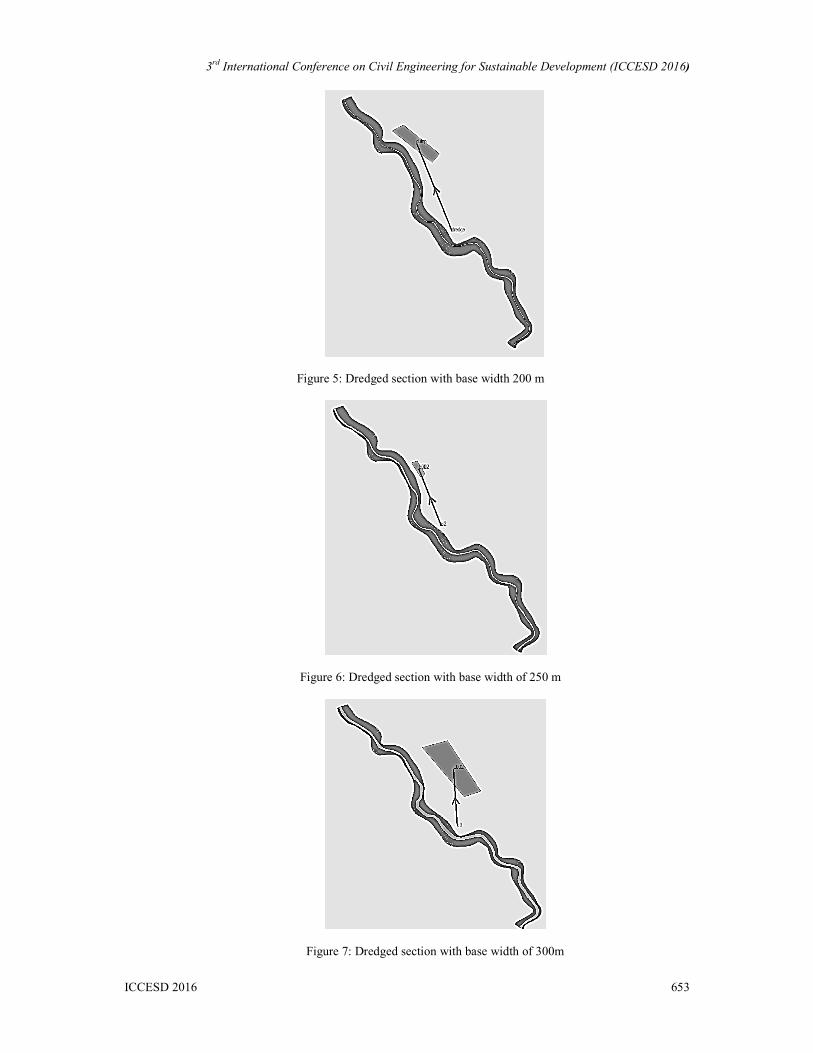
3.4.7 Simulation with Dredged Sections
As stated in the methodology, three sections of dredging with varying base width has been introduced using
Dredging and Dumping utility from edit menu of Delft3D QUICKIN module, Figure 5,6 & 7 represents them
simultaneously. For all the dredged sections dredging depth was kept same as 1 meter and side slope has been
generated by the model itself as there was no option for setting the slope manually. Temporary dumping areas
have been created for the input criteria outside the study area. The alignment has been kept along the river’s
natural stream line all through the selected reach.
3rd International Conference on Civil Engineering for Sustainable Development (ICCESD 2016)
ICCESD 2016 653
Figure 5: Dredged section with base width 200 m
Figure 6: Dredged section with base width of 250 m
Figure 7: Dredged section with base width of 300m

3rd International Conference on Civil Engineering for Sustainable Development (ICCESD 2016)
ICCESD 2016 654
Then simulation with each section has been done for dry period. Data of the year of 2001 from December 1st to
May 31st has been used in both for hydrodynamic and morphological boundary condition.
4. CONCLUSIONS
4.1 Results
4.1.1 Calibration and Validation
Calibration and validation of any model is a must prerequisite for model accuracy and stability. It is done by
adjusting certain hydrodynamic parameters. In this study space varying coefficient of roughness has been
selected as the tuning parameter for calibration and validation.
4.1.2 Calibration For the calibration of the model different values of Manning’s n (roughness coefficient) ranging from 0.021 to
0.028 has been used. This has been done at the kamarkhali station using water level data. The calibration has
been done for one month period durin monsoon. The data of September 1998 has been used. The calibrated data
has shown a close relation between observed and simulated data in Figure 8.
Figure 8: Calibration at Kamarkhali
4.1.3 Validation
After calibration the model must be validated by comparing the simulated and observed water level. This has
been done using data of September 1999 at kamarkhali. The validated data in Figure 9 does not show exact
similarity between observer and simulated data but it is quite close. For different time period it has shown an
overestimated result though.
Figure 9: Validation at kamarkhali
4.1.4 Comparison of Cross Sections, water level, depth averaged velocity and erosion & deposition
With the simulated data from hydrodynamic model observed data has been compared. The simulation was done
for one year using data of the year of 2001 and later compared with the same time frame observed data. For the
3rd International Conference on Civil Engineering for Sustainable Development (ICCESD 2016)
ICCESD 2016 655
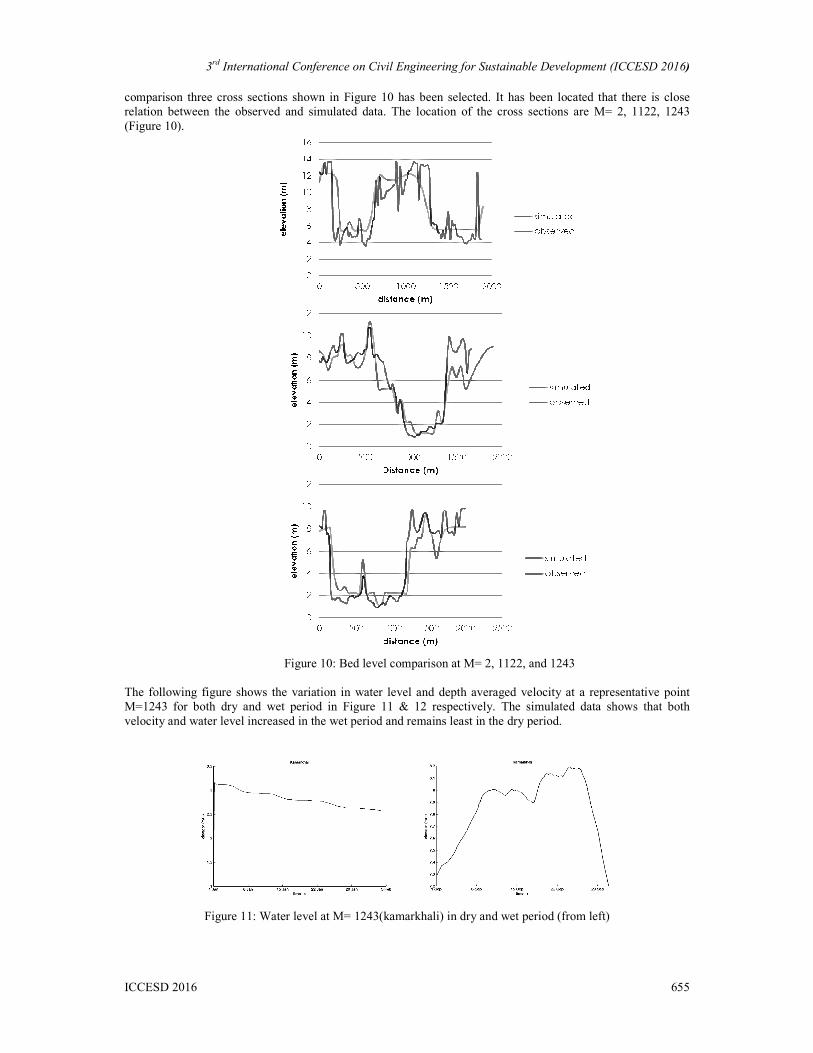
comparison three cross sections shown in Figure 10 has been selected. It has been located that there is close
relation between the observed and simulated data. The location of the cross sections are M= 2, 1122, 1243
(Figure 10).
Figure 10: Bed level comparison at M= 2, 1122, and 1243
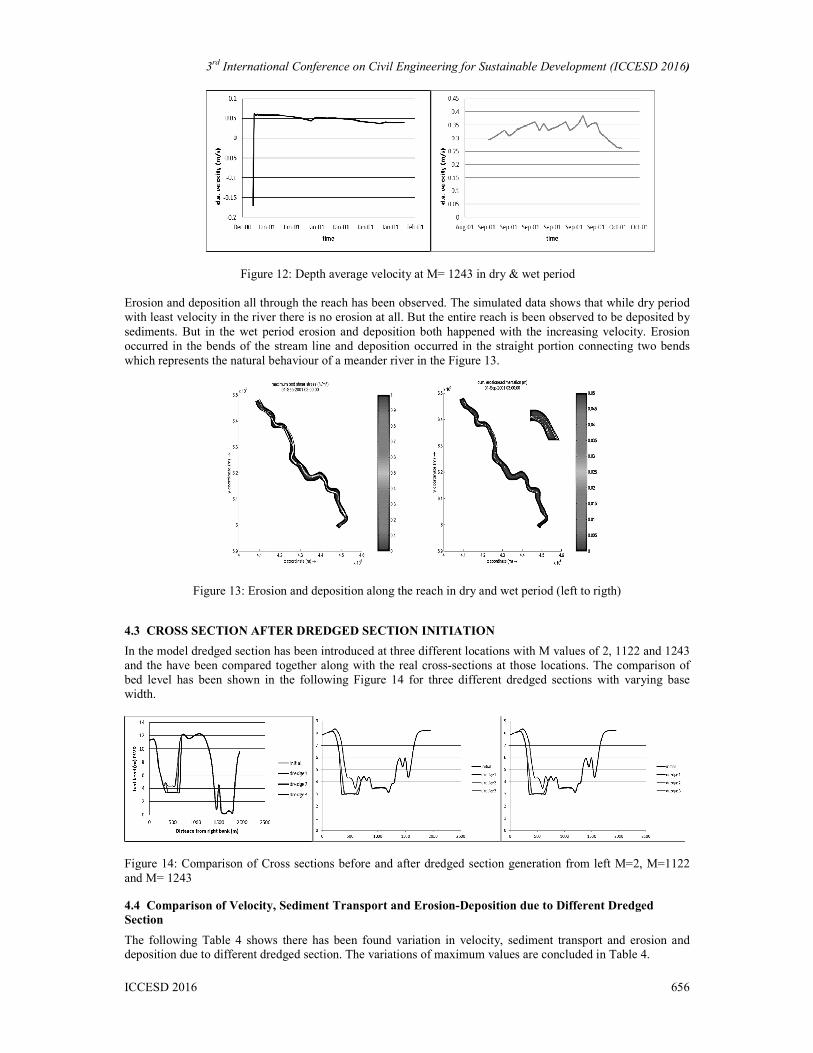
The following figure shows the variation in water level and depth averaged velocity at a representative point
M=1243 for both dry and wet period in Figure 11 & 12 respectively. The simulated data shows that both
velocity and water level increased in the wet period and remains least in the dry period.
Figure 11: Water level at M= 1243(kamarkhali) in dry and wet period (from left)
3rd International Conference on Civil Engineering for Sustainable Development (ICCESD 2016)
ICCESD 2016 656
Figure 12: Depth average velocity at M= 1243 in dry & wet period
Erosion and deposition all through the reach has been observed. The simulated data shows that while dry period
with least velocity in the river there is no erosion at all. But the entire reach is been observed to be deposited by
sediments. But in the wet period erosion and deposition both happened with the increasing velocity. Erosion
occurred in the bends of the stream line and deposition occurred in the straight portion connecting two bends
which represents the natural behaviour of a meander river in the Figure 13.
Figure 13: Erosion and deposition along the reach in dry and wet period (left to rigth)
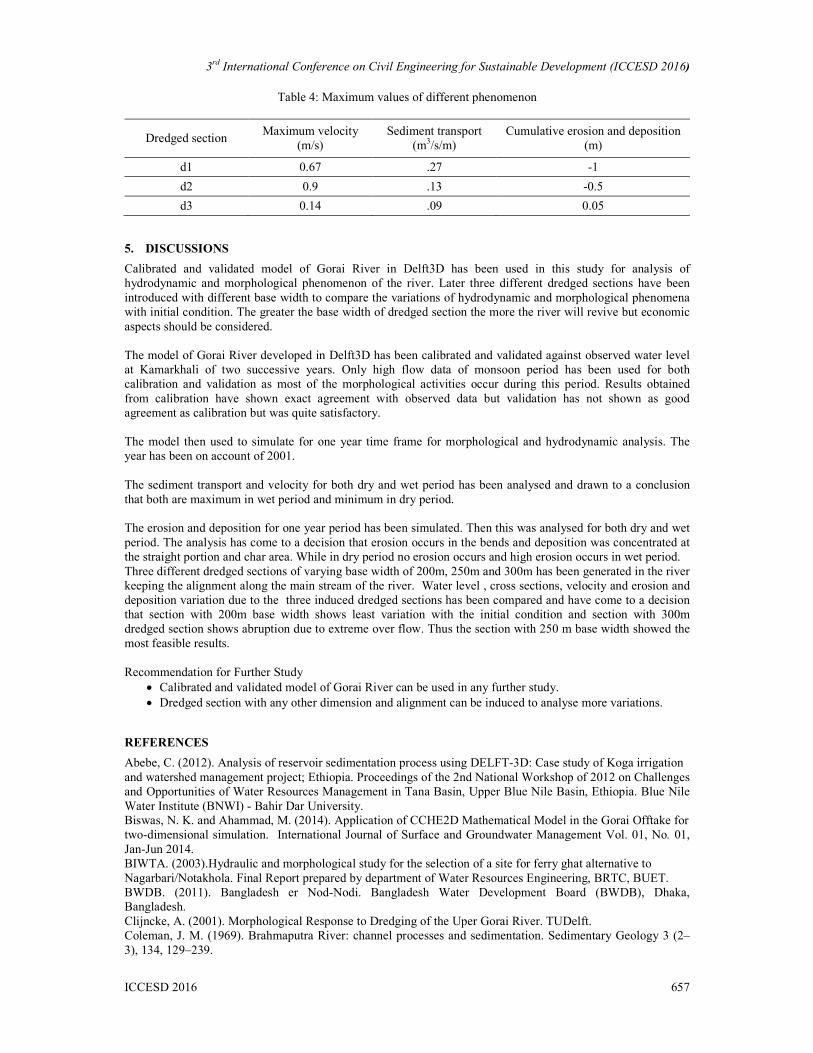
4.3 CROSS SECTION AFTER DREDGED SECTION INITIATION
In the model dredged section has been introduced at three different locations with M values of 2, 1122 and 1243
and the have been compared together along with the real cross-sections at those locations. The comparison of
bed level has been shown in the following Figure 14 for three different dredged sections with varying base
width.
Figure 14: Comparison of Cross sections before and after dredged section generation from left M=2, M=1122
and M= 1243
4.4 Comparison of Velocity, Sediment Transport and Erosion-Deposition due to Different Dredged
Section
The following Table 4 shows there has been found variation in velocity, sediment transport and erosion and
deposition due to different dredged section. The variations of maximum values are concluded in Table 4.
3rd International Conference on Civil Engineering for Sustainable Development (ICCESD 2016)
ICCESD 2016 657
Table 4: Maximum values of different phenomenon
Dredged section Maximum velocity
(m/s)
Sediment transport
(m3/s/m)
Cumulative erosion and deposition
(m)
d1 0.67 .27 -1
d2 0.9 .13 -0.5
d3 0.14 .09 0.05
5. DISCUSSIONS
Calibrated and validated model of Gorai River in Delft3D has been used in this study for analysis of
hydrodynamic and morphological phenomenon of the river. Later three different dredged sections have been
introduced with different base width to compare the variations of hydrodynamic and morphological phenomena
with initial condition. The greater the base width of dredged section the more the river will revive but economic
aspects should be considered.
The model of Gorai River developed in Delft3D has been calibrated and validated against observed water level
at Kamarkhali of two successive years. Only high flow data of monsoon period has been used for both
calibration and validation as most of the morphological activities occur during this period. Results obtained
from calibration have shown exact agreement with observed data but validation has not shown as good
agreement as calibration but was quite satisfactory.
The model then used to simulate for one year time frame for morphological and hydrodynamic analysis. The
year has been on account of 2001.
The sediment transport and velocity for both dry and wet period has been analysed and drawn to a conclusion
that both are maximum in wet period and minimum in dry period.
The erosion and deposition for one year period has been simulated. Then this was analysed for both dry and wet
period. The analysis has come to a decision that erosion occurs in the bends and deposition was concentrated at
the straight portion and char area. While in dry period no erosion occurs and high erosion occurs in wet period.
Three different dredged sections of varying base width of 200m, 250m and 300m has been generated in the river
keeping the alignment along the main stream of the river. Water level , cross sections, velocity and erosion and
deposition variation due to the three induced dredged sections has been compared and have come to a decision
that section with 200m base width shows least variation with the initial condition and section with 300m
dredged section shows abruption due to extreme over flow. Thus the section with 250 m base width showed the
most feasible results.
Recommendation for Further Study
• Calibrated and validated model of Gorai River can be used in any further study.
• Dredged section with any other dimension and alignment can be induced to analyse more variations.
REFERENCES
Abebe, C. (2012). Analysis of reservoir sedimentation process using DELFT-3D: Case study of Koga irrigation
and watershed management project; Ethiopia. Proceedings of the 2nd National Workshop of 2012 on Challenges
and Opportunities of Water Resources Management in Tana Basin, Upper Blue Nile Basin, Ethiopia. Blue Nile
Water Institute (BNWI) - Bahir Dar University.
Biswas, N. K. and Ahammad, M. (2014). Application of CCHE2D Mathematical Model in the Gorai Offtake for
two-dimensional simulation. International Journal of Surface and Groundwater Management Vol. 01, No. 01,
Jan-Jun 2014.
BIWTA. (2003).Hydraulic and morphological study for the selection of a site for ferry ghat alternative to
Nagarbari/Notakhola. Final Report prepared by department of Water Resources Engineering, BRTC, BUET.
BWDB. (2011). Bangladesh er Nod-Nodi. Bangladesh Water Development Board (BWDB), Dhaka,
Bangladesh.
Clijncke, A. (2001). Morphological Response to Dredging of the Uper Gorai River. TUDelft.
Coleman, J. M. (1969). Brahmaputra River: channel processes and sedimentation. Sedimentary Geology 3 (2–
3), 134, 129–239.
3rd International Conference on Civil Engineering for Sustainable Development (ICCESD 2016)
ICCESD 2016 658
DHI/SWMC. (1996). Mathematical model study (Phase I) for optimizing of dredging, Gorai River Restoration
Projec. Final Report, Phase I, Danish Hydraulic Institute in Association with SWMC.
Hore, S. K., Sarkar, M. H., Ferdous, Md. Ruknul., Ahsan, M. and Hasan, Md. Imran. (2013). Study of the off-
take dynamics for restoring the gorai river. 4th International Conference on Water & Flood Management
(ICWFM-2013).
Islam, S.N. and Gnauck, A. (2011). Water Shortage In The Gorai River Basin And Damage Of Mangrove
Wetland Ecosystems in Sundarbans, Bangladesh. 3rd International Conference on Water & Flood Management
(ICWFM-2011).
Islam, G.M. T. and Karim, Md. R. (2005). Predicting downstream hydraulic geometry of the Gorai river.
Journal of Civil Engineering, IEB, 33 (2) (2005) 55-63.
Islam, MD. M. (1996). A Study on the Morphology of the Gorai-Madhumati River. M.Sc. Thesis, BUET.
IWFM, BUET/ WARPO. ( 2005). Predicting downstream hydraulic geometry of the Gorai river. journal of civil
engineering (IEB), 33 (2) (2005) 55-63.
Lesser, G. R., Kester, J. V., Walstra, D.J.R. and Roelvink, J.A. Three-dimensional morphological modelling in
Delft3D-FLOW. Researchgate.
Luijendijk A.P. (2001). Validation, calibration and evaluation of Delft3D FLOW model with ferry
Measurements. M.Sc. Thesis, 4-1 to 4-5.
Paarlberg, A. J., Guerrero, M, Huthoff, F. and Re, M. (2015). Optimizing Dredge-and-Dump Activities for
River Navigability Using a Hydro-Morphodynamic Model. Water 2015, 7, 3943-3962; doi:10.3390/w7073943.
Palash, W. (2008). Morphological and hydrodynamic investigation on the confluence of the Padma-Meghna
River and its downstream part up to Chandpur, Bangladesh. MSc. Thesis, Katholieke Universiteit Leuven
Belgium.
Rahman, K. S. (1978). A study on the erosion of the Padma. M.Sc Engineering Thesis, Department of Water
Resources Engineering, BUET, Dhaka.
Stark, J. (2012). The influence of dredging activities on the morphological development of the Columbia River
Mouth. MSc. Thesis, Delft University of Technology, Department of Hydraulic Engineering, Section of Coastal
Engineering.
WL | Delft Hydraulics. (2000). Morphological and navigable effects of groyne lowering.
http://www.wldelft.nl/cons/area/rem/index.html.
WL | Delft Hydraulics. (2000). Two-dimensional hydraulic and morphological model of the Tenryuu River.
Japan, http://www.wldelft.nl/cons/area/rem/index.html.
WL | Delft Hydraulics. (2000). Meander migration and scour of the Roer river.
http://www.wldelft.nl/cons/area/rem/index.html.
WL | Delft Hydraulics. (2005). User Manual Delft3D-FLOW. The Netherlands.
WL | Delft Hydraulics. (2005). User Manual Delft3D-FUNCTIONAL SPECIFICATION. The Netherlands.
WL | Delft Hydraulics. (2005). User Manual Delft3D-QUICKIN. The Netherlands.
WL | Delft Hydraulics. (2005). User Manual Delft3D-RGFGRID. The Netherlands.