a study of the impact of the adoption of robotic process
TRANSCRIPT
A Study of the Impact of the Adoption of Robotic Process Automation (RPA) on Work Productivity in the Retail Banking Industry
By
KO, Eura
THESIS
Submitted to
KDI School of Public Policy and Management
In Partial Fulfillment of the Requirements
For the Degree of
MASTER OF PUBLIC POLICY
2020
A Study of the Impact of the Adoption of Robotic Process Automation (RPA) on Work Productivity in the Retail Banking Industry
By
KO, Eura
THESIS
Submitted to
KDI School of Public Policy and Management
In Partial Fulfillment of the Requirements
For the Degree of
MASTER OF PUBLIC POLICY
2020
Professor Lee, Ju-Ho

A Study of the Impact of the Adoption of Robotic Process Automation (RPA) on Work Productivity in the Retail Banking Industry
By
KO, Eura
THESIS
Submitted to
KDI School of Public Policy and Management
In Partial Fulfillment of the Requirements
For the Degree of
MASTER OF PUBLIC POLICY
Committee in charge:
Professor Lee, Ju-Ho, Supervisor
Professor Cho, Yoon Cheong
Approval as of December, 2020

ABSTRACT
Automation is not a new phenomenon. The automation of activities have proven to be pivotal
in productivity growth not only at the individual level, but at the business level and achieved
the economies of scale.
One of the emerging technologies that has had a significant impact in the financial services
industry is the adoption of Robotic Process Automation (RPA). IBS Intelligence (2019)’s
report acknowledged that the RPA technology deploys “software robots to automate repetitive,
rule-based, and high-volume tasks, has helped financial institutions in the phase of digital
transformation”.
This research attempts to study the impact of RPA adoption in the South Korean retail banking
industry in relation to work productivity through a quantitative analysis. Specifically, the study
takes the attributes from the IT innovation theories to observe the front office bank employees’
behavior with the adoption of a new technology like RPA is introduced.
Data sources included analysis of financial reports of the major banks in South Korea and
business journals. Then, data were collected from 62 front-office bank employees working at
the two of the top five retail banks in South Korea with experiences of reassigning tasks to RPA
bots.
Keywords: Robotic Process Automation, Banking Industry, Technology Adoption, Financial
Services

ACKNOWLEDGEMENTS
First and foremost, I would like to sincerely express my gratitude to my supervisors for their
kindness and patience. This research project would not have been possible without their
supports.
I would like to thank the survey respondents who were willing to participate at no cost and for
giving me the opportunity to conduct this research.
Lastly, I would like to thank my family for their constant encouragement and support that even
working mothers can pursue their dreams.

1
TABLE OF CONTENTS
ABSTRACT ............................................................................................................................... 2
ACKNOWLEDGEMENTS ....................................................................................................... 3
Chapter 2: Literature Review ..................................................................................................... 4
2.1 Robotic Process Automation (RPA) ............................................................................. 4
2.1.1 Robotic Process Automation (RPA) Definition ................................................ 4
2.1.2 Robotic Process Automation (RPA) Development Stages ................................ 5
2.1.3 Robotic Process Automation (RPA) Applications in the Financial Industry .... 7
2.2 Benefits of Robotic Process Automation (RPA) .......................................................... 7
2.3 IT-adopted Frameworks ............................................................................................... 9
Chapter 3: Research Model ...................................................................................................... 10
3.1 Research Model Design ............................................................................................. 10
3.2 Research Method, Data Analysis and Results............................................................ 12
Chapter 4: Discussion .............................................................................................................. 32
Chapter 5: Conclusion.............................................................................................................. 33
5.1 Future Research Implications ............................................................................ 33
5.2 Limitations ......................................................................................................... 34
References ................................................................................................................................ 34
Appendix .................................................................................................................................. 36

2
Chapter 1: Introduction
As noted in Bank of American Merrill Lynch (BAC)’s report released in 2015, "robots are
likely to be performing 45 percent of manufacturing tasks by 2025" (BAC, 2015). This is a
huge leap from a 10 percent figure in 2015. These computer softwares or “robots” will perform
activities, which can also be termed as virtual or digital workforce in today’s work environment
(Kumar & Balaramachandran, 2020). In particular, the adoption of Robotic Process
Automation (RPA) is becoming popular in the banking sector as the industry is going through
a phase of digital transformation. RPA is referred as “a tool that can be used to streamline and
automate a number of routine, manual banking processes or sub-processes” (Wilds, 2019).
The significance of RPA is that it is continually evolving like any other technology and is now
augmenting itself with the potential of Artificial Intelligence technology giving rise to what is
known as Cognitive Automation (IBS Intelligence, 2019).
The primary goal of exploring and building RPA capabilities is to handle large amounts of
repetitive and tedious tasks with limited resources so that banks can significantly reduce
processing time and errors, which consequently leads to increased accuracy and reliability
(Romão, Costa & Costa, 2019). However, the banking industry is only at the initial stage of
evolution of RPA, where automation tools are used to assist human operations in conducting
their jobs (IBS Intelligence, 2019). In the meantime, the effectiveness of Robotic Process
Automation (RPA) into daily operations of the Front Office in the banking industry should be
examined .

3
Research Questions (RQ)
1) Does the adoption of RPA in the retail banking industry increase work productivity?;
With this in mind, IT adoption literature has been taken into account to measure the
effectiveness of RPA. At the first stage of the RPA development stage, RPA tools are considered
easy to use and allows for quick process automation, often with little involvement from a
centralized IT department (Lacity & Willocks, 2018).
Even though RPA will serve as a very valuable tool in the banking industry, its actual effects
have not been investigated yet. As a consequence, research investigating the relationship
between adoption of RPA and productivity is warranted.
Thus, implementation of software bots which captures and interprets the customer
requirements and initiates operations across multiple digital systems replacing tasks operated
at the Front Office gives a rise to the following research question: 1) Does the adoption of RPA
in the banking industry increase productivity ?
In response to the research question, this thesis aims to build a tentative framework based on
the Technology Acceptance Model (TAM) and the Unified Theory of Acceptance and Use of
Technology (UTAUT). Then, the research model will be proposed and tested from the front-
office bank employees at local branches, who have experienced using the new RPA tools in
their daily routines.
The remainder of the paper is organized as follows. Chapter 2 examines a comprehensive
literature review that presents the theoretical foundation of this paper. Chapter 3 presents the
4
empirical specification, and the implementation of the model. Chapter 4 presents the results of
statistical and other computational analyses. Chapter 5 summarizes the findings and provides
a brief discussion concerning the shortcomings of the methods employed. Finally, an appendix
presenting the detailed algebraic works is presented at the end of the paper.
Chapter 2: Literature Review
The purpose of this chapter is to provide a comprehensive review of previous research on
Robotic Process Automation (RPA), followed by an introduction of the most commonly used
theoretical IT frameworks to serve as a basis in this study on assessing the effectiveness of the
adoption of RPA in relation to work productivity.
2.1 Robotic Process Automation (RPA)
2.1.1 Robotic Process Automation (RPA) Definition
The literature provides several definitions for Robotic Process Automation (RPA). The
inventors of RPA define RPA as "a technology that enables to automate the execution of
repetitive and manually intensive activities." (European Patent Office, 2012, p.1). The Institute
for Robotic Process Automation & Artificial Intelligence (2019) proposes another definition of
RPA: "RPA is the application of technology to configure software robots that capture and
interpret existing applications for processing transactions, manipulating data and
communicating with other software systems". Willcocks et al. (2015) considers Robotic process
automation (RPA) as “the use of software with artificial intelligence (AI) and machine learning
capabilities to handle high-volume, repeatable tasks that previously required humans to
perform.”
5
All these definitions emphasize the main purpose of RPA is to automate repetitive and
redundant tasks with the use of technology and “bots”. The automation of tasks reduces costs
and execution time, increases productivity and accuracy, mitigates or eliminates human errors
(Aguirre & Rodriguez, 2017). For example, Willcocks, Lacity & Craig (2015)'s study showed
that RPA implementation reduced Full-time equivalent (FTE) employee costs by 50 percent,
while back office failure customer calls from industries like telecommunications, utilities,
financial services and health care also decreased by 50 percent. With RPA, humans can
prioritize working on “higher value-adding tasks that require human creativity, ingenuity, and
decision making” (Romão, Costa & Costa, 2019).
Like any other industry, banks are constantly looking different ways to maximize profit and
stay competitive in which, RPA appears as a solution to further enhance the way that Banking,
Financial Services and Insurance (BFSI) are conducting their businesses (Hosadurga, 2017;
Kumar, 2020). There are manual tasks such as transaction entry processes and entering
customer information based on know-your-customer policies can be reassigned to RPA. In
summary, RPA is beneficial when it comes to financial processes containing structured data
input in which bank employees can be relieved from work that are repetitive and redundant
task such as reporting, data preparation, application processing, knowledge management,
transferring data and saving data (Duong, 2018).
2.1.2 Robotic Process Automation (RPA) Development Stages
KPMG International (2016)'s report suggests that RPA can be divided into three stages starting
from the basic process automation, enhanced process automation and cognitive automation
(Figure 1). The first stage involves basic process automation in order to automate repetitive

6
transactions or tasks through rule-based programming. In the second stage of "enhanced
process automation", the decision-making-based task is imitated, and machine learning is used
to recognize unstructured data patterns and limited decision-making automation. Then at the
final stage of RPA of the cognitive automation level, the RPA evolves as true artificial
intelligence, machine learning, and natural language processing (KPMG,2016).
Figure 1: Three classes of robotic process automation (KPMG International, 2016)
According to Forrester research performed in the second quarter of 2018, whilst many
organizations remain at the basic automation stage, some organizations, namely Ipsoft and
Arago have positioned themselves at the intelligent automation stage. Furthermore, some
organizations such as IBM Watson, Wolfram, Alpha and Google Deep Mind have managed to
reach the cognitive automation stage. For example, IBM's Watson utilize a combination of
artificial intelligence and cognitive technologies that mimic human though processes and

7
communication which in turn enabled understanding and interface with humans (KPMG
International, 2016).
2.1.3 Robotic Process Automation (RPA) Applications in the Financial Industry
The degree of automation varies depending on the nature of the industry. However, RPA is
utilized across various industries performing a variety of functions such as HR, IT, Finance,
Accounting and even legal services. In South Korea, RPA is mainly conducted in the financial
sector, and is operated with limited application to business processes (Lee, 2017).
In the case of the financial industry, credit card issuance, fraudulent claim detection, and loan
information update can be performed. In particular, RPA is used in the back office to perform
general business affairs, banking's anti-money laundering regulations compliance tasks, and so
on. In the front office, it is possible to serve customers as virtual financial assistants, customer-
responsive emotion recognition robots, and robot advisors (Yoon, 2017). Moreover, RPA is
being used in the insurance industry as well such as insurance payment claims. Earnest &
Young (2016) reported that banks and insurance companies are savings costs by 20 to 30
percent in the back offices and the scope of the job performance by RPA will expand even
greater in the next 4 to 5 years (Yoon, 2017).
2.2 Benefits of Robotic Process Automation (RPA)
RPA software reduces cycle time at a lower cost than other automation software, enabling time-
consuming, rule-based office work to be performed more efficiently. PwC (2017) predicted that
45% of work activities could be automated, thereby saving $2 trillion in global workforce costs.

8
RPA has advantages not only limited to cost savings and efficiency, but also for the benefits of
speed, agility and ease of deployment.
In the past, many businesses have adopted "Business Process Management" scheme as a part
of process transformation for the sake of cost savings and efficiencies (PwC, 2016). However,
the cost of implementation and the resistance towards changes are often inevitable. In
comparison, RPA offers tailored solutions that enable individual business units within a
business to rapidly digitize processes, deliver valuable and sustainable value in a short amount
of time, and reduce overall risks (PwC, 2016).
Thus, the benefits of RPA can be broken down as follows than can enhance the efficiency and
cost optimization. Firstly, reduction in Full-time employee (FTE) can be achieved. RPA allows
saving a considerable cost in human resources, which is approximately one-third of the cost
per labor. Moreover, a significant enhancement of productivity compared to that of FTE is
caused by not only a robot’s non-stop working in every hour of 365 days but also its ability of
continuously learning and improving their performance.
Secondly, it improves data analytics. RPA has the ability to manage data centrally and keep
track of any processing transactions in real time. In addition, any analysis is done based on
defined rules and structure that robots can re-train itself. Therefore, a robot can return accurate
analytics value as soon as it receives any newly updated data. Thanks to that, a data analytics
outcome has been increased in quality, quantity and speed.
Last but not least, the benefits derived from RPA will continually develop towards a merge
with Artificial Intelligence which will inevitably change the working dynamics of the financial

9
services industry. The processes in the banking sector, “right from customer experience, fraud
mitigation, digital transformation initiatives, loan processing, wealth advisory would be
impacted by the change” (IBS intelligence, 2019, p. 19).
2.3 IT-adopted Frameworks
Over the last decades, the adoption of IT innovations developed a diverse body of literature.
When a new technology is introduced and whether end-users will actively accept the change,
the most widely used model for approaching such issue is the Technology Accepted Model
(TAM) suggested by Davis in 1989.
TAM was initially developed to understand and explain individual behavior of technology
adoption and usage (Davis, 1989). The model suggests the attributes of perceived usefulness
and perceived ease of use. 'Perceived ease of use' is defined as "the extent to which the
individual believe that using a specific system will be effort free" and 'Perceived usefulness' is
defined as "the extent to which the individual believes that using a specific system will increase
his or her productivity" (Davis, 1989). These two attributes have been widely tested and
extended models have been developed further. For example, Venkatesh et al., (2003) suggested
a multitude of theoretical perspectives and developed the Unified Theory of Acceptance and
Use of Technology (UTAUT). Venkatesh et al. (2003) synthesized these attributes into (1) effort
expectancy and (2) performance expectancy. 'Effort expectancy' is defined as "the degree of
ease associated with the use of the system" whereas 'performance expectancy' is defined as "the
degree to which an individual believes that using the system will help him or her to attain gains
in job performance" (Venkatesh et al, 2003, p.447-450).

10
To further investigate the end-user behavior of RPA in an organizational context, this study will
construct a research model based on the attributes of the Technology Acceptance (TAM) Model
and the and the Unified Theory of Acceptance and Use of Technology (UTAUT) Model.
Chapter 3: Research Model
3.1 Research Model Design
Currently, the tasks performed by RPA in the South Korean retail banking industry by
customer-facing front office bank employees at retail banking branches are in the first stage of
RPA Development Stage. The basic process automation is triggered by the execution of a “job
order request” by the front office bank employee. In other words, instead of performing a daily
routine task manually, the front office bank employee chooses to reassign the task to RPA bots.

11
Thus, this study utilize secondary resources from financial reports, business journals and
documents to propose a model (Figure 2) to analyze the effects of the adoption of RPA in the
retail banking industry on work productivity. The variables have been identified as: 1) RPA
Reliability; 2) RPA Perceived Usefulness; 3) RPA Perceived Ease-of-Use; 4) RPA Effort
Expectancy and 5) RPA Performance Expectancy.
The research model was tested using a survey questionnaire. The survey instrument was
constructed by identifying relevant measurements from a comprehensive literature review and
from discussions with RPA experts in retail banks. The questionnaire consisted of five parts;
first part was on demographics and the latter four parts related to the four independent variables.
There were a total of 26 questions and a 10 point Likert scale was used to measure the survey
items. An explanation on the subject and the purposes of the research were mentioned at the
start of the survey for the better awareness of this study. In addition, the voluntary nature of the
survey and the assurance of privacy of data were also stated. The questionnaires were circulated
Figure 2: Research Model
RPA Reliability RPA Perceived Usefulness RPA Perceived Ease-of-Use RPA Effort Expectancy RPA Performance Expectancy
H1: Age
H2: Number of Working Years
H3: RPA Usage Ratio
H4: Job Position
H4a: Commercial banking assistant manager
H4b: Corporate banking assistant manager
H4c: VIP lounge assistant manager
H4d: Commercial banking manager
H4e: Corporate banking manager
H4f: VIP lounge manager

12
to employees of the two biggest retail banks in South Korea. This study reached out to a target
sample size of 80+ by providing an offline survey. Due to segregation of internal and external
network of firewall restrictions, online survey option was not possible. Out of a total of 80+
targeted bank employees, 62 responses were received.
3.2 Research Method, Data Analysis and Results
3.2.1 Demographics (Total Obs: 62)
Variable: q_1_1 Freq. Percent
1 (Commercial banking assistant
manager) 28 45.16
2 (Corporate banking assistant
manager) 18 29.03
3 (VIP lounge assistant manager) 1 1.61
4 (Commercial banking manager) 10 16.13
5 (Corporate banking manager) 2 3.23
6 (VIP lounge manager) 3 4.84
Total 62 100.00
Table 1: Job Position
This table summarizes the results of frequency analysis of the participants’ current job position.
This study sample consisted of 62 people, and 'Commercial banking assistant manager’
accounted for 45.16% of the total sample, followed by 'Corporate banking assistant manager'
(29.03%), ‘Commercial banking manager' (16.13%), VIP lounge manager (4.84%), ‘Corporate
banking manager’ (3.23%) and ‘VIP lounge assistant manager’ (1.61%).

13
Variable: q_1_2 Freq. Percent
1 (Teller) 26 15.76
2 (Personal Banking Representative/Financial Adviser) 38 23.03
3 (Loan Officer) 37 22.42
4 (FX Transactions) 30 18.18
5 (Corporate Loan Officer) 12 7.27
6 (General Affairs) 6 3.64
7 (Internal Control Officer) 6 3.64
8 (Performance Manager, KPI) 5 3.03
Total 165 100.00
Table 2: Major Tasks
This table summarizes the results of frequency analysis of major tasks performed by each
participant in which multiple selection was possible. Out of a total of 62 participants, 23.03%
answered “Personal Banking Representative/Financial Adviser” followed by 22.42% of Loan
Officers and 18.18% of FX Transactions. These results can be interpreted in relation to the
results of q_1_1 Job positions. In other words, since the ratio of respondents with assistant
managerial positions (Commercial banking, Corporate banking and VIP lounge assistant
managers) is as high as 75.80% among the respondents, outcome of the major tasks performed
by the respondents is expected. For this variable (q_1_2), participants could make multiple
selections. Of these, it was revealed that a total of 4 people were involved in being in charge of
5 major tasks in which the most common task performed were "Teller", "Personal banking
representative", "Loan Officer" and "FX Transactions". Also, it was confirmed that 74.19% of
the total sample was engaged in more than one job.

14
Variable: q_1_3 Freq. Percent Variable: q_1_4 Freq. Percent
1 (Aged 20-30yrs) 9 14.52 2 (Working Years 1-5) 11 17.74
2 (Aged 31-40yrs) 19 30.65 3 (Working Years 6-10) 8 12.90
3 (Aged 41-49yrs) 28 45.16 4 (Working Years 11-20) 27 43.55
4 (Aged 50yrs~) 6 9.68 5 (Working Years 20~) 16 25.81
Total 62 100.00 Total 62 100.00
Table 3 & 4 : Age & Number of Working Years
This table summarizes the results of frequency analysis of the ages of the sample (q_1_3) and
number of working years in terms of work experiences (q_1_4). As a result of the analysis of
the ages of the respondents, 28 persons (45.16%) were those aged 40 years or older and younger
than 50 years old, and 19 persons (30.65%) were aged 30 years or older and younger than 40
years old, which was 75.81% of the total sample size. In addition, as a result of the analysis of
the number of working years of the sample, 27 (43.55%) people (43.55%) for those with more
than 10 years and less than 20 years, 16 (23.81%) those with more than 20 years, and 11
(17.74%) those with more than 1 year and less than 5 years.
Variable: q_1_5_usage ratio Freq. Percent
0.1≤usage ratio< 0.2 8 12.90
0.2≤ usage ratio <0.3 6 9.68
0.3≤ usage ratio <0.4 28 45.16
0.4≤ usage ratio <0.5 4 6.45
usage ratio≥ 0.5 16 25.81
Total 62 100.00
15
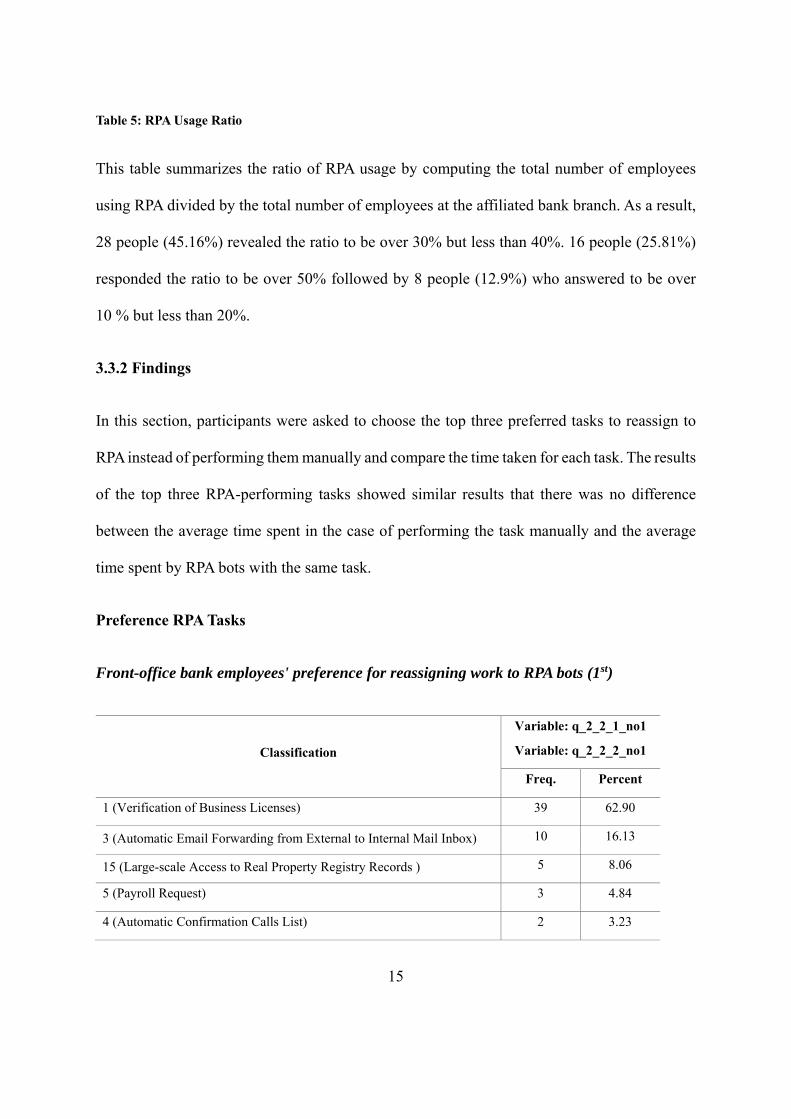
Table 5: RPA Usage Ratio
This table summarizes the ratio of RPA usage by computing the total number of employees
using RPA divided by the total number of employees at the affiliated bank branch. As a result,
28 people (45.16%) revealed the ratio to be over 30% but less than 40%. 16 people (25.81%)
responded the ratio to be over 50% followed by 8 people (12.9%) who answered to be over
10 % but less than 20%.
3.3.2 Findings
In this section, participants were asked to choose the top three preferred tasks to reassign to
RPA instead of performing them manually and compare the time taken for each task. The results
of the top three RPA-performing tasks showed similar results that there was no difference
between the average time spent in the case of performing the task manually and the average
time spent by RPA bots with the same task.
Preference RPA Tasks
Front-office bank employees' preference for reassigning work to RPA bots (1st)
Classification
Variable: q_2_2_1_no1
Variable: q_2_2_2_no1
Freq. Percent
1 (Verification of Business Licenses) 39 62.90
3 (Automatic Email Forwarding from External to Internal Mail Inbox) 10 16.13
15 (Large-scale Access to Real Property Registry Records ) 5 8.06
5 (Payroll Request) 3 4.84
4 (Automatic Confirmation Calls List) 2 3.23

16
7 (Defined-Contribution Retirement Plan Deposit Request) 2 3.23
17 (Alerts before Roll-over or Extension of Corporate Debts) 1 1.61
Total 62 100.00
The most preferred task reassigned to RPA bots was "Verification of Business Licenses" which
accounted for 62.90% followed by "Automatic Email Forwarding from External to Internal
Mail Inbox" recorded at 16.13%. A t-test for each group of work completion time when
performing the task manually and reassigning to RPA bots showed that the p-value was 0.327,
and the null hypothesis that there is no difference between the average time spent in the case
of performing the task manually and the average time spent in the case of reassigning the task
to RPA bots could not be rejected. That is, it was verified that there is no difference in the
average time of performance.
Front-office bank employees' preference for reassigning work to RPA bots (2nd)
time1
Variable: q_2_2_1_time1 |t-value| p-value
Mean Std. Dev. Median
302.627 54.810 180
0.982 0.327 Variable: q_2_2_2_time1
Mean Std. Dev. Median
218.066 518.321 60
Classification
Variable: q_2_2_1_no2
Variable: q_2_2_2_no2
Freq. Percent
1 (Verification of Business Licenses) 11 20.00
4 (Automatic Confirmation Calls List) 9 16.36
10 (Verification of Lease Deposit Recommendations provided by the 7 12.73

17
time2
Variable: q_2_2_1_time2 |t-value| p-value
Mean Std. Dev. Median
316.153 231.212 300
1.235 0.219 Variable: q_2_2_2_time2
Mean Std. Dev. Median
242.961 359.327 60
The second most preferred task reassigned to RPA bots was "Verification of Business Licenses"
which accounted for 20.00% followed by "Automatic Confirmation Calls List" recorded at
16.46%. A t-test for each group of work completion time when performing the task manually
and reassigning to RPA bots showed that the p-value was 0.219, and the null hypothesis that
there is no difference between the average time spent in the case of performing the task
manually and the average time spent in the case of reassigning the task to RPA bots could not
be rejected. That is, it was verified that there is no difference in the average time of performance.
Front-office bank employees' preference for reassigning work to RPA bots (3rd)
Seoul Metropolitan Government)
2 (Customer Due Diligence / Enhanced Due Diligence (CDD/EDD)
Procedures) 5 9.09
3 (Automatic Email Forwarding from External to Internal Mail Inbox) 5 9.09
5 (Payroll Request) 5 9.09
6 (Issuance of Payroll Request Receipts) 5 9.09
Others 8 14.55
Total 55 100.00

18
time3
Variable: q_2_2_1_time3 |t-value| p-value
Mean Std. Dev. Median
335 296.669 300
0.696 0.488 Variable: Variable: q_2_2_2_time3
Mean Std. Dev. Median
397.187 408.721 180
The third most preferred task reassigned to RPA bots showed three equally weighted responses
as follows; “Payroll Request”, “Defined-Contribution Retirement Plan Deposit Request” and
“Verification of Lease Deposit Recommendations provided by the Seoul Metropolitan
Government” accounted for 15.63%. A t-test for each group of work completion time when
performing the task manually and reassigning to RPA bots showed that the p-value was 0.488,
and the null hypothesis that there is no difference between the average time spent in the case
of performing the task manually and the average time spent in the case of reassigning the task
to RPA bots could not be rejected. That is, it was verified that there is no difference in the
Classification
Variable: q_2_2_1_no3
Variable: q_2_2_2_no3
Freq. Percent
5 (Payroll Request) 5 15.63
7 (Defined-Contribution Retirement Plan Deposit Request) 5 15.63
10 (Verification of Lease Deposit Recommendations provided by the
Seoul Metropolitan Government) 5 15.63
15 (Large-scale Access to Real Property Registry Records) 4 12.50
4 (Automatic Confirmation Calls List) 3 9.38
9 (Issuance of Vehicle Registration Documents (Verifications for Car
Loans) 3 9.38
Others 7 21.88
Total 32 100.00

19
average time of performance.
3.3.3 Data Reliability and Consistency
This table summarizes the results of ANOVA analysis and Cronbach’s alpha to measure
reliability or consistency of survey responses. The survey consisted of 4 questions related to
“RPA reliability” tasks reassigned to RPA, 4 questions on its “perceived usefulness”, 4
questions on its “perceived ease-of-use”, 3 questions on “effort expectancy”, and 3 questions
on “performance expectancy”. To measure whether the mean within each group was
significantly different from each other, an ANOVA analysis was conducted. As a result of the
analysis, it was confirmed that the p-value was within the rage of 0.60 to 0.96, which failed to
reject the null hypothesis that the average value of each item was not very different. In other
words, the result was that the average of each item was not different indicating that there is
consistency. Furthermore, the results from Cronbach’s alpha showed that the alpha coefficient
was within the range of 0.943 and 0.973. This confirms that there is a strong consistency
between the questions and the responses from the survey conducted.
The results of Pearson’s correlation analysis of the RPA-related query parameter also showed
similar results and confirmed that there is a correlation of all the items indicating that the
responses from the query items are consistent (Appendix).

20
Variable define Obs Mean Std.
Dev Min p50 Max F-value P-value
Cronbach’s
alpha
q_3_1_1
RPA
Reliability
62 7.935 1.726 5 8.5 10
0.42 0.74 0.943 q_3_1_2 62 7.968 1.828 4 8.5 10
q_3_1_3 62 8.113 2.001 4 9 10
q_3_1_4 62 7.742 1.890 4 8 10
q_3_1_5 62 492.742 1935.226 10 30 9000
q_3_2_1
RPA
Perceived
Usefulness
62 7.935 1.678 4 8 10
0.10 0.96 0.956 q_3_2_2 62 7.871 1.769 4 8 10
q_3_2_3 62 7.823 1.645 3 8 10
q_3_2_4 62 7.774 1.920 1 8 10
q_3_3_1
RPA
Perceived
Ease-of-Use
62 8.113 1.830 3 9 10
0.33 0.80 0.957 q_3_3_2 62 7.823 1.824 3 8.5 10
q_3_3_3 62 8.032 1.727 3 9 10
q_3_3_4 62 8.081 1.730 3 9 10
q_3_4_1
RPA Effort
Expectancy
62 7.806 1.687 3 8 10
0.51 0.60 0.943 q_3_4_2 62 7.710 1.562 5 8 10
q_3_4_3 62 8 1.640 5 8 10
q_3_5_1 RPA
Performance
Expectancy
61 7.951 1.811 3 9 10
0.17 0.85 0.973 q_3_5_2 61 8 1.761 3 9 10
q_3_5_3 61 7.820 1.775 3 8 10
21
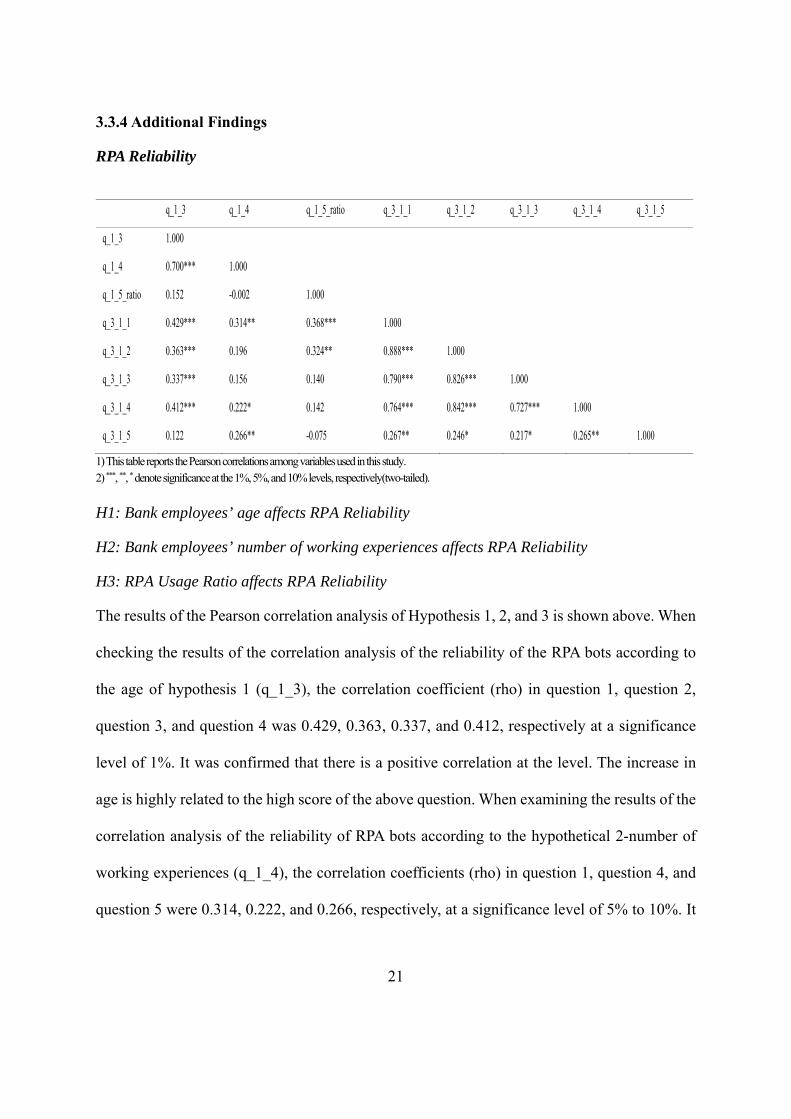
3.3.4 Additional Findings
RPA Reliability
q_1_3 q_1_4 q_1_5_ratio q_3_1_1 q_3_1_2 q_3_1_3 q_3_1_4 q_3_1_5
q_1_3 1.000
q_1_4 0.700*** 1.000
q_1_5_ratio 0.152 -0.002 1.000
q_3_1_1 0.429*** 0.314** 0.368*** 1.000
q_3_1_2 0.363*** 0.196 0.324** 0.888*** 1.000
q_3_1_3 0.337*** 0.156 0.140 0.790*** 0.826*** 1.000
q_3_1_4 0.412*** 0.222* 0.142 0.764*** 0.842*** 0.727*** 1.000
q_3_1_5 0.122 0.266** -0.075 0.267** 0.246* 0.217* 0.265** 1.000
1) This table reports the Pearson correlations among variables used in this study. 2) ***, **, * denote significance at the 1%, 5%, and 10% levels, respectively(two-tailed).
H1: Bank employees’ age affects RPA Reliability
H2: Bank employees’ number of working experiences affects RPA Reliability
H3: RPA Usage Ratio affects RPA Reliability
The results of the Pearson correlation analysis of Hypothesis 1, 2, and 3 is shown above. When
checking the results of the correlation analysis of the reliability of the RPA bots according to
the age of hypothesis 1 (q_1_3), the correlation coefficient (rho) in question 1, question 2,
question 3, and question 4 was 0.429, 0.363, 0.337, and 0.412, respectively at a significance
level of 1%. It was confirmed that there is a positive correlation at the level. The increase in
age is highly related to the high score of the above question. When examining the results of the
correlation analysis of the reliability of RPA bots according to the hypothetical 2-number of
working experiences (q_1_4), the correlation coefficients (rho) in question 1, question 4, and
question 5 were 0.314, 0.222, and 0.266, respectively, at a significance level of 5% to 10%. It

22
was confirmed that there is a positive relationship. Thus, the increase in work experience is
highly related to the high score in the above questions. If we check the results of the correlation
analysis of the reliability of RPA bots according to the hypothesis 3 RPA usage ratio
(q_1_5_ratio), the correlation coefficients (rho) in question 1 and question 2 were 0.368 and
0.324, respectively, indicating positive relevance at the 1% to 5% significance level. Hence,
the increase in the proportion of RPA usage is highly related to the high score to the reliability
of RPA.
dum_1 dum_2 dum_3 dum_4 dum_5 dum_6 q_3_1_1 q_3_1_2 q_3_1_3 q_3_1_4 q_3_1_5
dum_1 1.000
dum_2 -0.580*** 1.000
dum_3 -0.116 -0.082 1.000
dum_4 -0.398*** -0.280** -0.056 1.000
dum_5 -0.166 -0.117 -0.023 -0.080 1.000
dum_6 -0.205 -0.144 -0.029 -0.099 -0.041 1.000
q_3_1_1 -0.004 -0.349*** 0.080 0.426*** -0.260** 0.184 1.000
q_3_1_2 -0.091 -0.224* 0.073 0.395*** -0.248* 0.170 0.888*** 1.000
q_3_1_3 -0.101 -0.323** 0.057 0.417*** -0.010 0.177 0.790*** 0.826*** 1.000
q_3_1_4 -0.065 -0.177 0.086 0.294** -0.218* 0.151 0.764*** 0.842*** 0.727*** 1.000
q_3_1_5 -0.213* -0.135 -0.032 0.508*** -0.031 -0.046 0.267** 0.246* 0.217* 0.265** 1.000
1) This table reports the Pearson correlations among variables used in this study.
2) ***, **, * denote significance at the 1%, 5%, and 10% levels, respectively(two-tailed).
H4: Bank employee’s job position affects RPA Reliability
H4a:Bank employee’s job position as “Commercial banking assistant manager” affects RPA Reliability
H4b: Bank employee’s job position as “Corporate banking assistant manager” affects RPA Reliability
H4c: Bank employee’s job position as “VIP lounge assistant manager” affects RPA

23
Reliability
H4d: Bank employee’s job position as “Commercial banking manager” affects RPA Reliability
H4e: Bank employee’s job position as “Corporate banking manager” affects RPA Reliability
H4f: Bank employee’s job position as “VIP lounge manager” affects RPA Reliability
This table summarizes the results of the Pearson correlation analysis of Hypothesis 4. Here, the
operational definition of dum1-6 is as follows. dum_1 is a member of the commercial banking
assistant manager, dum_2 is a member of the corporate banking assistant manager, dum_3 is a
VIP lounge team member, dum_4 is the commercial banking manager, dum_5 is the corporate
banking manager, and dum_6 is the VIP lounge manager. As a result of the analysis, dum_4
(individual general counter team leader) showed a strong positive correlation with all inquiries
regarding the reliability of RPA bots. In other words, it can be said that in the case of the
commercial banking manager, a high score was given to the five queries.
RPA Perceived Usefulness
q_1_3 q_1_4 q_1_5_ratio q_3_2_1 q_3_2_2 q_3_2_3 q_3_2_4
q_1_3 1.000
q_1_4 0.700*** 1.000
q_1_5_ratio 0.152 -0.002 1.000
q_3_2_1 0.283** 0.209 0.284** 1.000
q_3_2_2 0.311** 0.208 0.321** 0.908*** 1.000
q_3_2_3 0.144 0.053 0.418*** 0.780*** 0.758*** 1.000
q_3_2_4 0.168 0.081 0.271** 0.881*** 0.860*** 0.885*** 1.000
1) This table reports the Pearson correlations among variables used in this study. 2) ***, **, * denote significance at the 1%, 5%, and 10% levels, respectively(two-tailed).
H1: Bank employees’ age affects RPA Perceived Usefulness

24
H2: Bank employees’ number of working experiences affects RPA Perceived Usefulness
H3: RPA Usage Ratio affects RPA Perceived Usefulness
The results of the Pearson correlation analysis of Hypothesis 1, 2, and 3 is shown above. When
checking the results of the correlation analysis of the perceived usefulness of the RPA bots
according to the age of hypothesis 1 (q_1_3), the correlation coefficient (rho) in question 1 and
question 2 were 0.283 and 0.311, respectively at a significance level of 5%. It was confirmed
that there is a positive correlation at the level. The increase in age is highly related to the high
score of the above question. The correlation analysis of the perceived usefulness of the RPA
bots according to the hypothetical 2-number of working experiences (q_1_4) showed that there
is a weak correlation. However, the hypothesis 3 RPA usage ratio (q_1_5_ratio), revealed that
the correlation coefficient (rho) in question 1, question 2, question 3, and question 4 was 0.284,
0.321, 0.418, and 0.17`, respectively at a significance level of 1% to 5%. It was confirmed that
there is a positive correlation at the level. Hence, the increase in the proportion of RPA usage
is highly related to the perceived usefulness of RPA.
1) This table reports the Pearson correlations among variables used in this study. 2) ***, **, * denote significance at the 1%, 5%, and 10% levels, respectively(two-tailed).
s dum_1 dum_2 dum_3 dum_4 dum_5 dum_6 q_3_2_1 q_3_2_2 q_3_2_3 q_3_2_4
dum_1 1.000
dum_2 -0.580*** 1.000
dum_3 -0.116 -0.082 1.000
dum_4 -0.398*** -0.280** -0.056 1.000
dum_5 -0.166 -0.117 -0.023 -0.080 1.000
dum_6 -0.205 -0.144 -0.029 -0.099 -0.041 1.000
q_3_2_1 -0.082 -0.018 0.082 0.175 -0.267** 0.099 1.000
q_3_2_2 -0.063 -0.054 0.082 0.182 -0.247* 0.102 0.908*** 1.000
q_3_2_3 0.138 0.004 0.092 -0.140 -0.372*** 0.163 0.780*** 0.758*** 1.000
q_3_2_4 -0.063 0.095 0.082 0.029 -0.314** 0.106 0.881*** 0.860*** 0.885*** 1.000

25
H4: Bank employee’s job position affects RPA Perceived Usefulness
H4a:Bank employee’s job position as “Commercial banking assistant manager” affects RPA Perceived Usefulness
H4b: Bank employee’s job position as “Corporate banking assistant manager” affects RPA Perceived Usefulness
H4c: Bank employee’s job position as “VIP lounge assistant manager” affects RPA Perceived Usefulness
H4d: Bank employee’s job position as “Commercial banking manager” affects RPA Perceived Usefulness
H4e: Bank employee’s job position as “Corporate banking manager” affects RPA Perceived Usefulness
H4f: Bank employee’s job position as “VIP lounge manager” affects RPA Perceived Usefulness
This table summarizes the results of the Pearson correlation analysis of Hypothesis 4.
As a result of the analysis, dum_5 (corporate banking manager) showed a strong negative
correlation with all inquiries regarding the perceived usefulness of RPA bots. In other words,
it can be said that in the case of the corporate banking manager, a low score was given to the
four queries.

26
RPA Perceived Ease-of-Use
q_1_3 q_1_4 q_1_5_ratio q_3_2_1 q_3_2_2 q_3_2_3 q_3_2_4
q_1_3 1.000
q_1_4 0.700*** 1.000
q_1_5_ratio 0.152 -0.002 1.000
q_3_2_1 0.283** 0.209 0.284** 1.000
q_3_2_2 0.311** 0.208 0.321** 0.908*** 1.000
q_3_2_3 0.144 0.053 0.418*** 0.780*** 0.758*** 1.000
q_3_2_4 0.168 0.081 0.271** 0.881*** 0.860*** 0.885*** 1.000
1) This table reports the Pearson correlations among variables used in this study. 2) ***, **, * denote significance at the 1%, 5%, and 10% levels, respectively(two-tailed).
H1: Bank employees’ number of working experience affects RPA Perceived Ease-of-Use
H2: Bank employees’ number of working experiences affects RPA Perceived Ease-of-Use
H3: RPA Usage Ratio affects RPA Perceived Ease-of-Use
The results of the Pearson correlation analysis of Hypothesis 1, 2, and 3 is shown above. When
checking the results of the correlation analysis of the perceived ease-of-use of RPA bots
according to the age of hypothesis 1 (q_1_3) and to the hypothetical 2-number of working
experiences (q_1_4), both showed a weak correlation. Thus, the age and the number of working
experiences of a bank employee has relatively low impact on how bank employees perceive
the ease-of-use of RPA bots. Moreover, If we check the results of the correlation analysis of
the perceived ease-of-use of RPA bots according to the hypothesis 3 RPA usage ratio
(q_1_5_ratio), the correlation coefficients (rho) in question 1 and question 2 were 0.344and
0.358, respectively, indicating positive relevance at the 1% significance level. Hence, the
increase in the proportion of RPA usage is highly related to the high score to the perceived
ease-of-use of RPA.
27
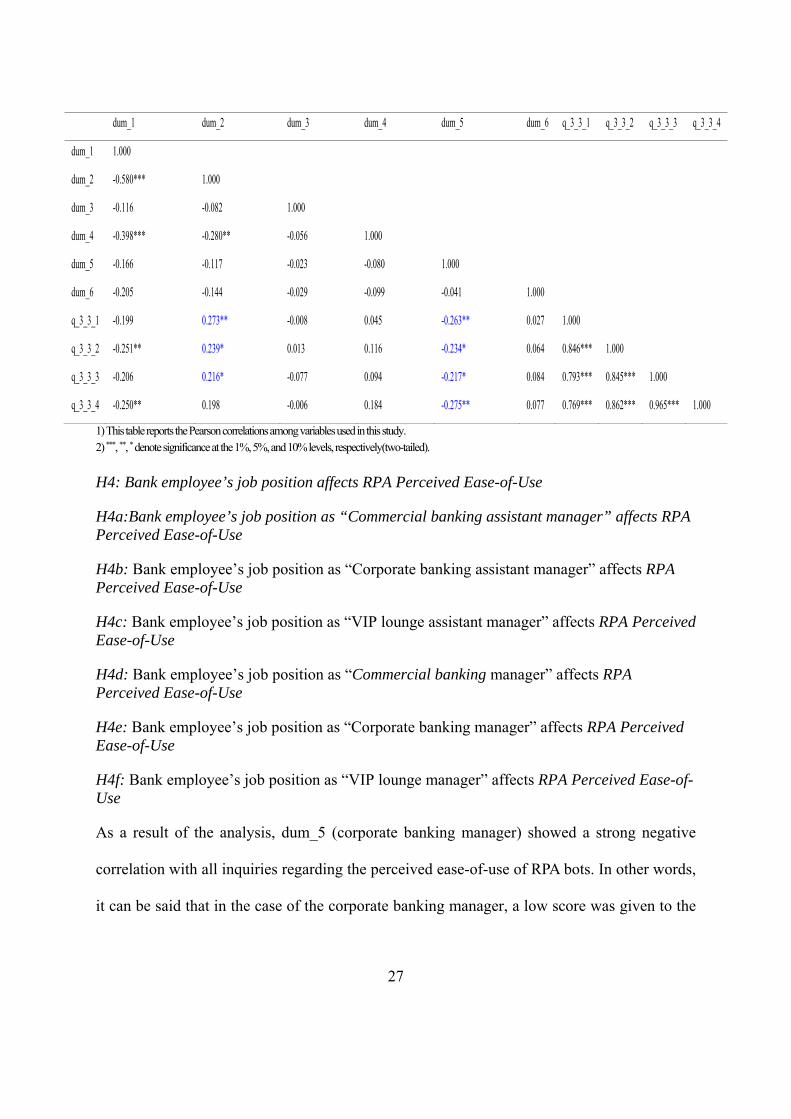
dum_1 dum_2 dum_3 dum_4 dum_5 dum_6 q_3_3_1 q_3_3_2 q_3_3_3 q_3_3_4
dum_1 1.000
dum_2 -0.580*** 1.000
dum_3 -0.116 -0.082 1.000
dum_4 -0.398*** -0.280** -0.056 1.000
dum_5 -0.166 -0.117 -0.023 -0.080 1.000
dum_6 -0.205 -0.144 -0.029 -0.099 -0.041 1.000
q_3_3_1 -0.199 0.273** -0.008 0.045 -0.263** 0.027 1.000
q_3_3_2 -0.251** 0.239* 0.013 0.116 -0.234* 0.064 0.846*** 1.000
q_3_3_3 -0.206 0.216* -0.077 0.094 -0.217* 0.084 0.793*** 0.845*** 1.000
q_3_3_4 -0.250** 0.198 -0.006 0.184 -0.275** 0.077 0.769*** 0.862*** 0.965*** 1.000
1) This table reports the Pearson correlations among variables used in this study. 2) ***, **, * denote significance at the 1%, 5%, and 10% levels, respectively(two-tailed).
H4: Bank employee’s job position affects RPA Perceived Ease-of-Use
H4a:Bank employee’s job position as “Commercial banking assistant manager” affects RPA Perceived Ease-of-Use
H4b: Bank employee’s job position as “Corporate banking assistant manager” affects RPA Perceived Ease-of-Use
H4c: Bank employee’s job position as “VIP lounge assistant manager” affects RPA Perceived Ease-of-Use
H4d: Bank employee’s job position as “Commercial banking manager” affects RPA Perceived Ease-of-Use
H4e: Bank employee’s job position as “Corporate banking manager” affects RPA Perceived Ease-of-Use
H4f: Bank employee’s job position as “VIP lounge manager” affects RPA Perceived Ease-of-Use
As a result of the analysis, dum_5 (corporate banking manager) showed a strong negative
correlation with all inquiries regarding the perceived ease-of-use of RPA bots. In other words,
it can be said that in the case of the corporate banking manager, a low score was given to the

28
four queries.
RPA Effort Expectancy
q_1_3 q_1_4 q_1_5_ratio q_3_4_1 q_3_4_2 q_3_4_3
q_1_3 1.000
q_1_4 0.700*** 1.000
q_1_5_ratio 0.152 -0.002 1.000
q_3_4_1 -0.056 -0.129 0.203 1.000
q_3_4_2 -0.061 -0.286** 0.289** 0.837*** 1.000
q_3_4_3 0.104 -0.078 0.232* 0.818*** 0.883*** 1.000
1) This table reports the Pearson correlations among variables used in this study. 2) ***, **, * denote significance at the 1%, 5%, and 10% levels, respectively(two-tailed).
H1: Bank employees’ number of working experience affects RPA Effort Expectancy
H2: Bank employees’ number of working experiences affects RPA Effort Expectancy
H3: RPA Usage Ratio affects RPA Effort Expectancy
The results of the Pearson correlation analysis of Hypothesis 1, 2, and 3 is shown above. When
checking the results of the correlation analysis of the effort expectancy of RPA bots according
to the age of hypothesis 1 (q_1_3), showed a weak correlation. Thus, the age of a bank
employee has relatively low impact on the effort expectancy of RPA bots. When examining the
results of the correlation analysis of the reliability of RPA bots according to the hypothetical 2-
number of working experiences (q_1_4), the correlation coefficients (rho) in question 2
resulted -0.286 at a significance level of 5%. It was confirmed that there is a negative
relationship. Thus, the increase in work experience is highly related to the low score in the
above questions. If we check the results of the correlation analysis of the effort expectancy of
RPA bots according to the hypothesis 3 RPA usage ratio (q_1_5_ratio), the correlation

29
coefficients (rho) in question 2 and question 3 were 0.289 and 0.232, respectively, indicating
high relevance at the 5% to 10% significance level. Hence, the increase in the proportion of
RPA usage is highly related to the high score to the reliability of RPA.
1) This table reports the Pearson correlations among variables used in this study. 2) ***, **, * denote significance at the 1%, 5%, and 10% levels, respectively(two-tailed).
H4: Bank employee’s job position affects RPA Effort Expectancy
H4a:Bank employee’s job position as “Commercial banking assistant manager” affects RPA Effort Expectancy
H4b: Bank employee’s job position as “Corporate banking assistant manager” affects RPA Effort Expectancy
H4c: Bank employee’s job position as “VIP lounge assistant manager” affects RPA Effort Expectancy
H4d: Bank employee’s job position as “Commercial banking manager” affects RPA Effort Expectancy
H4e: Bank employee’s job position as “Corporate banking manager” affects RPA Effort Expectancy
H4f: Bank employee’s job position as “VIP lounge manager” affects RPA Effort Expectancy
dum_1 dum_2 dum_3 dum_4 dum_5 dum_6 q_3_4_1 q_3_4_2 q_3_4_3
dum_1 1.000
dum_2 -0.580*** 1.000
dum_3 -0.116 -0.082 1.000
dum_4 -0.398*** -0.280** -0.056 1.000
dum_5 -0.166 -0.117 -0.023 -0.080 1.000
dum_6 -0.205 -0.144 -0.029 -0.099 -0.041 1.000
q_3_4_1 -0.244* 0.201 0.091 0.051 -0.143 0.116 1.000
q_3_4_2 -0.102 0.005 0.107 0.110 -0.202 0.139 0.837*** 1.000
q_3_4_3 -0.219* -0.022 0.079 0.377*** -0.281** 0.092 0.818*** 0.883*** 1.000
30
As a result of the analysis, dum_5 (corporate banking manager) showed a negative correlation
at a 5% significance level. This indicates that in the case of the corporate banking manager, a
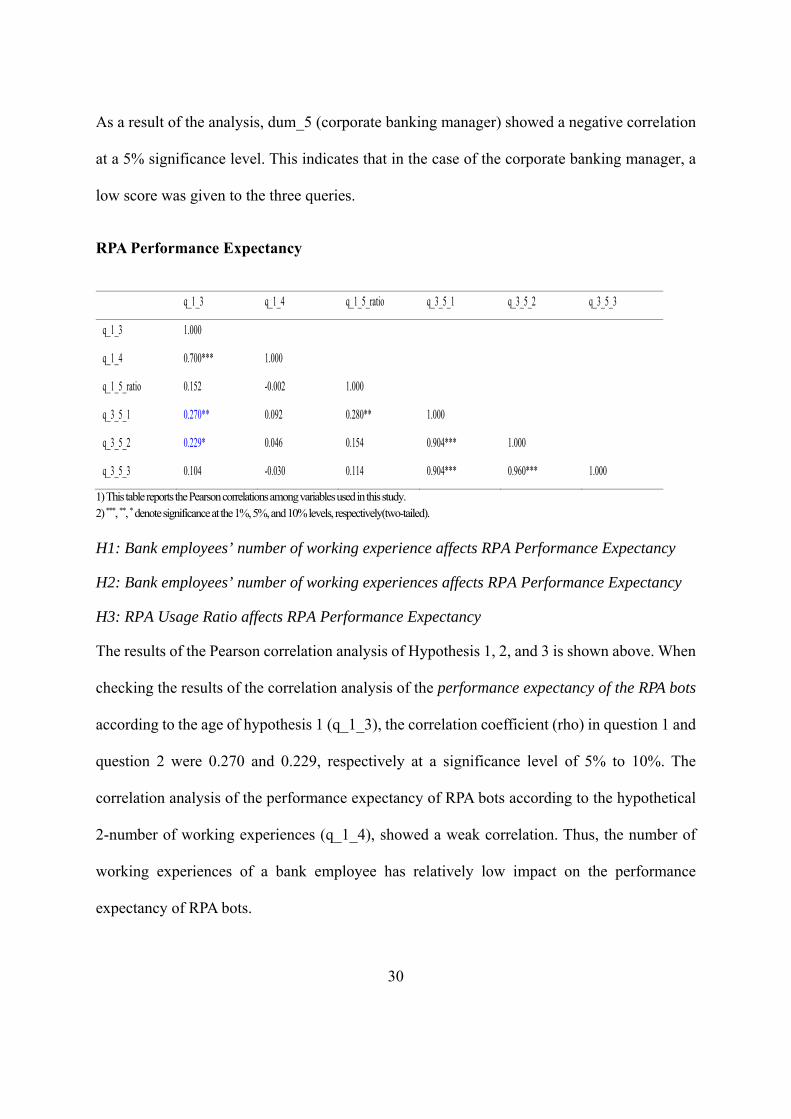
low score was given to the three queries.
RPA Performance Expectancy
q_1_3 q_1_4 q_1_5_ratio q_3_5_1 q_3_5_2 q_3_5_3
q_1_3 1.000
q_1_4 0.700*** 1.000
q_1_5_ratio 0.152 -0.002 1.000
q_3_5_1 0.270** 0.092 0.280** 1.000
q_3_5_2 0.229* 0.046 0.154 0.904*** 1.000
q_3_5_3 0.104 -0.030 0.114 0.904*** 0.960*** 1.000
1) This table reports the Pearson correlations among variables used in this study. 2) ***, **, * denote significance at the 1%, 5%, and 10% levels, respectively(two-tailed).
H1: Bank employees’ number of working experience affects RPA Performance Expectancy
H2: Bank employees’ number of working experiences affects RPA Performance Expectancy
H3: RPA Usage Ratio affects RPA Performance Expectancy
The results of the Pearson correlation analysis of Hypothesis 1, 2, and 3 is shown above. When
checking the results of the correlation analysis of the performance expectancy of the RPA bots
according to the age of hypothesis 1 (q_1_3), the correlation coefficient (rho) in question 1 and
question 2 were 0.270 and 0.229, respectively at a significance level of 5% to 10%. The
correlation analysis of the performance expectancy of RPA bots according to the hypothetical
2-number of working experiences (q_1_4), showed a weak correlation. Thus, the number of
working experiences of a bank employee has relatively low impact on the performance
expectancy of RPA bots.

31
The results of the correlation analysis of the performance expectancy of RPA bots according to
the hypothesis 3 RPA usage ratio (q_1_5_ratio), the correlation coefficients (rho) in question 1
marked as 0.280 at a level of 5% significance level. In other words, the increase in the
proportion of RPA usage is highly related to the high score to the performance expectancy of
RPA.
dum_1 dum_2 dum_3 dum_4 dum_5 dum_6 q_3_5_1 q_3_5_2 q_3_5_3
dum_1 1.000
dum_2 -0.580*** 1.000
dum_3 -0.116 -0.082 1.000
dum_4 -0.398*** -0.280** -0.056 1.000
dum_5 -0.166 -0.117 -0.023 -0.080 1.000
dum_6 -0.205 -0.144 -0.029 -0.099 -0.041 1.000
q_3_5_1 -0.325** 0.118 0.075 0.308** -0.302** 0.175 1.000
q_3_5_2 -0.340*** 0.226* 0.074 0.203 -0.316** 0.174 0.904*** 1.000
q_3_5_3 -0.340*** 0.291** 0.087 0.146 -0.347*** 0.152 0.904*** 0.960*** 1.000
1) This table reports the Pearson correlations among variables used in this study. 2) ***, **, * denote significance at the 1%, 5%, and 10% levels, respectively(two-tailed).
H4: Bank employee’s job position affects RPA Performance Expectancy
H4a:Bank employee’s job position as “Commercial banking assistant manager” affects RPA Performance Expectancy
H4b: Bank employee’s job position as “Corporate banking assistant manager” affects RPA Performance Expectancy
H4c: Bank employee’s job position as “VIP lounge assistant manager” affects RPA Performance Expectancy
H4d: Bank employee’s job position as “Commercial banking manager” affects RPA Performance Expectancy
H4e: Bank employee’s job position as “Corporate banking manager” affects RPA Performance Expectancy

32
H4f: Bank employee’s job position as “VIP lounge manager” affects RPA Performance Expectancy
As a result of the analysis, dum_5 (corporate banking manager) showed a strong negative
correlation with all inquiries regarding the performance expectancy of RPA bots. In other words,
it can be said that in the case of the corporate banking manager, a low score was given to the
three queries.
Chapter 4: Discussion
This study gained some robust results on the impact of the adoption of RPA strategies on work
productivity in the retail banking industry by the front-office bank employees (IRPAAI, 2018)
The literature review suggested that RPA offers many benefits such as improved business
efficiency and increased productivity while employees are relieved from repetitive and tedious
tasks, some of the findings in this study showed contrasting results. When analyzing the top
three daily routine tasks reassigned to RPA bots, the average time taken to complete the task
manually and by RPA bots showed no difference. However this work is still at an early stage
of implementation in fact, the adoption of RPA bots in the front-office bank employees at retail
banking branches have only been implemented for three months on average.
Hence, the latter part of the research focused on the relationship between each of the feature of
the demographics and on their perceptions regarding the attributes of RPA bots developed from
the TAM and UTAUT models. In overall, the research found that the usage rate of RPA bots is
relatively low but as the usage ratio increases, the more likely that the results will become
favorable. Thus, installation of a sound system that works properly will be the top priority but
training and follow-up management for users are equally important so that the RPA system can
be utilized.
33
Chapter 5: Conclusion
Robotic Process Automation (RPA) is increasingly gaining recognitions in various industries
but as a relatively new topic of examination, this study proposes to observe the effectiveness
of RPA in the retail banking sector in relation to employee work productivity. This paper
establishes as a preliminary study and provides insights for businesses when designing and
implementing a RPA tool to increase work productivity. It can be further researched focusing
on the end users of RPA for a successful implementation.
5.1 Future Research Implications
Previously, researchers mainly focused on the concept of RPA itself and case studies related to
technical performances. However, this study proposes and tests the impact of the adoption of
RPA technology on front-office bank employees’ work productivity. Although the development
of RPA-based technology is vital, in order to successfully implement and develop the
technology to leap to the next stage, it is equally important to carefully plan and monitor for
the end-users to actually use the available technology at the early stages of the adoption. The
higher the usage rate, the more likely to leap into the cogitative automation stage. Thus, for
practical implications, it is suggested to develop the necessary supporting units and training
programs so that the end-users can adapt quickly and monitor the usage rate after
implementation.
Furthermore, this study provides several directions for future researches to identify the
priorities that should be taken into consideration in the adoption and implementation of RPA
technology.
34
5.2 Limitations
This research mainly focused on collecting data in the retail banks in South Korea in which,
the samples collected were from two of the top five retail banks in South Korea. The number
of retail banks who have adopted RPA-related technologies for client-facing front-office bank
employees at bank branches is small and due to the limited size of the samples collected, it is
difficult to generalize based on the findings.
References
1. Aguirre, S., & Rodriguez, A. (2017). Automation of a business process using robotic process automation (RPA): A case study. Workshop On Engineering Applications, 65-71.
2. Asatiani, A., & Penttinen, E. (2016). Turning robotic process automation into commercial success – Case OpusCapita. Journal Of Information Technology Teaching Cases, 6(2), 67-74. doi: 10.1057/jittc.2016.5
3. Corbin, J. M., & Strauss, A. L. (2008). Basics of qualitative research : techniques and procedures for developing grounded theory (3rd Edition ed.). Los Angeles: SAGE Publications.
4. Davis FD. Perceived usefulness, perceived ease of use, and user acceptance of information technology. MIS Quarterly 1989;13(3):319–340.
5. Dobson, G., & Sainathan, A. (2011). On the impact of analyzing customer information and prioritizing in a service system. Decision Support Systems, 51(4), 875-883. doi: 10.1016/j.dss.2011.02.006
6. European Patent Application Robotic Process Automation - EP3112965A1. (2015). Retrieved 14 April 2020, from https://patents.google.com/patent/EP3112965A1/en .
7. Golafshani, N. (2003). Understanding Reliability and Validity in Qualitative Research. The Qualitative Report , 8 (4), 597-607.
8. IBS intelligence. (2019). Cognitive Automation - Convergence of AI and RPA in Banks. Retrieved 30 April 2020, from https://ibsintelligence.com/wp-content/uploads/2019/10/Cognitive-Automation-Covergence-of-AI-RPA-in-Banks.pdf

35
9. Institute for Robotic Process Automation & Artificial Intelligence: Definition and Benefits. (2019). Retrieved 14 April 2020, from https://irpaai.com/definition-and-benefits/
10. IRPAAI (2018). Robotic Process Automation in the Real World: How 3 Companies are Innovating with RPA, from https://irpaai.com/robotic-process-automation-real-world-3-companies-innovating-rpa/
11. KUMAR, K., & BALARAMACHANDRAN, P. (2020). ROBOTIC PROCESS AUTOMATION - A STUDY OF THE IMPACT ON CUSTOMER EXPERIENCE IN RETAIL BANKING INDUSTRY. Retrieved 12 April 2020, from http://www.icommercecentral.com/open-access/robotic-process-automation-a-study-of-the-impact-on-customer-experience-in-retail-banking-industry.php?aid=87176
12. Lacity, M., & Willcocks, L. P. (2018). Innovating in Service: The role and management of automation, in L. Willcocks, I. Oshri & J. Kotlarsky (eds) Dynamic Innovation in Outsourcing.Technology, Work and Globalization, Palgrave Macmillan, Cham, pp. 269-325
13. Moffitt, K., Rozario, A., & Vasarhelyi, M. (2018). Robotic Process Automation for Auditing. Journal Of Emerging Technologies In Accounting, 15(1), 1-10. doi: 10.2308/jeta-10589
14. Oliveira, T., & Martins, M. F. (2011). Literature Review of Information Technology Adoption Models at Firm Level, The Electronic Journal Information Systems Evaluation, vol. 14, no. 1,pp. 110-121
15. PwC. (2017). Rethinking retail artificial intelligence and robotic process automation. Retrieved 25 April 2020, from https://www.pwc.be/en/documents/20171123-rethinking-retail-artificial-intelligence-and-robotic-process-automation.pdf
16. Romão, M., Costa, J., & Costa, C. (2019). Robotic Process Automation: A case study in the Banking Industry. Iberian Conference On Information Systems And Technologies (CISTI),19 – 22 June 2019.
17. Venkatesh, V., Morris, M. G., Davis, G. B., & Davis, F. D. (2003). User Acceptance of Information Technology: Toward a unified view, MIS Quarterly, vol. 27, no. 3, pp. 425-478
18. Willcocks, L., Lacity, M., & Craig, A. (2015). The IT function and robotic process automation. The Outsourcing Unit Working Research Paper Series, 15(5), 1-39.
19. Wilds, C. (2019). Examples of RPA in Banking Operations - Implementation in Lending |

36
The Lab. Retrieved 10 April 2020, from https://thelabconsulting.com/examples-rpa-banking-operations-robotic-process-automation-implementation-commercial-lending/
20. Yin, R. K. (2009). Case Study Research: Design and Methods (4th Edition ed.). California, U.S.A: SAGE Publications.
21. 윤일영. (2017). 로봇과 비즈니스의 융합, 로봇 프로세스 자동화(RPA). 융융합 Weekly
TIP, 99 (2017 December), 1-10.
22. 이창섭. (2017). RPA, Office에 가져다 줄 변화. 디지에코보고서. KT경영경제연구소
Appendix
<Table 1-1> Survey Items (continued)
Variable Question Response
ID Identification Number
q_1_1 Job Position
1 (Commercial banking assistant manager), 2
(Corporate banking assistant manager), 3 (VIP
lounge assistant manager), 4 (Commercial banking
manager), 5 (Corporate banking manager), 6 (VIP
lounge manager)
q_1_2
Major Tasks
(multiple
selection
possible)
1 (Teller), 2 (Personal Banking
Representative/Financial Adviser), 3(Loan Officer),
4 (FX Transactions), 5 (Corporate Loan Officer), 6
(General Affairs), 7 (Internal Control Officer), 8
(Performance Manager, KPI)
q_1_3 Age 1 (20<Age≤30), 2 (30<Age≤40), 3 (40<Age≤50),
4 (Age>50)
q_1_4
Years of
Work
Experiences
1 (<1 YR), 2 (1YR≤Working Years≤5YRs), 3
(5YRs<Working Years≤10YRs), 4
(10YRs<Working Years≤20YRs), 5(Working
Years>20YRs)
q_1_5_total Total Number
of People Total number of people at your branch
37
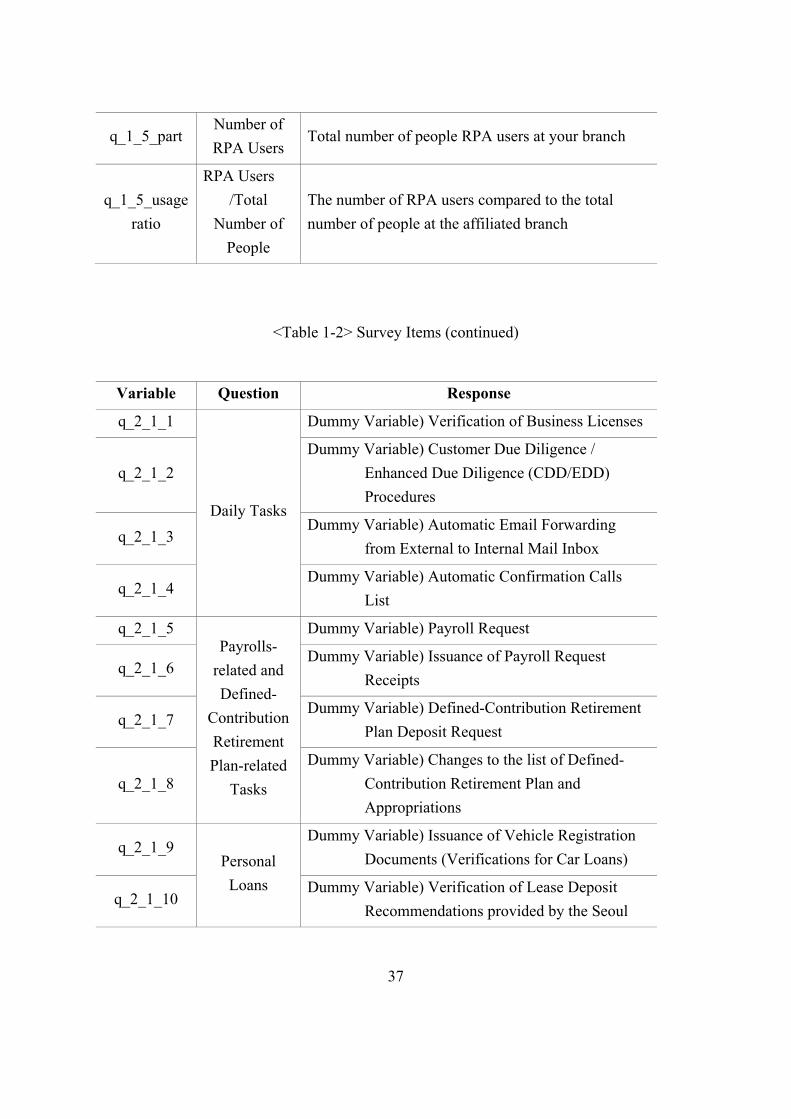
q_1_5_part Number of
RPA Users Total number of people RPA users at your branch
q_1_5_usage
ratio
RPA Users
/Total
Number of
People
The number of RPA users compared to the total
number of people at the affiliated branch
<Table 1-2> Survey Items (continued)
Variable Question Response
q_2_1_1
Daily Tasks
Dummy Variable) Verification of Business Licenses
q_2_1_2
Dummy Variable) Customer Due Diligence /
Enhanced Due Diligence (CDD/EDD)
Procedures
q_2_1_3 Dummy Variable) Automatic Email Forwarding
from External to Internal Mail Inbox
q_2_1_4 Dummy Variable) Automatic Confirmation Calls
List
q_2_1_5 Payrolls-
related and
Defined-
Contribution
Retirement
Plan-related
Tasks
Dummy Variable) Payroll Request
q_2_1_6 Dummy Variable) Issuance of Payroll Request
Receipts
q_2_1_7 Dummy Variable) Defined-Contribution Retirement
Plan Deposit Request
q_2_1_8
Dummy Variable) Changes to the list of Defined-
Contribution Retirement Plan and
Appropriations
q_2_1_9 Personal
Loans
Dummy Variable) Issuance of Vehicle Registration
Documents (Verifications for Car Loans)
q_2_1_10 Dummy Variable) Verification of Lease Deposit
Recommendations provided by the Seoul

38
Metropolitan Government
q_2_1_11
Dummy Variable) Verification of Lease Funds for
Housing Loans for Employees of Small to
Medium Enterprises
q_2_1_12 Dummy Variable) Loan Registration for Military
Personnel
q_2_1_13 Dummy Variable) Mortgage Loans and
Collateralization of Debt Obligation
q_2_1_14 Dummy Variable) Establishment of the Right to
Collateral Security
q_2_1_15
Corporate
Loans
Dummy Variable) Large-scale Access to Real
Property Registry Records
q_2_1_16 Dummy Variable) Listing of Potential Corporate
Clients
q_2_1_17 Dummy Variable) Alerts before Roll-over or
Extension of Corporate Debts
q_2_1_18 Dummy Variable) Automatic Evaluation and
Approvals of B2B Finance Requests
<Table 1-3> Survey Items (continued)
Variable Question Response
q_2_2_1_no1 Manual Process of Performing Job Order 1
q_2_2_1_no2 Manual Process of Performing Job Order 2
q_2_2_1_no3 Manual Process of Performing Job Order 3
q_2_2_1_time1
Total Time
for Job Order
1 (sec) Total time taken to perform the Job order manually
(in seconds)
q_2_2_1_time2
Total Time
for Job Order
2 (sec)
39
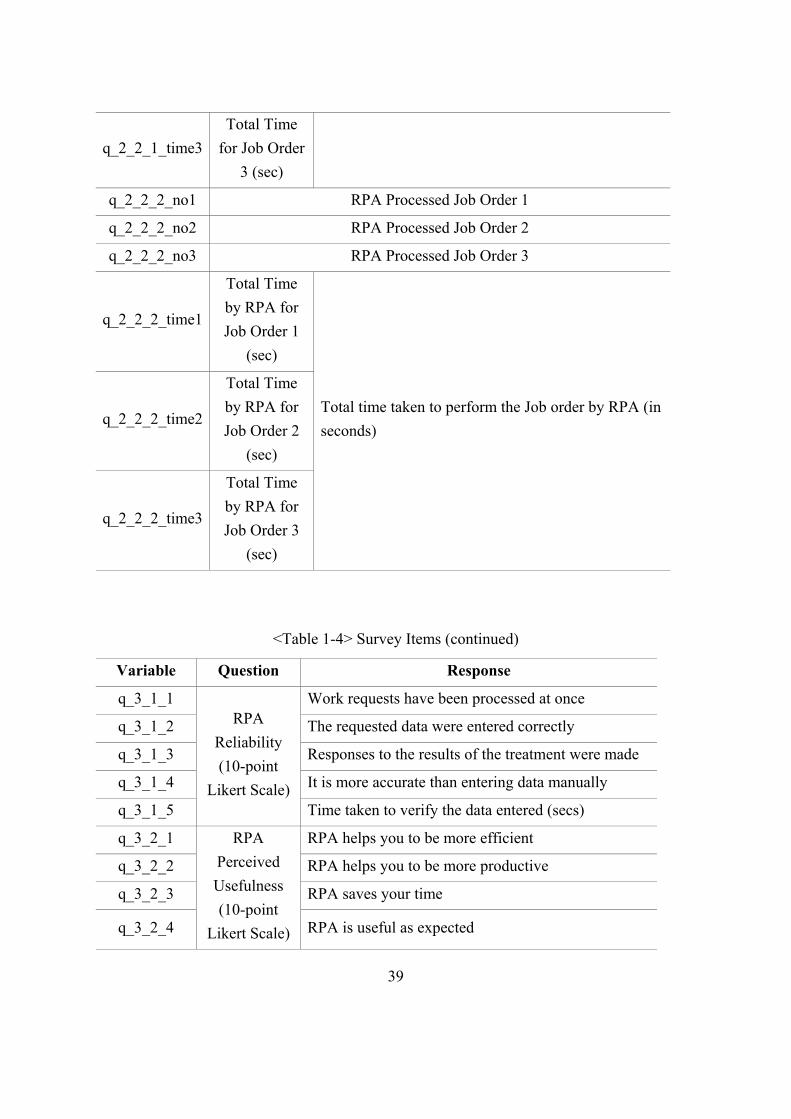
q_2_2_1_time3
Total Time
for Job Order
3 (sec)
q_2_2_2_no1 RPA Processed Job Order 1
q_2_2_2_no2 RPA Processed Job Order 2
q_2_2_2_no3 RPA Processed Job Order 3
q_2_2_2_time1
Total Time
by RPA for
Job Order 1
(sec)
Total time taken to perform the Job order by RPA (in
seconds) q_2_2_2_time2
Total Time
by RPA for
Job Order 2
(sec)
q_2_2_2_time3
Total Time
by RPA for
Job Order 3
(sec)
<Table 1-4> Survey Items (continued)
Variable Question Response
q_3_1_1 RPA
Reliability
(10-point
Likert Scale)
Work requests have been processed at once
q_3_1_2 The requested data were entered correctly
q_3_1_3 Responses to the results of the treatment were made
q_3_1_4 It is more accurate than entering data manually
q_3_1_5 Time taken to verify the data entered (secs)
q_3_2_1 RPA
Perceived
Usefulness
(10-point
Likert Scale)
RPA helps you to be more efficient
q_3_2_2 RPA helps you to be more productive
q_3_2_3 RPA saves your time
q_3_2_4 RPA is useful as expected

40
q_3_3_1 RPA
Perceived
Ease-of-Use
(10-point
Likert Scale)
Easy to use
q_3_3_2 User-friendly
q_3_3_3 Requires minimal steps to perform the job
q_3_3_4 Does not require much effort when using
q_3_4_1 RPA Effort
Expectancy
(10-point
Likert Scale)
Quickly learned to use
q_3_4_2 Easy to learn to use
q_3_4_3 Adapted quickly to use
q_3_5_1 RPA
Performance
Expectancy
(10-point
Likert Scale)
Satisfied
q_3_5_2 Recommend it to others
q_3_5_3 Works the way you want

41
q_3_1_1 q_3_1_2 q_3_1_3 q_3_1_4 q_3_1_5 q_3_2_1 q_3_2_2 q_3_2_3 q_3_2_4 q_3_3_1 q_3_3_2 q_3_3_3 q_3_3_4 q_3_4_1 q_3_4_2 q_3_4_3 q_3_5_1 q_3_5_2 q_3_5_3
q_3_1_1 1.000
q_3_1_2 0.888*** 1.000
q_3_1_3 0.790*** 0.826*** 1.000
q_3_1_4 0.764*** 0.842*** 0.727*** 1.000
q_3_1_5 0.267** 0.246* 0.217* 0.265** 1.000
q_3_2_1 0.712*** 0.763*** 0.598*** 0.817*** 0.280** 1.000
q_3_2_2 0.674*** 0.703*** 0.551*** 0.769*** 0.274** 0.908*** 1.000
q_3_2_3 0.521*** 0.614*** 0.430*** 0.644*** -0.121 0.780*** 0.758*** 1.000
q_3_2_4 0.594*** 0.698*** 0.498*** 0.725*** 0.143 0.881*** 0.860*** 0.885*** 1.000
q_3_3_1 0.470*** 0.560*** 0.337*** 0.449*** 0.109 0.558*** 0.526*** 0.513*** 0.544*** 1.000
q_3_3_2 0.402*** 0.416*** 0.271** 0.343*** 0.150 0.467*** 0.541*** 0.377*** 0.367*** 0.846*** 1.000
q_3_3_3 0.281** 0.385*** 0.331*** 0.329*** 0.258** 0.346*** 0.404*** 0.331*** 0.289** 0.793*** 0.845*** 1.000
q_3_3_4 0.326*** 0.405*** 0.352*** 0.382*** 0.252** 0.386*** 0.469*** 0.368*** 0.316** 0.769*** 0.862*** 0.965*** 1.000
q_3_4_1 0.384*** 0.588*** 0.565*** 0.575*** 0.025 0.511*** 0.513*** 0.566*** 0.614*** 0.639*** 0.532*** 0.610*** 0.601*** 1.000
q_3_4_2 0.419*** 0.577*** 0.551*** 0.580*** -0.107 0.412*** 0.407*** 0.497*** 0.437*** 0.631*** 0.528*** 0.624*** 0.646*** 0.837*** 1.000
q_3_4_3 0.544*** 0.678*** 0.630*** 0.719*** 0.272** 0.530*** 0.559*** 0.468*** 0.505*** 0.612*** 0.570*** 0.677*** 0.740*** 0.818*** 0.883*** 1.000
q_3_5_1 0.619*** 0.720*** 0.550*** 0.742*** 0.252* 0.665*** 0.689*** 0.635*** 0.753*** 0.660*** 0.513*** 0.513*** 0.566*** 0.772*** 0.673*** 0.787*** 1.000
q_3_5_2 0.502*** 0.659*** 0.503*** 0.768*** 0.260** 0.748*** 0.748*** 0.674*** 0.792*** 0.662*** 0.525*** 0.554*** 0.613*** 0.769*** 0.655*** 0.787*** 0.904*** 1.000
q_3_5_3 0.434*** 0.564*** 0.420*** 0.677*** 0.280** 0.674*** 0.682*** 0.640*** 0.764*** 0.648*** 0.521*** 0.584*** 0.624*** 0.763*** 0.637*** 0.753*** 0.904*** 0.960*** 1.000