adoption of system of rice intensification and impact …
TRANSCRIPT

ADOPTION OF SYSTEM OF RICE INTENSIFICATION AND IMPACT ON
YIELD IN MBARALI DISTRICT IN MBEYA, TANZANIA
AMOS NDABILA
A DISSERTATION SUBMITTED IN PARTIAL FULFILMENT OF THE
REQUIREMENTS FOR THE DEGREE OF MASTER OF SCIENCE IN
AGRICULTURAL ECONOMICS OF SOKOINE UNIVERSITY
OF AGRICULTURE. MOROGORO, TANZANIA.
2018

ii
ABSTRACT
Rice yields in developing countries in general and specifically in Tanzania remain low
due to limited adoption of new innovations by smallholder rice farmers. The System of
Rice Intensification (SRI) is believed to have promising potential for increasing rice
yields. However, the factors influencing the adoption decisions as well as adoption
impacts have been a subject of debate. This study was conducted to analyse the adoption
of SRI and its impact on rice yields in Mbarali District. Specifically, the study focused on
determining the extent of SRI components adoption by smallholder rice farmers,
analysing the factors affecting SRI components adoption decisions and determining the
impacts of adopted SRI component combinations on rice yields. Data were collected from
three irrigation schemes involving 318 smallholder rice farmers. The extent of SRI
components adoption was estimated as a percentage of area under rice production
allocated to SRI by smallholder rice farmer. Multinomial endogenous treatment effect
model was used to analyse the determinants of SRI component combinations adoption
and the impact of the adopted packages on rice yields. The study findings indicate that on
average SRI adopters allocate about 73% of rice cultivated land on SRI. The likelihood
of smallholder rice farmers adopting SRI component combinations is significantly
determined by education level of the household heard, active family labour force size,
experience in rice production, access to off farm activities, farm size, farm level status,
adequate availability of water for irrigation, access to credit facilities and information
from formal sources. Furthermore, the results reveal that all SRI component combinations
have a positive and significant impact on yields although on their impact differ in
magnitude. The highest rice yields (41%) are obtained when the full package comprising
all components (plant, soil and water management) is adopted, hence future interventions
with comprehensive SRI package are recommended.

iii
DECLARATION
I, Amos Ndabila, do hereby declare to the Senate of Sokoine University of Agriculture
that this dissertation is my own original work done within the period of registration and
that it has neither been submitted nor being concurrently submitted in any other
institution.
Amos Ndabila Date
(MSc. Candidate)
The declaration above is confirmed by;
Prof. G.I. Mlay Date
(Supervisor)

iv
COPYRIGHT
No part of this dissertation may be reproduced, stored in any retrieval system, or
transmitted in any form or by any means without prior written permission of the author or
Sokoine University of Agriculture on that behalf.

v
ACKNOWLEDGEMENTS
First and foremost, I would like to extend my unshared thanks to the Almighty God for
smoothening all aspects of my life and my studies in particular.
I would like to extend my heartfelt thanks to my advisor and supervisor Prof. G.I. Mlay,
for his valuable advice, insight and guidance for my research work. Successful and timely
accomplishment of this study would have been very difficult without his generous time
devotion and support from the early proposal development till the final write up of the
dissertation. Thus, I am very much indebted to him for his willingness to advise me and
his guidance that enabled me finalize my dissertation.
I also extend my sincere gratitude to the School of Agricultural Economics and Business
studies staff for the great support that expedited the completion of my studies at Sokoine
University of Agriculture (SUA).
My acknowledgement also goes to Mbarali District Executive Director (DED) for
granting access to irrigation schemes in that District, and all smallholder farmers from
irrigation schemes who were involved in the study are highly appreciated.
Finally yet very importantly special thanks go to my mom Tusayene Mbembela who laid
the foundation for my education and my family (wife and children) for their emotional
and material support and patience during my entire study period.

vi
DEDICATION
This work is dedicated to Almighty God under whose care I was able to finish it
successfully. Secondly, to my lovely family, my wife Zena and my children Jacquiline,
Eugen and Jadin.

vii
TABLE OF CONTENTS
ABSTRACT........................................................................................................................ii
DECLARATION...............................................................................................................iii
COPYRIGHT....................................................................................................................iv
ACKNOWLEDGEMENTS...............................................................................................v
DEDICATION...................................................................................................................vi
TABLE OF CONTENTS.................................................................................................vii
LIST OF TABLES.............................................................................................................xi
LIST OF FIGURES........................................................................................................xii
LIST OF APPENDICES.................................................................................................xiii
LIST OF ABBREVIATIONS AND SYMBOLS...........................................................xiv
CHAPTER ONE.................................................................................................................1
1.0 INTRODUCTION......................................................................................................1
1.1 BACKGROUND INFORMATION..........................................................................1
1.2 PROBLEM STATEMENT AND JUSTIFICATION...............................................4
1.3 STUDY OBJECTIVES..............................................................................................5
1.3.1 GENERAL OBJECTIVE................................................................................5
1.3.2 SPECIFIC OBJECTIVES..............................................................................5
1.4 RESEARCH HYPOTHESES...................................................................................5
1.5 ORGANIZATION OF THE DISSERTATION........................................................5
CHAPTER TWO................................................................................................................7
2.0 LITERATURE REVIEW..........................................................................................7
2.1 THEORETICAL FRAMEWORK............................................................................7

viii
2.1.1 ADOPTION THEORY..................................................................................7
2.1.2 THEORY OF THE FIRM..............................................................................7
2.2 ADOPTION OF AGRICULTURAL TECHNOLOGIES AMONG
SMALLHOLDER FARMERS..........................................................................................8
2.2.1 HOUSEHOLD CHARACTERISTICS AND THEIR INFLUENCE ON
AGRICULTURAL TECHNOLOGY ADOPTION..................................10
2.2.2 FARM CHARACTERISTICS AND THEIR INFLUENCE ON
AGRICULTURAL TECHNOLOGY ADOPTION..........................13
2.2.3 ACCESS TO OFF FARM ACTIVITIES AND ASSETS AND THEIR
INFLUENCE ON AGRICULTURAL TECHNOLOGY
ADOPTION.................................................................................................15
2.2.4 ACCESS TO EXTENSION SERVICES, INFORMATION AND CREDIT
AND THEIR INFLUENCE ON AGRICULTURAL
TECHNOLOGY ADOPTION....................................................................16
2.3 SYSTEM OF RICE INTENSIFICATION.............................................................18
2.4 ANALYTICAL TECHNIQUES FOR AGRICULTURAL TECHNOLOGY
ADOPTION AND IMPACT IN MULTIPLE ALTERNATIVES........................21
2.4.1 ANALYTICAL TECHNIQUES FOR AGRICULTURAL
TECHNOLOGY ADOPTION IN MULTIPLE ALTERNATIVES.........21
2.4.2 ANALYTICAL TECHNIQUES ON IMPACT OF AGRICULTURAL
TECHNOLOGY ADOPTION.........................................................................................23
CHAPTER THREE.........................................................................................................25
3.0 RESEARCH METHODOLOGY............................................................................25
3.1 CONCEPTUAL FRAMEWORK...........................................................................25
3.2 THEORETICAL MODEL......................................................................................26

ix
3.2.1 RONDUM UTILITY MODEL (RUM).......................................................26
3.3 METHODS OF ANALYSIS....................................................................................27
3.3.1 EXTENT OF SRI COMPONENTS ADOPTION BY SMALLHOLDER
RICE FARMERS........................................................................................27
3.3.2 DETERMINANTS OF SRI COMPONENTS ADOPTION AND
IMPACT OF ADOPTED COMPONENT COMBINATIONS ON YIELD
.......................................................................................................................27
3.3.2.1 DETERMINANTS OF SRI COMPONENTS ADOPTION........28
3.3.2.2 IMPACT OF SRI COMPONENTS ADOPTION ON YIELD.....34
3.4 DESCRIPTION OF THE STUDY AREA..............................................................35
3.5 RESEARCH DESIGN.............................................................................................37
3.5.1 SAMPLING PROCEDURE AND SAMPLE SIZE...................................37
3.5.2 DATA COLLECTION METHODS............................................................38
3.5.3 DATA PROCESSING AND ANALYSIS....................................................39
CHAPTER FOUR............................................................................................................40
4.0 RESULTS AND DISCUSSION...............................................................................40
4.1 PATTERN OF SRI ADOPTION.............................................................................40
4.2 CHARACTERIZATION OF SAMPLED HOUSEHOLDS..............................40
4.2.1 LEVEL OF EDUCATION OF SAMPLE HOUSEHOLDS......................41
4.2.2 ACCESS TO OFF FARM ACTIVITIES....................................................41
4.2.3 ACTIVE FAMILY LABOUR FORCE.......................................................42
4.2.4 EXPERIENCE IN RICE PRODUCTION.................................................43
4.2.5 VALUE OF FARM ASSETS.......................................................................44
4.3 FARM CHARACTERISTICS................................................................................44
4.3.1 FARM LEVEL STATUS..............................................................................44

x
4.3.2 RICE FARMS LOCATION IN THE IRRIGATION SCHEMES...........45
4.3.3 WATER AVAILABILITY IN IRRIGATION SCHEMES........................45
4.3.4 FARM SIZE OF SAMPLE HOUSEHOLDS.............................................46
4.4 INSTITUTIONAL FACTORS................................................................................47
4.4.1 ACCESS TO CREDIT................................................................................47
4.4.2 ACCESS TO EXTENSION AND INFORMATION SERVICES............49
4.5 RICE YIELDS AND COSTS OF PRODUCTION................................................51
4.6 EXTENT OF SRI COMPONENTS ADOPTION.................................................52
4.6.1 ALLOCATED LAND ON SRI RICE PRODUCTION METHOD..........52
4.7 DETERMINANTS OF SRI COMPONENTS ADOPTION................................54
4.8 IMPACT OF ADOPTED SRI COMPONENTS ON RICE YIELDS..................59
CHAPTER FIVE..............................................................................................................62
5.0 CONCLUSIONS AND RECOMMENDATIONS...............................................62
5.1 CONCLUSION........................................................................................................62
5.2 RECOMMENDATION...........................................................................................63
5.2.1 POLICY IMPLICATION............................................................................63
5.2.2 FUTURE STUDIES.....................................................................................64
REFERENCES.................................................................................................................65
APPENDICES..................................................................................................................77
xi
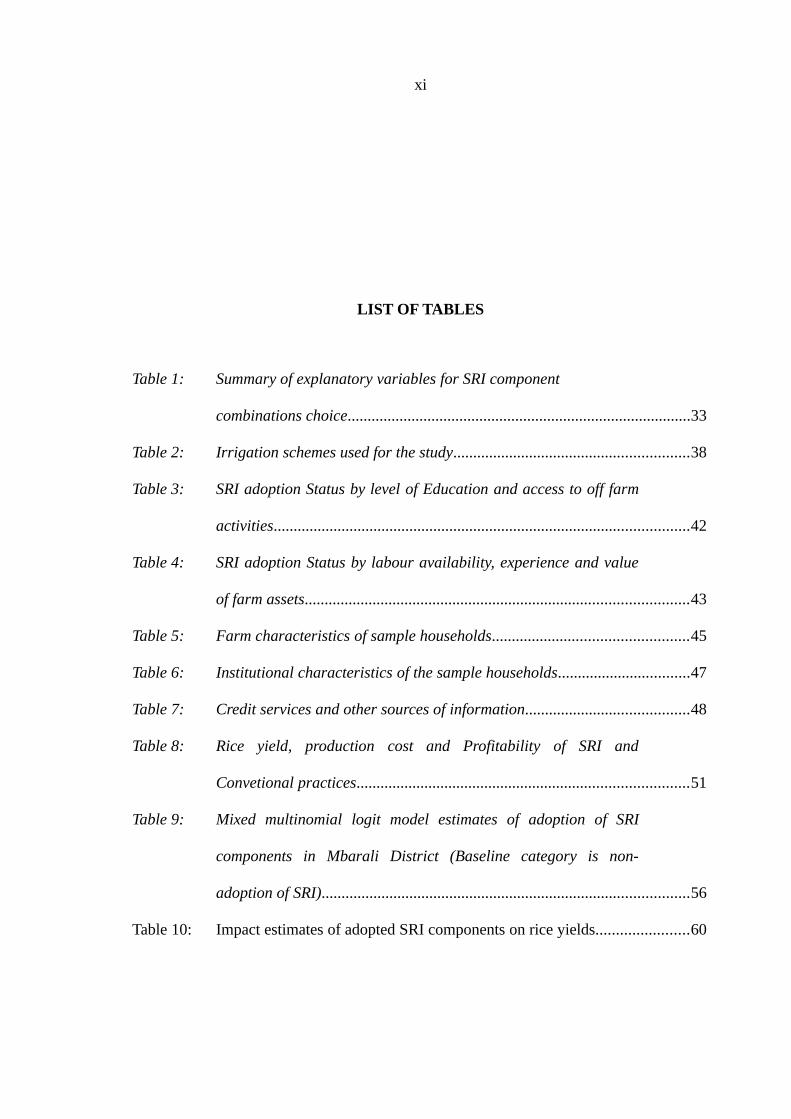
LIST OF TABLES
Table 1: Summary of explanatory variables for SRI component
combinations choice......................................................................................33
Table 2: Irrigation schemes used for the study...........................................................38
Table 3: SRI adoption Status by level of Education and access to off farm
activities........................................................................................................42
Table 4: SRI adoption Status by labour availability, experience and value
of farm assets................................................................................................43
Table 5: Farm characteristics of sample households.................................................45
Table 6: Institutional characteristics of the sample households.................................47
Table 7: Credit services and other sources of information.........................................48
Table 8: Rice yield, production cost and Profitability of SRI and
Convetional practices...................................................................................51
Table 9: Mixed multinomial logit model estimates of adoption of SRI
components in Mbarali District (Baseline category is non-
adoption of SRI)............................................................................................56
Table 10: Impact estimates of adopted SRI components on rice yields.......................60

xii
LIST OF FIGURES
Figure 1: SRI adoption and impact conceptual framework.......................................25
Figure 2: Representation of the study area................................................................36
Figure 3: Pattern of SRI Adoption............................................................................40
Figure 4: Farm size of the sample households by SRI components
adoption......................................................................................................46
Figure 5: Number of extension agents contact with smallholder farmers
and training on rice production per cropping season................................50
Figure 6: Land allocation on SRI production............................................................53

xiii
LIST OF APPENDICES
Appendix 1: Implementation of PPS......................................................................77
Appendix 2: Mean and Median for Farm size, Farm assets value, Revenue,
Costs and Profit..................................................................................79
Appendix 3: Control variable and their effect on rice yield...................................79
Appendix 4: Questionnaire for Smallholder rice farmers in Irrigation
schemes...............................................................................................80
Appendix 5: Checklist of key informants for irrigation scheme stakeholders/
irrigation scheme leaders and government officials...........................85

xiv
LIST OF ABBREVIATIONS AND SYMBOLS
AAEA Agricultural and Applied Economics Association
ASDS Agricultural Sector Development Strategy
DED District Executive Director
EUCORD European Cooperative for Rural Development
FAO Food and Agriculture Organization
FFS Farmers Field School
GDP Gross Domestic Product
ICM Integrated Crop Management
IFPRI International Food Policy Research Institute
MAFAP Monitoring and Analysis of Food and Agricultural Policies
MAFSC Ministry of Agriculture Food Security and Cooperatives
MMNL Mixed Multinomial Logit
MNEM Multinomial Endogenous Model
MVP Multivariate probit
NBS National Bureau of Statistics
NRDS National Rice Development Strategy
PNAS Proceedings of the National Academy of Sciences
PPS Probability Proportional to Size
PSM Propensity score matching
QR Qualitative Response
RDD Regression Discontinuity Design
xv
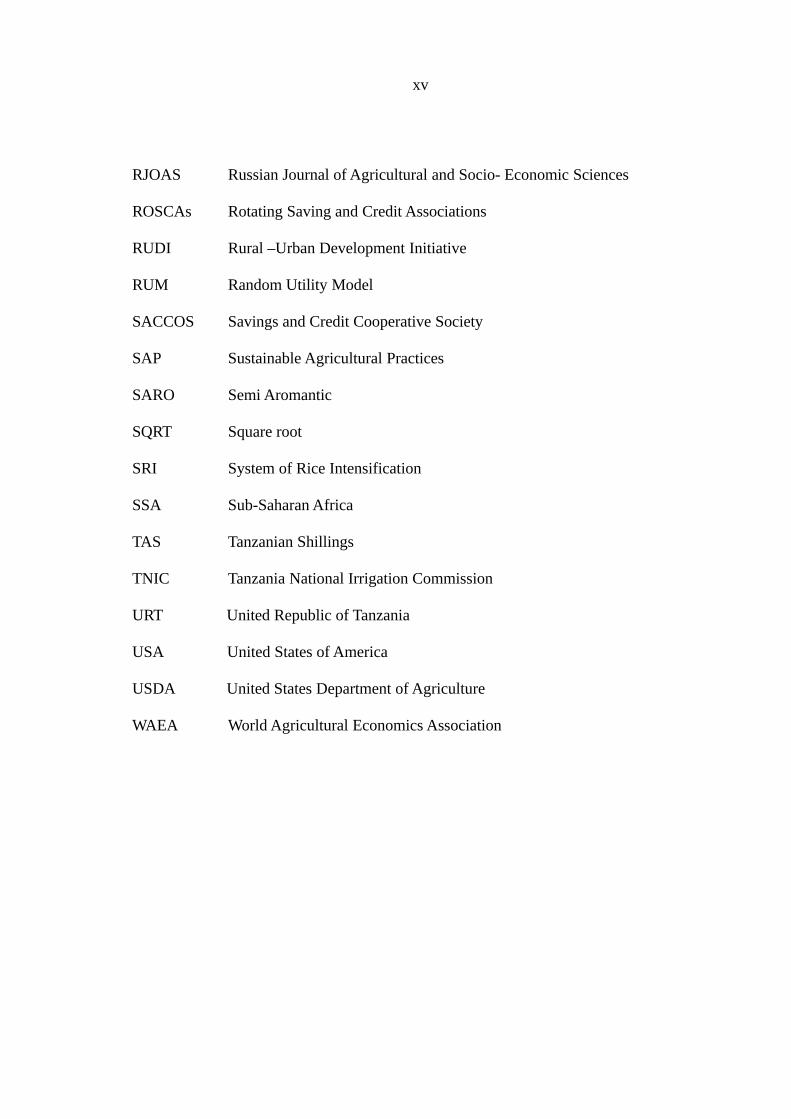
RJOAS Russian Journal of Agricultural and Socio- Economic Sciences
ROSCAs Rotating Saving and Credit Associations
RUDI Rural –Urban Development Initiative
RUM Random Utility Model
SACCOS Savings and Credit Cooperative Society
SAP Sustainable Agricultural Practices
SARO Semi Aromantic
SQRT Square root
SRI System of Rice Intensification
SSA Sub-Saharan Africa
TAS Tanzanian Shillings
TNIC Tanzania National Irrigation Commission
URT United Republic of Tanzania
USA United States of America
USDA United States Department of Agriculture
WAEA World Agricultural Economics Association
1
CHAPTER ONE
1.0 INTRODUCTION
1.1 Background Information
Rice (Oryza sativa L.) is the world’s second most consumed cereal after wheat. More than
half of the world population depends on rice for about 80% of the calorie requirements
(Ben et al., 2015). In Tanzania, it is the second most important cereal crop after maize
(FAO, 2015). Tanzania is the second largest rice producer in Southern and Eastern Africa
after Madagascar with cultivated area of about 1.5 million ha, equivalent to 8.8% of the
annual cultivated area, annual production of about 1.4 million tones and an average
annual production growth rate of 5% (URT, 2017; USDA, 2018). Smallholder rice
farmers account for 18% and 90% of farming households and annual rice planted area in
the country respectively, with plot ranging in size from 0.5 to 3 hectares of land per
household (FAO, 2015). Rice subsector is among the major sources of employment,
income and food security for Tanzania farming households and provides broader
beneficial impacts on the rural economy through stimulating local markets and wages
(Filipski et al., 2013).
In spite of the increase in the amount of rice production and the importance of rice
subsector in Tanzania, rice yield productivity is lower than in most neighbouring
countries and one of the lowest in the world due to predominantly rain fed production, the
limited adoption and availability of improved cultivars, the minimal use of fertilizers and
traditional planting techniques (Mwatawala, 2015; Ngalapa et al., 2014). It is estimated
that about 90% of rice farmers in the country use recycled seeds and only 10% use
certified seeds. It is estimated that about 15% of farmers use fertilizers at an average of 8
kg/ha compared to 100 kg/ha in Kenya and 120 kg/ha in South Africa (Bonifance et al.,
2015). This affects the yield level of rice in the country which is low ranging between 1.6

2
to 2.4 tonnes/ha compared to 2.5 tonnes/ha for Africa as whole and 4.7 tonnes/ha in Asia
(URT, 2017; FAO, 2017).
In Tanzania, rice is grown under irrigated and rain-fed systems. The irrigated rice
accounts for 26% of the planted area with yields ranging from 2.5 to 4.0 tones/ha, while
rain-fed covers 74% with yields ranging from 1.0 to 1.4 tones/ ha (FAO, 2015). The
utilization of the potential area for irrigated agriculture is very low. It is estimated that
29.4 million hectares are suitable for irrigated agriculture but only 460 000 hectares
equivalent to 1.5% of the area has been utilized, the percentage which is lower compared
to an average of 4% for Sub-Saharan Africa (SSA) (Kadigi et al., 2012; Burney et al.,
2013; TNIC, 2016). In 2010, the Ministry of Agriculture, Food Security and Cooperatives (MAFSC) launched
the National Rice Development Strategy (NRDS) whose vision is to ensure that the
subsistence dominated rice sub sector is transformed into commercial and viable
production system through improvement in irrigation and agronomic practices (Barriero-
Hurle 2012; URT-NRDS, 2010). This was a follow up to the launch of Agricultural Sector
Development Strategy phase one (ASDS I) of 2002 which was dedicated to the creation
of enabling environment for productivity and profitability improvement within
agricultural sector. Moreover, enhanced rice productivity and profitability have been
proposed by the Tanzanian 2010 irrigation policy, National agriculture policy of 2013 and
Agricultural Sector Development Programme phase two (ASDP II) (URT, 2010; URT,
2013; URT, 2016). However, how irrigated rice agriculture, can be balanced in a manner
that it produces more output with low amount of water utilization and inputs is a
challenge (Kadigi et al., 2004). The Systems of rice intensification (SRI), which was developed in Madagascar in the
early 1980s by late Fr. Henri de Laulanie, has been acknowledged worldwide as one of
rice cultivation practices that is characterized by water saving principles during rice

3
production process and has become more suited in many rice production systems due to
the stresses imposed on the already stressed water resources (Tusekelege et al., 2014;
Katambara et al., 2013). It is a practice that involves the change of management and
farming practices for plant management (younger age seedling transplanting and single
widely spaced transplants), soil management (early and regular weeding and increased
use of organic fertilizer to enhance soil fertility) and water management leading to an
increase in yield by more than 64% compared to conventional methods (Takahashi and
Barrett, 2014; Varma, 2017). However, it is knowledge intensive and commonly requires
more labour for field preparation, early transplanting, water management and weeding
(Barrett et al., 2016; Takahashi, 2013). According to Takahashi (2013), 62% and 17%
more labour is needed for weeding and transplanting in SRI respectively.
SRI is also acknowledged in Tanzanian irrigation policy of 2010 as its components of
plant management, soil management and water management, increase rice productivity
which in turn improves food security and increases smallholder farmers’ income (URT,
2010). Despite its increase in rice productivity results, it is not effectively used by
smallholder rice farmers in Tanzania (Katambara et al., 2013). Smallholder rice farmers
still operate and produce in subsistence level in which productivity, profitability and farm
income have not effectively been increased (Mwatawala, 2015). Therefore, this study
investigated on the SRI method with the focus on anlaysing the factors affecting the
adoption of its components and the impact of the adopted components on yield to
smallholder farmers.
1.2 Problem Statement and Justification
The System of Rice Intensification (SRI) has been acknowledged worldwide as the rice
production practice which is characterized by increased rice productivity with less seeds,
water, chemical fertilizers and pesticides use. Although SRI is knowledge and labour
intensive, high yields up to more than 7.5tonnes/ha with more than 60% saving on other
4
inputs and increased profits associated with SRI have been revealed by a number of
scholarly studies (Varma, 2017; Ijogu, 2016; Barrett et al., 2016; Tusekelege et al., 2014;
Katambara et al., 2013; Devi and Ponnarasi, 2009). Nevertheless, its adoption in most
developing countries is very low (Barrett et al., 2016; Katambara et al., 2013). Its slow
uptake by smallholder farmers raises questions about whether this new rice production
method really offers all the total factor productivity gains as on station and on farm trials
from several countries in Africa and Asia have revealed.
Barrett et al. (2016) argue that, within SRI adopters, there is significant difference in
extent of adoption of SRI components. In addition Takahashi and Barrett (2014), reveal
that, SRI impact on yields, may result from varying degrees of adherence to SRI practices
which are tested, modified and adopted by farmers as they see fit according to the local
conditions. Despite a number of promising benefits offered by SRI as revealed in several
studies, there is limited empirical evidence on determinants affecting the decisions to
adopt individual as well as the combinations of SRI components and their impact on rice
yields to smallholder farmers in Tanzania. Therefore, this study contributes to the
knowledge by analyzing various determinants affecting the adoption of SRI components,
as well as their combinations and their impacts on rice yields in Mbarali irrigation
schemes. The findings may be used by the stakeholders involved in strategies and policy
making in rice subsector improvement at local and national levels.
1.3 Study Objectives
1.3.1 General objective
The overall objective of this study was to analyze the adoption of SRI and its impact on
yield in irrigation schemes in Mbarali District.

5
1.3.2 Specific objectives
Specifically the study sought to: i. To determine the extent of SRI components adoption by smallholder rice farmers
in Mbarali District.ii. To analyze the determinants of SRI components adoption by smallholder farmers
in the study area.iii. To analyze the impact of SRI components adoption on yield.
1.4 Research Hypotheses
This study was guided by the following hypotheses;i. Household socio-economic, farm characteristics and institutional factors have no
influence on SRI components adoption.ii. Adoption of SRI components has no impact on yield.
1.5 Organization of the Dissertation
This dissertation is organized into five chapters. The first chapter comprises the
background to the study, the problem statement and its justification, research objectives
and tested hypotheses. Theoretical and empirical literature have been reviewed in the
second chapter. The third chapter presents the methodology used in the study for data
collection and analysis and a description of the study area. The results and discussion of
the findings are presented in fourth chapter, while the fifth chapter presents conclusion
and recommendations.

6
CHAPTER TWO
2.0 LITERATURE REVIEW
2.1 Theoretical Framework
This study is based on adoption and firm theories. The rationale behind this is, farmers
first decide whether or not to adopt an agricultural technology and the decision made
influences the production processes and profitability.
2.1.1 Adoption theory
The adoption theory assumes that, a farmer is an individual and chooses to adopt a new
technology on the basis of rational calculations, given a set of ranked preferences and
access to full information (Ngwira et al., 2014; Hailu et al., 2014). Furthermore, risks and
uncertainty considerations play a crucial role for technology adoption decision (Mwangi
and Kariuki, 2015; Negatu and Parikh, 1999). In line with this therefore, a farmer is more
inclined to adopt SRI if the practice is perceived to have low risk and has positive effect
on rice yields.
2.1.2 Theory of the firm
The theory of the firm assumes that profit maximization is the only relevant goal in
production and other possible goals such as obtaining power or prestige are treated as
unimportant. In this theory, production is refered as the process of combining and
coordinating materials and forces in creation of some good(s) and services (Nicholoson

7
and Snyder, 2005). In this context, therefore, a farmer is more likely to adopt SRI
component combinations only if they have positive effect on profitability.
According to Sadoulet and Janvry (1995), a production function of the firm is given by:
h(q,x,z) =0.........................................................................................................................(1)
where q is output quantity for single product firm, x is the vector of variable input
quantities (such as labour, fertilizer, water, pesticides, seeds and hours of rented tractor
use) which can be purchased in the desired quantities, z is fixed factor quantities that
cannot be acquired in the time span analyzed (such as land, equipment and infrastructure).
If w and p are the prices of inputs and outputs, respectively, the producer’s restricted
profit (profit which only variable costs are subtracted from gross revenues) is given by:
π = pq-wx.........................................................................................................................(2)
The producer is assumed to choose the combination of variable inputs and outputs that
will maximize profit subject to the technology constraint such that:
Max(x,q) pq-wx, s.t.h(q, x,z) =0......................................................................................(3)
From the first order condition for profit maximization the following indirect profit
functon is obtained π (p,w,z).
2.2 Adoption of Agricultural Technologies Among Smallholder Farmers
The economic development literatures have focused on the need to address fundamental
constraints in moving out of poverty in general and improving productivity of
smallholder agriculture in particular. Increasing agricultural productivity is critical to
meet expected rising demand for agricultural products (Hailu et al.,2014). Agricultural
technologies are seen as an important route to move out of poverty in most developing
countries (Mwangi and Kariuki, 2015).
8
According to Muzari et al. (2012) and Lowenberg-DeBoer, 2000, the most common
areas of agricultural technology development and promotion for crops include new
varieties development; plant management; soil management; weed and pest management;
irrigation and water management. Through improved input-output relationships, new
technologies tend to raise output and reduce average cost of production which in turn
results in substantial gains in farm income (Hailu et al.,2014). Mwangi and Kariuki
(2015) argue that, adoption of improved agricultural technologies has been associated
with higher earnings and lower poverty; improved nutritional status; lower staple food
prices and increased employment opportunities.
Despite many proven technologies and improved farming practices hold great promise for
boosting agricultural production and reducing poverty in developing countries, the
adoption of such technologies by smallholder farmers in Sub Saharan Africa, has been
slow, (Duflo et al., 2011; Udry, 2010). The low adoption rates have resulted in persistent
low agricultural productivity in the region (Pan et al.,2015).
Various literatures have documented the factors that determine the agricultural technology
adoption (Kariyasa and Dewi, 2011; Ukudugu et al., 2012; Teklewold et al., 2013;
Ngwira et al., 2014). Loevinsohn et al. (2013), argue that, farmers’ decision about
whether and how to adopt new technology is conditioned by the dynamic interaction
between characteristics of the technology itself and the array of conditions and
circumstances. The diffusion itself results from a series of individual decisions to begin
using the new technology, which are often the result of a comparison of the uncertain
benefits of the new technology with the uncertain costs of adopting it (Barret et al., 2016).

9
In economic analysis of technology adoption, the main concern is the explanation of
adoption behavior in relation to personal characteristics and endowments, imperfect
information, risk, uncertainty, institutional constraints, input availability, and
infrastructure (Varma, 2017; Mwangi and Kariuki, 2015; Manda et al., 2015; Uaiene,
2009). Moreover, social network and leaning have been included in the categories of
factors determining adoption of agricultural technology (Barret et al., 2016). The studies
categorize the agricultural technology adoption determinants into different classes. For
instance, Akudugu et al. (2012), grouped the determinants of agricultural technology
adoption into four categories which are technological factors, economic factors,
institutional factors and household specific factors. The agricultural technology adoption
factors also are grouped into economic, social and institutional factors (Kariyasa and
Dewi, 2011). Ngwira et al. (2014) categorized the factors into farmer characteristics,
farm characteristics, institutional characteristics and managerial while Teklewold
et al. (2013), classified the factors into social capital, farm and household characteristics,
institutional and economic constraints factors.
Inspite of many categories for grouping factors of agricultural technology adoption, there
is no clear distinguishing features between variables in each category. Categorization of
variables is done to suit the current technology being investigated, the location, the
specific preference, or even to suit client needs (Mwangi and Kariuki, 2015). For
instance the level of education of a farmer has been classified as a human capital by some
researchers (Keelan et al., 2014; Mignouna, 2011), while others have classifed it as a
household specific factor (Varma, 2017; Manda et al., 2015). However, the most
important concern in the research, researchers wish to find variables that can provide the
best predictions (Green, 2012; Mishra and Min, 2010).

10
2.2.1 Household characteristics and their influence on agricultural technology
adoption
Household specific characteristics are assumed to have a significant influence on
farmer’s decision to adopt new technologies. Most adoption studies have attempted to
measure household characteristics through the farmer’s age and experience in agricultural
production, education and household size (Mignouna et al., 2011; Teklewold et al., 2013
Kassie et al., 2013; Keelan et al., 2014; Varma,2017). Adoption of agricultural technology
may be affected by age because older farmers are assumed to have gained knowledge and
experience over time and are better able to evaluate technology information than younger
farmers (Kassie et al., 2013; Mignouna et al., 2011; Kariyasa and Dewi, 2011). However,
younger farmers due to their behaviour of risk taking can be more flexible in adopting
innovations than older ones (Manda et al., 2015). Adesina and Zinnah (1993) argue that
as farmers grow older, there is an increase in risk aversion and a decrease interest in
longterm inverstiment in the farm, while on other hand younger farmers are typically less
risk averse and are more willing to try new technologies. Mignouna et al. (2011),
Kariyasa and Dewi (2011), Kassie et al. (2013) and Watcharaanantapong et al.(2014)
found positive relationship between age and adoption decisions while (Teklewold et al.,
2013) found a negative relationship between age and adoption of multiple sustainable
agricultural practices (SAPs) in rural Ethiopia and suggest that, the negative relationship
between the two is influenced by crop stress risk averse of older farmers in the study area
which causes them to be unwilling and relactant to change from old practices to new
ones.
Education of the farmer has been assumed to have a positive influence on farmer’s
decision to adopt new technology since education of the farmer increases his/her ability
to obtain, process and use information relevant to adoption of a new technology

11
(Mignouna et al., 2011). In this context, households with more educated household
members who are involved in decision making are expected to be more aware of the
benefits of new technologies and may increase the likelihood of technology (ies)
adoption since more education influences farmers’ attitudes and thoughts making them
more open, rational and able to analyze the benefits of the new technology (Manda et
al.,2015, Mwangi and Kariuki, 2015). For instance Manda et al. (2015), found the
positive relationship between education and adoption of Sustainable agricultural practices
for maize production in rural Zambia. On other hand, there are authors who reported
significant negative effect of education in relation to agricultural techologies adoption
(Samiee et al., 2009; Uematsu and Mishra, 2010). For instance, Uematsu and Mishra
(2010), in studying the effect of education on technology adoption, reported a negative
influence of formal education towards adopting genetically modified crops since
smallholder farmers with formal education prefered off farm activities than working on
farms.
Labour endowment may be captured using household and active family labour force size
(Varma, 2017). Household size determines adoption process of labour intensive
technologies as a larger household have the capacity to relax high labour demand during
introduction of new technology (Mwangi and Kariuki, 2015). This means that, the larger
the family, the more labour is available for agricultural production (Manda et al., 2015).
However, large family size may increase dependency ratio as may comprise more non
working household members (Kassie et al.,2014). Asfaw et al. (2011), argue that not only
the family size matters in agricultural technology adoption, but the number of active
family members plays a great role for decision making in agricultural technology
adoption. Therefore, family size may not always be a good proxy of labour availability
and that a more precise proxy is active labour force. Teklewold et al. (2013), Noltze et al.

12
(2012) and Varma (2017), documented positive relationship between household size and
agriculutural technology adoption in their studies of adoption of multiple sustainable
agricultural practices in rural Ethiopia, natural resource management technologies
adoption in Timor Leste and adoption of SRI in India respectively. Furthermore, findings
from Asfaw et al. (2011) study, indicated positive and significant effect of active family
labour force size and agricultural technology adoption in Ethiopia.
2.2.2 Farm characteristics and their influence on agricultural technology adoption
Plot characteristics are significant determinants of adoption. Farm size, physical
appearance (level status) of the farm, water availability for irrigation and farm location
are important plot characteristics which influence the adoption of agricultural
technologies (Varma, 2017; Manda et al., 2015; Teklewold et al., 2013). Mandal et al.
(2015) argue that, larger area can be allocated by farmers for improved technology
only if they have enough land to make a trial for a new technology. However, households
with relatively more land may use less intensive farming methods than those with less
land (Kassie et al., 2013). On other hand, Ngwira et al. (2014), argue that farmers with
less farm size are more likely to adopt intensive agricutural technology compared to
those with large farm size. The effect of farm size on agricultural technologies adoption
therefore, depends on respective type of techology (Ngwira et al., 2014). For instance
agricultural mechanization technology is more likely to be adopted by farmer having
more farm size than those with less land holding Watcharaanantapong et al. (2014).
Uaiene et al. (2009), Mignouna et al. (2011), Ngwira et al. (2014) and Manda et al.
(2015) reported a positive relationship between farm size and adoption of agricultural
mechanization in Mozambique, imazapyr-resistant maize technology in Western Kenya,
conservation agriculture in Malawi and SAPs in rural Zambia respectively.
Contrary,Varma (2017), found negative relationship between the two in his study on
adoption of SRI in India. Other studies have reported insignificant or neutral land size

13
relationship with adoption. For instance Kariyasa and Dewi (2011), noted that land size
has no significant effect on the degree of integrated crop management (ICM) adoption for
Indonesian farmers.
Physical appearance of the farm plays an essential role in decision making for adoption
of agricultural technology. According to Manda et al. (2015) and Teklewold et al. (2013),
plots with steep slopes are susceptible to run off and soil erosion which may lead in
adopting the technology such as cover plants to reduce the effects. According to Varma
(2017), poor land terrain is one of the most important deterrents of adoption of SRI in
India.
Adquate water availability for irrigation plays an important role in agricultural
production. Noltze et al. (2012) argue that, although some agricultural technologies and
practices such as SRI require less water, timely and adquate amount of water is required.
In line with this, many studies have highlighted the importance of water availability
through irrigation as important factor in influencing decision to adopt farming
technologies (Noltze et al., 2012; Takahashi, 2013; Castle et al., 2016; Varma, 2017).
The availability of water for irrigation has been postulated to have a positive impact on
irrigated agricultural technologies adoption due to the increased intensity and need of
irrigated agricultural production to increase yield and gross farm income (Takahashi,
2013; Castle et al., 2016).
Moreover, Takahashi (2013), documented that, location of the farm relative to irrigation
scheme direction has significant effect on decision of adopting agricultural technologies.
Due to unequal water availability in irrigation schemes, farmers whose farms are located
in uptreaam have comparative advantage for adopting agricultural technologies related

14
with irrigation than those in downstream (Ghosal and Yihdego, 2016). In studying
adoption, diffusion and impact of SRI in rural Bangladesh, Barret et al. (2016), reported
that, farmers in neighbouring plots need to agree on timing of irrigation to enable water
availability for irrigation and reveal that unavailability of water in all plots on time,
affects timely land preparation and transplanting as recommended by the SRI technique,
hence affecting its adoption.
2.2.3 Access to off farm activities and assets and their influence on agricultural
technology adoption
Access to off-farm income and assets owned by a farmer are important measures of
household wealth and can therefore influence the household decision making in
agricultural technology adoption due to facilitation of timely farm activities
acomplishment (Mwangi and Kariuki, 2015; Teklewold et al., 2013). Off farm activities
and income have been shown to influence technology adoption decision and can be
positive or negative. Diiro (2013), documented that off farm activities generate income
which acts as an important source of capital for overcoming credit constraints faced by
the rural households in many developing countries and acts as a substitute for borrowed
capital in rural economies where credit markets are either missing or dysfunctional. Notze
et al. (2012), reported that off- farm income is expected to provide farmers with liquid
capital for purchasing productivity enhancing inputs such as improved seed and
fertilizers. For instance, in studying the impact of off-farm earnings on the intensity of
improved maize varieties adoption and maize farming productivity in Uganda, Diiro
(2013) reported a significantly higher adoption intensity and expenditure on purchased
inputs among households with off-farm income compared to their counterparts without
off- farm income.
15
On other hand, Mathenge et al. (2014) and Manda et al. (2015), documented the negative
effect of off farm activities and income on decision to adopt improved agricultural
technologies. Manda et al. (2015) argue that, the relationship between off farm income
and technology adoption can be negative because off-farm activities divert time and effort
away from agricultural activities and reduce availability of labour. Therefore, better
access to off-farm activities might divert the resources away from agriculture to off farm
activities, resulting in less resource allocation for farm activities.
The ability of the farming households to cope up with production is influenced by an
increase in stock of productive assets which may provide the capital or may be used to
accomplish the farm activities (Gebremariam and Wünscherb, 2016). The ability of doing
farm activities due to productive assets own may inturn influence the household decision
in agricultural technology adoption. In the adoption studies of SRI in India and SAPs in
Ghana, Varama (2017) and Gebremariam and Wünscherb (2016) respectively, noted the
significant and positive effect of owned assets by farmers on adoption.
2.2.4 Access to extension services, information and credit and their influence on
agricultural technology adoption
Access to extension services, information and credit have been found to influence
technology adoption. Farmers are usually informed about the existence as well as the
effective use and benefits of new technology through extension agents who act as a link
between researchers and users of that technology (Mwangi and Kariuki, 2015). Extension
is a source of information for many farmers, either directly, through contact with
extension agents, or indirectly, through farmers who have prior exposure transmitting
information to other farmers. The direct contact between extension agents and farmers is
measured by the frequency of extension contact related to respective agricultural
technology, while indirectly through other farmers is a purposeful way of gathering

16
information which includes that acquired from social networks (Manda et al., 2015;
Teklewold et al., 2013). Barret et al. (2016), in studying the SRI adoption and diffusion in
rural Bangladesh reported that, access to extension services helps to reduce transaction
cost which would be incurred when passing information on the new technology to a
large heterogeneous population of farmers in the study area. Most authors have
documented a positive and significant relationship between access to extension services
and technology adoption in agriculture (Castle et al.,2016; Gebremariam and Wünscherb,
2016; Manda et al., 2015; Hairu et al., 2014; Notze et al., 2012; Mignouna et al., 2011;
Uaiene et al., 2009). However, Varma (2017) and Teklewold et al. (2013), found the
insignificant relation in terms of number of extension agents contantact with farmers and
adoption of agricultural technology.
Information acquisition about a new technology is another factor that determines its
adoption. This enables farmers to learn about the existence of as well as the effective use
of technology and hence facilitates its adoption (Mwangi and Kariuki, 2015). According
to Barrett et al. (2016), farmers only adopt technologies they are aware of or have heard
about them and which are perceived to reduce the production uncertainty. In this regard,
the individual’s assessment may change from purely subjective to objective over time.
Nevertheless access to information about a technology does not necessarily mean it will
be adopted by all farmers. The study by Uaiene et al. (2009), suggests that, this simply
implies that farmers may perceive the technology and objectively evaluate it differently
than scientists. Access to information may also result to disadoption of the technology.
For instance, Barrett et al. (2016) argue that, where experience within the general
population about a specific technology is limited, more information induces negative
attitudes towards its adoption. That is probably due to more information with unclear
explanation about the technology exposes an even bigger information vacuum, hence

17
increasing the perception of the risk associated with it. However, many authors reported a
significant and positive impact of accessibility to information on adoption of agricultural
technologies (Varma, 2017; Castle et al.,2016; Barrett et al., 2016; Manda et al., 2015;
Teklewold et al., 2013).
Credit access has been reported to stimulate technology adoption since it reduces
liquidity problems that households face while intending to purchase agricultural inputs
and financing farm activities. Hailu et al. (2014) found that, access to credit paves the
way for timely application of inputs and acomplishment of various farm tasks, thereby
increasing the overall productivity and farm income. In line with the argument by Hailu
et al. (2014), Okuthe et al. (2013) reported significant positive effect of access to credit
in adoption of improved sorghum varieties and technologies by smallholder farmers in
South-Western Kenya. Furthermore, the significant and positive relationship between
acess to credit and adoption is revealed by Alcon et al. (2011), in their study on adoption
of drip irrigation technology in South Eastern Spain. However, access to credit has been
found to be gender biased in some countries where female-headed households are
discriminated by credit institutions, and as such they are unable to finance yield raising
technologies, leading to low adoption rates (Muzari et al., 2013).
2.3 System of Rice Intensification
SRI involves changing a range of rice management practices in which the management of
soil, water, plant and nutrients is altered in order to achieve greater root growth and to
nurture microbial diversity resulting in healthier soil and plant conditions. The SRI
practices enhance the rice plants’ growing conditions by reducing the recovery time
seedlings need after transplanting; reducing crowding and competition; promoting greater
root development; and optimizing soil and water conditions (Barrett et al., 2016). As

18
opposed to conventional rice production, SRI involves transplanting seedlings at an
early stage (8-15 days seedling), transplanting a single seedling per hole within 30
minutes of removal from the nursery, wider spacing of 25 cm x 25 cm, rotary weeding to
promote soil aeration which invigorate microbial activities and promote a healthy root
system, increased use of organic fertilizer to enhance soil fertility and intermittent water
application, so that soil is kept moist but not flooded (Barrett et al., 2016; Ijogu, 2016;
Tusekelege et al., 2014; Katambara et al., 2013).
SRI has been acknowledged worldwide by various literatures as a rice cultivation practice
that is characterized by water and inputs saving practices during rice production process.
However, it is knowledge and labour intensive technique (Barrett et al., 2016; Takahashi,
2013). Since its introduction by Fr. Henri de Laulanie S.J. in 1980s in rural Madagascar
after a series of observations from farmers' fields and his experiments with various
practices of the crop, SRI practices have been widely promoted globally (Barrett et al.,
2004; Katambara et al., 2013; Barrett et al., 2016). However, the factors influencing the
adoption as well as adoption impacts have been a subject of debate (Varma, 2017; Noltze
et al., 2013).
In studying SRI adoption, diffusion and impact in Rural Bangladesh, Barrett et al. (2016),
found that, there is significant difference in adoption among farmers in terms of SRI
components. The results reveal that most farmers in the study area follow transplanting
age of seedlings, number of seedlings per hole and irrigation as recommended. However,
findings indicate that as the days went on a large number of farmers disadopted some SRI
practices or abandoned all practices due to disagreement with neighbours about timing of
irrigation. Evidence from various studies (Ijogu, 2016; Takahashi and Barrett, 2014;
Styger et al., 2011; Barrett et al., 2004), show a yield gain of above 60% in SRI
production. However Barrett et al. (2004) reported the risk associated with early

19
transplanting and water management changes limits SRI adoption among farmers in
Malagasy.
Devi and Ponnarasi (2009), in studying the economics of modern rice production
technology and its adoption in Tamil Nadu argue that, total cost of production per hectare
in the study area was lower by 10% in SRI method compared to conventional method but
costs of machine, labour and fertilizers were observed to be higher in SRI method
compared to conventional method. Durga and Kumar (2013) in analysing the economics
of SRI in South India found that, farmers in conventional method incur more costs than
those using SRI methods. However, Durga and Kumar (2013), found that fertilizer costs
were lower in SRI compared to conventional method due to higher dose of fertilizer
requirement in conventional method of rice production. These results on fertilizer costs
contradict those found by Devi and Ponnarasi (2009). Varma (2017) in studying adoption
of SRI and its impacts on yield and household income, found that the welfare impacts of
SRI adoption for all combinations of SRI individually and as a group had an impact on
yield. However, the study revealed that the impact of SRI adoption on household income
was quite mixed. Contrary to other studies such as Devi and Ponnarasi (2009), Durga and
Kumar (2013) and Varma (2017), whose findings revealed that under SRI the yield is
higher while the total cost of rice production is lower compared to conventional method,
Tusekelege et al. (2014), argue that, the yield is higher in SRI than in conventional but the
total cost of rice production per hectare is also high in SRI than in conventional method.
However, the study concluded that, due to high yield, SRI technique of rice production is
more profitable compared to the conventional practices. The adoption of SRI practices
and impact of adoption, therefore tend to vary (Notze et al., 2012).
The variation in adoption, yield, costs and profitability in rice production methods is
attributed by the characteristic of the farms, ecological differences and implementation
strategies (Noltze et al., 2013; Barret et al., 2004). Moreover, Noltze et al. (2012) suggest

20
that, contradictory findings about SRI impacts may be due to farmers’ adoption of SRI
components and practices in different combinations. Noltze et al. (2013), argue that,
more researched evidences on making conclusions about SRI technique in rice production
for respective ecologies are necessary. Despite several empirical documentations on SRI
and a number of promising benefits it offers, there is scant and limited empirical
evidences on the determinants of its components adoption and impact on yield to
smallholder rice farmers in Mbarali District. This study was intended to address this
knowledge gap.
2.4 Analytical Techniques for Agricultural Technology Adoption and Impact in
Multiple Alternatives
In descrete choice,an individual makes choice between alternatives which can be binary
or unordered multinomial or ordered multinomial. In unordered multinomial case, the
observed response is simply a label for the selected choice and numerical assignments
are not meaningful in this setting (Green, 2012). Although numerical outcomes are
merely labels of some non quantitative outcome, the analysis in unordered multinomial is
nonetheless have a regresson style motivation and models are based on the idea that
factors such as household socioeconomic factors, technological, institutional and
environmental factors are relevant in explaining the consistent and unbiased parameter
estimates as the maximum likelihood estimation of observed choices (Beyene and Belay,
2013; Ghosal and Yihdego, 2016; Green, 2012). The alternative chosen by an individual
inturn has an effect on the outcome of interst (Manda et al., 2015; Notze et al., 2012)
2.4.1 Analytical techniques for agricultural technology adoption in multiple
alternatives
When farmers face more than two choices for technology adoption, multinomial models
are more appropriate. Multinomial analytical techniques include models such as
21
multivariet probit model, multinomial endogenous treatment effects and multinomial
endogeneous switching regresion model (Gebremariam and Wünscherb, 2016; Mutenji et
al., 2016; Manda et al., 2015; Teklewold et al., 2013; Green,2012; Deb and Trivedi,
2006b). The multivariate probit (MVP) is the econometric technique which
simulteneously models the effect of the set of explatory variables on each of the
practices while allowing the unmeasured factors (error terms) to be freely correlated due
to complementarities and substitutabillities between different practices (Kassie
et al.,2013).
However, Kassie et al.(2014), argue that farmers may endogenously self-select adoption
or non-adoption and decisions are likely to be influenced systematically by observed and
unobservable characteristics. Farmers may decide to adopt a technology based on
unobservable factors such as their innate managerial and technical abilities in
understanding and using the technology (Abdulai and Huffman, 2014).
The multinomial endogeneous models such as multinomial endogenous treatment effects
and multinomial endogeneous switching regresion are the new selection bias correction
models which take into account the interdependence of the adoption decisions and
selection bias as a result of observed and unobserved characteristics (Varma, 2017;
Mutenji et al., 2016; Gebremariam and Wünscherb, 2016; Di Falco and Veronesi, 2013;
Notze et al., 2012). Although these models are similar as both account for multiple
selection scenario and selection bias resulting from observed and unobserved
characteristics, they have substantial difference in computation and implementation. Deb
and Trivedi (2006b) and Manda et al. (2015), documented that, compared with the
computationally cumbersome of multinomial endogenous switching regression model, the
multinomial endogenous treatment effect model is easier to implement and allows the

22
distribution of endogenous treatment and outcome to be specified using latent factor
structure, there by allowing a distinction to be made between selection on unobservables
and observables.
2.4.2 Analytical techniques on impact of agricultural technology adoption
The impact of adopted technology on the outcome of interest may be analyzed using
quasi experimental designs by identifying a comparison group that is as similar as
possible to the treatment group in terms of baseline (pre-intervention) characteristics
(Ghosal and Yihdego, 2016). The comparison group which is created using various
methods such as propensity score matching (PSM) and regression discontinuity design
(RDD), captures what would have been the outcomes if the technology had not been
adopted (the counterfactual) (Takahashi, 2013). Hence the technology adopted can be said
to have caused any difference in outcome variable between the adopters (treated group)
and non adopters as the comparison group (Takahashi and Barrett, 2014; Kassie et al.,
2014).
The impact analysis techniques using counterfactual group reduces the risk of selection
bias that may be caused with the possibility of those who choose to adopt the technology
being systematically different from non adopters and the observed outcome between the
two groups in the indicator of interest may be due to imperfect match than caused by
adoption. However, the main drawback of these impact analytical techniques relies on
matching individuals on the basis of observable characteristics linked to predict likelihood
of adoption (Khandker et al., 2010). The presence of any unobserved characteristics that
affect participation in the practice and which change over time, lead to biased estimates
and thus affect the observed outcome of interest and conclusion (White and Sabarwal,
2014). Hence, to account for endogeneity and self selection bias, various literatures (Di
23
Falco and Veronesi, 2013; Abdulai and Huffman, 2014; Manda et al., 2015; Gebremariam
and Wünscherb, 2016; Varma, 2017) recommend the use of multinomial endogenous
analytical methods which take into consideration for endogeneity and self selection
factors among farmers.
Therefore, due to self selection in multiple scenario of SRI component combinations and
the fact that the unobserved factors such as technical management and ability of farmers in
understanding new practices and information asymmetry can affect decision to adopt SRI
component combination and also have influence on outcome variable(yield), the
determinants of SRI components adoption and impact of the adopted component
combinations on yield were addressed by Multinomial endogenous treatment effects
model in its two stages.
CHAPTER THREE
3.0 RESEARCH METHODOLOGY
3.1 Conceptual Framework
Rice productivity is highly influenced by irrigation and agronomic practices adopted such
as SRI (Varma, 2017; Durga and Kumar, 2013; Notze et al., 2012). However, the

24
decision of farmer to adopt SRI components may be determined by household
socioeconomic characteristics such as education level of household head, experience in
rice production, access to off farm activities and income, farm assets and active family
labour force; Farm characteristics which include farm size, farm level status, location of
the farm in irrigation scheme and availability of water for irrigation; and institutional
factors such as access to credit, extension services and information. Then the adopted SRI
components affect the rice yield (Fig.1)
Figure 1: SRI adoption and impact conceptual framework Source: (Field data, 2018)
3.2 Theoretical Model
3.2.1 Rondum utility model (RUM)
According to homus economicus assumption for an individual choice, if a person chooses
a particular action or object it means the action or object maximizes the utility of that
person. According to Nicholoson and Snyder (2005), utility is the overall satisfaction
which an individual gains from making a certain choice. The ith smallholder rice farmer
therefore, chooses SRI component combination j, instead of implementing any other
practice k, if and only if utility derived by the chosen SRI component combination j is
higher than that derived through implementation of any other practice k (Uij>Uik), where
k≠j.
Adoption of SRIcomponents
Increased rice yield
Farm factors (farm size,farm level status, location of the farm in the scheme, availabilityof water for irrigation)
Household socio economic characteristics (household head education, experience in rice production, access to off farm activities and income, farm assets, active family labour size)
Institutional factors (Access to credits, extension services and information)

25
The utility derived by ith smallholder rice farmer from making a certain choice of SRI
component combination j, is presented in equation 3:U*ij = zij +ij……………………………………………..……………..……………..(4)Where, U*ij = Utility derived by ith smallholder rice farmer from making choice of jth SRI
component combination. zi = A vector of explanatory variables which affect the probability of choosing SRI
component combination j which in this study include: Education level of smallholder
rice farmer, size of active family labour force, experience in rice production, value of
farm assets owned, access to off farm activities, rice farm size, level status of the
farm field, location of the farm in irrigation scheme, adequate availability of water
for irrigation, credit facilities availability, number of farmers contact with extension
agent and information about SRI. j = A column vector of parameters associated with the explanatory variables. ij = Error term for ith smallholder rice farmer associated with jth SRI component
combination.
3.3 Methods of Analysis
The data analysis was based on descriptive statistics and multinomial basing on two stage
sampling design using stata. Comparison of means was done using t-test and Chi square
test was used to determine the existence of association between qualitative variables. The
details of analytical methods by objectives are presented below.
3.3.1 Extent of SRI components adoption by smallholder rice farmers
The extent of SRI components adoption was estimated as a percentage of area under rice
production allocated to SRI, by smallholder rice farmer. The SRI adoption in this study
was considered as the choice of five combinations comprising three major SRI
components of plant management, soil management and water management. From
smallholder farmers adopting SRI from partial to complete package adoption, the
26
percentage of allocated area to SRI relative to total rice cultivated land by smallholder
farmer was estimated.
3.3.2 Determinants of SRI components adoption and impact of adopted component
combinations on yield
In adopting SRI technique, smallholder farmers self select to adopt or not to adopt a
respective SRI component combination among four SRI component combinations (Plant
management; plant and soil management; plant and water management; and plant, soil
and water management combination). In choosing the SRI component combination to
adopt, the decisions are likely to be influenced by unobserved factors such as ability of
farmers in understanding SRI package combinations and information asymmetry about
SRI that can affect decision to adopt SRI component combination and also have influence
on outcome variable (rice yield). In this context therefore, to disentangle the pure effects
of adoption, the determinants of SRI components adoption and impact of adopted
component combinations on yield were addressed by multinomial endogenous treatment
effects model in its first and second stages respectively.
3.3.2.1 Determinants of SRI components adoption
In first stage, SRI major components (plant management, soil management and water
management) combinations were assumed to be chosen by smallholder farmer through
comparison of alternative combinations for farmer’s utility maximization. The ith farmer
therefore chooses a SRI component combination j, over any alternative combination k, if
Uij>Uik, k≠j. Let Uij denote the utility associated with the jth SRI practice, where j=0,1, 2, 3,4 for
farmer i: U*ij = zij j
k=1����j ij .............................................................................................. (5)Where: zi = Household socioeconomic, institutional and farm factors affecting decision for jth
SRI component combinations adoption (Table 1).

27
j = Corresponding parameters associated with jth SRI component combination. ij = Error term for ith smallholder rice farmer associated with jth SRI component
combination. �ij= Latent factor that incorporates the unobserved or unquantifiable characteristics (ability
of farmers in understanding SRI package combinations and information asymmetry about
SRI) and these unobservable can affect decision to adopt SRI component combinations
and also have influence on rice yield as outcome variable. While U*ij is not observed, we observe the choice of SRI component combinations in the
form of binary variables dij which are collected by a vector, dij= di1, di2,..., diJ. Similarly, let
�ij = �i1, �i2,………. �iJ. In this therefore, the probability of treatment can be represented
as:Pr (� j� │� ,� �i) = �(�i1�1+ �1�i1 + �i2 �2 + �2 �i2 ....+ �′ j� �� + ���ij....................................(6)Where: dij = The observable binary variables representing the choice of SRI component
combination as a vector of dij = (di1, di2,...,diJ), ��j = Latent factor incorporating unobserved or unquantifiable characteristics
�ij = (�i1, � i2,..., �i J ).g = Appropriate Multinomial probability distribution which has a Mixed Multinomial
Logit(MMNL) structure, defined as: Exp (zij +j�ij)
Pr (� j� │� , � �i) = ..........................................................(7) 1+ J
j=1exp (zij + j�ij)
Specification and description of variables expected to influence SRI component
combinations adoption
Based on economic theory and empirical studies on adoption, various socioeconomic
characteristics (education of smallholder farmer, active of family labour force size,
experience in rice farming, value of farm assets owned and accessibility to off farm
activities); farm characteristics (farm size, level of the farm, location of the farm in the
irrigation scheme and adequate availability of water for irrigation) and institutional
factors (credit facilities availability, number of extension agencies contacts and training
28
on rice production and accessibility to information about SRI) expected to be the driving
factors for decisions on SRI component combinations adoption in the study area. The
variables are presented and described as follows: Education level of smallholder farmer: A dummy variable assigned a value of one if
smallholder farmer has post primary school education and zero if has no formal education
or has primary education. Education level of smallholder farmer expected to have a
positive effect on SRI components adoption decision since those farmers with post
primary school education are expected to have more ability to obtain, process and use
information relevant to adoption of SRI component combinations and more aware of
adoption benefits (Mignouna et al., 2011; Manda et al.,2015).
Size of active family labour force: This variable was measured as a count variable by
taking the number of household members involved in rice farming activities. The variable
was expected to affect SRI component combinations adoption positively. This is because,
larger size of active family labour force relaxes high labour demand technologies like SRI
(Asfaw et al., 2011).
Experience in terms of years in rice production: The relationship between the
experience in rice farming and SRI adoption was captured by number of years in rice
production. The influence of experience in rice production on SRI adoption expected to
be indeterminate. Experienced farmers may be better in evaluating technology than
younger farmers hence more likely to adopt SRI (Kassie et al., 2013). Contrary, more
experienced farmers may be less responsive to change from conventional to SRI
technique (Varma, 2017). Value of farm assets: This is the total value of farm assets owned by smallholder farmer
such as hand hoe, oxen, ploughs, powertilers and tractors. The value of an asset was
measured as continuous variable using market price of the respective farm asset. Farm
assets value is the proxy for wealth of household which may provide capital to enable
29
timely accomplishment of farm practices and coping with production risk associated with
delay in crop production (Teklewold et al., 2013). Farmers with low total value of farm
assets therefore, were anticipated to be less likely to adopt SRI components.
Access to off farm activities: It was specified as a dummy variable taking the value of
one if the smallholder farmer has access to off farm activities and zero otherwise. Off
farm activities generate income which is expected to provide farmers with liquid capital
for farm activities accomplishment. This therefore may increase the likelihood decision of
farmers to adopt SRI compared to those without access to off farm activities (Notze et al.,
2012). However, access to off-farm activities might divert the resources away from
agriculture to off farm activities, resulting in less resource allocation for farm activities
and thus less likelihood of adoption of labour intensive technology such as SRI
(Mathenge et al., 2014). Following these arguments, the effect of access to off farm
activities in SRI component combinations adoption was expected to be indeterminate. Farm size: It is a continuous variable, which represents the total area under rice in
hectares. Larger area can be allocated by farmers for improved technology only if they
have enough land hence increasing the likelihood of adoption (Manda et al., 2015).
However the owners of relatively more land may prefer to use less intensive farming
methods compared to owners of less land farmers (Kassie et al., 2013). The effect of farm
size on SRI components adoption therefore, is postulated indeterminate.
Level of the farm: This is the physical appearance of rice plot. Level of the farm was
measured as dummy variable with a value of one if the farm is leveled, zero if not
levelled. As the leveled farms enable the control of water for irrigation and early
seedlings transplanting (Notze et al., 2012), it was predicted that farmers whose farms
have been leveled are more likely to adopt SRI components than those whose farms are
unleveled.

30
Water availability for irrigation: It was captured as the dummy variable taking the
value of one if water was available for irrigation when needed and if water is not
available when needed for irrigation. It is expected that, smallholder farmers whose farms
get water when needed for irrigation are more likely to adopt SRI components. This is
due to the fact that water availability when needed reduces the water risk which may
occur due to wetting and drying practices in rice production using SRI technique hence
increasing the possibility of smallholder rice farmers to adopt SRI package combinations
(Takahashi, 2013).
Location of the farm in irrigation scheme: This is the position of a rice farm in relation
to water flow direction in the irrigation scheme where the farm may be at upstream or
downstream. The variable was measured as dummy variable with one value if the farm is
located at upstream and zero otherwise. In most irrigation schemes, farmers whose farms
are located in upstream have comparative advantage of getting water than those in
downstream (Ghosal and Yihdego, 2016). Thus, it was expected that, upstream location
of the smallholder’s farm increases the likelihood of SRI components adoption relative to
downstream location.
Access to Extension services and information: For the farmer to be aware of the
benefits of a new technology like SRI, the access to information and extension services
play a great role (Notze et al., 2012). The accessibility of extension services is proxied by
the number of contacts smallholder rice farmers had with extension agents per cropping
season. It was anticipated that since SRI is the knowledge based technique, the number of
contacts with extension staff, positively influence the decision to adopt the technique
components.
In line with extension services, the accessibility to information was specified as dummy
variable taking the value of one if the smallholder farmer had information concerning SRI
from government or development partners and zero otherwise. It was postulated that

31
accessibility to information about SRI from government or development partners
increases the likelihood of its component combinations adoption.
Access to credit: This was captured as a dummy variable taking the value of one if the
respondent accessed credit in terms of cash or inputs (seeds, fertilizers and herbicides) in
respective cropping season and zero otherwise. Credit is an important source of working
capital which may be used to accomplish various farming activities and reduces the
liquidity problem that could be faced by smallholder farmer in farming practices
(Hailu et al., 2014; Okuthe et al., 2013). In this context, it was predicted that smallholder
farmers who have access to credit are more likely to adopt SRI components than those
who have no access to credit.
Table 1: Summary of explanatory variables for SRI component combinations choice Variable name Type of the
variableExpected Effect
Socioeconomic Factors
Education level of smallholder rice farmer(z1) Dummy +
Size of active family labour force. (z2) Count +Experience in rice production (z3) Continuous +Value of farm Assets owned (z4) Continuous +Access to off-farm activities (z5) Dummy +Farm FactorsRice farm size (ha) (z6) Continuous +Level of the farm (z7) Dummy +Location of the farm in irrigation scheme (z8) Dummy +Adequate availability of water for irrigation (z9) Dummy +Institutional FactorsCredit facilities availability (z10) Dummy +Number of farmers contacts with extension agents (z11) Continuous +Information about SRI (z12) Dummy +
3.3.2.2 Impact of SRI components adoption on yield
The impact of adopted SRI component combinations on yield is proxied by the effect of
adopted SRI components package on rice yields per hectare. The study estimates the
productivity in terms of rice yields per hectare and identifies which package(s) produced
the highest impact on yield. The impact of adopted SRI component combinations on
outcome variable (Natural logarithm of rice yield was used because yield is non negative
32
variable), was undertaken in the multinomial endogenous treatment effects model second
stage by using the outcome equation, which is defined as:
E(yi│��, x�, � � ) = xiβi + Jj=1 γj dij + J
j=1λj�ij ...................................................(8)Where: yi = Rice yield for farmer i xi = set of exogenous variables (education level of smallholder rice farmer, size
of active, family labour force, experience in rice production, value of farm
Assets owned, access to off-farm activities, rice farm size, level of the
farm, location of the farm in irrigation scheme, adequate availability of
water for irrigation, credit facilities availability, number of farmers contacts
with extension agents and information about SRI )with associated
parameter vectors βi, ��j = The observable binary variables representing the choice of SRI component
combinations as a vector of dij = (di1, di2,...,diJ) γj = Treatment effects relative to the control group (i.e. SRI non-adopters), ��j = Latent factor incorporating unobserved or unquantifiable characteristics � ij = (�i1, � i2,..., �i J ). λj = Factor-loading parameter which indicates the positive or negative
correlation between the adoption of SRI component combinations and
rice yields through unobserved characteristics.Since outcome variable (the rice yield) is continuous variable, the normal (Gaussian)
distribution function was assumed.
3.4 Description of the Study Area
This study was conducted in Mbarali Distirict, Mbeya Region, Southern Highlands of
Tanzania. Geographically, Mbarali District lies between latitudes 70 and 90 South of the
Equator and between longitude 330.8 and 350 East of Greenwich. The District is bordered
by Iringa Rural in the North - East, Wang’ombe District in the South - East, Makete
District in the South, Mbeya Rural District in the West and Chunya District in the
North. The District has 16 000 square kilometres, among which 4 755 square kilometres
is suitable for agricultural production. The area is characterized by flat land and rice
production in irrigation schemes is the most economic activity, accounting for 26%
33
(52 000 ha) of the total arable land potential for agriculture in the District (Mbarali,
2016). Indiarangi, Fayadume, and mwendambio are the mostly local rice varieties grown
while SARO5 is the improved variety mostly grown in the district.
According to 2012 National Population and Housing Census, the District had 20 Wards,
99 villages and a population of 300 517 people, out of whom 145 867 (48.5%) were
males and 154 650 (51.5%) were females. The total households were 69 888 with 46% of
the total population working force.

34
Figure 2: Representation of the study area
35
3.5 Research Design
3.5.1 Sampling procedure and sample size
The target population in this study was smallholder rice farmers in irrigation schemes in
Mbarali District. Two stage sampling design was used. In the first stage, three (3)
irrigation schemes were selected out of 31 irrigation schemes using probability
proportional to size (PPS) and following cumulative method (Appendix 1).
In the second stage simple random sampling was used in selecting 106 (with stratification
of 53 SRI adopter and 53 SRI non adopters) smallholder farmers from each irrigation
scheme selected in first stage (Table 2). The sample size of 379 was obtained using formula as adopted from Kothari (2004); ns= Z 2 pgN ....................................................................................................(9) e2(N-1)+ Z2pg
ns = 1.962 *0.5 *0.5 *27 526 = 378.8859342 ≈ 379 0.052(27 526-1) + 1.962*0.5*0.5where:ns = Sample sizeN= Total study population Z= Standard variate at a given confidence level p =sample proportion g = 1-p e = acceptable error (the precision)In this study, sample proportion of 0.5 and 95% confidence interval were used which led
to Z= 1.96; g =0.5 and e = + 5%. However, due to time and financial resource
constraints, the sample size was reduced to 318. The sample was stratified into two
groups of smallholder farmers who were SRI users and non users.
Table 2: Irrigation schemes used for the study
Irrigation scheme Number of respondents
SRI adopters SRI non adopters Total
Mbuyuni 53 53 106Madibira 53 53 106Mwendamtitu 53 53 106
Total 159 159 318
36
3.5.2 Data collection methods
This study was a cross sectional which involved the collection of data from the
smallholder rice farmers in irrigation schemes for a single cropping season of 2016/17.
Primary data were collected using structured questionnaire which was administered to
respondents through face to face interviews. The interviewed respondents were the heads
of the households chosen to be part of the sample. The spouse or any senior family
member who directly involved in rice farming was interviewed in the absence of the
household’s head. The questionnaire was designed to capture data on various
determinants affecting the adoption of SRI major components, as well as their
combinations and impacts on rice yields to smallholder farmers.
The collected data included smallholder farmers characteristics data (education level,
active family labours, experience in rice farming, value of farm assets owned and access to off farm activities), credit and extension services data (credit facilities availability and
number of extension agencies contacts with smallholder farmers and training on rice
production), farm characteristics data (farm size, farm level status, location of the farm in
the scheme and irrigation water availability), adopted SRI components and rice yields.
Data from key informants were collected using a checklist so as to complement with
information from individual smallholder farmers.
3.5.3 Data processing and analysis
Prior to analysis, data from the field were processed. This involved the questions coding,
data cleaning and entry. In addition new variables were created when necessary. The
created variables include: Plant management package variable was created from field
data for smallholder rice farmers who practice early rice seedlings transplanting in 8-15
days, transplanting a single seedling per hole and wider spacing of 25 cm x 25 cm; Plant
and soil management components combination variable was created from smallholder
rice farmers information who apply plant management practices plus early and regular
37
(about three times or more) weeding per cropping season and use of organic fertilizers to
enhance soil fertility; plant and water management package was formulated from
smallholder farmers who apply plant management practices plus intermittent water
application (wetting and drying of rice field so that soil is kept moist but not flooded);
while plant, soil and water management combination was created from farmers’
information applying plant, soil and water management practices as recommended in SRI.Furthermore, the household active labour force size variable was created from the number
of household members involved in farming activities for four months or more in a single
cropping season. The output and inputs average prices were used in computation of
revenue and variable costs respectively. Furthermore, the restricted profit was calculated
as the difference between revenue and variable costs. The processed data were analyzed
to get descriptive statistics results and econometric analysis parameter estimates.
CHAPTER FOUR
4.0 RESULTS AND DISCUSSION
4.1 Pattern of SRI Adoption
The adoption of SRI is not a simple yes or no decision. SRI is introduced in packages that
include three components of plant, soil and water management. The adoption pattern of
SRI component combinations in the study area is presented in Fig. 3. The results indicate
that, partial adoption of SRI practices dominates. Among farmers using SRI, only 37%
was found to adopt a full package comprising of plant, soil and water management
practices. Plant management only is the least adopted SRI component, being used by only
17% of SRI adopters.
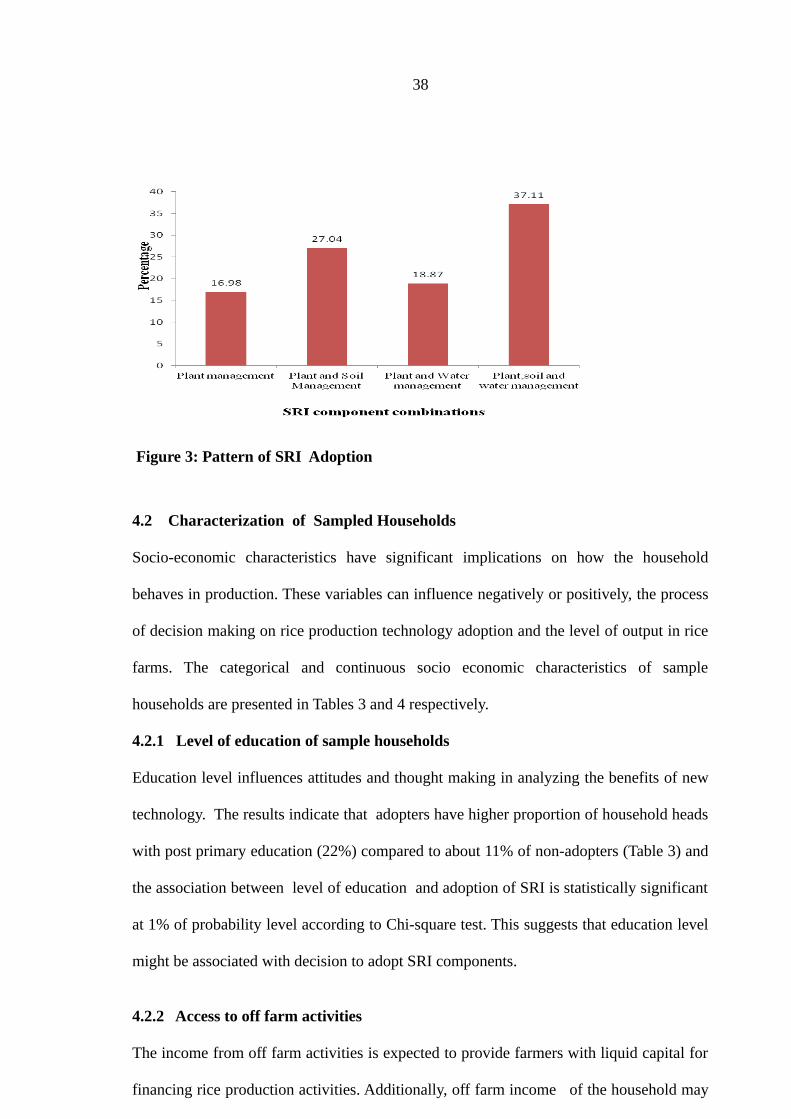
38
Figure 3: Pattern of SRI Adoption
4.2 Characterization of Sampled Households
Socio-economic characteristics have significant implications on how the household
behaves in production. These variables can influence negatively or positively, the process
of decision making on rice production technology adoption and the level of output in rice
farms. The categorical and continuous socio economic characteristics of sample
households are presented in Tables 3 and 4 respectively.
4.2.1 Level of education of sample households
Education level influences attitudes and thought making in analyzing the benefits of new
technology. The results indicate that adopters have higher proportion of household heads
with post primary education (22%) compared to about 11% of non-adopters (Table 3) and
the association between level of education and adoption of SRI is statistically significant
at 1% of probability level according to Chi-square test. This suggests that education level
might be associated with decision to adopt SRI components.
4.2.2 Access to off farm activities
The income from off farm activities is expected to provide farmers with liquid capital for
financing rice production activities. Additionally, off farm income of the household may

39
affect the likelihood of agricultural technology adoption by providing the source of cash
flow to buffer the risk associated with agricultural product on failure due to the adopted
technology. The results show that about 61/% of adopters had access to off farm
activities and income, while for non adopters about 50% had accessibility to off farm
activities and income (Table 3). Chi-square test indicates the statistically significant
association between adoption of SRI package combinations and accessibility to off farm
activities at 5% level of probability. This contradicts with Varma (2017), whose results
revealed that access to off farm activities was generally better among the SRI non
adopters in India. The distribution of SRI adopters across the components show that
plant and water adopters have minimum accessibility to off farm activities (9%) while
plant, soil and water management adopters have the maximum accessibility (26%).
Table 3: SRI adoption Status by level of Education and access to off farm activities
Variable Category Nonadopters(n=159)
Adopters 2 -ValuePlant
Mgt (n1
=27)
Plantandsoil
Mgt(n2=4
3)
Plantand
waterMgt
(n3=30)
Plant,soil and
waterMgt
(n4=59)
All SRIadopters(n=159)
Education level
Up to Primary
142 (89.31) 22 35 24 43 124(77.99) 11.394***
Above primary
17(10.70) 5 8 6 16 35(22.01)
Access tooff farm activities
Had access
80(50.31) 17 24 14 42 97(61.01) 5.238**
Had no access 79(49.69) 10 19 16 17 62(38.99)
** and *** denote significance level at 5% and 1% respectively; values in brackets are percentages; Mgt means management
4.2.3 Active family labour force
The size of active family labour force which is proxied by a number of family members
with ability to work on rice production activities, is very essential in rice production,
particularly in high labour demand practices like SRI. The results (Table 4) show that the
40
mean active labour force size is 2 persons for non adopters and 3 persons for adopters.
The difference is statistically significant at 1% level of probability supporting the
importance of family labour for adoption of SRI components. This result is consistent
with Asfaw et al. (2011), who found the significant mean difference of active family
labour force of adopters and non adopters of improved agricultural technology in
Ethiopia. Moreover study findings of Langyintuo and Mungoma (2008), revealed the
statistically significant mean difference for labour force between improved maize variety
technology adopters and non adopters in Zambia.
Table 4: SRI adoption Status by labour availability, experience and value of farm assets
Variable Non
adopters
(n=159)
Adopters Plant Mgt
(n1 =27)
Plant and
soil Mgt
(n2=43)
Plant and
water Mgt
(n3=30)
Plant, soil
and water
Mgt (n4=59)
All SRI
adopters
(n=159)Active family
labour force
size (Persons)
2
( 0.607)
3
(1.372) ***
3
(1.363) ***
3
( 0.923) ***
3
(1.430 ) ***
3
(1.314) ***Experience in
rice
production
(Years)
3.4
(1.299)
3.5
(1.341)
3.9
(1.298 ) **
4.1
(1.155) ***
3.6
(1.276 )
3.8
(1.280) **
Farm assets
value (TAS
million)
2.40
( 3.637 )
5.53
( 4.006 ) ***
3.38
(11.400 ) **
4.67
(9.923) **
6.02
(5.595 ) ***
4.03
(8.248) **Each SRI package is compared with base category (non adopters); ** and *** denote significance level at 5% and 1% respectively; Standard Deviations have been given in parentheses; Mgt means management.
4.2.4 Experience in rice production
As documented by various literatures, the experience in agriculture influences the
decision making for agricultural technology adoption. In this study to capture how
experience in agriculture relates with SRI adoption, the variable on number of years in
rice production was included. The results show that on average, SRI adopters have more
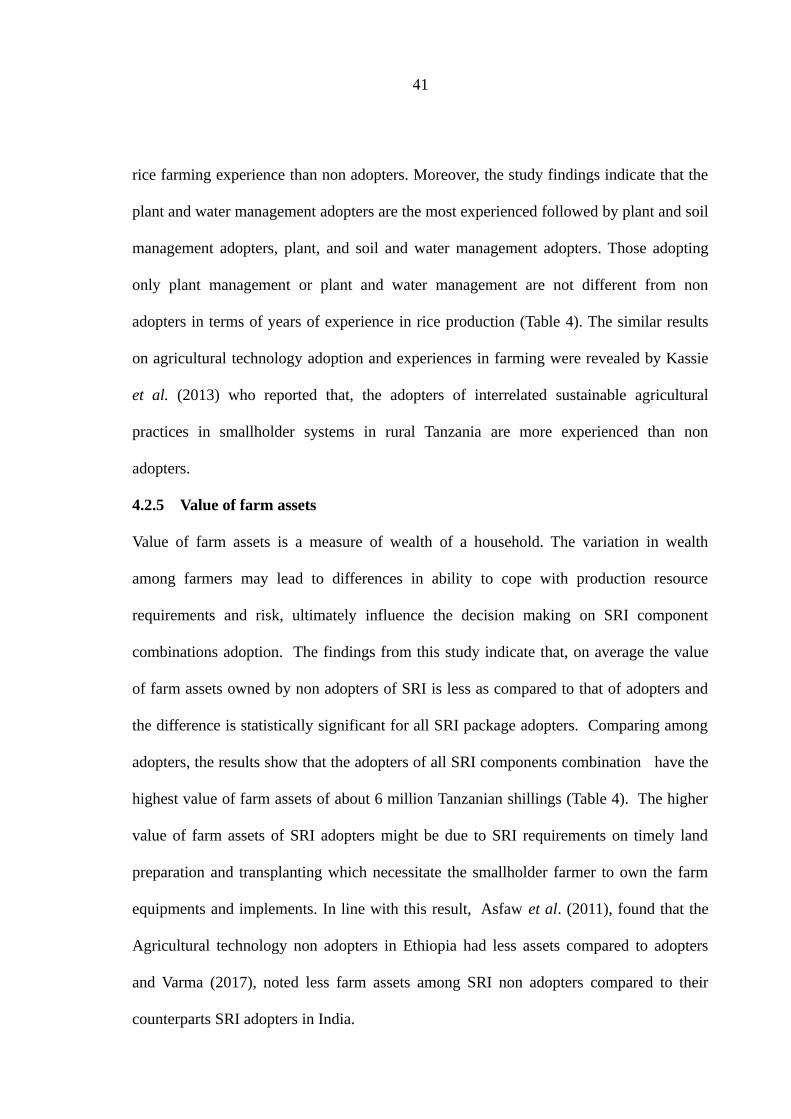
41
rice farming experience than non adopters. Moreover, the study findings indicate that the
plant and water management adopters are the most experienced followed by plant and soil
management adopters, plant, and soil and water management adopters. Those adopting
only plant management or plant and water management are not different from non
adopters in terms of years of experience in rice production (Table 4). The similar results
on agricultural technology adoption and experiences in farming were revealed by Kassie
et al. (2013) who reported that, the adopters of interrelated sustainable agricultural
practices in smallholder systems in rural Tanzania are more experienced than non
adopters.
4.2.5 Value of farm assets
Value of farm assets is a measure of wealth of a household. The variation in wealth
among farmers may lead to differences in ability to cope with production resource
requirements and risk, ultimately influence the decision making on SRI component
combinations adoption. The findings from this study indicate that, on average the value
of farm assets owned by non adopters of SRI is less as compared to that of adopters and
the difference is statistically significant for all SRI package adopters. Comparing among
adopters, the results show that the adopters of all SRI components combination have the
highest value of farm assets of about 6 million Tanzanian shillings (Table 4). The higher
value of farm assets of SRI adopters might be due to SRI requirements on timely land
preparation and transplanting which necessitate the smallholder farmer to own the farm
equipments and implements. In line with this result, Asfaw et al. (2011), found that the
Agricultural technology non adopters in Ethiopia had less assets compared to adopters
and Varma (2017), noted less farm assets among SRI non adopters compared to their
counterparts SRI adopters in India.

42
4.3 Farm Characteristics
4.3.1 Farm level status
Rice field level data were captured basing on farmers’ own statements combined with a
visual plot inspection during the survey. The study findings indicate that most of the SRI
adopters’ farms have been leveled (94%) while most of those of non adopters’ are
dominated with unleveled status (55%). The association between farm level status and
adoption of SRI is statistically significant at 1% (Table 5), supporting the importance of
good plot level status for adoption of SRI practices such as young seedlings
transplanting, proper water control and early transplanting facilitation.
4.3.2 Rice farms location in the irrigation schemes
Rice farm in the irrigation schemes are at different locations. As far as this study is
concerned, the location of the sample households’ rice farms was classified into two main
groups of either upstream or downstream location. The results show that more rice farms
in the schemes are found in upstream. More farms of SRI adopters are located in
upstream compared to those of non adopters. The results indicate that, the association
between adoption of SRI and location of the farm in irrigation scheme is statistically
significant at 5% of probability (Table5). The few farmers among two groups in
downstream, may reflect the scarcity of water for irrigation in downstream of the
schemes.
Table 5: Farm characteristics of sample households
Variable Category Non adopters (n=159)
Adopters 2 -Value
PlantMgt (n1
=27)
Plantandsoil
Mgt(n2=43)
Plantand
waterMgt
(n3=30)
Plant,soiland
waterMgt
(n4=59)
All SRIadopters(n=159)
Farm level status
Leveled 71(44.65) 26 38 28 57 149(93.71) 70.478***Not leveled 88(55.35) 1 5 2 2 10(6.29)
Farm location
Upstream 109(68.55) 21 35 19 52 127(79.87) 5.888**Downstream 50(31.45) 6 8 11 7 32(20.13)
43
Adequate availability of Water forirrigation
Available 69(43.40) 21 37 30 59 147(92.45) 85.518***Not available
90(56.60) 6 6 0 0
12(7.55)
** and *** denote significance level at 5% and 1% respectively; values in brackets are percentages; Mgt means management
4.3.3 Water availability in irrigation schemes
Adequate and timely water availability in the irrigation schemes is among the core factors
in rice production. The discussion with farmers reveal that farmers could not adopt SRI at
all or abandon some components due to the constraint of inadequate and untimely water
availability for rice irrigation. Among the sample households, about 92% and 43% of
adopters and non adopters respectively get water for irrigation on time when needed
(Table 5). The association of adequate water availability for irrigation and adoption of
SRI is statistically significant at 1% level of probability. High percentage of irrigation
water availability on time for adopters could be because of SRI drying and wetting
requirements which necessitate the collaboration among farmers of nearby farm plots to
pump water in plots at the same time. Barrett et al. (2016) argue that if water is not
available on time due to the constraints in the irrigation system, land preparation and
transplanting cannot be as timely as recommended for SRI.
4.3.4 Farm size of sample households
According to FAO (2015), smallholder rice farmers in Tanzania occupy 0.5 to 3ha of land
per household. In line with FAO (2015), this study findings show that in the study area
sample farmers are primarily small scale rice growers with an average farm size of less
than 2.3 hectares (Fig. 4).

44
Figure 4: Farm size of the sample households by SRI components adoption
The results reveal that, on average SRI adopters own larger rice farms compared to non
adopters. The results are consistent with Notze et al. (2012) whose findings indicate that
the SRI adopters own larger farms than non adopters in Timor Leste.
4.4 Institutional Factors
4.4.1 Access to credit
Liquidity constraints relaxation in rice production may be facilitated by access to
agricultural credit. Credit paves the way for timely accomplishment of various farm tasks
through provision of fund which enables farmer to purchase agricultural inputs and
financing farm activities. This was elicited during the interviews by asking farmers
whether they have access to credit from formal institutions such as SACCOS, banks or
irrigation schemes and from informal source (local lenders). The study findings (Table 6),
Table 6: Institutional characteristics of the sample households
Variable Category Non adopters (n=159)
Adopters 2 -Value
PlantMgt(n1
=27)
Plant andsoil Mgt(n2=43
Plantand
waterMgt
(n3=30
Plant,soil andwaterMgt
(n4=59
All SRI adopters(n=159)

45
Access tocredit facilities
Accessible 87(54.72) 18 31 23 43 115(72.33) 9.466***Not accessible 72(45.28) 9 12 7 16 44(27.67)
Access toExtension service
Yes 71(44.65) 23 29 20 53 125(78.62) 35.489***No 88(55.35) 4 14 10 6 34(21.38)
Information about SRI
Yes 83(52.20) 23 33 25 57 138(86.79) 44.015***
No 76(47.80) 4 10 5 2 21(13.21) *** denotes significance level at 1%; values in brackets are percentages; Mgt means management
indicate that about 72% and 55% of SRI adopters and non adopters have access to credits
respectively and the association between credit access and SRI adoption is statistically
significant at 1% level of probability. Comparison among the SRI component
combinations adopters shows that, in 2016/2017 cropping season, farmers who adopted
comprehensive SRI package (plant, soil and water management) had highest percentage
of farmers with access to credit. Irrigation schemes play a great role as formal agricultural
credit source while local lenders is the major informal agricultural credit source used by
smallholder rice farmers in the study area (Table 7).
Table 7: Credit services and other sources of information
Variable Category Non adopters
Adopters 2 -Value
PlantMgt
Plantand soil
Mgt
Plantand
waterMgt
Plant,soil andwaterMgt
Totaladopters
Source ofcredit (n=202)
Financial institution
15(17.24) 2 4 3 5 14(12.17) 24.574***
Irrigation Scheme 36(41.38) 14 14 7 31 66(57.39)Local lenders 36(41.38) 2 13 13 7 35(30.44)
Total 87(100) 18 31 23 43 115(100)Main purpose of the credit (n= 202)
Payment oflabour 27(31.03) 3 7 10 9 29(25.22) 0.040Buying fertilizers 60(68.97) 15 24 13 34 86(74.78)
Total 87(100) 18 31 23 43 115(100)Reasons for not using credit (n=114)
No need for credit 23(31.94) 5 8 5 8 26(61.90) 27.444***Fear of inability to pay
39(54.17) 2 3 2 3 10(23.81)

46
Lack of asset for collateral
10(13.89) 2 1 0 3 6(14.29)
Total 72(100) 9 12 7 14 42(100)Other sources of SRI information (n= 98)
Friends 54(71.05) 4 7 4 1 16(72.73) 1.300
Relatives 22(28.95) 1 3 1 1 6(27.27)
Total 76(100) 5 10 5 2 22(100)
*** denotes significance level at 1%; Values in brackets are percentages; Mgt means management
However, smallholder rice farmers who did not use agricultural credit in 2016/17
cropping season had different reasons which led for agricultural credit unused. The
majority of non SRI adopters claimed that they did not use agricultural credit due to fear
of inability to pay back the loan. The fear of inability to pay back the loan for non SRI
adopters might be the unpredictable harvests due to inadequate irrigation water
availability. On other hand, the major reason for not using agricultural credit for SRI
adopters was because they did not need agricultural credit in the respective cropping
season. This may reflect that SRI adopters have higher capital compared to non adopters.
4.4.2 Access to extension and information services
Access to extension and information enable farmers to be aware on the benefits of a new
agricultural technology. Extension service is a source of information for many farmers,
either directly, through contact with extension agents, or indirectly, through farmers who
have prior exposure transmitting information to other farmers. As expected, the results
(Table 6) reveal that, more SRI adopters (79%) had access to extension services
compared to non-adopters (45%) and the association between extension services and SRI
adoption is statistically significant at 1% level of probability. Acquisition of information about a new technology is another factor that may determine
adoption of technology. This enables farmers to learn about the existence as well as the
effective use of technology thus facilitating its adoption since farmers adopt only the

47
technology they are aware of or have heard about it. The study findings reveal that few
non adopters (52%) obtain information about SRI from government or development
partner agents compared to 87% of adopters (Table 6). The higher percentage of SRI
adopters with information access, might be facilitated by more contact frequencies with
government and development partners extension agents, hence reflecting more exposure
to information on SRI technique. However, smallholder farmers who do not access SRI
information from government or private extension agents may have information from
other sources. This is possibly because, farmers may get information concerning
agricultural technology directly from extension agents, or indirectly, through farmers who
have prior exposure transmitting information to other farmers. The results show that 98
sample smallholder farmers got information about SRI from fellow farmers and relatives
(Table 7). The comparison between adopters and non adopters indicates that few SRI
adopters got information from other sources (22%). Furthermore, the results show that
other source of information about SRI is not statistically associated with SRI components
adoption status.
In line with access to extension services and information, on average SRI non adopters
are visited and trained less on rice production by extension agents than their counterpart
adopters in a single cropping season (Fig.5). This is in line with Varma (2017), who found
low frequency of extension agents contact with non SRI adopters in India compared to
adopters.

48
Figure 5: Number of extension agents contact with smallholder farmers and
training on rice production per cropping season
4.5 Rice Yields and Costs of Production
In line with previous studies which documented the increased productivity of rice in SRI,
these study findings reveal that on average yields of all SRI adopted combinations were
higher compared with non adopted. The average rice yield for non SRI adopters was
about 4.0 tones/ha (Table 8), which is statistically significant lower than for adopters of
SRI. The highest yield (about 7 tones/ha) was obtained when all SRI practices were
adopted. The research findings by Takahashi (2013), in studying the roles of risk and
ambiguity of SRI adoption in Indonesia, revealed the average of 3.0 tones/ha and 5.5
tones/ha for non SRI adopters and adopters respectively. Moreover Tusekelege et al.
(2014), found the higher rice yield for SRI adopters (8.5 tones/ha) compared to 6.9
tones/ha for non adopters using researcher controlled comparative analysis of SRI in
Kilosa and Mvomero Districts in Morogoro, Tanzania.
Table 8: Rice yield, production cost and Profitability of SRI and Convetional
practices
Variable Adopters

49
Nonadopters(n=159)
PlantMgt
(n1 =27)
Plant andsoil Mgt(n2=43)
Plant andwaterMgt
(n3=30)
Plant, soiland water
Mgt(n4=59)
All SRI adopters(n=159)
Rice yield (tones/ha)
3.99(0.956) 5.77 5.78 5.93 7.16 6.32 (0.567) ***
Revenue (TAS/ha)
2 916 690(820 460 )
4 217 870 4 225 180 4 334 830 5 233 960 4 619 920(1 190 262.10) ***
Input cost (TAS/ha)
441025(157744.19)
601225 485900 436950 507300 504175(191170.35) ***
Labour cost (TAS/ha)
1089550(187448.588)
2 156 525 1 422 350 1 348 100 1 486 925 1 556 975 (301460) ***
Total variable cost (TAS/ha)
1 530 575(1 066 152.5)
2 757 750 1 908 250 1 785 050 1 994 225 2 061 150(1 404 642.50) ***
Unit variable cost(TAS/Kg)
384(139.12) 478 330 301 279 326 (114.62) ***
Gross profit (TAS/ha)
1 386 115(204 393.20)
1 460 120 2 316 930 2 549 780 3 239 705 2 558 770(1 160 957.73) ***
Gross profit per kg((TAS)
347(89.10) 253 401 430 452 405 (72.10) ***
Each SRI packages are compared with base category (non adopters) using t-test; *** denotes significancelevel at 1%; Standard Deviations have been given in parentheses; Mgt means management; GM meansGross margin.
The costs of production incurred were categorized into input and labour costs. Seeds,
fertilizers, manure and water charges expenses were included in input costs category. On
other hand labour costs included expenses on ploughing, harrowing, seedlings
transplanting, weeding, birds scaring, harvesting and bagging. The results indicate that
although production cost per hectare for conventional method of rice production is lower
than for SRI, on average the production cost per kilogram of rice output is higher for SRI
non adopters compared to their counterpart adopters (Table 8). This study finding in cost
of production for SRI non users and users concurs with Tusekelege et al. (2014) and
Durga and Kumar (2013). However, labour costs per hectare are higher for SRI adopters
(about 76% of the total production cost) compared to 71% of the total production cost for
non SRI adopters (Table 8). The results conform to prior expectation that SRI is more
labour intensive compared to conventional practice. In the study area, on average, SRI
non adopters are less profitable (347 TAS/Kg) compared to adopters (405 TAS/Kg). The
higher rice gross profit for SRI adopters might be contributed by higher rice yields due to
adopted SRI package combinations.
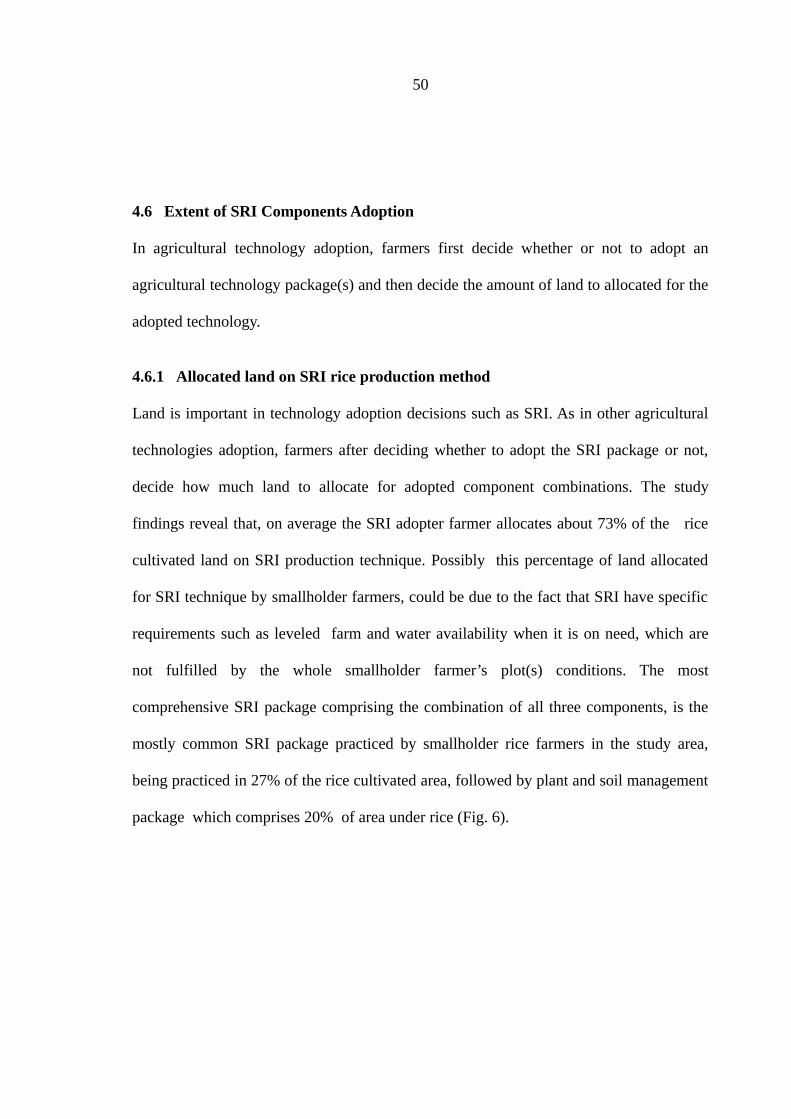
50
4.6 Extent of SRI Components Adoption
In agricultural technology adoption, farmers first decide whether or not to adopt an
agricultural technology package(s) and then decide the amount of land to allocated for the
adopted technology.
4.6.1 Allocated land on SRI rice production method
Land is important in technology adoption decisions such as SRI. As in other agricultural
technologies adoption, farmers after deciding whether to adopt the SRI package or not,
decide how much land to allocate for adopted component combinations. The study
findings reveal that, on average the SRI adopter farmer allocates about 73% of the rice
cultivated land on SRI production technique. Possibly this percentage of land allocated
for SRI technique by smallholder farmers, could be due to the fact that SRI have specific
requirements such as leveled farm and water availability when it is on need, which are
not fulfilled by the whole smallholder farmer’s plot(s) conditions. The most
comprehensive SRI package comprising the combination of all three components, is the
mostly common SRI package practiced by smallholder rice farmers in the study area,
being practiced in 27% of the rice cultivated area, followed by plant and soil management
package which comprises 20% of area under rice (Fig. 6).
51
Figure 6: Land allocation on SRI production
The least practiced package is that of plant and water management which is employed in
only 10%. This might be due to the constraint of water control in irrigation schemes due
to difficult in collaboration agreements among farmers of nearby plots of land for wetting
and drying practices at the same time in SRI technique as documented by Barrett et al.
(2016).
4.7 Determinants of SRI Components Adoption
The effects of determinants of SRI component combinations adoption vary across SRI
component combinations. Parameter estimates of the multinomial logit model of the plot
and household level determinants of SRI components adoption with non adoption of any
SRI component as the base category are presented in Table 9. The model fits the data
very well with the Wald test, Chi2 = 310.342; Prob>0.000 indicating that the null
hypothesis that all the coefficients are jointly equal to zero is rejected. As it was assumed by various literatures for farmer’s education to influence positively the
likelihood on decision to adopt new technology, this study findings reveal the positive and
significant influence of education level on the decision to adopt SRI package
combinations. The positive effect of education on SRI adoption may reflect Mwangi and
52
Kariuki (2015) argument that, more education influences farmers’ attitudes and thoughts
making them more open, rational and able to analyze the benefits of the new agricultural
technology. Specifically the results show that the rice farmers with education above
primary level are more likely to adopt plant and water management package in rice
production using SRI technique. Concurring with this study, Manda et al. (2015) and
Mignouna et al. (2011) documented positive and significant relationship between the
education and adoption of SAPs in rural Zambia na Imazapyr-resistant maize
technologies in Western Kenya respectively.
As expected, positive and significant effect of family labour force size on adoption of SRI
component combinations has been revealed by study findings. The results indicate that,
the increase of family labour force involved in rice production activities increases the
likelihood decision to adopt SRI component combinations. Probably, the positive and
significant relation of family labour force size and adoption of SRI packages could be
caused by high labour requirement of SRI. In initial phase of SRI adoption, smallholder
farmers depend on family labour which cannot easily be replaced by hired labour, because
of specific knowledge, training, and experience required. This might be due to the fact
that, in the SRI training sessions, farmers are advised to first gain experience with SRI
themselves, before involving the hired labours as documented by Notze et al. (2012).
Experience on rice production is positive in influencing the likelihood of the decision to
adopt SRI packages. This implies that more experienced smallholder rice farmers are
likely to adopt SRI components compared to less experienced farmers. However, this
result is statistically significant in the case of the adoption of plant and soil management
and plant plus water management packages only. Notwithstanding there are studies that
argue for less experienced farmers to be more flexible in adopting new innovation in
agriculture (Teklewold et al., 2013; Varma, 2017), on other hand there is an argument
that more experienced farmers are better able to evaluate technology information hence

53
likely to adopt (Kassie et al., 2013; Mignouna et al., 2011). Consistent with early studies
such as Kasie et al. (2013), this result also adds to the evidence of the positive effects of
experience on adoption of technologies in multiple scenarios.
The effect of access to off farm activities on the adoption of SRI components is mixed.
Three packages of plant management only; plant and soil management only; and
comprehensive combination of plant, soil and water management adoption have been
significantly influenced by the accessibility of smallholder farmers to off farm activities.
However, while plant management and plant plus soil management packages are
positively and significantly influenced by access to off farm activities, the comprehensive
package of plant, soil and water management adoption is negatively related to off farm
activities.
Table 9: Mixed multinomial logit model estimates of adoption of SRI components
in Mbarali District (Baseline category is non-adoption of SRI)
SRI componentsVariable Plant
managementPlant and soilmanagement
Plant and watermanagement
Plant, soil andwater
managementEducation -0.045(0.697) 0.439(0.594) 1.208(0.367) ** 0.674(0.537)Active family labour size 1.728(0.306) *** 1.642(0.291) *** 1.738(0.330) *** 1.850(0.295) ***Experience in rice production 0.113(0.209) 0.357(0.185) * 0.533(0.224) ** 0.134(0.183)Access to off-farm activities 12.314(0.550) *** 12.708(0.483) *** 0.001(0.571) -2.540(0.504) ***Farm assets value 0.149 (0.119) 0.053(0.099) -0.041(0.112) 0.012(0.103) Farm size -0.090(0.079) -0.091(0.067) -0.337(0.109) *** -0.061(0.064)Adequate availability of Water for irrigation -0.338 (0.833) 1.267(0.721) * 15.348(326.478) 15.448(299.764)Farm level status 3.142(1.164) *** 1.667(0.700) ** 2.363(1.054) ** 2.105(0.953) **Farm location 0.360(0.728) 0.527(0.605) -0.874(0.708) 0.756(0.645)Access to credit facilities 1.486(0.669) ** 0.750(0.596) 0.265(0.716) 1.671(0.589) ***Number of extension agencies visits and training on rice production
0.129(0.264) -0.039(0.232) -0.458(0.286) 0.235(0.231)
Access to information about SRI from government /Development agents
1.691(0.887) * 0.314(0.689) 0.771(0.843) 2.015(0.988) **
2 = 310.342; Prob 0.000 ; Cox and Snell Pseudo R2=62.30***<0.01, **<0.05, *<0.1; Standard errors have been given in the brackets

54
The positive and significant effect of access to off farm activities suggests that, off farm
activities may generate off farm income which acts as an important strategy for
overcoming credit constraints faced by smallholder rice farmers in the study area. The
income from off farm activities may provide farmers with liquid capital for covering
expenses on farm preparation, transplanting and frequently weeding hence enhancing the
adoption of plant management and plant plus soil management SRI packages. On other
hand, the negative relation between off farm activities and comprehensive package of SRI
comprising plant, soil and water management, possibly is caused by diversion of time and
efforts from rice production, which reduces the household labour allocated to rice
farming activities using SRI technique. This study result is in line with Diiro (2013), who
found positive effect for off farm activities and agricultural technology adoption and
Mathenge et al. (2014), Manda et al. (2015) and Varma (2017) whose findings indicate
negative relation between the two.
The results show that, land is important determinant for decision in SRI packages
adoption. The study findings indicate that, farmers with more land are less likely to adopt
SRI packages than those with less land. Specifically, the farm size is significantly and
negatively related with adoption of plant and water management combination only. The
results are in agreement with Varma (2017), Gebremariam and Wünscherb (2016) and
Teklewold et al.(2013) whose findings revealed similar results and argue that it could
be due to smallholder farmers tend to achieve food security by sustainably intensifying
production in their small lands. On other hand, these results are contrary to study findings
by Manda et al. (2015), on agricultural technology adoption in general and Notze et al.
(2012), for the SRI context in specific, who found the land to have positive effect on
sustainable agricultural practices (SAPs) and SRI packages adoption respectively.
Adequate availability of water for irrigation when required is positively and significantly
influences the adoption of plant and soil management package. This probably is due to the
55
fact that timely water availability reduces yield risk associated with early and timely
seedling transplanting. Also suggests the vital role of better irrigation facilities availability
in adoption of SRI packages. In line with adequate water availability is leveling of rice
fields. The results indicate that level status of rice farm is positive and statistically
significant in affecting the adoption decision of all SRI packages. The farm level status
result is consistent with Takahashi and Barrett (2014), who documented that, in rice
production using SRI technique, leveled farm is necessary as it facilitates the proper
young seedlings transplanting and water control. The positive and significant effect of
credit on the adoption of the SRI packages is as expected. Specifically, credit is positively
related with plant management component, as well as with all comprehensive package
which contains all the three components of SRI (Plant, soil and water management). This
result is explained by the economic theory which posits credits to be one of the most
important aspects to fuel technology adoption in developing countries. This study finding
is consistent with the findings by Teklewold et al. (2013); Okuthe et al. (2013) and
Gebremariam and Wünscherb (2016).
Consistent with earlier work on agricultural technology adoption in general such as
Manda et al. (2015) as well as in the specific context of SRI (Varma, 2017; Barrett et al.,
2016; Notze et al., 2012), the study findings indicate the positive influence of access to
information on SRI component combinations adoption. Specifically the positive and
significant effect of access to information on SRI adoption has been revealed in two SRI
component combinations of plant management only and comprehensive combination of
plant, soil and water management.
Despite the descriptive statistic analysis indicated significant differences between SRI
adopters and non adopters on extension agents contact with smallholder farmers, value of
farm assets and farm location in the scheme, in this study these variables have statistically
insignificant effect on SRI components adoption decision. For extension agents contact
56
with smallholder farmers, this may be surprising, given that SRI is a knowledge intensive
technology.
The frequency of extension agents contact with smallholder rice farmers, was expected to
have significant and positive effect to SRI components adoption. However, in contrary the
results reveal insignificant relation between the two. This result is consistent with
Teklewold et al. (2013) and Varma (2017), but contradicts with Manda et al. (2015). This
may reflect that it is not the frequency of extension contact per se which affects adoption,
but the quality of the extension services provided to smallholder farmers. The
insignificant result for value of farm asset variable is not surprising since apart from the
higher labour requirements, SRI is a low external inputs technology so that it does not
necessarily depend on farm assets value as the measure of wealth of the household. The
insignificant relation of SRI components adoption and location of the farm in the
irrigation scheme may imply that rice production using SRI technique depends on other
necessary rice plot conditions such as rice field level status and timely and adequate water
availability irrespective of rice plot location in the irrigation scheme.
The effects of determinants of SRI component combination adoption therefore, vary
across SRI component combination and thus this might be a reason for decision of
farmers to adopt some of the SRI components.
4.8 Impact of adopted SRI components on rice yields
Variation of SRI impact on yields may result from varying degrees of adherence to SRI
practices. Analysis results on impact of adopted SRI component combinations on yield
are presented in Table 10.
The results indicate that on average, SRI adopters have higher yield compared to non
adopters and the results are statistically significant for all combinations of SRI
components. Control variable and their effect on rice yield are presented in appendix 3. In
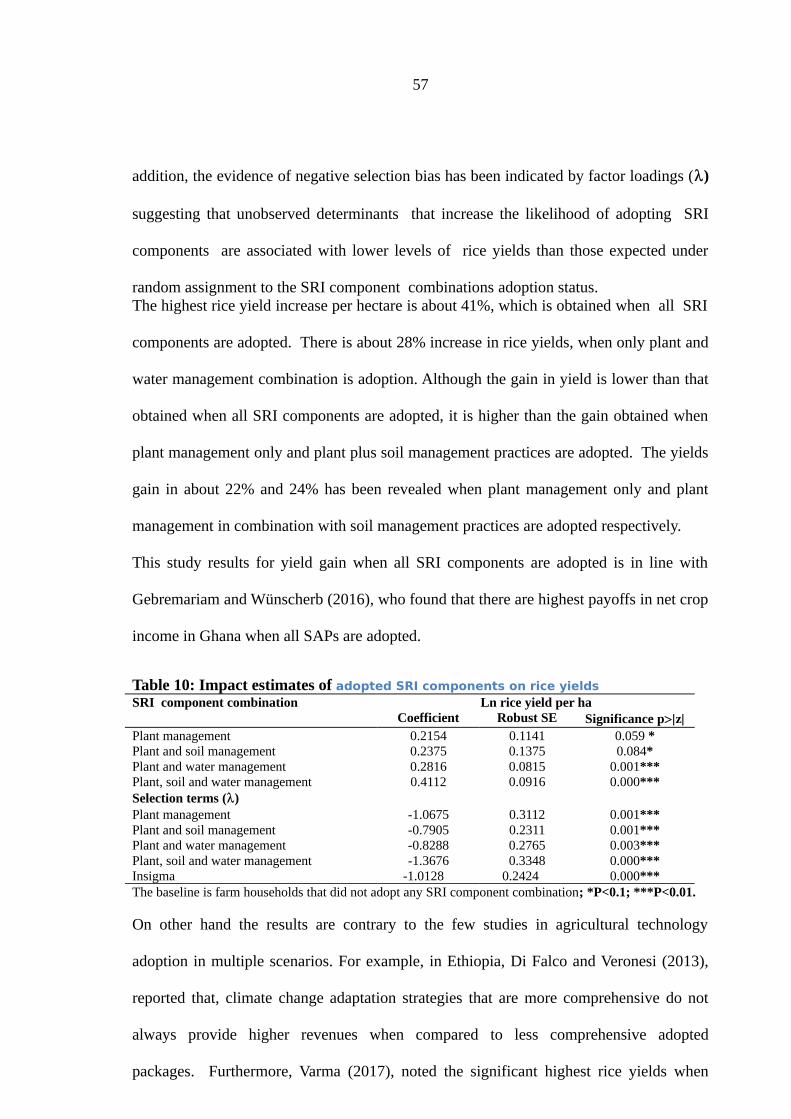
57
addition, the evidence of negative selection bias has been indicated by factor loadings ()
suggesting that unobserved determinants that increase the likelihood of adopting SRI
components are associated with lower levels of rice yields than those expected under
random assignment to the SRI component combinations adoption status.The highest rice yield increase per hectare is about 41%, which is obtained when all SRI
components are adopted. There is about 28% increase in rice yields, when only plant and
water management combination is adoption. Although the gain in yield is lower than that
obtained when all SRI components are adopted, it is higher than the gain obtained when
plant management only and plant plus soil management practices are adopted. The yields
gain in about 22% and 24% has been revealed when plant management only and plant
management in combination with soil management practices are adopted respectively.
This study results for yield gain when all SRI components are adopted is in line with
Gebremariam and Wünscherb (2016), who found that there are highest payoffs in net crop
income in Ghana when all SAPs are adopted.
Table 10: Impact estimates of adopted SRI components on rice yields SRI component combination Ln rice yield per ha
Coefficient Robust SE Significance pzPlant management 0.2154 0.1141 0.059 *Plant and soil management 0.2375 0.1375 0.084*Plant and water management 0.2816 0.0815 0.001***Plant, soil and water management 0.4112 0.0916 0.000***Selection terms ()Plant management -1.0675 0.3112 0.001***Plant and soil management -0.7905 0.2311 0.001***Plant and water management -0.8288 0.2765 0.003***Plant, soil and water management -1.3676 0.3348 0.000***Insigma -1.0128 0.2424 0.000***The baseline is farm households that did not adopt any SRI component combination; *P<0.1; ***P<0.01.
On other hand the results are contrary to the few studies in agricultural technology
adoption in multiple scenarios. For example, in Ethiopia, Di Falco and Veronesi (2013),
reported that, climate change adaptation strategies that are more comprehensive do not
always provide higher revenues when compared to less comprehensive adopted
packages. Furthermore, Varma (2017), noted the significant highest rice yields when
58
plant and water management package was adopted in India. The variation in yields gain
due to package(s) adopted probably reflects the differences in agronomic characteristics,
agro ecological and implementation strategies in respective location. Additionally, the
highest average rice yield due to comprehensive adoption of all SRI component
combinations may reflect the crucial of all components of SRI technique in rice
production. For instance, intermittent irrigation aims to tackle various challenges such as
the loss of soil quality and water scarcity, whereas early transplanting and wide spacing
are both meant to boost tillering. Additionally the use of organic fertilizer, such as
compost or manure and regular weeding can help to stimulate growth- promoting soil
bacteria and soil aeration improvement respectively (Noltze et al., 2012).

59
CHAPTER FIVE
5.0 CONCLUSIONS AND RECOMMENDATIONS
5.1 Conclusion
This study aimed at analysing the adoption of SRI and its impact on rice yield in Mbarali
District. Specifically, it focused on determining the extent of SRI components adoption by
smallholder rice farmers, analysing the factors that drive farmers on SRI components
adoption decisions and determining the impact of adopted SRI components combinations
on rice yields.
The study found that, in the study area majority of SRI users partially adopt SRI and on
average the smallholder farmers allocate a portion of land (about 73% of the rice
cultivated land) on SRI rice production practices. The findings indicate that, the effect of
determinants of SRI component combination adoption vary across SRI component
combination. Specifically, the decision to adopt different combinations of SRI
components is influenced by education level of farmer, size of active family labour force,
access to off farm activities, experience in rice production, farm size, farm level status
and adequate availability of water for irrigation when is needed, access to credit facilities
and information concerning SRI from government and development partners.
With regard to impact of SRI on yield, the results suggest that even the partial adoption of
SRI practices can have an impact on rice yield. The comprehensive package comprising
all three SRI components (plant, soil and water management) generates the highest rice
yields implying the necessity of fully SRI package adoption than partially adoption
among smallholder rice farmers.

60
5.2 Recommendation
Based on the empirical findings reported in this dissertation preceding conclusion and
study limitation, the following recommendations are forwarded:
5.2.1 Policy implication
i. This study has found evidence that on average adopters of SRI component
combinations have higher yield compared to non adopters. This has encouraging
message for policy makers, program designers, implementers and funding
agencies to take proper action in supporting rice production using SRI to achieve
the intended goals in rice productivity. Furthermore, the adoption of
comprehensive package comprising all SRI components has indicated the highest
gain in yield; this has important policy implications that, the future interventions
with comprehensive SRI package are inevitable.
ii. The findings revealed that, adoption of SRI packages is facilitated by accessibility
and availability of agricultural credit and information. Therefore, the government
financial institutions and other stakeholders should provide agricultural credit
support through creation of conducive environments for cash credit and inputs to
smallholder rice farmers. Farmers need also to be encouraged to form or join into
farmers’ organizations to improved access to credit, networking and create social
capital that can make them benefit from sharing agricultural information.
iii. Since leveling of rice farms has shown the positive and significant influence on
adoption of SRI as it facilitates proper water control and early seedling
transplanting, it is recommended that government and agricultural stakeholders
should support irrigation schemes in terms of fund for farm leveling.
61
5.2.2 Future studies
i. It is recommended to conduct further study focusing on adoption of SRI
components and the impact of the adopted components on income.
ii. Further researches on the best ways of extension services delivery to smallholder
rice farmers and proper model for research-extension linkages are recommended.
iii. Furthermore, despite the outcomes from this study may be applied to different
agro ecological and socioeconomic environments, further research focusing on
SRI adoption and impact in specific agro ecological and socioeconomic
environments is encouraged.
REFERENCES
Abdulai, A. and Huffman, W. (2014). The adoption and impact of soil and water
conservation technology: An endogenous switching regression application,
Land Economics 90(1): 26–43.
Adesina, A. and Zinnah, M. (1993). Technology characteristics, farmers’ perceptions and
adoption decisions: a Tobit model analysis in Sierra Leone. Agricultural
Economics 9: 297-311.
62
Akudugu, M., Guo, E. and Dadzie, S. (2012). Adoption of modern agricultural production
technologies by farm households in Ghan. What Factors Influence their
Decisions? Journal of Biology, Agriculture and Healthcare 2(3): 1-13.
Alcon, F., Miguel, M. D. and Burton, M. (2011). Duration analysis of adoption of drip
irrigation technology in southeastern Spain. Journal of Technological
Forecasting and Social Change 78(6): 991–1001.
Asfaw, S., Shiferaw, B., Simtowe, F. and Haile, M.G. (2011). Agricultural technology
adoption, seed access constraints and commercialization in Ethiopia. Journal
of Development and Agricultural Economics 3(9): 436–477.
Barreiro-Hurle, J. (2012). Analysis of incentives and disincentives for rice in the United
Republic of Tanzania, Technical notes series, MAFAP, FAO, Rome. 50pp.
Barrett, C. B., Moser, C.M., Mchugh, O.V. and Ibarison, J. (2004). Better technology,
better plots or better farmers? Identified changes in productivity and risk
among Malagasy rice farmers. American Journal of Agricultural Economics
86(4) : 869–888.
Barrett, C., Islam, A. and Malek, A. (2016). System of rice intensification in rural
Bangladesh: Adoption, diffusion and impact. Working Research Paper.
International Growth Centre. 38pp.
Ben, C. G., Law, M.N., Osuji, I.I. and Ibeagwa, B. O. (2015). Costs and return of rice
production in Kaduna State of Nigeria. International Journal of Agricultural
Marketing 2(5): 084-089.
Bonifance, N.S., Fengying, N. and Chen, F. (2015). Analysis of smallholder farmers
socio-economic determinants for input use: A case of major rice producing
Regions in Tanzania. RJOAS 2(38): 41-55.

63
Burney, J. A., Naylorb, R.L. and Postel, S.L. (2013). The Case for Distributed Irrigation
as a Development Priority in Sub-Saharan Africa. Journal of PNAS 110(31):
513-517.
Castle, M.H., Lubben, B.D. and Luck, J. D. (2016). Factors Influencing the Adoption of
Precision Agriculture Technologies by Nebraska Producers. Presentations,
Working Papers, and Gray Literature: Agricultural Economics. University of
Nebraska – Lincoln. 25pp.
Deb, P. and Trivedi, P. K. (2006b). Specification and simulated likelihood estimation of a
non-normal treatment outcome model with selection: Application to health
care utilization. Econometrics Journal 9: 307–331.
Devi, K.S. and Ponnarasi, T. (2009). An economic analysis of modern rice production
technology and its adoption behaviour in Tamil Nadu. Agricultural Economics
Research Review (2): 341-347.
Di Falco, S. and Veronesi, M. (2013). How African agriculture can adopt to climate
change? A counterfactual Analysis from Ethiopia. Land Economics 89(4): 743-
766.
Diiro, G. (2013). Impact of Off-farm Income on Technology Adoption Intensity and
Productivity: Evidence from Rural Maize Farmers in Uganda. International
Food Policy Research Institute, Working Paper 11. 15pp.
Duflo, E., Michael, K. and Jonathan, R. (2011). “Nudging Farmers to Use Fertilizer:
Theory and Experimental Evidence from Kenya.” American Economic
Journal Review 101(6): 2350–90.

64
Durga, A. R. and Kumar, D.S. (2013). Economic analysis of the system of rice
intensification: Evidence from Southern India. Bangladesh Development
Studies (XXXVI) 79-93.
FAO (2015). The rice value chain in Tanzania: A report from the Southern Highlands
Food Systems Programme. Food and Agriculture Organization of the United
Nations (FAO), Rome, Italy. 111pp.
FAO (2017). Rice market monitor. FAO, Rome, Italy. 35pp
Filipski, M., Manning, D., Taylor, J. E., Diao, X. and Pradesha, A. (2013). Evaluating the
Local Economywide Impacts of Irrigation Projects, Feed the Future in
Tanzania, IFPRI Discussion Paper 01247, Institute for Food Policy Research.
Gebremariam, G. and Wünscherb, T. (2016). Combining Sustainable agricultural
practices pays off: Evidence on Welfare Effects from Northern Ghana. Centre
for Development Research (ZEF), University of Bonn, German. 37pp.
Ghosal, S. and Yihdego, T. G. (2016). The impact of small scale irrigation on household
income in Bambasi Wored, Benishanguli-Gmuz Region, Ethiopia.
International Journal of Scientific and Research Publications 6(6): 400-4007.
Green, W.H. (2012). Econometric Analysis, Pearson Education, Inc., publishing as
Prentice Hall USA. 1231pp.
Hailu, B.K., Abrha, B.K. and Weldegiorgis, K.A. (2014). Adoption and impacts of
agricultural technologies on farm income: Evidence from Southern Tigray,
Nothern Ethiopia. International Journal of Food and Agricultural Economics
2(4): 91-106.
65
Ijogu, B.J. (2016). Comparative analysis of system of rice intensification and traditional
system of rice production in abi local government authority cross river state,
Nigeria. European Journal of Agriculture and Forestry Research 4(2): 9-23.
Kadigi, R.M.J., Bizoza, A. and Zinabou, G. (2012). Irrigation and Water Use Efficiency in
Sub-Saharan Africa. Global Development Network –Working paper Series.
37pp.
Kadigi, R.M.J., Kashaigili, J.J. and Mdoe, N.S. (2004). The economics of Irrigated paddy
in Usangu Basini, Tanzania: Water utilization, Productivity, Income and
Livehood implication. Physics and Chemistry of the earth 29(15-18): 1091-
1100.
Kariyasa, K. and Dewi, A. (2011). Analysis of factors affecting adoption of integrated
crop management farmer field school (ICM-FFS) in Swampy Areas.
International Journal of Food and Agricultural Economics 1(2): 29-38.
Kassie, M., Jaleta, M., Shiferaw, B., Mmbando, F. and Mekuria, M. (2013). Adoption of
interrelated sustainable agricultural practices in smallholder systems: Evidence
from rural Tanzania. Technological forecasting and social change 80(3): 525–
540.
Kassie, M., Teklewold, H., Marenya, P., Jaleta, M. and Erenstein, O. (2014). Production
risks and food security under alternative technology choices in Malawi:
Application of a multinomial endogenous switching regression, Journal of
Agricultural Economics 66(3): 640-659.
Katambara, Z., Kahimba, F., Mahoo, H., Mbungu, W., Mhenga, F., Reuben, P., Maugo, M.
and Nyarubamba, A. (2013). Adopting the System of Rice Intensification
(SRI) in Tanzania: A Review. Journal of Agricultural Sciences 4: 369-375.
66
Keelan, C., Thorne, F., Flanagan, P., Newman, C. (2014). Predicted Willingness of Irish
Farmers to Adopt GM Technology. The Journal of Agrobiotechnology
management and Economics 12(3): 394-403.
Khandker, S. R., Koolwal, G.B. and Samad, H.A.(2010). Handbook on impact evaluation:
Quantitative methods and practices. The World Bank, Washington DC. 262pp.
Kothari, C.R. (2004). Research Methodology: Methods and Techniques. New Age
International Limited Publishers, New Delhi, India. 401pp.
Loevinsohn, M., Sumberg, J. and Diagne, A. (2012). Under what circumstances and
conditions does adoption of technology result in increased agricultural
productivity? Protocol. London: EPPI Centre, Social Science Research Unit,
Institute of Education, University of London. 19pp.
Lowenberg-DeBoer, J. (2000). Comments on Site-Specific Crop Management: Adoption
Patterns and Incentives. Review of Agricultural Economics 22(1): 245-247.
Manda, J., Arega, D.A., Cornelis, G., Kassie, M. and Tembo, G. (2015). Adoption and
Impacts of Sustainable Agricultural Practices on Maize Yields and Incomes:
Evidence from Rural Zambia. Journal of Agricultural Economics 1-24.
Mathenge, M. K., Smale, M. and Tschirley, D. (2014) Off-farm employment and input
intensification among smallholder maize farmers in Kenya. Journal of
Agricultural Economics 6: 793–806.
Mbarali District (2016). Summary of Socio-Economic Profile of the District, Mbarali
District Executive Director office. 24pp.

67
Mignouna, B., Manyong, M., Rusike, J., Mutabazi, S. and Senkondo, M. (2011).
Determinants of Adopting Imazapyr-Resistant Maize Technology and its
Impact on Household Income in Western Kenya: Journal of AgBioforum
14(3): 158-163.
Mishra, D.P. and Min, J. (2010). Analyzing the relationship between dependent and
independent variables in marketing: A comparison of multiple regression with
path analysis. Journal of Innovative Marketing 6(3): 113-120.
Mutenje, M., Kankwamba, H., Mangisoni, J., Kassie, M. (2016). Agricultural innovations
and food security in Malawi: Gender dynamics, institutions and market
implications. Technological Forecasting and Social Change 103: 240-248.
Muzari, W., Gatsi, W. and Muvhunzi, S. (2012). The Impacts of Technology Adoption on
Smallholder Agricultural Productivity in Sub-Saharan Africa: A Review,
Journal of Sustainable Development 5(8): 69-77.
Mwangi, M. and Kariuki, S. (2015). Factors determining adoption of new agricultural
technology by smallholder farmers in developing countries. Journal of
Economics and Sustainable Development 6(5): 208-217.
Mwatawala, H.W., Mwang’onda, E. and Hyera, R.N. (2016). Paddy production in
southern highlands of tanzania: Contribution to Household income and
Challenges faced by paddy farmer in Mbarali District. Scholars Journal of
Agriculture and Veterinary Science 3(3): 262-269.
Negatu, W. and Parikh, A. (1999). The impact of perception and other factors on the
adoption of agricultural technology in the Moret and Jiru Woreda of Ethiopia.
Elsevier Journal on Agricultural Economics 21: 205-216.

68
Ngalapa, H., Dulle, F. and Benard, R. (2014). Assessment of information needs of rice
farmers in Tanzania. A case study of Kilombero District, Morogoro. Library
Philosophy (e-Journal).
Ngwira, A., Johnsen, F.H., Aune, J.B., Mekuria, M. and Thierfelder, C. (2014). Adoption
and extent of Conservation agriculture practices among smallholder farmers in
Malawi. Journal of Soil and Water Conservation 69(2): 107-119.
Nicholoson, W. and Snyder, C. (2005). Microeconomic Theory Basic Principles and
Extension. Thomson High Education Narorp Boulevard USA 763pp.
Noltze, M., Schwarze, S. and Qaim, M. (2012). Understanding the adoption of system
technologies in smallholder agriculture: The system of rice intensification
(SRI) in Timor Leste. Agricultural systems 108: 64–73.
Noltze, M., Schwarze, S. and Qaim, M. (2013). Impacts of natural resource management
technologies on agricultural yield and household income: The system of rice
intensification in Timor Leste. Ecological Economics 85: 59-68.
Okuthe, I.K., Ngesa, U.F. and Ochola, W.W. (2013). Socio-Economic Determinants of
Adoption of Improved Sorghum Varieties and Technologies by Smallholder
Farmers: Evidence from South Western Kenya. International Journal of
Humanities and Social Science 3: 280-292.
Pan, Y., Smith, S.C. and Sulaiman, M. (2015). Agricultural Extension and Technology
Adoption for food Security: Evidence from Uganda. IZA Research Discussion
Paper No. 9206.
69
Sadoulet, E. and Janvry, A.(1995). Quantitative Development Policy Analysis. The Johns
Hopkins University Press, Baltimore and London.
Samiee, A., Rezvanfar, A. and Faham, E. (2009). Factors affecting adoption of integrated
pest management by wheat growers in Varamin County, Iran: African Journal
of Agricultural Research 4(5): 491-497.
Styger, E., Malick, A.A., Hamidou, G., Harouna , I., Mahamane, D., Ibrahima, A. and
Mohamed, T. (2011). Application of system of rice intensification practices
inthe arid environment of the Timbuktu region in Mali. Paddy and Water
Environment 9 (1): 137–144.
Takahashi, K. (2013). The roles of risk and ambiguity in the adoption of the system of
rice intensification (SRI): evidence from Indonesia. The Journal of Food
security 5(4): 513–524.
Takahashi, K. and Barrett, C. B. (2014). The System of Rice Intensification and its
impacts on household income and child schooling: Evidence from Rural
Indonesia. American Journal of Agricultural Economics 96 (1): 269-289.
Teklewold, H., Kassie, M. and Shiferaw, B. (2013). Adoption of multiple sustainable
agricultural practices in rural Ethiopia. Journal of Agricultural Economics 64:
597–623.
TNIC (2016). Proceedings of the Workshop on “New Directions for Irrigation
Development in Tanzania: The Context of Public Private Partnership,

70
September 2, 2016; National Irrigation Commission, Ministry of Water and
Irrigation. 29pp.
Tusekelege, H. K., Kingile, R.J., Ng’elenge, H.S., Bushindi, I.M., Nyambo, D.B. and
Nyiti, E. (2014). Option of increasing yields, profitability and water saving: A
Comparative Analysis of System of Rice Intensification in Morogoro,
Tanzania. International Journal of Recent Biotechnology 2(1): 4-10.
Uaiene, R., Arndt, C. and Masters, W. (2009). Determinants of Agricultural Technology
Adoption in Mozambique. Discussion papers No. 67E. National Directorate of
Studies and Policy Analysis, Ministry of Planning and Management Republic
of Mozambique. 29pp.
Udry, C. (2010). The Economics of Agriculture in Africa: Notes toward a Research
Program. African Journal of Agricultural and Resource Economics
5 (1): 284-299.
Uematsu, H. and Mishra, A. (2010). Can Education Be a Barrier to Technology
Adoption? Selected Paper prepared for presentation at the Agricultural and
Applied Economics Association 2010 AAEA,CAES, & WAEA Joint Annual
Meeting, Denver, Colorado, 25-27. 39pp.
URT (2010). The National Irrigation Policy Ministry of Water and Irrigation, Dar-es-
salaam: 70pp.
URT (2012). National Sample census of Agriculture 2007/2008, Volume VI: Regional
report: Mbeya region. 350pp.
71
URT (2013). National Agriculture Policy. Ministry of Agriculture Food Security and
Cooperatives, Dar es Salaam, 42pp.
URT (2016). Agricultural Sector Development Programme Phase Two (ASDP II),
Ministry of Agriculture, Dar es Salaam, 205pp.
URT (2017). The 2016/2017 annual agricultural sample survey report. National Bureau
of Statistics, Dar es Salaam, 88pp.
URT-NRDS (2010). National Rice Development Strategy, Tanzania, 2010. Ministry of
Agriculture Food Security and Cooperatives, Dar es Salaam, 32pp.
USDA (2018). United republic of Tanzania corn, wheat and rice report grain and feed
annual 2018. USDA foreign agricultural service, USA. 12pp
Varma, P. (2017). Adoption of System of Rice Intensification and its impact on rice yields
and household income: An analysis for India. Indian Institute of Management,
Research and Publications. 27pp.
Watcharaanantapong, P., Roberts, R.K., Lambert, D.M., Larson, J.A., Velandia, M.,
English, B.C., Rejesus, R.M. and Wang, C. (2014). Timing of precision
agriculture technology adoption in US cotton production. Journal of Precision
Agriculture 15: 427-446.

72
White, H. and Sabarwal, S. (2014). Quasi-experimental Design and Methods,
Methodological Briefs: Impact Evaluation 8, UNICEF Office of Research,
Florence. 14pp.

73
APPENDICES
Appendix 1: Implementation of PPS
The PPS involved listing all irrigation schemes onto which rice is produced, identifying
the population size in each irrigation scheme (number of beneficiaries), calculating
successive cumulative totals in each irrigation scheme, computing sampling interval (SI)
and probability of each irrigation scheme being sampled (Prob 1) and probability of each
individual being sampled in each irrigation scheme (Prob 2). SI was computed as the ratio of cumulative total population to number of irrigation
schemes to be sampled that is,
Cumulative total population = 27 426 = 9 142…………….(3)
Number of irrigation schemes to be sampled 3
The probabilities of each irrigation scheme to be sample and of each individual being
sampled in each irrigation scheme were calculated by: Prob 1 = Irrigation scheme population x Number irrigation schemes to be sampled.... (4) Total Population
and Prob 2 = Number of individuals sampled in each irrigation scheme……………(5) Irrigation scheme population
In implementing PPS method, the last step was the generation of Random numbers and
the one which is equal or less than the SI was selected as the Random Start (RS) and the
first cluster to be sampled contained that cumulative population. The selected Random
Start was 5660.Then the series of: RS; RS + SI; RS + 2SI; …. RS+ (d-1)*SI, where‘d’ was the number
of clusters, were computed. The first three values in the series were 5660; 5 660+ 9
142= 14 802 and 5 660 + 2*9 142 = 23 944. The number in the series corresponded with
the cumulative totals for Mbuyuni, Madibira and Mwendamtitu irrigation schemes
respectively. In that regard therefore Mbuyuni, Madibira and Mwendamtitu irrigation
schemes were sampled in the first stage. Table 11: Implementation of PPS

74
Irrigation SchemePopulationsize
Cumulative Total
Farmers per irrigationscheme Prob 1 Prob 2
Overall Weight
Gwiri 2 600 2 600 106 0.283 0.041 86.21Ipatagwa 565 3 165 106 0.062 0.188 86.21Ruanda Majenje 992 4 157 106 0.109 0.107 86.21Majengo 294 4 451 106 0.032 0.361 86.21Herman 120 4 571 106 0.013 0.883 86.21Mbuyuni 1 105 5 676 106 0.121 0.096 86.21*Kapunga S/H 860 6 536 106 0.094 0.123 86.21Motombaya 2 930 9 466 106 0.320 0.036 86.21Kongolo Mswiswi 214 9 680 106 0.023 0.495 86.21Kapyo 486 10 166 106 0.053 0.218 86.21Lyanyura 830 10 996 106 0.091 0.128 86.21Maendeleo 850 11 846 106 0.093 0.125 86.21Matebete 436 12 282 106 0.048 0.243 86.21Nguvu kazi 150 12 432 106 0.016 0.707 86.21Njombe 145 12 577 106 0.016 0.731 86.21Mwendamtitu 2 340 14 917 106 0.255 0.045 86.21*Isenyela 1 800 16 717 106 0.196 0.059 86.21Chang'ombe 364 17 081 106 0.040 0.291 86.21Chamoto Batania 123 17 204 106 0.013 0.862 86.21Chosi 570 17 774 106 0.062 0.186 86.21Gonakovagogolo 750 18 524 106 0.082 0.141 86.21Uturo 1 200 19 724 106 0.131 0.088 86.21Igumbilo Isitu 475 20 199 106 0.052 0.223 86.21Njalalila 450 20 649 106 0.049 0.236 86.21Msesule 302 20 951 106 0.033 0.351 86.21Madibira 3112 24 063 106 0.340 0.034 86.21*Ibohora 147 24 210 106 0.016 0.721 86.21WIA – Mahango 764 24 974 106 0.084 0.139 86.21Chimba chimba 1 418 26 392 106 0.155 0.075 86.21Mtemela/Mhwela 752 27 144 106 0.082 0.141 86.21Igomelo 382 27 526 106 0.042 0.277 86.21
Source: Mbarali District Council Office and self computation *The selected irrigation schemes
Since PPS method was used, in the second stage the same number of respondents (106
smallholder rice farmers) was selected from each sampled irrigation scheme in first stage.
In PPS, the second stage compensates the first stage hence enabling each smallholder
farmer in the population of smallholder farmers to have the same probability of being
sampled.

75
Appendix 2: Mean and Median for Farm size, Farm assets value, Revenue, Costs
and Profit
VariableSRI non adopters
SRI adopters
Mean MedianStd
Mean MedianStd
Farm size (ha) 1.5 1.2 1.179 2.01 1.6 1.647
Farm assets value(TAS million
2.41 0.024 3.637 6 4.03 8.248
Rice yields (Tones/ha) 3.99 3.90 0.956 6.32 6.25 0.567
Revenue (TAS /ha) 2 916 690 2 850 900 820 460 4 619 920 4 568 750 1 190 262.10
Input cost (TAS/ha) 441025 441250 157744.19 504175 487500 191170.25
Labour cost(TAS/ha) 1 089 550 1 013 750 187448.59 1 450 300 1 387 500 301460
Total variable cost(TAS/ha) 1 530 5751 455 000
1 066 152.5 1 954 475 1 875 000 1 404 642.50
Unit cost (TAS/Kg) 384 373 139.12 326 300 114.62
Gross profit TAS/ha 1386115 1395900 204393.20 2558770 2693750 1160957.73
Gross profit per kg(TAS) 347 358 89.10 405 431 72.10
Std denotes Standare deviation.
Appendix 3: Control variable and their effect on rice yield
Variables Ln rice yield per ha
Education level of household head 0.023(0.036)
Access to off farm activities -0.089(0.037)**
Active family labour size 0.036(0.019)*
Experience in rice production 0.006(0.015)
Value of farm assets 0.011(0.008)
Level status of the farm -0.033(0.057)
Farm location in the scheme -0.011(0.024)
Adequate water availability for irrigation when is on need -0.069(0.059)
Plot size in irrigation scheme -0.006(0.006)
Access to credit -0.003(0.043)
Frequency of extension agents contact with smallholder farmers 0.003(0.020)
**P<0.05; *P<0.1; Robust standard errors have been given in the brackets.
Appendix 4: Questionnaire for Smallholder rice farmers in Irrigation schemes
1.0 General Information
1.1 Code number........................................Date................................................................
1.2 Name of interviewer.........................................................................................................
1.3 Name of Ward..............................Village............................Scheme..............................
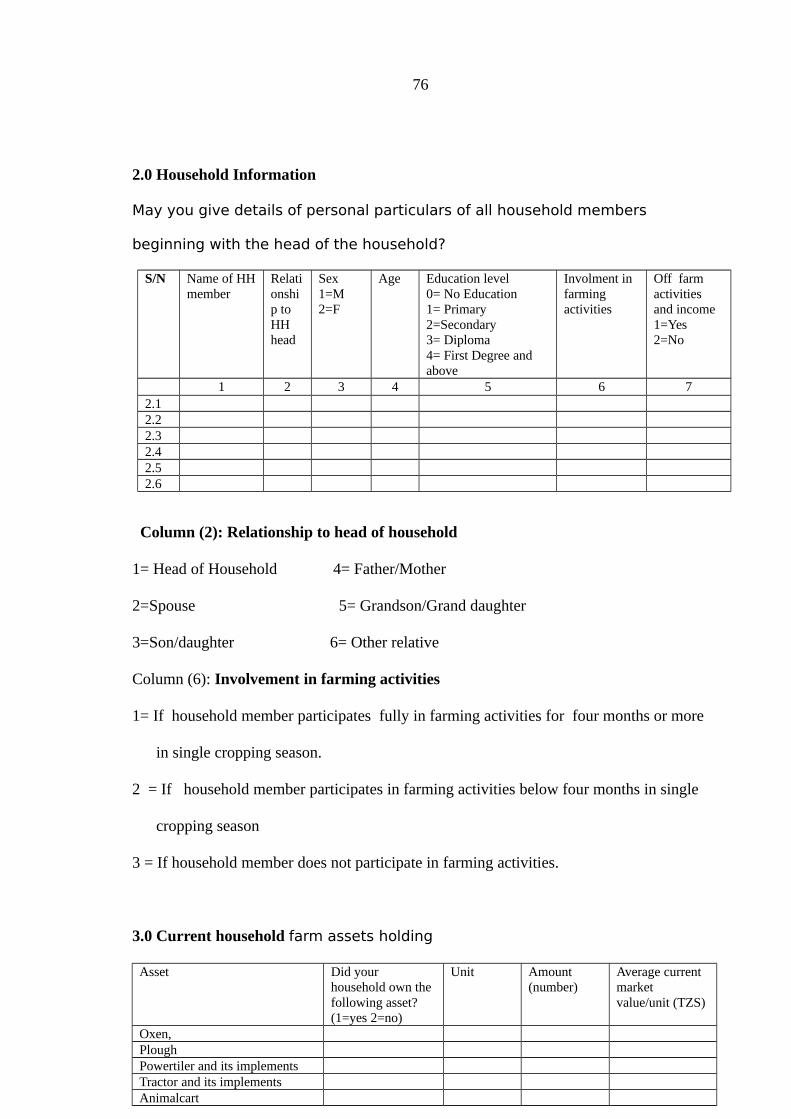
76
2.0 Household Information
May you give details of personal particulars of all household members
beginning with the head of the household?
S/N Name of HHmember
Relationship to HH head
Sex1=M2=F
Age Education level0= No Education1= Primary 2=Secondary3= Diploma 4= First Degree and above
Involment in farming activities
Off farm activities and income1=Yes2=No
1 2 3 4 5 6 72.12.22.32.42.52.6
Column (2): Relationship to head of household
1= Head of Household 4= Father/Mother
2=Spouse 5= Grandson/Grand daughter
3=Son/daughter 6= Other relative
Column (6): Involvement in farming activities
1= If household member participates fully in farming activities for four months or more
in single cropping season.
2 = If household member participates in farming activities below four months in single
cropping season
3 = If household member does not participate in farming activities.
3.0 Current household farm assets holding
Asset Did your household own the following asset? (1=yes 2=no)
Unit Amount (number)
Average current market value/unit (TZS)
Oxen, PloughPowertiler and its implementsTractor and its implementsAnimalcart
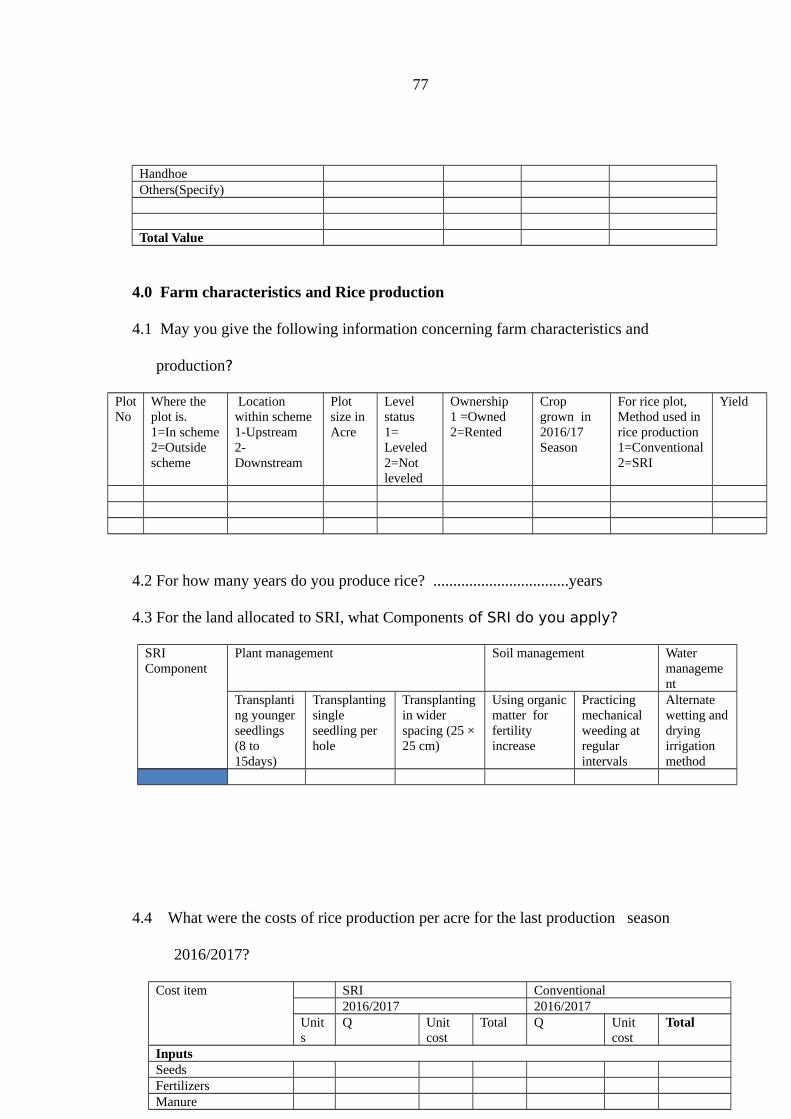
77
HandhoeOthers(Specify)
Total Value
4.0 Farm characteristics and Rice production
4.1 May you give the following information concerning farm characteristics and
production?
PlotNo
Where the plot is.1=In scheme2=Outside scheme
Location within scheme1-Upstream2- Downstream
Plot size in Acre
Level status1= Leveled2=Not leveled
Ownership1 =Owned2=Rented
Crop grown in 2016/17 Season
For rice plot, Method used in rice production1=Conventional2=SRI
Yield
4.2 For how many years do you produce rice? ..................................years
4.3 For the land allocated to SRI, what Components of SRI do you apply?
SRI Component
Plant management Soil management Water management
Transplanting youngerseedlings (8 to 15days)
Transplantingsingle seedling per hole
Transplantingin wider spacing (25 ×25 cm)
Using organicmatter for fertility increase
Practicing mechanical weeding at regular intervals
Alternate wetting anddrying irrigation method
4.4 What were the costs of rice production per acre for the last production season
2016/2017?
Cost item SRI Conventional2016/2017 2016/2017
Units
Q Unit cost
Total Q Unit cost
Total
InputsSeedsFertilizersManure

78
Water chargeSub totalLabour chargesPloughingHarrowingPlantingWeeding 1Weeding 2Birds scaringBaggingHarvestingSub totalOthers (specify)
Total Cost
4.5 What were the Minimum and maximum prices of rice (paddy) for last production
season (2016/2017)
Season
(2016/2017)
Price per bag (TZS)Minimum Maximum Average price
5.0 Water for Irrigation
5.1 What is the main source of water used in rice irrigation in your scheme? 1= River(s)
___ 2=Pond ___ 3= others (Specify)...............................................
5.2 Is water available throughout the rice production season? 1=Yes ___ 2= No ___
5.3 Is the adequate water available when is needed for irrigation? 1= Yes ___ 2= No ___
6.0 Provision of Services for rice Production
a. Information on SRI and Extension services
6.1 Did you get information on SRI from government / Development agent sources?
1= Yes ___ 2= No ___

79
6.2 If no in 6.1 above, where did you get information about SRI for the first time? 1=
Friend___ 2=Relative ___ 3= Radio/ TV___ 4= Newspapers___ 5=Others
(Specify)...............................................
6.3 Did you get extension services during the 2016/2017 production season?
1= Yes ___ 2 = No ___
6.4 If yes, in (6.3) how frequently do the extension agents visit you per cropping season
for rice production advice and training? 1= Once___ 2= Twice ___ 3= Three
times ___ 4= Four times___ 5 =Others Specify ___ ..........................................
b. Credit services
6.5 Have you ever used credit for rice production activities in 2015/2016 and 2016/ 2017
production seasons? 1= Yes ___ 2 = No ___
6.6 If yes in (6.5), May you give the following details please!
Sourceof credit ( K1 below)
Purposeof credit (K2 below)
TotalAmount in TZS
Interest rate (%)/annum
Amountpaid in TZS
AmountUnpaid in TZS
K1: Source of credit: 1= SACCOS 2= Bank 3=Scheme 4= Local lenders 5= Others
(specify)............................................................................
K2: Main purpose of credit: 1= Payment for labour 2= Buying fertilizers 3= Buying
seeds 4= others (specify)................................................................................
6.7 If you did not use credit, What was your main reason? 1= No need for credit___
2=No one to give credit___ 3= Fear of inability to pay___ 4= Lack of asset for
collateral___ 6=High interest rate ___ 6=Others (Specify)............................
6.8 Have you ever failed to pay back your agricultural debts as per contract?
1= Yes ___ 2 = No ___
6.9 If yes in (6.7) What were the main three reasons for unpaid amount?

80
1......................................................2..................................................3..................................
7.0 Any comments concerning SRI/Conventional practices in rice production:
................................................................................................................................................
................................................................................................................................................
................................................................................................................................................
................................................................................................................................................
Thank you very much for your Co-operation
Appendix 5: Checklist of key informants for irrigation scheme stakeholders/
irrigation scheme leaders and government officials
Section I: General Information
1. Name of the respondent
2. Job title

81
3. Organization
Section II: Rice production issues in irrigation schemes
4. What is the total number of beneficiaries of the irrigation scheme?
5. What is the total number of trained smallholder farmers on SRI techniques in the
scheme?
6. What are the criteria used in selecting farmers to participate in rice production,
particularly SRI technique trainings in the irrigation scheme?
7. What is the schedule of extension agent contact with smallholder rice farmers in
irrigation scheme in single cropping season?
8. What are the constraints of using SRI in irrigation scheme?
Thank you very much for your Co-operation