a statistical analysis of covid-19 breakthrough infections
TRANSCRIPT

BACKGROUNDERNo. 3648 | August 12, 2021
CENtER FOR DAtA ANALYsIs
this paper, in its entirety, can be found at http://report.heritage.org/bg3648
the Heritage Foundation | 214 Massachusetts Avenue, NE | Washington, DC 20002 | (202) 546-4400 | heritage.org
Nothing written here is to be construed as necessarily reflecting the views of The Heritage Foundation or as an attempt to aid or hinder the passage of any bill before Congress.
A Statistical Analysis of COVID-19 Breakthrough Infections and DeathsKevin D. Dayaratna, PhD, and Norbert J. Michel, PhD
the CDC announced new COVID-19 guide-lines for the vaccinated based on data that allegedly imply that vaccines offer little protection against the Delta variant.
KEY TAKEAWAYS
the new data simply do not support such evidence, and the CDC’s latest move to re-impose mask mandates runs the risk of increasing vaccine hesitancy.
Health guidelines must reflect the reality that vaccines provide significant protec-tion against serious illness or death from the virus, including the Delta variant.
COVID-19 has now infected more than 35 million Americans and claimed the lives of more than 600,000.1 After the introduction
of the vaccines, COVID-19 cases and deaths declined significantly, although there has been a recent uptick in cases due to the Delta variant.
The Delta variant, scientifically known as the B.1.617.2. variant, is a mutation of the coronavirus that surfaced in India in December 2020. The strain rapidly became the dominant variant in several countries, including the United Kingdom.2 Accord-ing to Centers for Disease Control and Prevention (CDC) estimates, at the end of July 2021, the Delta variant represented more than 80 percent of new U.S. COVID-19 cases.3 This fact has surely contributed to Americans’ concerns over the efficacy of vaccines, but the data show that vaccines provide significant

August 12, 2021 | 2BACKGROUNDER | No. 3648heritage.org
protection against serious illness or death from the virus, including the Delta variant.
While some uncertainty remains, as it would with any novel virus, the CDC has done a poor job of using existing evidence to quell the public’s concerns about vaccine safety and efficacy. Indeed, CDC officials and other government officials have added to Americans’ confusion with conflicting messages, often unconnected to any supporting data.4 In the latest such message, on July 27, CDC Director Rochelle Walensky announced new guidelines that imply that the vaccines offer little protection against the Delta variant.
The new guidelines recommend (among other things) that all people, including the fully vaccinated, wear masks “in public indoor settings” in areas of high disease proliferation.5 After being criticized for failing to sup-port its recommendations with data,6 the CDC released a new report on July 30 that, supposedly, contained the evidence.7 At almost the same moment that Walensky was insisting that the new data supported the recommen-dations for vaccinated people, a member of the White House COVID-19 response team was chastising The Washington Post and The New York Times for being “completely irresponsible” by reporting the supposed heightened risk of infection for the vaccinated.8 Faced with these kinds of conflicting messages, it is easy to see how the public could be confused about the Delta variant and the efficacy of vaccines.
As demonstrated in this Backgrounder, while news stories referred to the new CDC data as “sobering”9 and “unsettling,”10 such descriptions are, at best, severely misguided. In fact, even though The Washington Post referred to the new CDC report as a “pivotal CDC study,”11 the report is not a research study at all. It merely explains some of the data collected in response to a COVID-19 outbreak in Barnstable County, Massachusetts. There was no controlled study of any sort—not of the effectiveness of masks, or even of the basic transmission of COVID-19. The report merely describes data from a sample that is not representative of the U.S. population, Barnstable, or (possibly) even the festivities at which the outbreak occurred.
CDC leadership should have heeded the warning of the report’s own authors, who specified that “data from this report are insufficient to draw conclusions about the effectiveness of COVID-19 vaccines against SARS-CoV-2, including the Delta variant, during this outbreak.”12 Despite the misuse of the data in the CDC report, the overall evidence remains clear: Vaccines have provided significant protection against serious illness or death from COVID-19.

August 12, 2021 | 3BACKGROUNDER | No. 3648heritage.org
COVID-19 Cases, Deaths, and Vaccines
Chart 1 presents new daily cases and deaths over the course of the pandemic.
As Chart 1 illustrates, the virus has fluctuated significantly in the United States since early 2020, reaching its highest peak last winter.13 Three
0
50,000
100,000
150,000
200,000
250,000
300,000
FJ M A M J J A S O N D J F M A M J J A2020 2021
Daily new casesDaily new deaths
FJ M A M J J A S O N D J F M A M J J A2020 2021
FJ M A M J J A S O N D J F M A M J J A2020 2021
0
50,000
100,000
150,000
200,000
250,000
300,000
BG3648 A heritage.orgSOURCE: Our World in Data, “Coronavirus Pandemic (COVID-19),” https://ourworldindata.org/coronavirus (accessed August 6, 2021).
CHART 1
COVID-19: Daily New Cases and Deaths in the U.S.
CASES
0
1,000
2,000
3,000
4,000
DEATHS

August 12, 2021 | 4BACKGROUNDER | No. 3648heritage.org
vaccines—produced by Pfizer, Moderna, and Johnson & Johnson—have received emergency use authorization from the U.S. Food and Drug Admin-istration. Both new cases and deaths have, for the most part, declined significantly through spring 2021. Chart 2 presents the number of doses given to the general public by each manufacturer.
During early 2021, there was tremendous demand for vaccines, with many people having difficulty scheduling appointments and some websites even crashing due to high traffic.14 Since April 2021, however, the number of doses administered has steadily declined for all three vaccines. The Institute for Health Metrics and Evaluation (IHME) at the University of Washington School of Medicine conducted a sta-tistical analysis of survey data and noted that a significant fraction of the American population is vaccine hesitant, which has likely contrib-uted to this decline.15 According to the American Academy of Family Physicians, the main reasons for hesitancy include concerns about safety and efficacy, preference for physiological immunity, distrust of government and health organizations, and desire for autonomy and personal freedom.16
0.0
0.5
1.0
1.5
2.0
Jan. Feb. March April May June July Aug.
BG3648 A heritage.orgSOURCE: Authors’ calculations based on data from Our World in Data, “Coronavirus Pandemic (COVID-19),” https://ourworldindata.org/coronavirus (accessed August 6, 2021).
MILLIONS OF DOSES ADMINISTERED, SEVEN-DAY AVERAGES
CHART 2
Daily Vaccine Doses Administered in the U.S.
Pfizer/BioNTechModernaJohnson & Johnson

August 12, 2021 | 5BACKGROUNDER | No. 3648heritage.org
As Chart 1 demonstrates, COVID-19 cases and deaths declined signifi-cantly for much of the first half of 2021 as more Americans were vaccinated. While the U.S. is experiencing a surge in cases due to the Delta variant, most of these cases are among the unvaccinated, and COVID-19 deaths are nowhere near the levels before vaccines were authorized.
Furthermore, as of August 4, 2021, more than 164 million Americans were fully vaccinated against COVID-19, with 191 million people having acquired partial immunity through at least one dose.17 Yet, among those fully vaccinated, the CDC reports 7,525 COVID-19 patients who either were hospitalized or died, a figure representing 0.005 percent of the fully vaccinated.18 According to the CDC, 74 percent of these cases were people ages 65 and older, 26 percent of these hospitalizations were reported as asymptomatic or not related to COVID-19, and 21 percent (316) of the 1,507 fatal cases were reported as asymptomatic or not related to COVID-19.19
The CDC’s New Public Health Recommendations
As a result of the recent increases in cases due to the Delta variant, the CDC updated its “Interim Public Health Recommendations for Fully Vac-cinated People.”20 The updates include the recommendation that the fully vaccinated “wear a mask in public indoor settings in areas of substantial or high transmission.” The updated guidelines also include the following three recommendations:
1. Fully vaccinated people might choose to wear a mask regardless of the level of transmission particularly if they are immunocompromised or at increased risk for severe disease from COVID-19, or if they have someone in their household who is immunocompromised, at increased risk of severe disease, or not fully vaccinated (emphasis added);
2. Fully vaccinated people who have come into close contact with some-one with suspected or confirmed COVID-19 should be tested three to five days after exposure, and wear a mask in public indoor settings for 14 days or until they receive a negative test result; and
3. Universal indoor masking for all teachers, staff, students, and visitors to schools, regardless of vaccination status.21

August 12, 2021 | 6BACKGROUNDER | No. 3648heritage.org
At the very least, these new guidelines—along with Walensky’s state-ments—give the impression that the CDC’s new report provides evidence that masks provide better protection than vaccines against contracting COVID-19. The new report simply does not contain such evidence, and the CDC’s latest moves run the risk of increasing vaccine hesitancy. These mixed signals are particularly disturbing because, especially compared to vaccinations, the effectiveness of surgical or cloth masks in meaningfully reducing COVID-19 transmission is not supported by a review of the pro-fessional literature. Moreover, evidence shows that mask mandates have done little—if anything—to curb the transmission of the virus and is even less likely to do so compared to vaccinations.22
Interestingly, the CDC’s “Science Brief,”23 which claims to provide evi-dence that wearing cloth masks help to control the spread of COVID-19, dismisses the findings of the one controlled study that examines whether masks protect uninfected people from contracting COVID-19. That study found no statistical difference in infection rates between those wearing masks and those not wearing masks.24 In any case, the new CDC paper indis-putably does not study the effectiveness of masks in preventing COVID-19 transmission—neither in the vaccinated nor in the unvaccinated.
The CDC “Study” of Barnstable County, Massachusetts
The CDC based its new recommendations on a July 30 Morbidity and Mortality Weekly Report (MMWR) article.25 The authors of that article reported that 469 COVID-19 cases were associated with multiple summer events in Barnstable County, Massachusetts, starting around July 4.26 Approximately three-quarters (346) of the cases occurred in fully vacci-nated persons, and 274 of the cases were symptomatic. The authors also report that 133 cases had the Delta variant, that just five of the cases resulted in hospitalizations, and that no deaths have been associated with the out-break.27 Finally, the MMWR also reports that the viral loads in 127 of the fully vaccinated people who contracted COVID-19 were “similar to those among 84 patients who were unvaccinated, not fully vaccinated, or whose vaccination status was unknown.”28
Beyond reporting these statistics, the MMWR provides little additional information other than discussing key limitations to the data. One key limitation is that the qualitative results “might mean that the viral load of vaccinated and unvaccinated persons infected with SARS-CoV-2 is also simi-lar,” but that “microbiological studies are required to confirm these findings.”29 This limitation is even more problematic given issues regarding the sample.

August 12, 2021 | 7BACKGROUNDER | No. 3648heritage.org
The MMWR acknowledges that asymptomatic infections are likely underrepresented in the data, and that “demographics of cases likely reflect those of attendees at the public gatherings.”30 (Emphasis added.) This last limitation is critical because the report recognizes that the sample may not even be truly representative of the people who attended the events in Barnstable.31 In statistical terms, the sample is heavily biased—the only people included in the data are those who were in Barnstable during the festivities and who reported contracting COVID-19.
It is a mistake, therefore, to project these results onto the general U.S. population, or even to a randomly selected person who attended the fes-tivities in Barnstable. It would be grossly irresponsible, for example, to use the data in the MMWR to suggest that the typical vaccinated American has similar chances of contracting COVID-19—much less becoming severely ill from such an occurrence—to those of someone who is not vaccinated. Indeed, it is completely unsurprising that the authors include the following disclaimer: “data from this report are insufficient to draw conclusions about the effectiveness of COVID-19 vaccines against SARS-CoV-2, including the Delta variant, during this outbreak.”32
The only mystery is why the MMWR includes this language:
Findings from this investigation suggest that even jurisdictions without sub-
stantial or high COVID-19 transmission might consider expanding prevention
strategies, including masking in indoor public settings regardless of vacci-
nation status, given the potential risk of infection during attendance at large
public gatherings that include travelers from many areas with differing levels
of transmission.33
The MMWR does not, in any way, provide statistical evidence for these recommendations: There was no investigation of these prevention strat-egies—none—among the vaccinated or unvaccinated. In fact, given the underlying data, it is difficult to see how including this sentence in the MMWR could do anything other than mislead the public and unnecessarily spread fear.
Potential Positivity Rates and Hope
Since the publication of the MMWR, new cases were linked to the fes-tivities and reported to the Barnstable County Department of Health. As of July 29, the total number of confirmed COVID-19 cases was 934, with 560 cases from the state of Massachusetts. The data indicates that 73 percent of
August 12, 2021 | 8BACKGROUNDER | No. 3648heritage.org
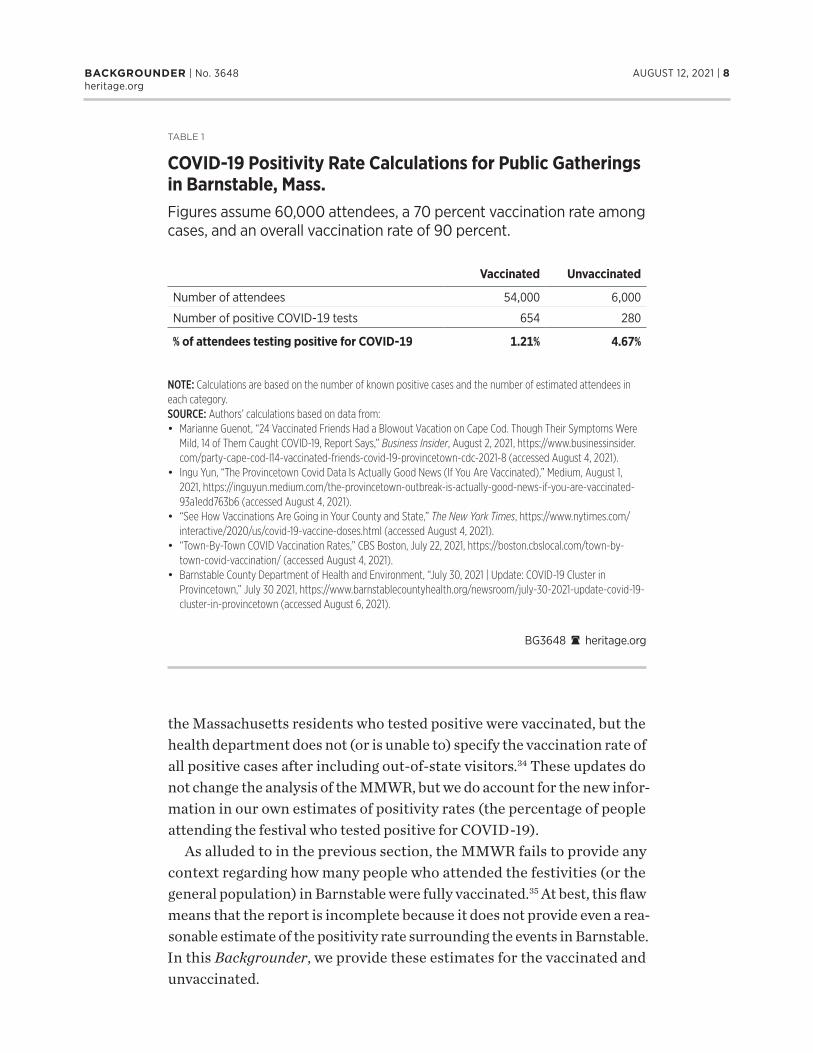
the Massachusetts residents who tested positive were vaccinated, but the health department does not (or is unable to) specify the vaccination rate of all positive cases after including out-of-state visitors.34 These updates do not change the analysis of the MMWR, but we do account for the new infor-mation in our own estimates of positivity rates (the percentage of people attending the festival who tested positive for COVID-19).
As alluded to in the previous section, the MMWR fails to provide any context regarding how many people who attended the festivities (or the general population) in Barnstable were fully vaccinated.35 At best, this flaw means that the report is incomplete because it does not provide even a rea-sonable estimate of the positivity rate surrounding the events in Barnstable. In this Backgrounder, we provide these estimates for the vaccinated and unvaccinated.
NOTE: Calculations are based on the number of known positive cases and the number of estimated attendees in each category.SOURCE: Authors’ calculations based on data from:• Marianne Guenot, “24 Vaccinated Friends Had a Blowout Vacation on Cape Cod. Though Their Symptoms Were
Mild, 14 of Them Caught COVID-19, Report Says,” Business Insider, August 2, 2021, https://www.businessinsider.com/party-cape-cod-l14-vaccinated-friends-covid-19-provincetown-cdc-2021-8 (accessed August 4, 2021).
• Ingu Yun, “The Provincetown Covid Data Is Actually Good News (If You Are Vaccinated),” Medium, August 1, 2021, https://inguyun.medium.com/the-provincetown-outbreak-is-actually-good-news-if-you-are-vaccinated-93a1edd763b6 (accessed August 4, 2021).
• “See How Vaccinations Are Going in Your County and State,” The New York Times, https://www.nytimes.com/interactive/2020/us/covid-19-vaccine-doses.html (accessed August 4, 2021).
• “Town-By-Town COVID Vaccination Rates,” CBS Boston, July 22, 2021, https://boston.cbslocal.com/town-by-town-covid-vaccination/ (accessed August 4, 2021).
• Barnstable County Department of Health and Environment, “July 30, 2021 | Update: COVID-19 Cluster in Provincetown,” July 30 2021, https://www.barnstablecountyhealth.org/newsroom/july-30-2021-update-covid-19-cluster-in-provincetown (accessed August 6, 2021).
TABLE 1
COVID-19 Positivity Rate Calculations for Public Gatheringsin Barnstable, Mass.Figures assume 60,000 attendees, a 70 percent vaccination rate among cases, and an overall vaccination rate of 90 percent.
Bg3648 A heritage.org
Vaccinated Unvaccinated
Number of attendees 54,000 6,000
Number of positive COVID-19 tests 654 280
% of attendees testing positive for COVID-19 1.21% 4.67%

August 12, 2021 | 9BACKGROUNDER | No. 3648heritage.org
The first piece of information needed is the number of people who attended the festivities. While it is impossible to know that figure with certainty, at least two public estimates suggest that approximately 60,000 people attended the events in Barnstable.36 There is, perhaps, less guess-work involved in obtaining a realistic estimate of the next necessary piece of information: the number of people vaccinated.
According to The New York Times, the State of Massachusetts and Barn-stable County have adult vaccination rates of 74.8 percent and 76 percent, respectively.37 The town of Provincetown itself (where many of the cele-bratory events took place) has a vaccination rate of 95 percent.38 Although it is unclear what the actual vaccination rate was among the attendees, Dr. Ingu Yun, who attended the festivities and engaged in a similar analysis associated only with fully vaccinated people, suggests that the vaccination rate of attendees was well above 90 percent.39
To derive a base estimate, we assume an overall vaccination rate of 90 percent, among 60,000 attendees of the public gatherings in Barnstable, along with a vaccination rate of 70 percent among the positive cases. These assumptions result in positivity rates of 1.21 percent for the vaccinated, and 4.67 percent for the unvaccinated. (See Table 1.)
That is, assuming a 90 percent vaccination rate, only 1.21 percent of the estimated 54,000 vaccinated attendees, and 4.67 percent of the estimated 6,000 unvaccinated, tested positive for COVID-19. Of course, the festivities had many out-of-town visitors, making it difficult to ascertain the true vac-cination rate among attendees. Therefore, we estimate positivity rates for a range of vaccination coverage. Chart 3 presents positivity-rate estimates with vaccine rates ranging from 60 percent (the national adult vaccination rate40) to 95 percent.
As Chart 3 illustrates, under all such assumptions, the percentage of the breakthrough cases (associated with the Barnstable festivities) among the vaccinated is less than 2 percent of the estimated population of attendees. The MMWR provides no such analysis, thus omitting critical context for how COVID-19 might spread among the vaccinated. Thus, headlines, such as “74 Percent of People Infected in Massachusetts Covid Outbreak Were Fully Vaccinated,” are highly misleading and risk needlessly creating panic.41
It is true that 74 percent of the attendees who later reported contracting COVID-19 were fully vaccinated, but that figure, under the assumptions made in Chart 3, represents—at most—less than 2 percent of the attendees. More important, out of these 133 COVID-19 patients who had the Delta variant, five were hospitalized (0.008 percent of the estimated attendees) and not a single person died.42

August 12, 2021 | 10BACKGROUNDER | No. 3648heritage.org
According to the CDC’s most recent data on breakthrough cases (those where a fully vaccinated person contracts COVID-19), of more than 164 million fully vaccinated Americans, there have been 7,101hospitalizations and 1,507 deaths.43 The CDC also notes that 26 percent of these hospital-izations and 21 percent of the deaths were “asymptomatic or not related to COVID-19.”44
BG3648 A heritage.org
SOURCE: Authors' calculations and assumptions based on data from:• Marianne Guenot, “24 Vaccinated Friends Had a Blowout Vacation on
Cape Cod. Though Their Symptoms Were Mild, 14 of Them Caught COVID-19, Report Says,” Business Insider, August 2, 2021, https://www.businessinsider.com/party-cape-cod-l14-vaccinated- friends-covid-19-provincetown-cdc-2021-8 (accessed August 4, 2021).
• Ingu Yun, “The Provincetown Covid Data Is Actually Good News (If You Are Vaccinated),” Medium, August 1, 2021, https://inguyun.medium. com/the-provincetown-outbreak-is-actually-good-news-if-you-are- vaccinated-93a1edd763b6 (accessed August 4, 2021).
• “See How Vaccinations Are Going in Your County and State,” The New York Times, https://www.nytimes.com/interactive/2020/us/ covid-19-vaccine-doses.html (accessed August 4, 2021).
• “Town-By-Town COVID Vaccination Rates,” CBS Boston, July 22, 2021, https://boston.cbslocal.com/town-by-town-covid-vaccination/ (accessed August 4, 2021).
• Barnstable County Department of Health and Environment, “July 30, 2021 | Update: COVID-19 Cluster in Provincetown,” July 30 2021, https://www.barnstablecountyhealth.org/newsroom/july-30-2021- update-covid-19-cluster-in-provincetown (accessed August 6, 2021).
NOTE: Calculations are based on the number of known positive cases and the number of estimated attendees in each category.
POSITIVITY RATE
OVERALL VACCINATION RATE
CHART 3
Potential COVID-19 Positivity Rates for Public Gatherings in Barnstable, Mass., by Overall Vaccination RateFigures assume 60,000 attendees and a 70 percent vaccination rate among cases.
0%
5%
10%
15%
20%
25%
98%95%90%85%80%75%70%65%60%
■ Vaccinated people■ Unvaccinated people
1.8% 1.7% 1.6% 1.5% 1.4% 1.3% 1.2% 1.1% 1.1%1.2% 1.3% 1.6% 1.9% 2.3%3.1%
4.7%
9.3%
23.4%

August 12, 2021 | 11BACKGROUNDER | No. 3648heritage.org
Vaccines clearly provide substantial protection against COVID -19—among the fully vaccinated, these figures represent 0.003 percent hospitalized and 0.0007 percent deaths. These percentages indicate that
BG3648 A heritage.org
NOTE: COVID-19 breakthrough odds are calculated from CDC data. All other odds are lifetime odds published by the National Safety Council.SOURCES: Authors’ calculations based on data from Centers for Disease Control and Prevention, “COVID-19 Vaccine Breakthrough Case Investigation and Reporting,” https://www.cdc.gov/vaccines/covid-19/health-departments/breakthrough-cases.html (accessed August 10, 2021), and National Safety Council, “Preventable Deaths: Odds of Dying,” NSC Injury Facts, https://injuryfacts.nsc.org/all-injuries/preventable-death-overview/odds-of-dying/ (accessed August 4, 2021).
CHART 4
Catastrophic Outcomes of Various Events
Dying of heart disease
Dying of cancer
Dying of all preventable causes of death
Dying of chronic lower respiratory disease
Dying of suicide
Dying of opioid overdose
Dying from a fall
Dying in a motor-vehicle crash
Dying via a gun assault
Dying in a pedestrian incident
Dying in motorcycle accident
Dying of drowning
Dying of fire or smoke
Dying via choking on food
Dying via sunstroke
Dying via accidental gun discharge
Dying via electrocution, radiation, temperature
Dying via sharp objects
Being hospitalized due to COVID-19, fully vaccinated
Dying from a cataclysmic storm
Dying from hornet, wasp, and bee stings
Dying from hot surfaces and substances
Dying from a dog attack
Dying of COVID-19, fully vaccinated
Dying of a lightning strike
1 in 6
1 in 7
1 in 24
1 in 27
1 in 88
1 in 92
1 in 106
1 in 107
1 in 289
1 in 543
1 in 899
1 in 1,128
1 in 1,547
1 in 2,535
1 in 8,248
1 in 8,571
1 in 13,394
1 in 29,334
1 in 31,030
1 in 58,669
1 in 59,507
1 in 63,113
1 in 86,781
1 in 137,698
1 in 138,849
Outcome Odds

August 12, 2021 | 12BACKGROUNDER | No. 3648heritage.org
the odds of a fully vaccinated person being hospitalized due to COVID-19 are approximately 1 in 31,000, while the odds of dying are 1 in 137,000. To better put these odds in perspective, it is useful to examine the odds of various causes of death published by the National Safety Council.
Alternative Causes of Death. Sadly, people die each year. In 2019, the National Safety Council used data from the National Center for Health Sta-tistics to estimate the odds of various lifetime causes of death, including (among others) heart disease, cancer, pedestrian incidents, and drowning. Heart disease, cancer, and other chronic lower respiratory diseases consti-tuted some of the highest causes of death in 2019 (with odds of 1 in 6, 1 in 7, and 1 in 27, respectively).
There were many other causes of death albeit occurring at much lower frequencies. For example, motor vehicle crashes were associated with a 1 in 103 odds of dying, gun assaults were associated with a 1 in 289 odds of dying, and hornet wasp and bee stings were associated with a 1 in 59,507 odds of
0% 25% 50% 75% 100%
All Ages
65+
50–64
18–49
0–17
BG3648 A heritage.org
SOURCES: Authors’ calculations based on data from Centers for Disease Control and Prevention, “Estimated Influenza Illnesses, Medical Visits, Hospitalizations, and Deaths in the United States—2019–2020 Influenza Season,” https://www.cdc.gov/flu/about /burden/2019-2020.html (accessed August 6, 2021), and Centers for Disease Control and Prevention, “CDC COVID Data Tracker,” https://covid.cdc.gov/covid-data-tracker/#demographics (accessed August 4, 2021).
CHART 5
Probability of Surviving Influenza vs. COVID-19, by Age
■ Influenza ■ COVID-19
99.997%
99.985%
99.98%
99.84%
99.94%
98.63%
99.30%
89.29%
99.94%
98.20%

August 12, 2021 | 13BACKGROUNDER | No. 3648heritage.org
dying.45 In Chart 4, we compare the odds of a fully vaccinated person dying from COVID-19 to the odds of various other causes of death (as estimated by the National Safety Council).
As Chart 4 illustrates, typical causes of death, such as heart disease, cancer, and chronic lower respiratory diseases are still more likely to take people’s lives than a breakthrough case of COVID-19. In fact, the odds of dying of COVID-19 after being fully vaccinated are lower than getting killed in a dog attack or getting killed by a swarm of bees. In fact, as Chart 4 illustrates, the odds of dying of COVID-19 after being fully vaccinated are comparable to dying by lightning strike.
For the elderly unvaccinated, and the unvaccinated with chronic health conditions, COVID-19 is still quite deadly, as has been discussed extensively in prior Heritage Foundation research.46 Chart 5 presents the probability of survival for various age groups. As this graphic illustrates, although most people do survive COVID-19, the disease does have significantly lower sur-vival probabilities for the elderly than does influenza.47
While vaccines for COVID-19 do not provide 100 percent protection against infection or death, neither do many other vaccines, including the influenza vaccine.48 For instance, according to the CDC, 49.2 percent of Americans ages six months and older were vaccinated against influenza between 2018 and 2019, yet 34,200 influenza deaths occurred during this period.49 Just as important, the CDC estimates that flu vaccines have (in recent years) “reduced the risk of flu-associated hospitalizations among older adults on average by about 40 percent,” and that between 2012 and 2015 they reduced adults’ risk “of being admitted to an intensive care unit (ICU) with flu by 82 percent.”50
Policy Implications
More than one year after the COVID-19 pandemic started in the U.S., a wealth of data is now available to policymakers and the public. It is critical that government officials rely on this evidence and stop politicizing public health issues. At the very least, officials should follow these two recommen-dations. Officials should:
l Promote vaccines, not mask mandates. The evidence shows that vaccines provide significant protection against serious illness or death from the virus, including the Delta variant. The evidence also shows that mask mandates do not meaningfully curb disease proliferation. Lawmakers should therefore focus on encouraging the vaccine

August 12, 2021 | 14BACKGROUNDER | No. 3648heritage.org
hesitant to get vaccinated rather than requiring the already vaccinated to wear masks. Mask mandates, particularly for the vaccinated, will likely discourage the unvaccinated from reconsidering, and thus prolong the pandemic.
l Focus on the data and ensure that they are presented accurately. The CDC and other government agencies should make more data about breakthrough cases publicly available and present them in the context of the overall fully vaccinated population, not self-selected non-random samples. As of now, the CDC does not provide detailed COVID-19 breakthrough data by age category as they do for overall infections. Given the small total number of such cases, releasing such data every week may not be informative. Nonetheless, officials have a duty to avoid politicizing COVID-19 by presenting data accurately and responsibly.
Conclusion
COVID-19 is a highly communicable disease that spreads rapidly, even in communities under lockdown orders.51 It is virtually impossible to erad-icate the risk of infection. However, as illustrated in Chart 5, not everyone is at equal risk of serious illness or death from COVID-19. Public health officials and news outlets seem to have a significant amount of trouble differentiating between the risk of infection and the risk of serious illness and death—which is predominantly a problem among the unvaccinated, especially the elderly. This failure amongst officials to recognize the value of more targeted public health approaches has needlessly created panic and prolonged the pandemic.
According to CDC estimates, the Delta variant represented more than 80 percent of new U.S. COVID-19 cases at the end of July 2021. Unfortunately, the CDC has done a poor job of using evidence to calm the public’s fears throughout the pandemic, and its latest public health guidelines for the fully vaccinated are no exception to that rule.
CDC Director Walensky announced these new guidelines based on data that allegedly imply that the vaccines offer little protection against the Delta variant. However, the CDC report fails to support this conclusion. In fact, the authors of the CDC report provide an explicit warning: “[D]ata from this report are insufficient to draw conclusions about the effectiveness of COVID-19 vaccines against SARS-CoV-2, including the Delta variant, during this outbreak.”52

August 12, 2021 | 15BACKGROUNDER | No. 3648heritage.org
Despite the CDC’s misuse of the data in the new report, the overall evi-dence remains clear: Vaccines for COVID-19 have provided people with significant protection against serious illness or death from the virus, includ-ing the Delta variant. Public health guidelines should reflect this reality.
Kevin Dayaratna, PhD, is Principal Statistician, Data Scientist, and Research Fellow in the
Center for Data Analysis, of the Institute for Economic Freedom and Opportunity, at The
Heritage Foundation. Norbert J. Michel, PhD, is Director of the Center for Data Analysis.

August 12, 2021 | 16BACKGROUNDER | No. 3648heritage.org
Endnotes
1. Johns Hopkins University, “COVID-19 Map,” Coronavirus Resource Center, https://coronavirus.jhu.edu/map.html (accessed March 5, 2021).
2. Kathy Katella, “5 Things to Know About the Delta Variant,” Yale Medicine, August 3, 2021, https://www.yalemedicine.org/news/5-things-to-know -delta-variant-covid (accessed August 4, 2021).
3. Madeline Holcombe and Theresa Waldrop, “More Infectious Delta Variant Makes Up 83% of New US Coronavirus Cases as Vaccine Hesitancy Persists,” CNN, July 20, 2021 https://www.cnn.com/2021/07/20/health/us-coronavirus-tuesday/index.html (accessed August 4, 2021).
4. For additional examples, see Doug Badger and Robert E. Moffit, “COVID-19 and Federalism: Public Officials’ Accountability and Comparative Performance,” Heritage Foundation Backgrounder No. 3638, July 26, 2021, https://www.heritage.org/sites/default/files/2021-07/BG3638.pdf.
5. U.S. Centers for Disease Control and Prevention, “Interim Public Health Recommendations for Fully Vaccinated People,” July 28, 2021, https://www .cdc.gov/coronavirus/2019-ncov/vaccines/fully-vaccinated-guidance.html (accessed August 4, 2021).
6. Laurel Wamsely, “Vaccinated People with Breakthrough Infections Can Spread the Delta Variant, CDC Says,” NPR, July 30, 2021, https://www.npr.org /sections/coronavirus-live-updates/2021/07/30/1022867219/cdc-study-provincetown-delta-vaccinated-breakthrough-mask-guidance (accessed August 4, 2021), and Berkeley Lovelace Jr., “CDC Study Shows 74% of People Infected in Massachusetts Covid Outbreak Were Fully Vaccinated,” CNBC, July 30, 2021, https://www.cnbc.com/2021/07/30/cdc-study-shows-74percent-of-people-infected-in-massachusetts-covid-outbreak-were-fully
-vaccinated.html (accessed August 4, 2021).
7. Catherine Brown et al., “Outbreak of SARS-CoV-2 Infections, Including COVID-19 Vaccine Breakthrough Infections, Associated with Large Public Gatherings—Barnstable County, Massachusetts, July 2021,” Centers for Disease Control and Prevention Morbidity and Mortality Weekly Report, July 30, 2021, https://www.cdc.gov/mmwr/volumes/70/wr/mm7031e2.htm (accessed August 4, 2021).
8. Samuel Chamberlain, “White House Slams NYT, Washington Post Over Tweets on CDC COVID Data,” New York Post, July 30, 2021, https://nypost.com /2021/07/30/white-house-slams-nyt-washington-post-on-cdc-covid-data-report/ (accessed August 4, 2021).
9. Wamsely, “Vaccinated People with Breakthrough Infections.”
10. Al Tompkins, “Going Deeper on the Massachusetts COVID Outbreak That Led to the CDC’s Mask Reversal,” Poynter, August 2, 2021, https://www .poynter.org/reporting-editing/2021/going-deeper-on-the-massachusetts-covid-outbreak-that-led-to-the-cdcs-mask-reversal/ (accessed August 4, 2021).
11. Chamberlain, “White House Slams NYT.”
12. Brown et al., “Outbreak of SARS-CoV-2 Infections,” p. 3.
13. USAFacts.org, “US COVID-19 Cases and Deaths by State,” August 3, 2021, https://usafacts.org/visualizations/coronavirus-covid-19-spread-map/ (accessed August 6, 2021).
14. “Massachusetts Vaccination Scheduling Website Crashes as Appointments Open for 65+,” NBC Boston, February 18, 2021, https://www.nbcboston .com/news/local/nearly-1-million-people-now-eligible-for-covid-vaccine-in-mass/2305907/ (accessed August 4, 2021); Elena Debre, “What’s Up with Coronavirus Vaccines and CVS?” Slate, February 11, 2021, https://slate.com/technology/2021/02/coronavirus-vaccine-pharmacy-rollout.html (accessed August 4, 2021); and Sharon Terlep, “Walgreens Site for Booking Covid-19 Vaccine Crashes,” The Wall Street Journal, March 9, 2021, https:// www.wsj.com/articles/walgreens-site-for-booking-covid-19-vaccine-crashes-11615321373 (accessed August 4, 2021).
15. IHME conducted a statistical analysis of survey data examining attitudes toward vaccine hesitancy across the American population. IHME found that, as of June 10, 2021, over 50 percent of the population was vaccine hesitant, which has likely contributed to the decline. The median hesitancy among all ZIP codes is 19 percent. More than 6,000 ZIP codes have hesitancy above 30 percent, over 580 zip codes have vaccine hesitancy above 50 percent, and 10 zip codes are above 90 percent. See Institute for Health Metrics and Evaluation, “New Tool Shows More Than 50 Percent of the Population Is Vaccine-Hesitant in Over 580 ZIP Codes Across the US,” June 24, 2021, http://www.healthdata.org/news-release/new-tool-shows-more-50-percent
-population-vaccine-hesitant-over-580-zip-codes-across-us (accessed August 6, 2021), and Institute for Health Metrics and Evaluation, “Vaccine Hesitancy by County: Jul 09, 2021–Jul 15, 2021,” https://vaccine-hesitancy.healthdata.org/ (accessed August 6, 2021).
16. Kehinde Eniola and Jean Sykes, “Four Reasons for COVID-19 Vaccine Hesitancy Among Health Care Workers, and Ways to Counter Them,” Quick Tips, A Blog from FPM Journal, April 27, 2021, https://www.aafp.org/journals/fpm/blogs/inpractice/entry/countering_vaccine_hesitancy.html (accessed August 10, 2021).
17. More than 80 percent of Americans 65 and older are fully vaccinated. “See How Vaccinations Are Going in Your County and State,” The New York Times, https://www.nytimes.com/interactive/2020/us/covid-19-vaccine-doses.html (accessed August 4, 2021)
18. This CDC statistic reflects data as of August 2, 2021. See U.S. Centers for Disease Control and Prevention, “COVID-19 Vaccine Breakthrough Case Investigation and Reporting,” August 2, 2021, https://www.cdc.gov/vaccines/covid-19/health-departments/breakthrough-cases.html (accessed August 8, 2021).
19. U.S. Centers for Disease Control and Prevention, “COVID-19 Vaccine Breakthrough Case Investigation and Reporting.” Also see Austin Williams, “CDC: Less Than 1% of Breakthrough COVID-19 Cases Led to Hospitalization or Death,” CNN, August 3, 2021, https://www.fox5dc.com/news/cdc-less-than
-1-of-breakthrough-covid-19-cases-led-to-hospitalization-or-death (accessed August 5, 2021).

August 12, 2021 | 17BACKGROUNDER | No. 3648heritage.org
20. U.S. Centers for Disease Control and Prevention, “Interim Public Health Recommendations for Fully Vaccinated People.”
21. Ibid.
22. Although cloth masks have some source control value (they can prevent infected persons from spreading “droplets and particles”), the evidence does not support that wearing cloth masks protect uninfected people from contracting COVID-19. See Doug Badger and Robert E. Moffit, “COVID-19 and Federalism: Public Officials’ Accountability and Comparative Performance,” Heritage Foundation Backgrounder No. 3638, July 26, 2021, https://www
.heritage.org/sites/default/files/2021-07/BG3638.pdf. Also see Akriti Nanda et al., “Efficacy of Surgical Masks or Cloth Masks in the Prevention of Viral Transmission: Systematic Review, Meta-Analysis, and Proposal for Future Trial,” Journal of Evidence Based Medicine, February 9, 2021, https://www .ncbi.nlm.nih.gov/pmc/articles/PMC8014575/ (accessed August 5, 2021); Jeffrey H. Anderson, “Do Masks Work?,” City Journal, August 11, 2021, https:// www.city-journal.org/do-masks-work-a-review-of-the-evidence (accessed August 12, 2021); Kevin D. Dayaratna and Norbert J. Michel, “A Statistical Analysis of Mandates and Mask Usage in Kansas,” Heritage Foundation Special Report No. 246, April 15, 2021, https://www.heritage.org/sites/default /files/2021-04/SR246.pdf (accessed August 11, 2021); and Kevin D. Dayaratna and Andrew Vanderplas, “A Statistical Analysis of COVID-19 and Government Protection Measures in the U.S.,” Heritage Foundation Special Report No. 243, March 19, 2021, https://www.heritage.org/public-health /report/statistical-analysis-covid-19-and-government-protectionmeasures-the-us.
23. U.S. Centers for Disease Control and Prevention, “Science Brief: Community Use of Cloth Masks to Control the Spread of SARS-CoV-2,” May 7, 2021, https://www.cdc.gov/coronavirus/2019-ncov/science/science-briefs/masking-science-sars-cov2.html (accessed August 6, 2021).
24. The authors report that “[i]nfection with SARS-CoV-2 occurred in 42 participants recommended masks (1.8%) and 53 control participants (2.1%).” Henning Bundgaard et al., “Effectiveness of Adding a Mask Recommendation to Other Public Health Measures to Prevent SARS-CoV-2 Infection in Danish Mask Wearers: A Randomized Controlled Trial,” Annals of Internal Medicine, Vol. 4, No. 3 (November 18, 2020), pp. 335–343, https://pubmed
.ncbi.nlm.nih.gov/33205991/ (accessed August 6, 2021). The CDC dismisses these results by claiming that “[f]indings were inconclusive, most likely because the actual reduction in infections was lower,” and that the “study was too small (i.e., enrolled about 0.1% of the population) to assess whether masks could decrease transmission from wearers to others.” See Centers for Disease Control and Prevention, “Science Brief: Community.” Neither of these critiques is valid—it is improper to dismiss the results because the “reduction in infections was lower,” and it is unequivocally not the case that a sample can be dismissed as “too small” because it fails to meet an arbitrary threshold of the population.
25. Brown et al., “Outbreak of SARS-CoV-2 Infections.”
26. Since the CDC’s study was published, new cases were linked to the festivities and reported to the Barnstable County Department of Health. This update is addressed further in the next section of this Backgrounder.
27. Amongst the estimated 60,000 people who visited the area, these figures represent 0.008 percent of the attendees who were hospitalized, and a mortality rate of zero.
28. Brown et al., “Outbreak of SARS-CoV-2 Infections,” p. 2.
29. Ibid., p. 4. There is much debate regarding whether similar viral loads in the vaccinated and unvaccinated imply that both groups are just as contagious. Robbie Whelan and Jared S. Hopkins, “CDC’s Covid-19 Mask Guidance Clouded by Flawed Data,” The Wall Street Journal, August 3, 2021, https://www
.wsj.com/articles/cdcs-covid-19-mask-mandate-clouded-by-flawed-data-11627983001 (accessed August 4, 2021).
30. Brown et al., “Outbreak of SARS-CoV-2 Infections,” p. 3.
31. While the authors claim that “further study is underway” to collect additional demographic information on those who were infected, they also report that 30 of the people who contracted COVID-19 are also HIV positive. Ibid.
32. Brown et al., “Outbreak of SARS-CoV-2 Infections,” p. 3.
33. Ibid., p. 1.
34. Barnstable County Department of Health and Environment, “July 30, 2021, Update: COVID-19 Cluster in Provincetown,” July 30, 2021, https://www .barnstablecountyhealth.org/newsroom/july-30-2021-update-covid-19-cluster-in-provincetown (accessed August 6, 2021).
35. The MMWR does claim that 69 percent of eligible Massachusetts residents are vaccinated.
36. Marianne Guenot, “24 Vaccinated Friends Had a Blowout Vacation on Cape Cod. Though Their Symptoms Were Mild, 14 of Them Caught COVID-19, Report Says,” Business Insider, August 2, 2021, https://www.businessinsider.com/party-cape-cod-l14-vaccinated-friends-covid-19-provincetown
-cdc-2021-8 (accessed August 4, 2021), and Ingu Yun, “The Provincetown Covid Data Is Actually Good News (If You Are Vaccinated),” Medium, August 1, 2021, https://inguyun.medium.com/the-provincetown-outbreak-is-actually-good-news-if-you-are-vaccinated-93a1edd763b6 (accessed August 4, 2021).
37. These statistics assume full vaccination. “See How Vaccinations Are Going in Your County and State,” The New York Times, August 3, 2021, https:// www.nytimes.com/interactive/2020/us/covid-19-vaccine-doses.html (accessed August 4, 2021).
38. “Town-by-Town COVID Vaccination Rates,” CBS Boston, July 22, 2021, https://boston.cbslocal.com/town-by-town-covid-vaccination/ (accessed August 4, 2021).
39. Yun, “The Provincetown Covid Data Is Actually Good News.”
40. “See How Vaccinations Are Going in Your County and State,” The New York Times, August 3, 2021.

August 12, 2021 | 18BACKGROUNDER | No. 3648heritage.org
41. Lovelace Jr., “CDC Study Shows 74% of People Infected in Massachusetts Covid Outbreak Were Fully Vaccinated.”
42. Newer reports indicate more than 900 cases, with seven hospitalizations and no deaths. Carey Goldberg and Nic Querolo, “In Provincetown, Covid Hits 14 Friends in Show of Delta’s Might,” Bloomberg, August 1, 2021, https://www.bloomberg.com/news/articles/2021-08-01/in-provincetown-14-friends
-nab-covid-in-show-of-delta-s-might (accessed August 5, 2021).
43. U.S. Centers for Disease Control and Prevention, “COVID-19 Vaccine Breakthrough Case Investigation and Reporting.”
44. Ibid.
45. NSC Injury Facts, “Preventable Deaths: Odds of Dying,” https://injuryfacts.nsc.org/all-injuries/preventable-death-overview/odds-of-dying/ (accessed August 4, 2021).
46. Kevin D. Dayaratna and Andrew Vanderplas, “A Statistical Analysis of COVID-19 and Government Protection Measures in the U.S.,” Heritage Foundation Special Report No. 243, March 19, 2021, https://www.heritage.org/public-health/report/statistical-analysis-covid-19-and-government-protection
-measures-the-us (accessed August 4, 2021), and Kevin D. Dayaratna, Patrick Tyrrell, and Andrew Vanderplas, “A Comparative Analysis of Policy Approaches to COVID-19 Around the World, with Recommendations for U.S. Lawmakers,” Heritage Foundation Special Report No. 234, July 20, 2020, https://www.heritage.org/public-health/report/comparative-analysis-policy-approaches-covid-19-around-the-world.
47. Prior Heritage Foundation research has also noted that COVID-19 is also quite dangerous for the chronically ill regardless of age group. See Dayaratna and Vanderplas, “A Statistical Analysis of COVID-19 and Government Protection Measures in the U.S.”
48. U.S. Centers for Disease Control and Prevention, “Vaccines and Preventable Diseases,” https://www.cdc.gov/vaccines/vpd/vaccines-diseases.html (accessed August 6, 2021).
49. USAFacts.org, “How Many Americans Get Flu Shots?” 2021, https://usafacts.org/articles/how-many-americans-get-flu-shots-vaccine-cdc/ (accessed August 5, 2021), and U.S. Centers for Disease Control and Prevention, “Estimated Influenza Illnesses, Medical Visits, Hospitalizations, And Deaths In The United States—2018–2019 Influenza Season,” January 8, 2020, https://www.cdc.gov/flu/about/burden/2018-2019.html (accessed August 5, 2021).
50. U.S. Centers for Disease Control and Prevention, “Vaccine Effectiveness: How Well Do the Flu Vaccines Work?” May 6, 2021, https://www.cdc.gov/flu /vaccines-work/vaccineeffect.htm (accessed August 5, 2021).
51. Dayaratna, Tyrrell, and Vanderplas, “A Comparative Analysis of Policy Approaches to COVID-19 Around the World.”
52. Brown et al., “Outbreak of SARS-CoV-2 Infections,” p. 3.