a spectral imaging system for detection of botrytis in
TRANSCRIPT

G Polder. “A Spectral Imaging System for Detection of Botrytis in Greenhouses”. EFITA-WCCA-CIGR Conference “Sustainable Agriculture through ICT Innovation”, Turin, Italy, 24-27 June 2013. The authors are solely responsible for the content of this technical presentation. The technical presentation does not necessarily reflect the official position of the Internation Commission of Agricultural and Biosystems Engineering (CIGR) and of the EFITA association, and its printing and distribution does not constitute an endorsement of views which may be expressed. Technical presentations are not subject to the formal peer review process by CIGR editorial committees; therefore, they are not to be presented as refereed publications.
A Spectral Imaging System for Detection of Botrytis in Greenhouses
Gerrit Polder1, Erik Pekkeriet1, Marco Snikkers2 1Wageningen UR, 2PIXELTEQ
Wageningen UR, Biometris, P.O. Box 100, 6700AC Wageningen, Netherlands.
ABSTRACT
In the Interreg IV, EU project 'The healthy greenhouse' a new integral crop protection system is developed. Part of the project is the development of autonomous robots for monitoring individual plants. One of the sensors for monitoring is an application-specific multispectral camera for detection of fungal diseases. In this paper the development of this camera is described, starting from a laboratory based hyperspectral system. Using feature selection the number of bands is reduced to eight. Results from the analysis of the reduced images show that 90% of the pixels are properly classified. These bands will be validated in a fast filter wheel multispectral system in the greenhouse. Final goal of the project is real-time multispectral camera using micro patterned coatings on individual pixels.
Keywords: Hyperspectral imaging, multispectral imaging, feature selection, classification, Netherlands.
1. INTRODUCTION In the Interreg IV, EU project 'The healthy greenhouse' a new integral crop protection system is developed (www.gezondekas.eu) for sustainable management for modern horticultural companies. Ten research institutes and twenty-two companies from the Netherlands and Germany cooperate on designing a complete system for integral monitoring and control on micro and macro scale. For monitoring individual plants, two autonomous robot platforms are developed. The side crop view robot platform is used for monitoring high plants like tomato and sweet pepper from the side. The top crop view robot platform will monitor plants that grow on or in the ground, like pot plants, from the top. The robot platforms will be equipped with all kind of sensors, e.g. electronic nose, a chlorophyll fluorescence camera, multispectral camera and actuators, for precision spraying or handling of the crop. 1.1 Application-Specific Multispectral Camera One of the cameras on the robot platforms is an application-specific multispectral camera for detection of fungal diseases. In this paper we describe the first steps in developing this camera. Cyclamen is used as model crop. Cyclamen are particularly susceptible to grey mould caused by Botrytis cinerea. This causes a grey fuzzy mould

C0249 G Polder. “A Spectral Imaging System for Detection of Botrytis in Greenhouses”. EFITA-WCCA-CIGR Conference “Sustainable Agriculture through ICT Innovation”, Turin, Italy, 24-27 June 2013.
on infected plant parts, and also attacks the stalks of developing leaves and flowers, causing them to collapse. The ultimate goal of the project is to develop a fast multispectral camera using PIXELTEQ technology (Eichenholz et al., 2010) in three steps:
1. Image diseased and healthy plants in the lab using a slow hyperspectral imaging system with 185 spectral bands, and find the most discriminating bands.
2. Validation in the greenhouse with a fast filter wheel based system using the bands found in step 1.
3. On sensor implementation using micro patterned coatings on individual pixels for an application-specific camera.
In this paper we describe an experiment with healthy and diseased Cyclamen plants using hyperspectral imaging and the selection of the most discriminating wavelengths for use in a multispectral camera. The performance of disease classification using multispectral data and hyperspectral data is compared.
Figure 1. Example Cyclamen plants with different degree of Botrytis infection, 1-
Healthy, 2-Infected, 3-Diseased, 4-Heavily diseased.
1 2
3 4

C0249 G Polder. “A Spectral Imaging System for Detection of Botrytis in Greenhouses”. EFITA-WCCA-CIGR Conference “Sustainable Agriculture through ICT Innovation”, Turin, Italy, 24-27 June 2013.
2. MATERIAL AND METHODS In two experiments 72 plants were imaged using a hyperspectral camera in the classes: Healthy (18), Infected (18), Diseased (18) and Heavily diseases (18). In Figure 1 shows example plants from each class. 2.1 Hyperspectral Imaging A hyperspectral camera setup was built for recording whole Cyclamen plants. The system is based on a pushbroom imaging spectrograph. Detailed information can be found in Polder et al. (2003). Figure 2 shows a photograph of the hyperspectral imaging setup used in the laboratory. Figure 3 shows an example hyperspectral image cube.
Figure 2. Photograph of the hyperspectral imaging setup.
Figure 3. Example of a hyperspectral image data cube. Each pixels consists of a
complete reflection spectrum at its position.
C0249 G Polder. “A Spectral Imaging System for Detection of Botrytis in Greenhouses”. EFITA-WCCA-CIGR Conference “Sustainable Agriculture through ICT Innovation”, Turin, Italy, 24-27 June 2013.
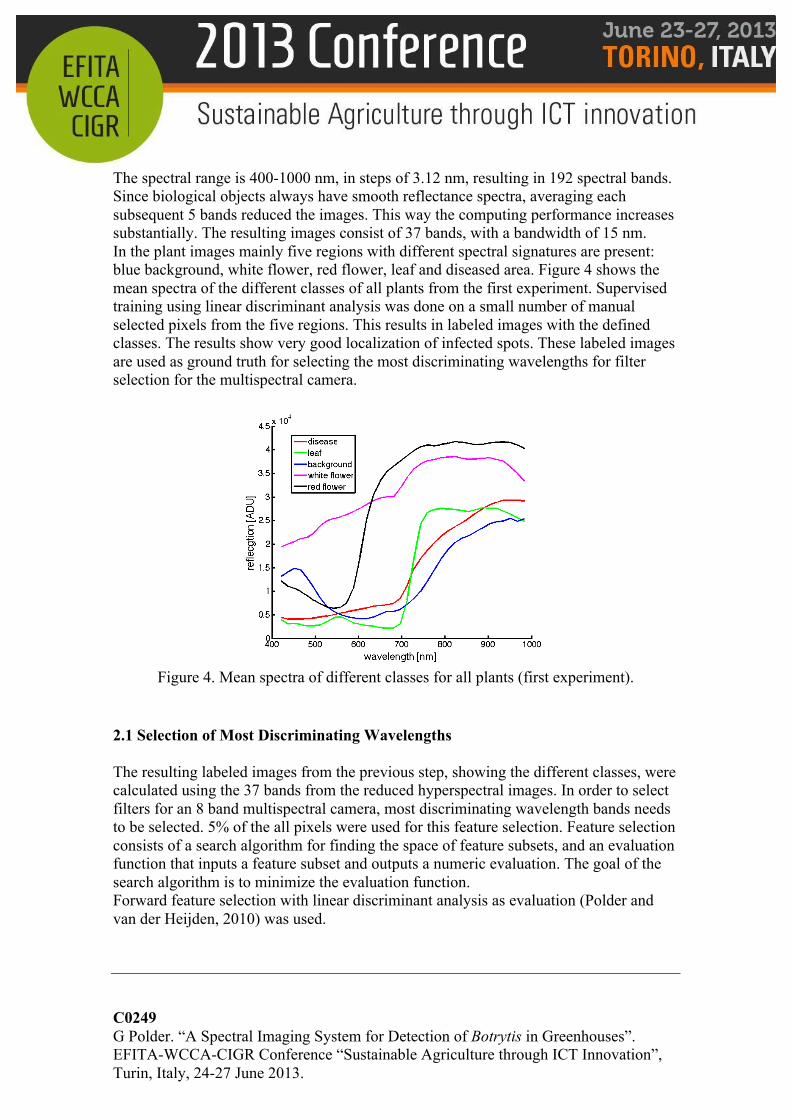
The spectral range is 400-1000 nm, in steps of 3.12 nm, resulting in 192 spectral bands. Since biological objects always have smooth reflectance spectra, averaging each subsequent 5 bands reduced the images. This way the computing performance increases substantially. The resulting images consist of 37 bands, with a bandwidth of 15 nm. In the plant images mainly five regions with different spectral signatures are present: blue background, white flower, red flower, leaf and diseased area. Figure 4 shows the mean spectra of the different classes of all plants from the first experiment. Supervised training using linear discriminant analysis was done on a small number of manual selected pixels from the five regions. This results in labeled images with the defined classes. The results show very good localization of infected spots. These labeled images are used as ground truth for selecting the most discriminating wavelengths for filter selection for the multispectral camera.
Figure 4. Mean spectra of different classes for all plants (first experiment).
2.1 Selection of Most Discriminating Wavelengths The resulting labeled images from the previous step, showing the different classes, were calculated using the 37 bands from the reduced hyperspectral images. In order to select filters for an 8 band multispectral camera, most discriminating wavelength bands needs to be selected. 5% of the all pixels were used for this feature selection. Feature selection consists of a search algorithm for finding the space of feature subsets, and an evaluation function that inputs a feature subset and outputs a numeric evaluation. The goal of the search algorithm is to minimize the evaluation function. Forward feature selection with linear discriminant analysis as evaluation (Polder and van der Heijden, 2010) was used.

C0249 G Polder. “A Spectral Imaging System for Detection of Botrytis in Greenhouses”. EFITA-WCCA-CIGR Conference “Sustainable Agriculture through ICT Innovation”, Turin, Italy, 24-27 June 2013.
3. RESULTS AND CONCLUSIONS
Eight bands were selected from the total of 37 bands, using artificial selected filters with a rectangular transmission curve and a bandwidth of 15 nm. Features (bands) selected, in order of importance are: 497, 635, 744, 839, 604, 728, 542 and 467 [nm]. The selected features were validated on 5% of the remaining pixels. These pixels were not used in the feature selection step, resulting in an independent evaluation result. 90% of the pixels were properly classified, which indicated that the selected bands are suitable for Botrytis selection in Cyclamen. To check the results visually, the classifications of the 37 band hyperspectral images are compared to the classification of the 8 selected bands. Figure 5 shows the results of four example images. The red label shows the diseased area. From this figure we see that classification of the diseased area is almost the same for the 37 band and the 8 band images.

C0249 G Polder. “A Spectral Imaging System for Detection of Botrytis in Greenhouses”. EFITA-WCCA-CIGR Conference “Sustainable Agriculture through ICT Innovation”, Turin, Italy, 24-27 June 2013.
Leading Partner: DLO Project 13 Spectral Imaging System
Pagina 8 van 10
Figure 6. Examples of classified Cyclamen plants, left; classified on 37 bands, middle; classified on 8 bands from feature selection, right; colour image, calculated from hyperspectral image.
Figure 5. Examples of classified Cyclamen plants. Left; classified on 37 bands, middle;
classified on 8 bands from feature selection, right; colour image, calculated from the hyperspectral image.

C0249 G Polder. “A Spectral Imaging System for Detection of Botrytis in Greenhouses”. EFITA-WCCA-CIGR Conference “Sustainable Agriculture through ICT Innovation”, Turin, Italy, 24-27 June 2013.
Figure 6 shows the size of the diseased area for all plants from the first experiment (10 plants per class), based on the labeled images using 8 bands. The red line clearly separates the healthy plants from the others, except for one plant. The diseased area was calculated as the ratio between the number of red pixels and the total plant area. Using more advanced image features presumably will improve the results.
Figure 6. Size of diseased area for all plants, based on the labeled 8 band image data.
For implementation on the fast filter wheel camera the transmission curves of all available filters will be used in the feature selection analysis, which will result in a selection of the best performing filters for validating in the greenhouse using the fast filter-wheel camera (step 2). When the results of this validation are satisfactory, the same procedure will be done using the available PIXELTEQ transmission curves and finally an application-specific camera using micro patterned coatings on individual pixels will be developed.
� Healthy � Infected � Diseased � Heavily diseased

C0249 G Polder. “A Spectral Imaging System for Detection of Botrytis in Greenhouses”. EFITA-WCCA-CIGR Conference “Sustainable Agriculture through ICT Innovation”, Turin, Italy, 24-27 June 2013.
4. ACKNOWLEDGMENTS
Financial support from the following organizations is gratefully acknowledged.
www.deutschland-nederland.eu
5. REFERENCES
Eichenholz, J., Barnett, N., Juang, Y. & Fish, D. 2010, Real-time megapixel multispectral bioimaging. Proceedings of SPIE BIOS Vol. 7568.
Polder, G., van der Heijden, G. W. A. M., Keizer, L. & Young, I. T., 2003, Calibration
and characterisation of imaging spectrographs. Journal of near Infrared Spectroscopy 11, 193–210.
Polder, G. and van der Heijden, G.W.A.M., 2010, Measuring Ripening of Tomatoes
Using Imaging Spectrometry, In. Hyperspectral Imaging for Food Quality Analysis and Control, Academic Press - Elsevier, ISBN 9780123747532.
Unterstützt durch / mede mogelijk gemaakt door: