a real-time analysis of rock fragmentation using uav ... · a real-time analysis of rock...
TRANSCRIPT
A real-time analysis of rock fragmentation using
UAV technology
Bamford1 T., Esmaeili1 K., Schoellig2 A. P. 1 Lassonde Institute of Mining, University of Toronto, Toronto, Canada
2 University of Toronto Institute for Aerospace Studies, Toronto, Canada
Abstract- Accurate measurement of blast-induced
rock fragmentation is of great importance for many mining
operations. The post-blast rock size distribution can
significantly influence the efficiency of all the downstream
mining and comminution processes. Image analysis methods
are one of the most common methods used to measure rock
fragment size distribution in mines regardless of criticism for
lack of accuracy to measure fine particles and other perceived
deficiencies. The current practice of collecting rock
fragmentation data for image analysis is highly manual and
provides data with low temporal and spatial resolution. Using
Unmanned Aerial Vehicles (UAVs) for collecting images of
rock fragments can not only improve the quality of the image
data but also automate the data collection process. Ultimately,
real-time acquisition of high temporal- and spatial-resolution
data based on UAV technology will provide a broad range of
opportunities for both improving blast design without
interrupting the production process and reducing the cost of the
human operator.
This paper presents the results of a series of laboratory-scale
rock fragment measurements using a quadrotor UAV equipped
with a camera. The goal of this work is to highlight the benefits
of aerial fragmentation analysis in terms of both prediction
accuracy and time effort. A pile of rock fragments with
different fragment sizes was placed in a lab that is equipped
with a motion capture camera system (i.e., a high-accuracy
indoor GPS-like system) for precise UAV localization and
control. Such an environment presents optimal conditions for
UAV flight and thus, is well-suited for conducting proof-of-
concept experiments before testing them in large-scale field
experiments. The pile was photographed by a camera attached
to the UAV, and the particle size distribution curves were
generated in almost real-time. The pile was also manually
photographed and the results of the manual method were
compared to the UAV method.
Keywords: drone, unmanned aerial vehicle, UAV, real-time
analysis, rock fragmentation analysis, blasting.
1. Introduction
Measuring post-blast rock fragmentation is important to
many mining operations. Production blasting in mining
operations acts to reduce the size of rock blocks so that the rock
can be transported from an in-situ location to downstream
mining and comminution processes. The rock size distribution
induced by blasting influences the efficiency of all downstream
mining and comminution processes [1]. It has been shown that
rock fragmentation can influence the volumetric and packing
properties of the rock (e.g., the fill factor and bulk volume) and,
consequently, the efficiency of digging and hauling
equipment [2]. Similarly, there have been a number of studies
that demonstrate the direct influence of the rock size
distribution fed into the crushing and grinding processes on
energy consumption, throughput rates and productivity of these
processes [1,2]. Due to these impacts, the measurement of post-
blast rock fragmentation is an important metric in the
optimization of a mining operation. It is suggested that real-
time fragmentation measurement should be implemented to
improve blast design over time with the goal of producing an
optimal rock size distribution for downstream processes [3].
Throughout the history of mining, there have been many
methods developed for estimating rock size distribution. The
common methods are: visual observation, sieve analysis and
image analysis. Visual observation involves inspecting the rock
pile and subjectively judging the quality of the blast. This
subjective method can lead to inaccurate results. Sieve analysis
involves taking a sample of the rock pile being studied and
passing it through a series of different size sieve trays. The rock
size distribution is calculated by measuring the mass or volume
of the rock material that remains on each tray. This method
generates more consistent results; however, it is more
expensive, time consuming and in certain cases impractical to
perform as the sample rock size distribution may not be
statistically representative of the whole rock pile. Image
analysis methods have been developed with the rise of
computer image processing and analysis tools. Conducting
image analysis involves taking 2D photos, stereo images or 3D
laser scans of the rock pile, and processing these images to
determine particle sizes [4-6]. Image analysis techniques
enable practical, fast, and relatively accurate measurement of
rock fragmentation. However, the following limitations of
image analysis have been identified [4]:
Delineation of particles might be limited due to
disintegration and fusion of particles.
Transformation of surface measurements of particles
into volumes may not be representative of the particles
being sampled.
The resolution of the image system is limited
compared to that of sieve analysis. Accuracy of the
fines regions using image analysis can be very low if
the photo captured is not of high enough resolution.
Mesh sizes assigned to certain rock sizes in image
analysis may be different than that assigned in sieving
due to the effect of particle shape.
A constant density is generally applied to all particle
sizes so that volume distributions in image analysis
are directly related to mass distributions.
In a study of image analysis accuracy, Sanchidrián et al. [4]
found that image analysis methods resulted in an error of less
than 30% in the coarse region of the rock size distribution. In
the same study, an error of less than 85-100% was calculated
for the fine region which means that image analysis is not
reliable for fine particles. Regardless of these limitations,
image analysis is still the most common method used to
measure rock fragmentation in mines. The most common
image analysis technique applied in mines uses 2D fixed
cameras located (i) at the base of a rock pile, (ii) on shovels and
truck buckets, (iii) at crusher stations, or on conveyors in the
processing plant to capture photos [7-9]. These 2D image
analysis techniques have the following limitations:
(i) Fixed single camera located at the base of a muck pile:
Technicians must place scaling objects on the rock
pile.
Photos have to be taken at a distance of less than 20m
from the rock pile. This can interrupt production and
may place technicians at risk [5].
The shape of the muck pile can influence the accuracy
of the image analysis.
Only a limited dataset can be collected from a fixed
location [8].
Dust, fog, rain, snow and particulates can obstruct the
image.
Lighting conditions can drastically impact the results
of the image analysis [5, 8].
(ii) Fixed single camera mounted on shovel booms or truck
buckets [8]:
This requires installing a camera with a clear view at
a perspective that is perpendicular to the shovel
bucket, which can be difficult.
Equipment generates large amounts of vibration and
shock during operation which can influence the
quality of images.
Shielding is required to protect the camera from
falling debris and direct sun light.
Lighting may not be controlled adequately.
If truck or shovel is down, no data is collected.
Imaging the same material multiple times biases the
results.
(iii) Fixed single camera installed in crusher stations [9]:
Detailed masking of images is required.
Scale object must be visible in image.
Difficult to match material with source.
Large amount of dust generation obstructs the image.
Imaging the same perspective multiple times biases
the results.
To overcome some of these limitations, 3D measurement
techniques have been proposed that use LIDAR stations or
stereo cameras to capture images [5, 6, 10, 11]. Using 3D
measurements for rock fragmentation analysis eliminates the
need for scale objects and reduces the error produced by the
shape of the muck pile. If measurements are taken with a
LIDAR station, then the error produced by uneven and
suboptimal lighting conditions can be eliminated [5] as well.
While these techniques reduce the limitations imposed by 2D
photos, there are still aspects that can be improved. One
example of this is the significant capture time required to take
detailed images with a LIDAR system [12]. Another limitation
of these 3D imaging techniques is that they are currently
limited to capturing images from a fixed location since motion
blur can significantly smooth out the 3D data, making particle
delineation difficult [10].
In summary, the process of using cameras or LIDARs for
post-blast rock fragmentation is highly manual and results in
measurements that have low temporal and spatial resolution.
Furthermore, there is no current work, to the best of our
knowledge, which has focused on determining an optimal
image collection procedure for rock fragmentation analysis. To
overcome these limitations and to automate the data collection
process, this paper presents the use of Unmanned Aerial
Vehicle (UAV) technology to conduct real-time rock
fragmentation analysis.
In recent years, UAV technology has been introduced into
the mining environment to conduct terrain surveying,
monitoring and volume calculations [13-16]. These tasks are
essential to the mining operation, but they do not leverage all
of the benefits that UAVs can offer [15]. UAV technology has
the potential to provide acquisition of high resolution data
which can be beneficial in blast design, mill operations, and
other mine-to-mill process optimization campaigns. In
addition, UAVs can provide data acquisition fast and often,
which improves the statistical reliability of measurements.
This paper presents the results of a series of proof-of-
concept, laboratory-scale tests to measure rock fragmentation
using UAVs at the University of Toronto Institute for
Aerospace Studies’ (UTIAS) indoor robotics lab. The hardware

choices, lab configuration, and the procedure used to conduct
image analysis are presented. We also discuss the results of the
experiments, the benefits of utilizing UAV technology for rock
fragmentation measurement, and the image analysis strategy
that was developed to achieve optimal image analysis results.
2. Experiment Setup and Methods
2.1. Experiment setup
In order to provide optimal conditions for automated UAV
flight for proof-of-concept experiments, demonstrating the
feasibility and benefits of automated aerial rock fragmentation
analysis, a laboratory experiment was designed and set up. This
step was deemed to be necessary before conducting any tests in
large-scale field experiments. Figure 1 illustrates the
components and overall lab configuration used for the
proposed automated rock fragmentation analysis. Figure 2 is a
photo taken of the UAV and the lab setup prior to take-off.
Figure 2: Photo of the lab configuration prior to takeoff.
2.1.1. Global positioning system
The indoor robotics lab is equipped with a motion capture
camera system for precise UAV localization and control. This
commercially available system uses ten 4-megapixel Vicon
MX-F40 cameras and reflective markers attached to each
subject to measure position and orientation at a rate of 200 Hz.
For these experiments, the rock pile’s and the UAV’s position
and orientation are collected and sent to the Robot Operating
System (ROS) to control the motion of the UAV relative to the
pile [17]. Figure 3 shows a screenshot of the Vicon system with
the UAV’s and rock pile’s location plotted. For outdoor
practical applications, the camera-based system can be
replaced by standard (differential) GPS, a simultaneous
localization and mapping (SLAM) solution using onboard
cameras for localization [18], or novel alternative localization
methods such as the ones based on ultra-wideband [19].
2.1.2. Rock fragment pile
A pile of rock fragments with different sizes, ranging from
coarse gravel to fine sand, was built in the lab. Prior to forming
the pile, the rock fragments were put through sieve analysis to
determine the true rock size distribution as a baseline for the
Figure 1: Block diagram of the lab configuration with arrows showing the typical information flow.
Figure 3: Screenshot of the global sensing system with the
UAV and rock pile labeled.
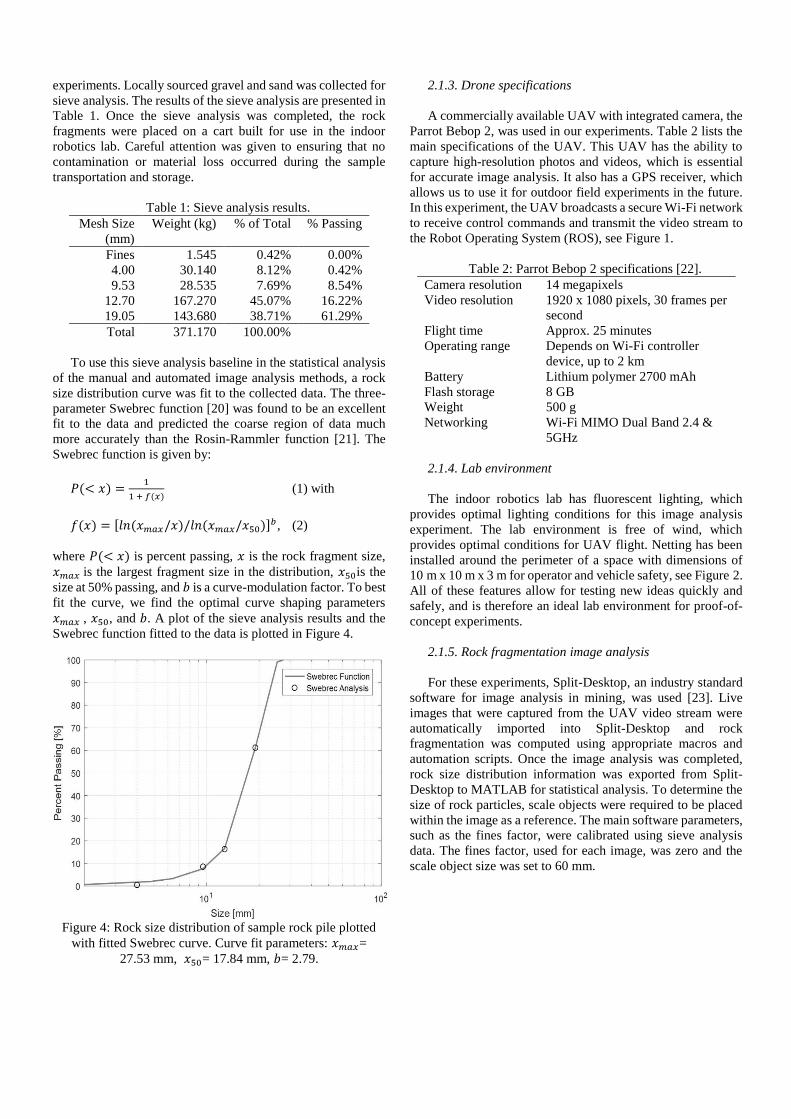
experiments. Locally sourced gravel and sand was collected for
sieve analysis. The results of the sieve analysis are presented in
Table 1. Once the sieve analysis was completed, the rock
fragments were placed on a cart built for use in the indoor
robotics lab. Careful attention was given to ensuring that no
contamination or material loss occurred during the sample
transportation and storage.
Table 1: Sieve analysis results.
Mesh Size
(mm)
Weight (kg) % of Total % Passing
Fines 1.545 0.42% 0.00%
4.00 30.140 8.12% 0.42%
9.53 28.535 7.69% 8.54%
12.70 167.270 45.07% 16.22%
19.05 143.680 38.71% 61.29%
Total 371.170 100.00%
To use this sieve analysis baseline in the statistical analysis
of the manual and automated image analysis methods, a rock
size distribution curve was fit to the collected data. The three-
parameter Swebrec function [20] was found to be an excellent
fit to the data and predicted the coarse region of data much
more accurately than the Rosin-Rammler function [21]. The
Swebrec function is given by:
𝑃(< 𝑥) =1
1 + 𝑓(𝑥) (1) with
𝑓(𝑥) = [𝑙𝑛(𝑥𝑚𝑎𝑥/𝑥)/𝑙𝑛(𝑥𝑚𝑎𝑥/𝑥50)]𝑏 , (2)
where 𝑃(< 𝑥) is percent passing, 𝑥 is the rock fragment size,
𝑥𝑚𝑎𝑥 is the largest fragment size in the distribution, 𝑥50is the
size at 50% passing, and 𝑏 is a curve-modulation factor. To best
fit the curve, we find the optimal curve shaping parameters
𝑥𝑚𝑎𝑥 , 𝑥50, and 𝑏. A plot of the sieve analysis results and the
Swebrec function fitted to the data is plotted in Figure 4.
Figure 4: Rock size distribution of sample rock pile plotted
with fitted Swebrec curve. Curve fit parameters: 𝑥𝑚𝑎𝑥=
27.53 mm, 𝑥50= 17.84 mm, 𝑏= 2.79.
2.1.3. Drone specifications
A commercially available UAV with integrated camera, the
Parrot Bebop 2, was used in our experiments. Table 2 lists the
main specifications of the UAV. This UAV has the ability to
capture high-resolution photos and videos, which is essential
for accurate image analysis. It also has a GPS receiver, which
allows us to use it for outdoor field experiments in the future.
In this experiment, the UAV broadcasts a secure Wi-Fi network
to receive control commands and transmit the video stream to
the Robot Operating System (ROS), see Figure 1.
Table 2: Parrot Bebop 2 specifications [22].
Camera resolution 14 megapixels
Video resolution 1920 x 1080 pixels, 30 frames per
second
Flight time Approx. 25 minutes
Operating range Depends on Wi-Fi controller
device, up to 2 km
Battery Lithium polymer 2700 mAh
Flash storage 8 GB
Weight 500 g
Networking Wi-Fi MIMO Dual Band 2.4 &
5GHz
2.1.4. Lab environment
The indoor robotics lab has fluorescent lighting, which
provides optimal lighting conditions for this image analysis
experiment. The lab environment is free of wind, which
provides optimal conditions for UAV flight. Netting has been
installed around the perimeter of a space with dimensions of
10 m x 10 m x 3 m for operator and vehicle safety, see Figure 2.
All of these features allow for testing new ideas quickly and
safely, and is therefore an ideal lab environment for proof-of-
concept experiments.
2.1.5. Rock fragmentation image analysis
For these experiments, Split-Desktop, an industry standard
software for image analysis in mining, was used [23]. Live
images that were captured from the UAV video stream were
automatically imported into Split-Desktop and rock
fragmentation was computed using appropriate macros and
automation scripts. Once the image analysis was completed,
rock size distribution information was exported from Split-
Desktop to MATLAB for statistical analysis. To determine the
size of rock particles, scale objects were required to be placed
within the image as a reference. The main software parameters,
such as the fines factor, were calibrated using sieve analysis
data. The fines factor, used for each image, was zero and the
scale object size was set to 60 mm.
2.1.6. Robot Operating System (ROS)
The open-source Robot Operating System (ROS) was
chosen to act as the central software node of the experimental
setup. ROS is a flexible software framework for writing robot
software that has been widely adopted [24]. In these
experiments, ROS uses high-level path plan and actual position
and orientation measurements from the global positioning
system to send low-level velocity and orientation commands
wirelessly to the UAV. ROS itself receives sensor data from
the UAV and broadcasts it to the network for the subsequent
image analysis, see Figure 1.
2.1.7. MATLAB® Robotics System Toolbox™
The MATLAB Robotics System Toolbox acts as an
interface between ROS and Split-Desktop while providing
statistical analysis to the operator in real-time. The Robotics
System Toolbox was used to capture and save broadcasted
images, call a macro to run image analysis on Split-Desktop,
and import the rock size distribution generated by Split-
Desktop for statistical analysis.
2.2. Aerial rock fragmentation analysis with a UAV
To highlight the benefits of aerial fragmentation analysis in
terms of both prediction accuracy and time effort, the
automated UAV image analysis was tested in the lab. In
addition, an image analysis approach based on a fixed camera
– as is typically done in practice – was also tested. This allowed
for a direct comparison between these two methods.
To ensure that camera lens bias was not added to the
samples, the UAV camera was used for both methods using the
same image resolution. In order for images being captured from
the same sample surface, a typical rock pile configuration was
fixed for both experiments. For comparison, each method’s
steps were timed, starting at setup and ending at the export of a
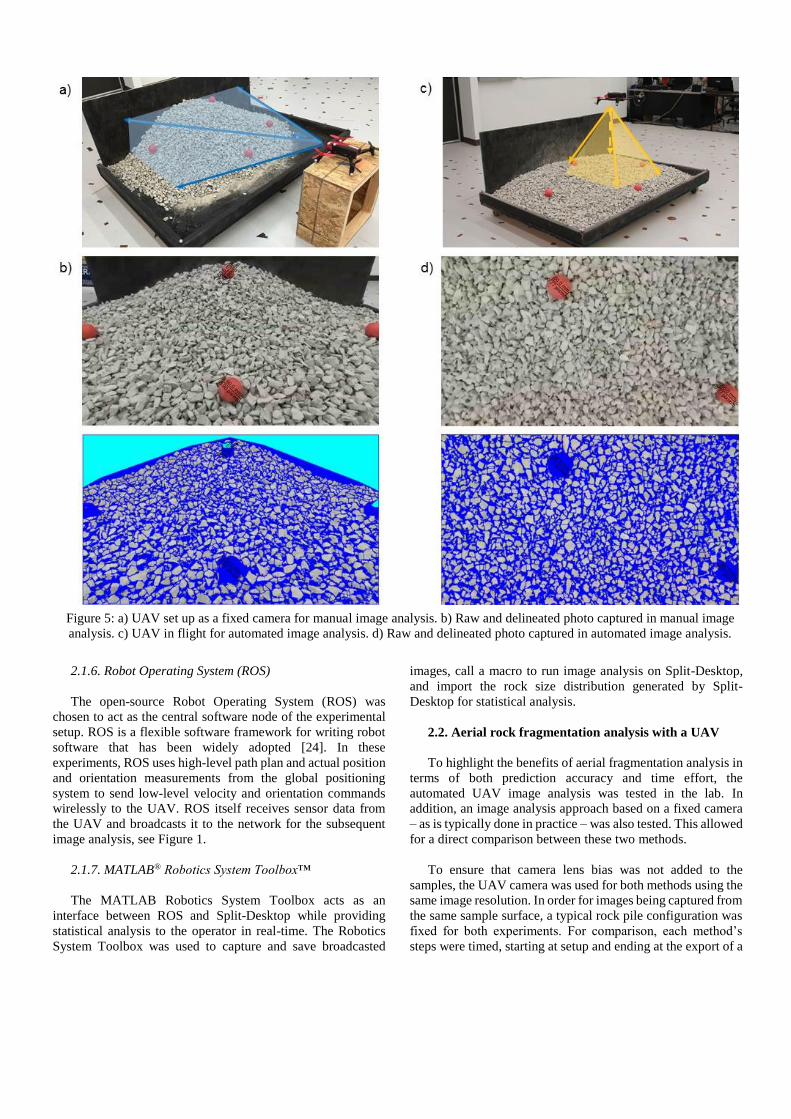
Figure 5: a) UAV set up as a fixed camera for manual image analysis. b) Raw and delineated photo captured in manual image
analysis. c) UAV in flight for automated image analysis. d) Raw and delineated photo captured in automated image analysis.

final rock size distribution. Once these analyses were
conducted in the lab, statistical analysis was done to compare
each method’s predictive accuracy. This comparison was then
used to propose an optimal strategy for image analysis of rock
fragmentation.
The following subsections describe the procedure that was
followed by the operator for the manual and automated image
analysis method.
2.2.1. Fixed-camera, manual image analysis
When creating this procedure, it was noted that there is no
literature that describes an optimal or standard procedure to use
while manually capturing images for rock fragmentation image
analysis. The procedure used in this work was as follows:
1. place scale objects and prepare UAV camera in front
of rock pile (Figure 5a);
2. take photos of the muck from different positions
around the rock pile base looking horizontally with
~50% overlap to simulate the current practice used for
capturing images at the base of a rock pile (Figure 6);
3. return the UAV camera to the workstation;
4. transfer images to the workstation and remove images
that are of poor quality;
5. conduct image analysis using Split-Desktop to obtain
rock size distribution (Figure 5b).
2.2.2. UAV automated image analysis
For the automated analysis, the procedure was as follows
(cf. Figure 1):
1. place scale objects and prepare and initiate automated
UAV fragmentation analysis system;
2. if systems are ready and conditions are safe to fly,
send command to takeoff;
3. as UAV automatically moves along the predefined
path taking two levels of photos with ~50% overlap,
ensure that UAV operates safely and intervene if
problems occur (Figure 6 and Figure 5c);
4. once the UAV returns to the take-off location, analysis
is finished, send command to land;
5. on the MATLAB window, save rock size distribution
results after filtering out poor quality images
(Figure 5d).
3. Results and Discussion
At the time of this paper, multiple trials have been
conducted to develop the UAV-based, automated rock
fragmentation analysis and to compare it with the conventional,
manual method. This paper presents the results of one
representative trial. Benefits of using aerial fragmentation
analysis are summarized and quantified in Section 3.3. Finally,
an optimal strategy of measuring rock fragmentation using
UAVs is proposed in Section 3.4.
3.1. Summary of collected data
A summary of a typical manual and automated
fragmentation analysis experiment are given in Table 3. Eleven
photos were taken in the manual, fixed-camera experiment
such that an overlap of 50% was achieved between adjacent
images. Sixteen photos were taken by the automated UAV
method to achieve the same amount of overlap and to capture
a small (closer) and medium (farther) scale measurement
through holding two different altitudes above the pile (see
Figure 6).
Table 3 also includes a list of time entries for each method.
These time entries represent the amount of time taken for each
step in the procedure described in Section 2.2.1 and 2.2.2 for
manual and automated image analysis, respectively.
“Preparation” time is the time taken to complete step 1 for
manual fragmentation analysis and step 1 for automated
analysis. Step 2 in the manual analysis and steps 2-4 in the
automated procedure are measured as the “operating” time.
Figure 6: Location and camera direction used to capture images for fixed-camera, manual image analysis (blue) and
UAV-based, automated image analysis (yellow).
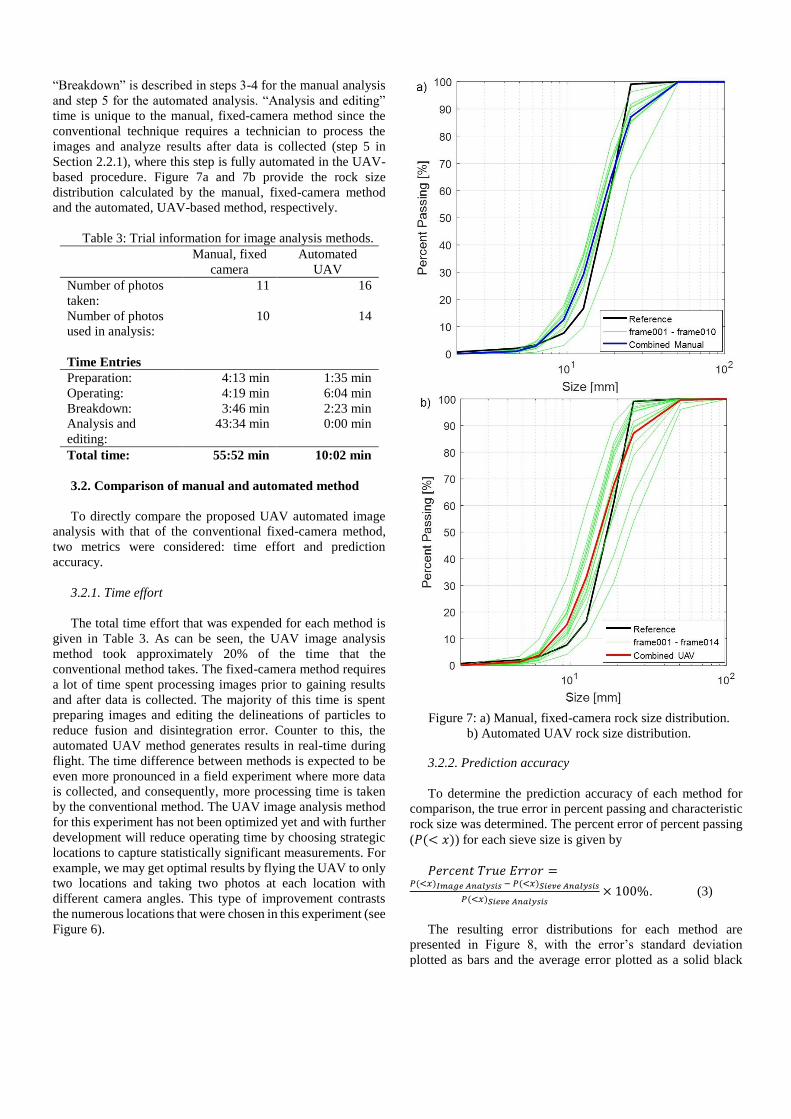
“Breakdown” is described in steps 3-4 for the manual analysis
and step 5 for the automated analysis. “Analysis and editing”
time is unique to the manual, fixed-camera method since the
conventional technique requires a technician to process the
images and analyze results after data is collected (step 5 in
Section 2.2.1), where this step is fully automated in the UAV-
based procedure. Figure 7a and 7b provide the rock size
distribution calculated by the manual, fixed-camera method
and the automated, UAV-based method, respectively.
Table 3: Trial information for image analysis methods.
Manual, fixed
camera
Automated
UAV
Number of photos
taken:
11 16
Number of photos
used in analysis:
10 14
Time Entries
Preparation: 4:13 min 1:35 min
Operating: 4:19 min 6:04 min
Breakdown: 3:46 min 2:23 min
Analysis and
editing:
43:34 min 0:00 min
Total time: 55:52 min 10:02 min
3.2. Comparison of manual and automated method
To directly compare the proposed UAV automated image
analysis with that of the conventional fixed-camera method,
two metrics were considered: time effort and prediction
accuracy.
3.2.1. Time effort
The total time effort that was expended for each method is
given in Table 3. As can be seen, the UAV image analysis
method took approximately 20% of the time that the
conventional method takes. The fixed-camera method requires
a lot of time spent processing images prior to gaining results
and after data is collected. The majority of this time is spent
preparing images and editing the delineations of particles to
reduce fusion and disintegration error. Counter to this, the
automated UAV method generates results in real-time during
flight. The time difference between methods is expected to be
even more pronounced in a field experiment where more data
is collected, and consequently, more processing time is taken
by the conventional method. The UAV image analysis method
for this experiment has not been optimized yet and with further
development will reduce operating time by choosing strategic
locations to capture statistically significant measurements. For
example, we may get optimal results by flying the UAV to only
two locations and taking two photos at each location with
different camera angles. This type of improvement contrasts
the numerous locations that were chosen in this experiment (see
Figure 6).
3.2.2. Prediction accuracy
To determine the prediction accuracy of each method for
comparison, the true error in percent passing and characteristic
rock size was determined. The percent error of percent passing
(𝑃(< 𝑥)) for each sieve size is given by
𝑃𝑒𝑟𝑐𝑒𝑛𝑡 𝑇𝑟𝑢𝑒 𝐸𝑟𝑟𝑜𝑟 =𝑃(<𝑥)𝐼𝑚𝑎𝑔𝑒 𝐴𝑛𝑎𝑙𝑦𝑠𝑖𝑠 − 𝑃(<𝑥)𝑆𝑖𝑒𝑣𝑒 𝐴𝑛𝑎𝑙𝑦𝑠𝑖𝑠
𝑃(<𝑥)𝑆𝑖𝑒𝑣𝑒 𝐴𝑛𝑎𝑙𝑦𝑠𝑖𝑠× 100% . (3)
The resulting error distributions for each method are
presented in Figure 8, with the error’s standard deviation
plotted as bars and the average error plotted as a solid black
Figure 7: a) Manual, fixed-camera rock size distribution.
b) Automated UAV rock size distribution.
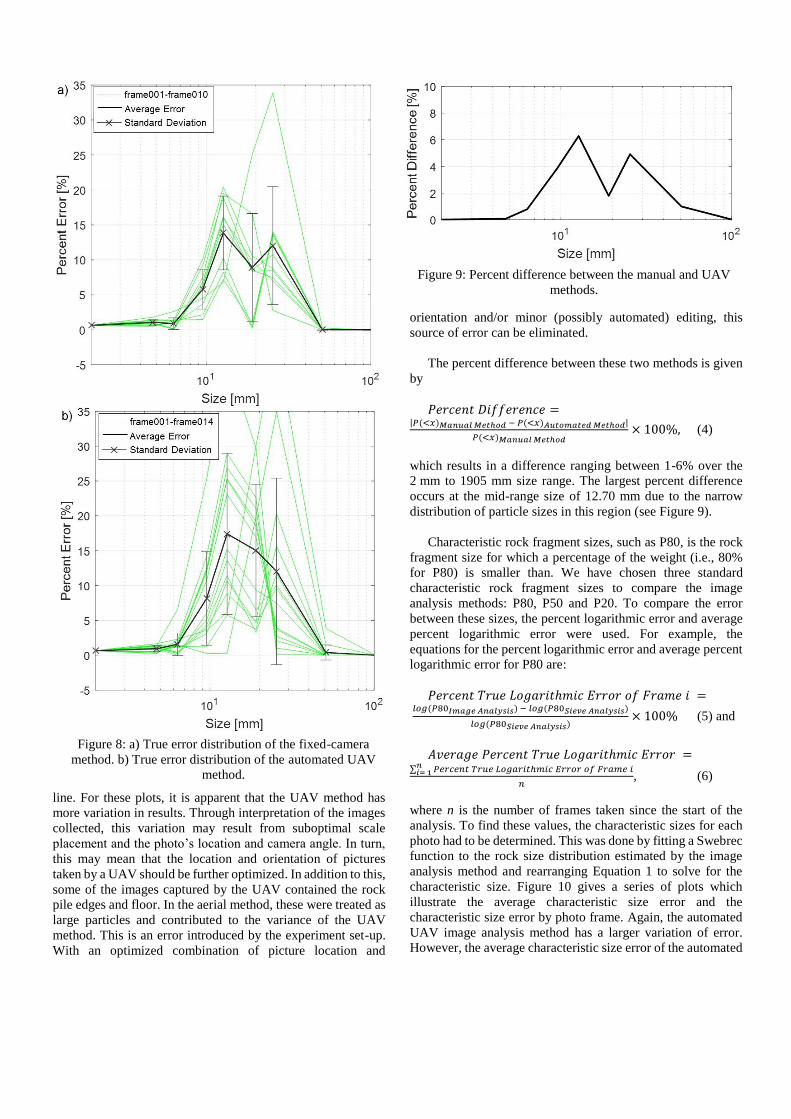
line. For these plots, it is apparent that the UAV method has
more variation in results. Through interpretation of the images
collected, this variation may result from suboptimal scale
placement and the photo’s location and camera angle. In turn,
this may mean that the location and orientation of pictures
taken by a UAV should be further optimized. In addition to this,
some of the images captured by the UAV contained the rock
pile edges and floor. In the aerial method, these were treated as
large particles and contributed to the variance of the UAV
method. This is an error introduced by the experiment set-up.
With an optimized combination of picture location and
orientation and/or minor (possibly automated) editing, this
source of error can be eliminated.
The percent difference between these two methods is given
by
𝑃𝑒𝑟𝑐𝑒𝑛𝑡 𝐷𝑖𝑓𝑓𝑒𝑟𝑒𝑛𝑐𝑒 =|𝑃(<𝑥)𝑀𝑎𝑛𝑢𝑎𝑙 𝑀𝑒𝑡ℎ𝑜𝑑 − 𝑃(<𝑥)𝐴𝑢𝑡𝑜𝑚𝑎𝑡𝑒𝑑 𝑀𝑒𝑡ℎ𝑜𝑑|
𝑃(<𝑥)𝑀𝑎𝑛𝑢𝑎𝑙 𝑀𝑒𝑡ℎ𝑜𝑑× 100%, (4)
which results in a difference ranging between 1-6% over the
2 mm to 1905 mm size range. The largest percent difference
occurs at the mid-range size of 12.70 mm due to the narrow
distribution of particle sizes in this region (see Figure 9).
Characteristic rock fragment sizes, such as P80, is the rock
fragment size for which a percentage of the weight (i.e., 80%
for P80) is smaller than. We have chosen three standard
characteristic rock fragment sizes to compare the image
analysis methods: P80, P50 and P20. To compare the error
between these sizes, the percent logarithmic error and average
percent logarithmic error were used. For example, the
equations for the percent logarithmic error and average percent
logarithmic error for P80 are:
𝑃𝑒𝑟𝑐𝑒𝑛𝑡 𝑇𝑟𝑢𝑒 𝐿𝑜𝑔𝑎𝑟𝑖𝑡ℎ𝑚𝑖𝑐 𝐸𝑟𝑟𝑜𝑟 𝑜𝑓 𝐹𝑟𝑎𝑚𝑒 𝑖 =
𝑙𝑜𝑔(𝑃80𝐼𝑚𝑎𝑔𝑒 𝐴𝑛𝑎𝑙𝑦𝑠𝑖𝑠) − 𝑙𝑜𝑔(𝑃80𝑆𝑖𝑒𝑣𝑒 𝐴𝑛𝑎𝑙𝑦𝑠𝑖𝑠)
𝑙𝑜𝑔(𝑃80𝑆𝑖𝑒𝑣𝑒 𝐴𝑛𝑎𝑙𝑦𝑠𝑖𝑠)× 100% (5) and
𝐴𝑣𝑒𝑟𝑎𝑔𝑒 𝑃𝑒𝑟𝑐𝑒𝑛𝑡 𝑇𝑟𝑢𝑒 𝐿𝑜𝑔𝑎𝑟𝑖𝑡ℎ𝑚𝑖𝑐 𝐸𝑟𝑟𝑜𝑟 =∑ 𝑃𝑒𝑟𝑐𝑒𝑛𝑡 𝑇𝑟𝑢𝑒 𝐿𝑜𝑔𝑎𝑟𝑖𝑡ℎ𝑚𝑖𝑐 𝐸𝑟𝑟𝑜𝑟 𝑜𝑓 𝐹𝑟𝑎𝑚𝑒 𝑖𝑛
𝑖= 1
𝑛, (6)
where n is the number of frames taken since the start of the
analysis. To find these values, the characteristic sizes for each
photo had to be determined. This was done by fitting a Swebrec
function to the rock size distribution estimated by the image
analysis method and rearranging Equation 1 to solve for the
characteristic size. Figure 10 gives a series of plots which
illustrate the average characteristic size error and the
characteristic size error by photo frame. Again, the automated
UAV image analysis method has a larger variation of error.
However, the average characteristic size error of the automated
Figure 8: a) True error distribution of the fixed-camera
method. b) True error distribution of the automated UAV
method.
Figure 9: Percent difference between the manual and UAV
methods.
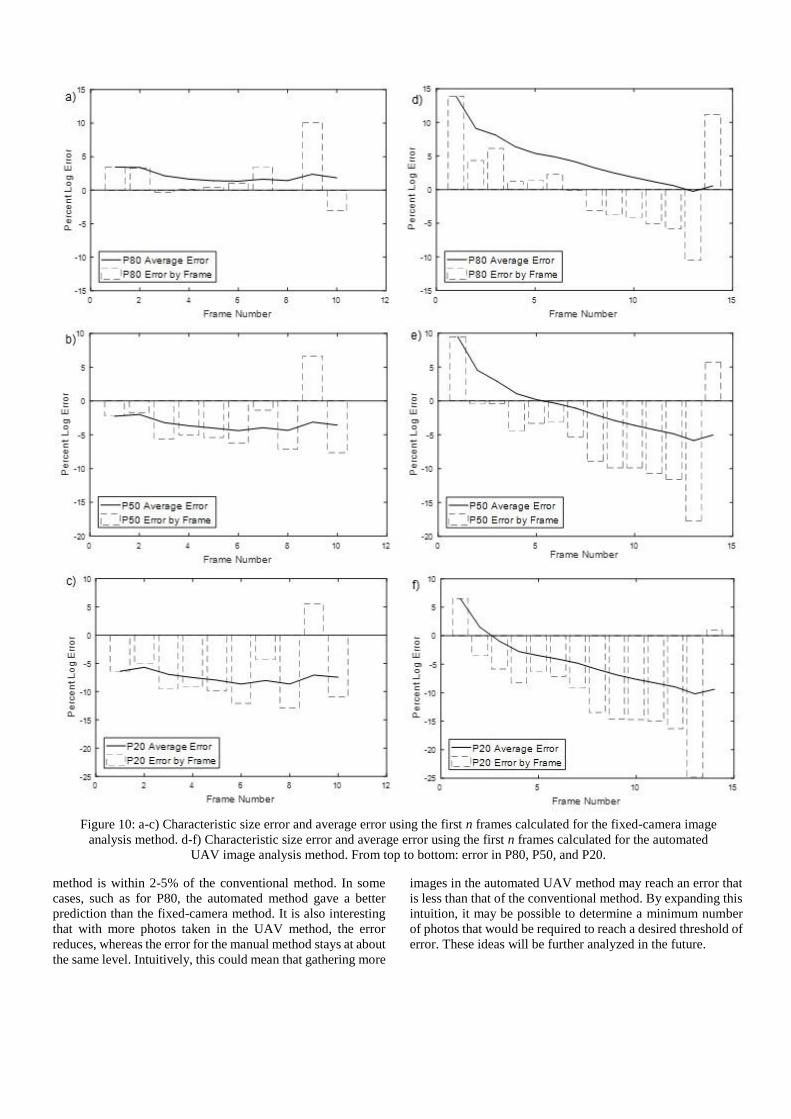
method is within 2-5% of the conventional method. In some
cases, such as for P80, the automated method gave a better
prediction than the fixed-camera method. It is also interesting
that with more photos taken in the UAV method, the error
reduces, whereas the error for the manual method stays at about
the same level. Intuitively, this could mean that gathering more
images in the automated UAV method may reach an error that
is less than that of the conventional method. By expanding this
intuition, it may be possible to determine a minimum number
of photos that would be required to reach a desired threshold of
error. These ideas will be further analyzed in the future.
Figure 10: a-c) Characteristic size error and average error using the first n frames calculated for the fixed-camera image
analysis method. d-f) Characteristic size error and average error using the first n frames calculated for the automated
UAV image analysis method. From top to bottom: error in P80, P50, and P20.
Overall, based on our preliminary analysis, the automated
UAV analysis method performed better than the conventional
method in terms of time effort (five times faster) and, on
average, predicted the rock size distribution within 17% of the
sieving analysis measurement (see Figure 8b). The largest error
occurred in the coarse region of the rock size distribution. This
automated method also resulted in a size distribution prediction
that was within 6% of the manual image analysis method (see
Figure 9). This is considered to be very accurate for rock
fragmentation image analysis, especially since the findings of
[4] suggest that image analysis relative to sieve analysis can
reach 30% error in coarse regions and up to or beyond 100%
error in the fines region. As a result, the proposed automated,
UAV-based technique can provide at least comparable
accuracy to the manual methods.
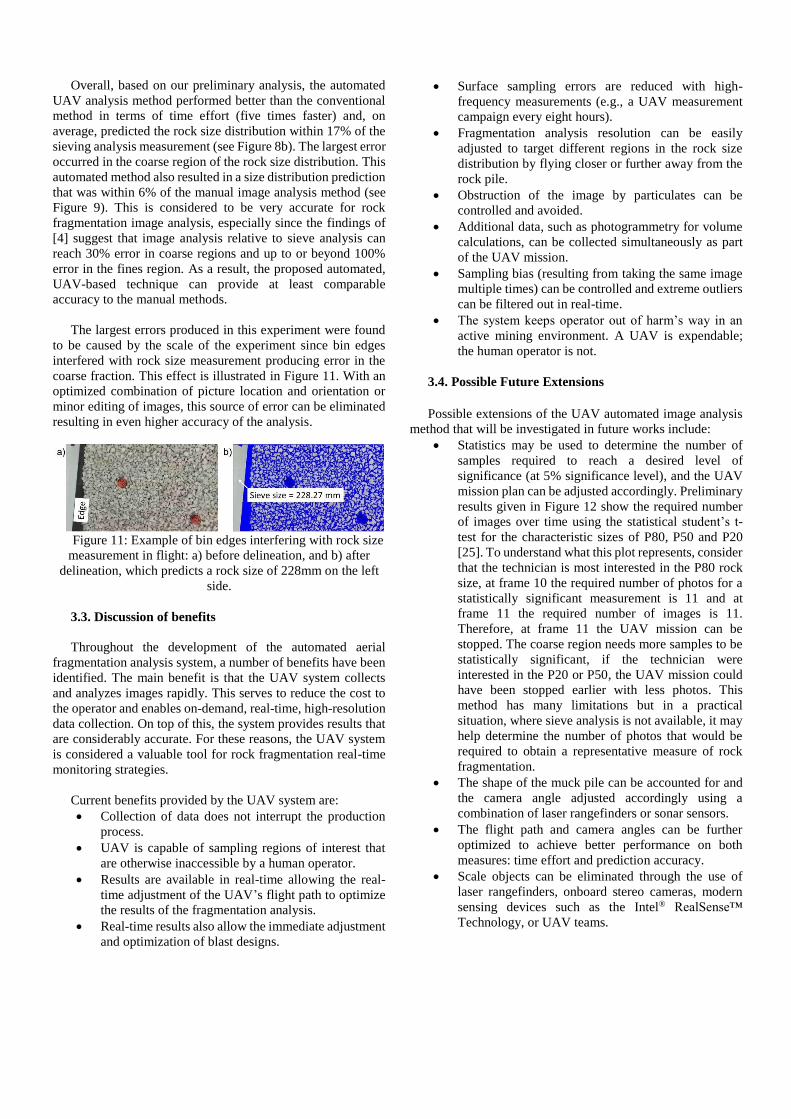
The largest errors produced in this experiment were found
to be caused by the scale of the experiment since bin edges
interfered with rock size measurement producing error in the
coarse fraction. This effect is illustrated in Figure 11. With an
optimized combination of picture location and orientation or
minor editing of images, this source of error can be eliminated
resulting in even higher accuracy of the analysis.
Figure 11: Example of bin edges interfering with rock size
measurement in flight: a) before delineation, and b) after
delineation, which predicts a rock size of 228mm on the left
side.
3.3. Discussion of benefits
Throughout the development of the automated aerial
fragmentation analysis system, a number of benefits have been
identified. The main benefit is that the UAV system collects
and analyzes images rapidly. This serves to reduce the cost to
the operator and enables on-demand, real-time, high-resolution
data collection. On top of this, the system provides results that
are considerably accurate. For these reasons, the UAV system
is considered a valuable tool for rock fragmentation real-time
monitoring strategies.
Current benefits provided by the UAV system are:
Collection of data does not interrupt the production
process.
UAV is capable of sampling regions of interest that
are otherwise inaccessible by a human operator.
Results are available in real-time allowing the real-
time adjustment of the UAV’s flight path to optimize
the results of the fragmentation analysis.
Real-time results also allow the immediate adjustment
and optimization of blast designs.
Surface sampling errors are reduced with high-
frequency measurements (e.g., a UAV measurement
campaign every eight hours).
Fragmentation analysis resolution can be easily
adjusted to target different regions in the rock size
distribution by flying closer or further away from the
rock pile.
Obstruction of the image by particulates can be
controlled and avoided.
Additional data, such as photogrammetry for volume
calculations, can be collected simultaneously as part
of the UAV mission.
Sampling bias (resulting from taking the same image
multiple times) can be controlled and extreme outliers
can be filtered out in real-time.
The system keeps operator out of harm’s way in an
active mining environment. A UAV is expendable;
the human operator is not.
3.4. Possible Future Extensions
Possible extensions of the UAV automated image analysis
method that will be investigated in future works include: Statistics may be used to determine the number of
samples required to reach a desired level of
significance (at 5% significance level), and the UAV
mission plan can be adjusted accordingly. Preliminary
results given in Figure 12 show the required number
of images over time using the statistical student’s t-
test for the characteristic sizes of P80, P50 and P20
[25]. To understand what this plot represents, consider
that the technician is most interested in the P80 rock
size, at frame 10 the required number of photos for a
statistically significant measurement is 11 and at
frame 11 the required number of images is 11.
Therefore, at frame 11 the UAV mission can be
stopped. The coarse region needs more samples to be
statistically significant, if the technician were
interested in the P20 or P50, the UAV mission could
have been stopped earlier with less photos. This
method has many limitations but in a practical
situation, where sieve analysis is not available, it may
help determine the number of photos that would be
required to obtain a representative measure of rock
fragmentation.
The shape of the muck pile can be accounted for and
the camera angle adjusted accordingly using a
combination of laser rangefinders or sonar sensors.
The flight path and camera angles can be further
optimized to achieve better performance on both
measures: time effort and prediction accuracy.
Scale objects can be eliminated through the use of
laser rangefinders, onboard stereo cameras, modern
sensing devices such as the Intel® RealSense™
Technology, or UAV teams.
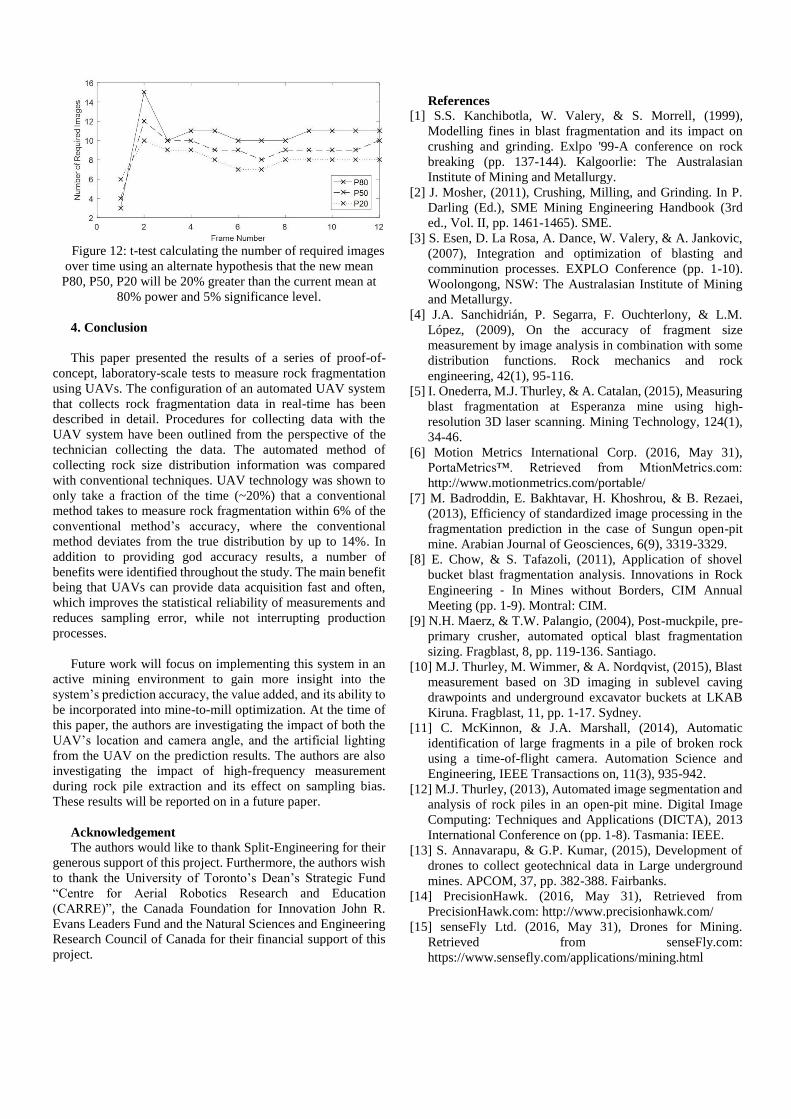
Figure 12: t-test calculating the number of required images
over time using an alternate hypothesis that the new mean
P80, P50, P20 will be 20% greater than the current mean at
80% power and 5% significance level.
4. Conclusion
This paper presented the results of a series of proof-of-
concept, laboratory-scale tests to measure rock fragmentation
using UAVs. The configuration of an automated UAV system
that collects rock fragmentation data in real-time has been
described in detail. Procedures for collecting data with the
UAV system have been outlined from the perspective of the
technician collecting the data. The automated method of
collecting rock size distribution information was compared
with conventional techniques. UAV technology was shown to
only take a fraction of the time (~20%) that a conventional
method takes to measure rock fragmentation within 6% of the
conventional method’s accuracy, where the conventional
method deviates from the true distribution by up to 14%. In
addition to providing god accuracy results, a number of
benefits were identified throughout the study. The main benefit
being that UAVs can provide data acquisition fast and often,
which improves the statistical reliability of measurements and
reduces sampling error, while not interrupting production
processes.
Future work will focus on implementing this system in an
active mining environment to gain more insight into the
system’s prediction accuracy, the value added, and its ability to
be incorporated into mine-to-mill optimization. At the time of
this paper, the authors are investigating the impact of both the
UAV’s location and camera angle, and the artificial lighting
from the UAV on the prediction results. The authors are also
investigating the impact of high-frequency measurement
during rock pile extraction and its effect on sampling bias.
These results will be reported on in a future paper.
Acknowledgement
The authors would like to thank Split-Engineering for their
generous support of this project. Furthermore, the authors wish
to thank the University of Toronto’s Dean’s Strategic Fund
“Centre for Aerial Robotics Research and Education
(CARRE)”, the Canada Foundation for Innovation John R.
Evans Leaders Fund and the Natural Sciences and Engineering
Research Council of Canada for their financial support of this
project.
References
[1] S.S. Kanchibotla, W. Valery, & S. Morrell, (1999),
Modelling fines in blast fragmentation and its impact on
crushing and grinding. Exlpo '99-A conference on rock
breaking (pp. 137-144). Kalgoorlie: The Australasian
Institute of Mining and Metallurgy.
[2] J. Mosher, (2011), Crushing, Milling, and Grinding. In P.
Darling (Ed.), SME Mining Engineering Handbook (3rd
ed., Vol. II, pp. 1461-1465). SME.
[3] S. Esen, D. La Rosa, A. Dance, W. Valery, & A. Jankovic,
(2007), Integration and optimization of blasting and
comminution processes. EXPLO Conference (pp. 1-10).
Woolongong, NSW: The Australasian Institute of Mining
and Metallurgy.
[4] J.A. Sanchidrián, P. Segarra, F. Ouchterlony, & L.M.
López, (2009), On the accuracy of fragment size
measurement by image analysis in combination with some
distribution functions. Rock mechanics and rock
engineering, 42(1), 95-116.
[5] I. Onederra, M.J. Thurley, & A. Catalan, (2015), Measuring
blast fragmentation at Esperanza mine using high-
resolution 3D laser scanning. Mining Technology, 124(1),
34-46.
[6] Motion Metrics International Corp. (2016, May 31),
PortaMetrics™. Retrieved from MtionMetrics.com:
http://www.motionmetrics.com/portable/
[7] M. Badroddin, E. Bakhtavar, H. Khoshrou, & B. Rezaei,
(2013), Efficiency of standardized image processing in the
fragmentation prediction in the case of Sungun open-pit
mine. Arabian Journal of Geosciences, 6(9), 3319-3329.
[8] E. Chow, & S. Tafazoli, (2011), Application of shovel
bucket blast fragmentation analysis. Innovations in Rock
Engineering ‐ In Mines without Borders, CIM Annual
Meeting (pp. 1-9). Montral: CIM.
[9] N.H. Maerz, & T.W. Palangio, (2004), Post-muckpile, pre-
primary crusher, automated optical blast fragmentation
sizing. Fragblast, 8, pp. 119-136. Santiago.
[10] M.J. Thurley, M. Wimmer, & A. Nordqvist, (2015), Blast
measurement based on 3D imaging in sublevel caving
drawpoints and underground excavator buckets at LKAB
Kiruna. Fragblast, 11, pp. 1-17. Sydney.
[11] C. McKinnon, & J.A. Marshall, (2014), Automatic
identification of large fragments in a pile of broken rock
using a time-of-flight camera. Automation Science and
Engineering, IEEE Transactions on, 11(3), 935-942.
[12] M.J. Thurley, (2013), Automated image segmentation and
analysis of rock piles in an open-pit mine. Digital Image
Computing: Techniques and Applications (DICTA), 2013
International Conference on (pp. 1-8). Tasmania: IEEE.
[13] S. Annavarapu, & G.P. Kumar, (2015), Development of
drones to collect geotechnical data in Large underground
mines. APCOM, 37, pp. 382-388. Fairbanks.
[14] PrecisionHawk. (2016, May 31), Retrieved from
PrecisionHawk.com: http://www.precisionhawk.com/
[15] senseFly Ltd. (2016, May 31), Drones for Mining.
Retrieved from senseFly.com:
https://www.sensefly.com/applications/mining.html

[16] DataMapper. (2016, May 31), Professional Drone Based
Mapping and Analytics. Retrieved from DataMapper.com:
https://www.datamapper.com
[17] Open Source Robotics Foundation. (2016, May 31),
Retrieved from ROS.org: http://www.ros.org/
[18] J. Engel, J. Sturm, & D. Cremers, (2014). Scale-aware
navigation of a low-cost quadrocopter with a monocular
camera. Robotics and Autonomous Systems, 62(11), 1646-
1656.
[19] M.W. Mueller, M. Hamer, & R. D'Andrea, (2015), Fusing
ultra-wideband range measurements with accelerometers
and rate gyroscopes for quadrocopter state estimation.
Robotics and Automation (ICRA), 2015 IEEE International
Conference on (pp. 1730-1736). IEEE.
[20] F. Ouchterlony, (2005), The Swebrec© function: linking
fragmentation by blasting and crushing. Mining
Technology, 29-44.
[21] C.V.B. Cunningham, (2005), The Kuz-Ram fragmentation
model – 20 years on. 3rd EFEE World Conference of
Explosives and Blasting (pp. 201-210). Brighton: EFEE.
[22] Parrot SA. (2016, May 31), Parrot Bebop 2. Retrieved
from Parrot.com: http://www.parrot.com/products/bebop2/
[23] Split Engineering LLC. (2016, May 31), Split-Desktop
Software. Retrieved from spliteng.com:
http://www.spliteng.com/products/split-desktop-software/
[24] B. Gerkey, (2015, December 9), ROS, the Robot
Operating System, Is Growing Faster Than Ever, Celebrates
8 Years. Retrieved from IEEE Spectrum:
http://spectrum.ieee.org/automaton/robotics/robotics-
software/ros-robot-operating-system-celebrates-8-years
[25] R.E. Walpole, R. Myers, S.L. Myers, & Y. Keying (2012).
One- and two- sample tests of hypotheses. In Probability
and statistics for engineers & scientists (9th ed., pp. 319-
387). Toronto: Prentice Hall.