a rock engineering systems based model to predict...
TRANSCRIPT

International Journal of Rock Mechanics & Mining Sciences 60 (2013) 82–94
Contents lists available at SciVerse ScienceDirect
International Journal ofRock Mechanics & Mining Sciences
1365-16
http://d
n Corr
E-m
journal homepage: www.elsevier.com/locate/ijrmms
A rock engineering systems based model to predict rock fragmentationby blasting
F. Faramarzi, H. Mansouri n, M.A. Ebrahimi Farsangi
Mining Engineering Department, Shahid Bahonar University of Kerman, Kerman, Iran
a r t i c l e i n f o
Article history:
Received 12 March 2012
Received in revised form
12 December 2012
Accepted 29 December 2012Available online 30 January 2013
Keywords:
Blasting
Rock fragmentation
Rock engineering systems
Kuz–Ram model
Regression modeling
Sungun copper mine
09/$ - see front matter & 2013 Elsevier Ltd. A
x.doi.org/10.1016/j.ijrmms.2012.12.045
esponding author. Tel.: þ98 341 211 2764; f
ail addresses: [email protected], hmansuri2
a b s t r a c t
A new model for prediction of rock fragmentation by blasting is presented based upon the basic
concepts of rock engineering systems (RES). The newly proposed approach involves 16 effective
parameters on fragmentation by blasting with keeping simplicity as well. The data for 30 blasts, carried
out at Sungun copper mine, western Iran, were used to predict fragmentation by the RES based model
as well as Kuz–Ram and multiple regression modeling. To validate the new model, the fragmentations
of nine production blasts were measured and the results obtained were compared with the predictions
carried out by the RES, Kuz–Ram and multiple regression models. Coefficient of determination (R2) and
root mean square error (RMSE) were calculated for the models to compare the results obtained. For the
RES, linear, polynomial, power, logarithmic, exponential and Kuz–Ram models, R2 and RSME are equal
to (0.65 and 14.51), (0.58 and 29.73), (0.54 and 21.58), (0.60 and 32.64), (0.61 and 23.80), (0.50 and
184.60) and (0.46 and 22.22) respectively. These indicate that the RES based model predictor with
higher R2 and less RMSE performs better than the other models.
& 2013 Elsevier Ltd. All rights reserved.
1. Introduction
Rock fragmentation has been the concern of many researchworks because it is considered as the most important aspect ofproduction blasting, since it affects on the costs of drilling,blasting and the efficiency of all the subsystems such as loading,hauling and crushing in mining operations [1–7]. The parametersaffecting on the rock fragmentation can be categorized in twogroups: the first group is controllable parameters; such as blast-ing design parameters and also explosive related parameters; andthe second one are uncontrollable parameters, which containsphysical and geomechanical properties of intact rock and alsorock mass [8–10].
Prediction of the rock fragmentation size is the first step towardoptimization of blast design parameters to produce required frag-ment size [11]. Several studies have been conducted on the predic-tion of fragmentation by blasting accounting for controllable anduncontrollable parameters. An equation on the basis of the relation-ship between mean fragment size and specific charge was developedby Kuznetsov [12]. Cunningham [13], based upon the Kuznetsovmodel and the Rosin & Rammler distribution, introduced a newmodel, Kuz–Ram model, to predict rock fragmentation by blasting.Kuz–Ram model was further improved by Cunningham [14].
ll rights reserved.
ax: þ98 341 212 1003.
[email protected] (H. Mansouri).
Hjelmberg [15] presented the SveDeFo model to predict X50,considering the rock mass type and the blast pattern. Otternesset al. [16] performed an extensive study to correlate shot designparameters to fragmentation. Kou and Rustan [17] developed anempirical model to predict X50. Lownds [18] used distribution ofexplosives energy to predict the fragmentation by blasting. Aleret al. [4] carried out a research work to predict blast fragmenta-tion by multivariate analysis procedures. Djordjevic [19] pre-sented the results of blast fragmentation modeling based on twomechanism of failure at JKMRC. Furthermore, Morin and Ficarazzo[20] applied Monte Carlo simulation as a tool for prediction offragmentation based on Kuz–Ram model. Also, Gheibie et al.[21,22] tried to enhance fragmentation prediction by modificationof Kuznetsov model and Kuz–Ram model. In 2010, Ouchterlonyproposed a new fragment size distribution function [23].
Some research works were carried out using artificial intelligencemethods to predict rock fragmentation. Saavedra et al. [24] conducteda research work to predict fragmentation by blasting, using a neuralnetwork model. Monjezi et al. [25] developed a fuzzy logic model forprediction of rock fragmentation by blasting. Kulatilake et al. [10]presented a piece of work, predicting mean particle size in rock blastfragmentation using neural networks. Also, Monjezi et al. [26] usedneural networks for prediction of rock blasting fragmentation. Chak-raborty et al. and Hudaverdi et al. [27,28] applied multivariateanalysis procedures to predict rock fragmentation by blasting.
The empirical and neural network models that are based uponthe data surveying from different blasting operations, in a certain

F. Faramarzi et al. / International Journal of Rock Mechanics & Mining Sciences 60 (2013) 82–94 83
range of rock types, cannot be generalized for various groundconditions. Furthermore, all of above models do not simulta-neously consider all the pertinent parameters in the modeling.Under such limitations or constraints, the prediction of rockfragmentation due to blasting needs the new innovative methodssuch as the RES based model, capable of accounting unlimitedparameters in the model. The RES approach has been applied to anumber of rock engineering fields, for examples, evaluation ofstability of underground excavations [29], hazard and risk assess-ment of rockfall [30], rock mass characterization for indicatingnatural slope instability [31], development of an assessmentsystem for blastability of rock masses [32], assessing geotechnicalhazards for TBM tunneling [33] and quantitative hazard assess-ment for tunnel collapses [34].
Fig. 1. A general view of the Sungun copper mine.
Fig. 2. Different sectors in the
The present paper introduces a new RES based model that canbe applied to evaluate fragmentation risk (poor fragmentation)and then, predict rock fragmentation in bench blasting, consider-ing all pertinent parameters. To validate the performance of themodel proposed, it is applied to Sungun copper mine, Iran.Furthermore, the results obtained are compared with the resultsof Kuz–Ram model and also statistical modeling, which carry outfor the same mine.
2. The field study
2.1. Site description
Sungun copper mine, an open-pit mine, with a mineablereserve of 410 Mt and average grade of 0.6% copper, is located100 km north east of Tabriz city, Iran. It is planned to produce7 Mt ore for the initial 7 years with the intention to expandcapacity up to 14 Mt of ore. A maximum slope height of 765 mwas obtained for the initial design of the final pit. In blastingoperation, ANFO is used as explosive and NONEL and detonatingcord as initiation systems with staggered pattern. Also, inter-row
Sungun copper mine [35].
Table 1Properties of intact rock and rock mass in the Sungun copper mine [35].
Sector Average values of intact rock and rock mass
UCS (MPa) C (KPa) GSI RMR
RS01 55 538 35 37
RS02 63 630 38 49
RS03 73 662 39 44
RS04 68 710 39 34
RS05 64 655 37 43
RS06 87 794 39 41
RS07 82 789 40 44

30
40
50
60
70
80
90
100
Size
pas
sing
(%)
F. Faramarzi et al. / International Journal of Rock Mechanics & Mining Sciences 60 (2013) 82–9484
sequencing was adopted. A general view of Sungun copper mineis shown in Fig. 1.
The geology of area consists of Sungun intrusive complexhosting the Sungun porphyry copper stock intruded along theSungun anticline into cretaceous limestone, marls and shales. Themain lithological units exposed in the Sungun pit are Sungunporphyry (SP), Dykes, Pyroclastics (PC), Trachybasalt (TB) andSkarn (SK) [35].
2.2. Rock mass properties
Based upon the rock mass characteristics in the Sungun coppermine, seven sectors were recognized (RS01–RS07), as shown inFig. 2 and Table 1 [35].
2.3. Data collection
Based upon 39 blasts carried out at Sungun copper mine, adatabase was prepared for models development. Out of 39 blasts,30 blasts were used for modeling development and nine blasts forevaluation of models performance. In this database, burden (B),maximum instantaneous charge, powder factor, S/B (S: spacing),ST/B (ST: Stemming), stiffness factor, time delay, number of rows,blasthole inclination, blasthole deviation, blasthole diameter (D),B/D, J/B (J: subdrilling), blasting pattern, initiation sequence andblastability index were measured or calculated as input para-meters to the model and X80 (80% passing size) as representativeof muck pile fragmentation size was measured as a favorableparameter in each blasting round.
The image analysis technique was used to find muck piledistribution and the relevant X80 for each blast. In average, foreach blast 30 photos were taken systematically from muck pile indifferent steps of loading (immediately after blast, after loadinghalf of muck pile and at the end of muck pile loading). Goldsizesoftware was used to carry out image analysis in which delineat-ing of fragments is done manually and the fine correction optionwas used. The software was calibrated by comparing imageanalysis with sieve results (for determining sieve shift and masspower). A sample work of the image analysis for a blast (blast no. 9)at Sungun copper mine and the corresponding muck pile distribu-tion curve are shown in Figs. 3 and 4 respectively.
The basic descriptive statistics of 39 blasts carried out atSungun copper mine are summarized in Table 2.
0
10
20
0.00 0.05 0.10 0.15 0.20 0.25 0.30Avarage size (m)
Fig. 4. Muck pile distribution curve for blast No. 9, Sungun copper mine.
3. Muck pile fragment size prediction, using Kuz–Ram model
The Kuz–Ram model, proposed by Cunningham [14], is themost used empirical fragmentation method, based upon theKuznetsov and Rosin–Rammler equations. The Rosin–Rammlerequation is used to characterize muck pile size distribution. It is
Fig. 3. Image analysis for blast
expressed as an exponential relation [13]:
R¼ e� x=xcð Þn
ð1Þ
where R is the weight fraction of fragments larger than x, n is theuniformity exponent, xc is the characteristic size and x is thefragment size.
The Kuznetsov [12] equation is a semi-empirical equationbased upon field studies and that relates the mean fragment sizeto the quantity of explosive, the rock volume blasted and the rockstrength:
Xm ¼ AVO
QT
� �0:8
Q0:167T ð2Þ
where Xm is the mean fragment size (cm), A is the rock factor, VO
is the rock volume fragmented per blasthole (m3), QT is the massof TNT containing the energy equivalent of the explosive charge ineach blasthole (kg). The original equation was modified byCunningham for ANFO based explosives [14]:
Xm ¼ AK�0:8Q0:167e
SANFO
115
� ��0:633
ð3Þ
where K is the powder factor (kg/m3), SANFO is the weight strengthof the explosive relative to ANFO, and Qe is the mass explosivebeing used in each hole (kg). The blastability index, originallyproposed by Lilly [36], was adopted to determine rock factor:
A¼ 0:06� RMDþ JFþRDIþHFð Þ ð4Þ
where A is the rock factor, RMD the rock mass description, JF thejoint factor, RDI the rock density index and HF the hardness factor.These factors are calculated from geological data such as; in situblock size, joint spacing, joint orientation, rock specific gravity,
no. 9, Sungun copper mine.

Table 2Basic descriptive statistics of 39 blasts, Sungun copper mine.
No. Parameter Symbol Min Max Mean St.d
1 Burden (m) B 1.3 5.5 3.94 1.03
2 Maximum instantaneous charge (kg) MC 81 4230 1404.29 964.78
3 Powder factor (g/ton) PF 72 373 205.01 171.23
4 S/B ratio S/B 1 3.9 1.57 1.11
5 ST/B ratio ST/B 0.33 3.44 1.02 0.65
6 Stiffness factor H/B 1.1 10 3.35 1.91
7 Number of rows N 1 5 2.64 0.96
8 Time delay (ms) DLY 20 200 58.10 45.00
9 Hole inclination (degree) INCL 90 90 90.00 0.00
10 Hole deviation (degree) DEV 5 15 11.41 2.67
11 Hole diameter D 125 250 148.39 26.47
12 J/B ratio J/B 0 0.45 0.09 0.14
13 Blastability Index BI 30 63.5 37.61 6.73
14 B/D ratio B/D 5 38 26.86 6.70
15 80% passing size X80 10 108 50.54 21.98
S: Spacing, ST: Stemming, St. d.: Standard deviation, H: Bench height, Min.: Minimum, Max.: Maximum, Blasting agent is ANFO (0.84 g/cm3)
Table 3Relations between individual independent variables and X80 for 30 blasts, Sungun
copper mine.
Independent variables Regression line R2 N
B X80¼16.56(B)�10.27 0.35 30
MC X80¼0.002(MC)þ48.60 0.005 30
PF X80¼�0.142(PF)þ74.62 0.21 30
S/B X80¼�11.61(S/B)þ68.48 0.12 30
ST/B X80¼�8.57(ST/B)þ60.48 0.10 30
H/B X80¼�3.60(H/B)þ64.17 0.15 30
N X80¼10.23(N)þ25.54 0.27 30
DLY X80¼�0.028(DLY)þ52.58 0.002 30
DEV X80¼3.44(DEV)þ8.29 0.08 30
D X80¼0.076(D)þ40.39 0.01 30
J/B X80¼�18.02(J/B)þ51.91 0.01 30
BI X80¼0.154(BI)þ45.44 0.001 30
B/D X80¼0.916(B/D)þ27.07 0.16 30
Dependant variable: X80 30
F. Faramarzi et al. / International Journal of Rock Mechanics & Mining Sciences 60 (2013) 82–94 85
Young’s modulus and unconfined compressive strength. Cunning-ham combined the Kuznetsov equation and the Rossin–Rammlerdistribution to produce the Kuz–Ram model [14]. Since theKuznetsov formula gives the screen size Xm for 50% of the passingmaterials, the characteristic size is calculated from the averagesize by substituting X¼Xm and R¼0.5 into Eq. (1):
Xc ¼Xm
ð0:693Þ1=nð5Þ
The uniformity coefficient is calculated from an equationdeveloped by Cunningham [13]. Cunningham established theapplicable uniformity coefficient through several investigations,considering the effect of blast geometry, hole diameter, burden,spacing, hole lengths and drilling accuracy. The n factor can beestimated using Eq. (6) given below:
n¼ 2:2�14 B=D� �� � 1þ S=B
� �2
� 0:5
1�W
B
� �L
H
� �ð6Þ
where B is the blasting burden (m), S is the blasthole spacing (m),D is the blasthole diameter (mm), W is the standard deviation ofdrilling accuracy (m), L is the total charge length (m), and H is thebench height (m). Cunningham notes that the uniformity coeffi-cient n usually varies between 0.8 and 1.5.
4. Statistical modeling
In reviewing the literatures published, addressing the para-meters affecting on the muck pile fragment size [37–41], it isclear that many parameters can influence on the muck pilefragment size. However, the most important parameters, whichare easily obtainable, are shown in Table 2. Since, initiationsequence and blast holes pattern are descriptive effective para-meters on muck pile fragment size, they were not considered inthe statistical modeling.
At the first stage of analysis, hole inclination (INCL) wasremoved from analysis as it is constant for all blasts with standarddeviation of zero (Table 2). The significance of other parameters inthe modeling was investigated based upon correlations betweenthe individual independent variables and the actual measured X80.
Coefficient of determination (R2) was used as an indicator ofcorrelation strength. R2 values for independent variables versusX80 are presented in Table 3. It can be concluded that MC, DLY,DEV, D, J/B and BI have negligible effects on X80 and should beexcluded in the regression modeling. Therefore, for further
statistical analysis and development of a prediction model, sixindependent variables were selected.
4.1. Multiple linear regression analysis
A multiple linear regression analysis was carried out betweenB, PF, S/B, ST/B, H/B and N as independent variables and X80 asdependent variable, using the commercial software packages forstandard statistical analysis (SPSS). Based on the statisticalanalysis, the predictive model is as follows:
X80ðcmÞ ¼ �32:668þ22:160ðBÞ�0:125ðPFÞþ21:264 S=B� �
þ7:979 ST=B� �
�3:828 H=B� �
þ9:747ðNÞ�1:801 B=D� �
ð7Þ
A multicollinearity analysis was carried out to check whethertwo or more independent variables are highly correlated. In thecase of occurring multicollinearity, redundancy of the indepen-dent variables could be expected, which can lead to erroneousresults. One of the most common tools for finding the degree ofmulticollinearity is the variance inflation factor (VIF). It has arange of 1 to infinity. Generally, if the calculated VIF is greaterthan 10, there may be a problem with multicollinearity [42]. TheVIF values of the independent variables in Eq. (7) were calculated,as shown in Table 4. It was concluded that Eq. (7) with VIF of ST/B
(21.64) and H/B (27.56) suffers from a high degree of multi-collinearity. Also, the relationship between ST/B and H/B was

Þ
Table 4Multiple linear regression coefficients and collinearity statistics for Eq. (7).
Independentvariables
Unstandardized coefficients Standardizedcoefficients
95% Confidence Interval for B t values Collinearity Statistics
B Std. Error Beta Lower Bound Upper Bound Tolerance VIF
Constant �32.668 49.272 �134.851 69.516 �0.663
B 22.160 7.258 0.787 7.108 37.212 3.053 0.277 3.604
PF �0.125 0.068 �0.398 �0.267 0.016 �1.834 0.392 2.552
S/B 21.264 11.412 0.637 �2.402 44.930 1.863 0.158 6.326
ST/B 7.979 17.682 0.289 �28.691 44.650 0.451 0.045 22.289
H/B �3.828 6.913 �0.417 �18.165 10.509 �0.554 0.033 30.754
N 9.747 3.773 0.490 1.922 17.572 2.583 0.513 1.949
B/D �1.081 0.923 �0.400 �2.995 0.834 �1.171 0.158 6.342
R2 = 0.96
0123456789
101112
0 0.5 1 1.5 2 2.5 3 3.5 4
H/B
ST/B
Fig. 5. Correlation between ST/B and H/B.
Table 5Regression statistics obtained for Eq. (8).
Model summary
R R2 Adjusted
R2
Std. error of the
estimate
Observations
0.768 0.590 0.483 14.423 30
Analysis of variance (ANOVA)
Sum of
squares
df Mean square F Sig.
Regression 6894.923 6 1149.154 5.524 0.001
Residual 4784.543 23 208.024
Total 11,679.467 29
F. Faramarzi et al. / International Journal of Rock Mechanics & Mining Sciences 60 (2013) 82–9486
examined, which led to finding a high correlation between thesetwo independent variables with determination coefficient (R2) of0.96 (Fig. 5).
To reduce the effect of multicollinearity, a new regressionmodel was defined by removing an independent variable from themodel that is correlated with another independent variable.Between variables ST/B and H/B, ST/B with less determinationcoefficient (Table 3) was excluded from the model and the newmodified model is as follows:
X80 ¼�30:278þ22:229ðBÞ�0:127ðPFÞþ20:109 S=B� �
�1:130 H=B� �
þ10:038ðNÞ�1:180 B=D� �
ð8Þ
The regression statistics, model summary and analysis ofvariance (ANOVA) for Eq. (8) are shown in Table 5. The modelstatistic value F and significance (Sig.) are used to provide enoughevidence to reject the hypothesis of ‘‘no effect’’. From Table 5, F of5.52 and Sig. of 0.001 (less than 0.05) were obtained, which showthat the null hypothesis can be rejected. It means that at least oneof the input parameters significantly affects on the X80. Further-more, possible multicollinearity of the new model (Eq. (8)) wasinvestigated (Table 6). As it is shown in Table 6, in the modifiedmodel, VIF for each independent variable is less than 10. It meansthat no severe correlation between input independent variablesexists.
4.2. Multiple non-linear regression analysis
Polynomial, power, exponential and logarithmic models withthe same independent variables and X80 as dependent variableand also the same sets of data were used to carry out non-linearregression modeling. The mathematical equation obtained forpolynomial model with R2
¼0.58 is
X80ðcmÞ ¼ 11:062þ10:497ðBÞ�0:00037 B=D� �2
�0:00000065ðPFÞ3
�0:0505 S=B� �4
þ0:00033 H=B� �5
þ0:0023ðNÞ6 ð9Þ
For power model the relation with R2¼0.58 is
X80ðcmÞ ¼ 101:332þ0:152ðbÞ�0:011 B=Dð Þ�0:001ðPFÞþ0:121 S=Bð Þ�0:019 H=Bð Þþ0:066ðN
ð10Þ
Furthermore, for logarithmic regression modeling, R2¼0.61 is
obtained and the relation is
X80ðcmÞ ¼ 146038þ53:852lnðBÞ�28:817ln B=D� �
�14:054ðPFÞ
þ26:486 S=B� �
�20:350ln H=B� �
þ16:051lnðNÞ ð11Þ
Finally, the exponential relation for regression modeling withR2¼0.49 is
X80ðcmÞ ¼ exp 3:020þ0:765ðBð Þ�0:105 B=D� �
�0:006 ðPFÞ
�0:098 S=B� �
þ0:205 H=B� �
þ0:697ðNÞÞ ð12Þ
5. Rock engineering systems
The concept of rock engineering systems (RES), introduced byHudson [43], is a method of structuring all the ways in which rockmechanics parameters and variables can affect one another-therock mechanics interactions. The key element in the RES is theinteraction matrix. The interaction matrix is both the basicanalytical and a presentational technique for characterizing theimportant parameters and the interaction mechanisms in a rockengineering system. The generation of the interaction matrix can

Table 7ESQ interaction matrix coding [43].
Coding Description
0 No interaction
1 Weak interaction
2 Medium interaction
3 Strong interaction
4 Critical interaction
Table 8Classification of the vulnerability index (modified after Ref. [33]).
Risk description Low–medium Medium–high High–very high
Category I II III
Vulnerability index 0–33 33–66 66–100
F. Faramarzi et al. / International Journal of Rock Mechanics & Mining Sciences 60 (2013) 82–94 87
help in evaluating the weighting of the parameters within therock mass system as a whole.
In the interaction matrix, the principal parameters affectingthe system (for example, a fragmentation system) are locatedalong the leading diagonal of the matrix and the effects of eachindividual parameter on any other parameter (interactions) areplaced on the off-diagonal cells. The assigning values to off-diagonal cells are called coding the matrix. A problem havingonly two parameters is the simplest of interaction matrix, asrevealed in Fig. 6(a). Also, a general view of the coding ofinteraction matrix is shown in Fig. 6(b) [43]. The row passingthrough Pi represents the influence of Pi on all the other para-meters in the system, while the column through Pi shows theeffects of other parameters, or the remaining of the system, on Pi.In principal, there is no limit to the number of parameters thatmay be included in an interaction matrix.
Different procedures such as, the 0–1 binary, expert semi-quantitative (ESQ) [43] and the continuous quantitative coding(CQC) [44] were proposed for numerically coding the interactionmatrix. Among the coding procedures, the ESQ coding is the mostcommon used. According to this coding technique, the interactionintensity is denoted by the values from 0 (no interaction) to 4(critical interaction) as shown in Table 7.
In the interaction matrix, the sum of a row is called the ‘‘cause’’value (CPi ¼
Pnj ¼ 1 Iij) and the sum of a column is the ‘‘effect’’
value (EPj ¼Pn
i ¼ 1 Iij), denoted as coordinates (C, E) for a particularparameter. The coordinate values for each parameter can be
Fig. 6. Interaction matrix in RES, (a) two parameters interaction matrix; (b) a
Table 6Multiple linear regression coefficients and collinearity statistics for Eq. (8).
Independent variables Unstandardized coefficients Standardizedcoefficients
B Std. error Beta
Constant �30.278 48.131
B 22.229 7.130 0.790
PF �0.127 0.067 �0.404
S/B 20.109 10.927 0.602
H/B �1.130 3.410 �0.123
N 10.038 3.652 0.505
B/D �1.180 0.881 �0.437
plotted in cause and effect space, forming the so-called C–E plot.The interactive intensity value of each parameter is denoted asthe sum of the C and E values (CþE) and it can be used as anindicator of parameter’s significance in the system. The
general view of the coding of interaction matrix (modified after Ref. [43]).
95% Confidence interval for B t values Colinearity statistics
Lower bound Upper bound Tolerance VIF
�129.845 69.288 �0.629
7.480 36.977 3.118 0.278 3.603
�0.265 0.011 �1.897 0.393 2.543
�2.494 42.713 1.840 0.166 6.007
�8.184 5.924 �0.331 0.129 7.751
2.483 17.594 2.748 0.529 1.892
�3.002 0.643 �1.339 0.167 5.984
F. Faramarzi et al. / International Journal of Rock Mechanics & Mining Sciences 60 (2013) 82–9488
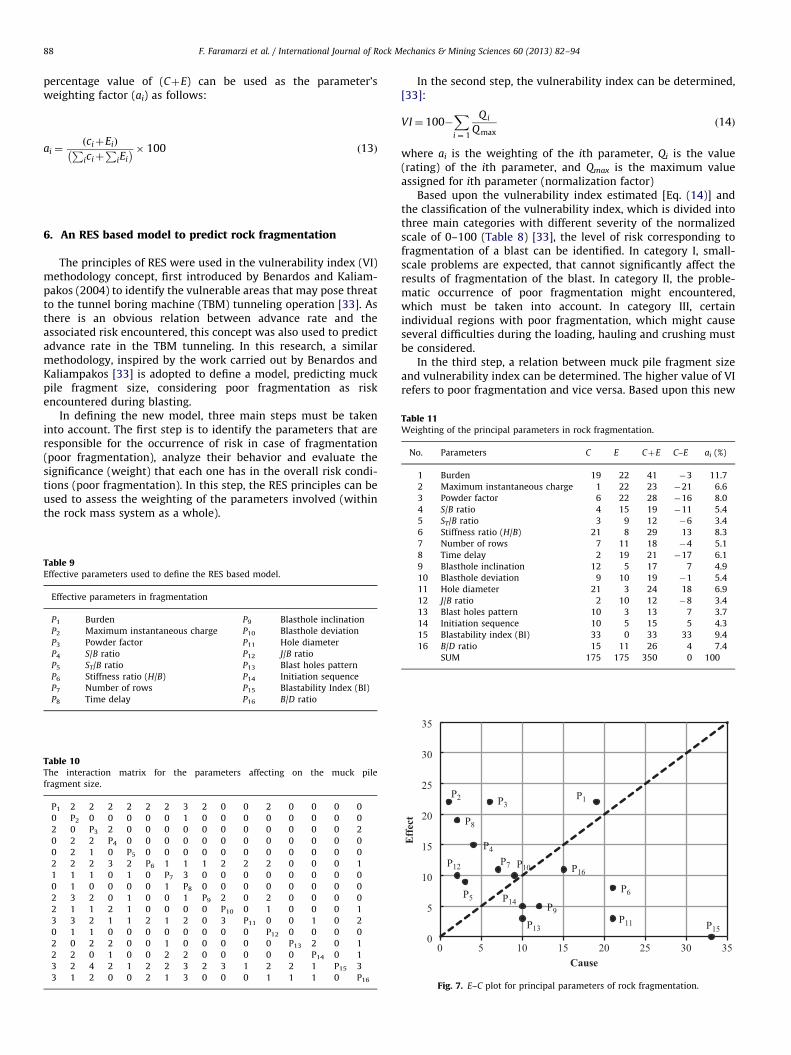
percentage value of (CþE) can be used as the parameter’sweighting factor (ai) as follows:
ai ¼ciþEið ÞP
iciþP
iEi
� �� 100 ð13Þ
Table 11Weighting of the principal parameters in rock fragmentation.
No. Parameters C E CþE C–E ai (%)
1 Burden 19 22 41 �3 11.7
2 Maximum instantaneous charge 1 22 23 �21 6.6
3 Powder factor 6 22 28 �16 8.0
4 S/B ratio 4 15 19 �11 5.4
6. An RES based model to predict rock fragmentation
The principles of RES were used in the vulnerability index (VI)methodology concept, first introduced by Benardos and Kaliam-pakos (2004) to identify the vulnerable areas that may pose threatto the tunnel boring machine (TBM) tunneling operation [33]. Asthere is an obvious relation between advance rate and theassociated risk encountered, this concept was also used to predictadvance rate in the TBM tunneling. In this research, a similarmethodology, inspired by the work carried out by Benardos andKaliampakos [33] is adopted to define a model, predicting muckpile fragment size, considering poor fragmentation as riskencountered during blasting.
In defining the new model, three main steps must be takeninto account. The first step is to identify the parameters that areresponsible for the occurrence of risk in case of fragmentation(poor fragmentation), analyze their behavior and evaluate thesignificance (weight) that each one has in the overall risk condi-tions (poor fragmentation). In this step, the RES principles can beused to assess the weighting of the parameters involved (withinthe rock mass system as a whole).
Table 9Effective parameters used to define the RES based model.
Effective parameters in fragmentation
P1 Burden P9 Blasthole inclination
P2 Maximum instantaneous charge P10 Blasthole deviation
P3 Powder factor P11 Hole diameter
P4 S/B ratio P12 J/B ratio
P5 ST/B ratio P13 Blast holes pattern
P6 Stiffness ratio (H/B) P14 Initiation sequence
P7 Number of rows P15 Blastability Index (BI)
P8 Time delay P16 B/D ratio
Table 10The interaction matrix for the parameters affecting on the muck pile
fragment size.
P1 2 2 2 2 2 2 3 2 0 0 2 0 0 0 0
0 P2 0 0 0 0 0 1 0 0 0 0 0 0 0 0
2 0 P3 2 0 0 0 0 0 0 0 0 0 0 0 2
0 2 2 P4 0 0 0 0 0 0 0 0 0 0 0 0
0 2 1 0 P5 0 0 0 0 0 0 0 0 0 0 0
2 2 2 3 2 P6 1 1 1 2 2 2 0 0 0 1
1 1 1 0 1 0 P7 3 0 0 0 0 0 0 0 0
0 1 0 0 0 0 1 P8 0 0 0 0 0 0 0 0
2 3 2 0 1 0 0 1 P9 2 0 2 0 0 0 0
2 1 1 2 1 0 0 0 0 P10 0 1 0 0 0 1
3 3 2 1 1 2 1 2 0 3 P11 0 0 1 0 2
0 1 1 0 0 0 0 0 0 0 0 P12 0 0 0 0
2 0 2 2 0 0 1 0 0 0 0 0 P13 2 0 1
2 2 0 1 0 0 2 2 0 0 0 0 0 P14 0 1
3 2 4 2 1 2 2 3 2 3 1 2 2 1 P15 3
3 1 2 0 0 2 1 3 0 0 0 1 1 1 0 P16
In the second step, the vulnerability index can be determined,[33]:
VI¼ 100�Xi ¼ 1
Qi
Qmaxð14Þ
where ai is the weighting of the ith parameter, Qi is the value(rating) of the ith parameter, and Qmax is the maximum valueassigned for ith parameter (normalization factor)
Based upon the vulnerability index estimated [Eq. (14)] andthe classification of the vulnerability index, which is divided intothree main categories with different severity of the normalizedscale of 0–100 (Table 8) [33], the level of risk corresponding tofragmentation of a blast can be identified. In category I, small-scale problems are expected, that cannot significantly affect theresults of fragmentation of the blast. In category II, the proble-matic occurrence of poor fragmentation might encountered,which must be taken into account. In category III, certainindividual regions with poor fragmentation, which might causeseveral difficulties during the loading, hauling and crushing mustbe considered.
In the third step, a relation between muck pile fragment sizeand vulnerability index can be determined. The higher value of VIrefers to poor fragmentation and vice versa. Based upon this new
5 ST/B ratio 3 9 12 �6 3.4
6 Stiffness ratio (H/B) 21 8 29 13 8.3
7 Number of rows 7 11 18 �4 5.1
8 Time delay 2 19 21 �17 6.1
9 Blasthole inclination 12 5 17 7 4.9
10 Blasthole deviation 9 10 19 �1 5.4
11 Hole diameter 21 3 24 18 6.9
12 J/B ratio 2 10 12 �8 3.4
13 Blast holes pattern 10 3 13 7 3.7
14 Initiation sequence 10 5 15 5 4.3
15 Blastability index (BI) 33 0 33 33 9.4
16 B/D ratio 15 11 26 4 7.4
SUM 175 175 350 0 100
P1P2 P3
P4
P12
P6
P7
P8
P9
P10
P11
P5
P13
P14
P15
P16
0
5
10
15
20
25
30
35
0 5 10 15 20 25 30 35
Eff
ect
Cause
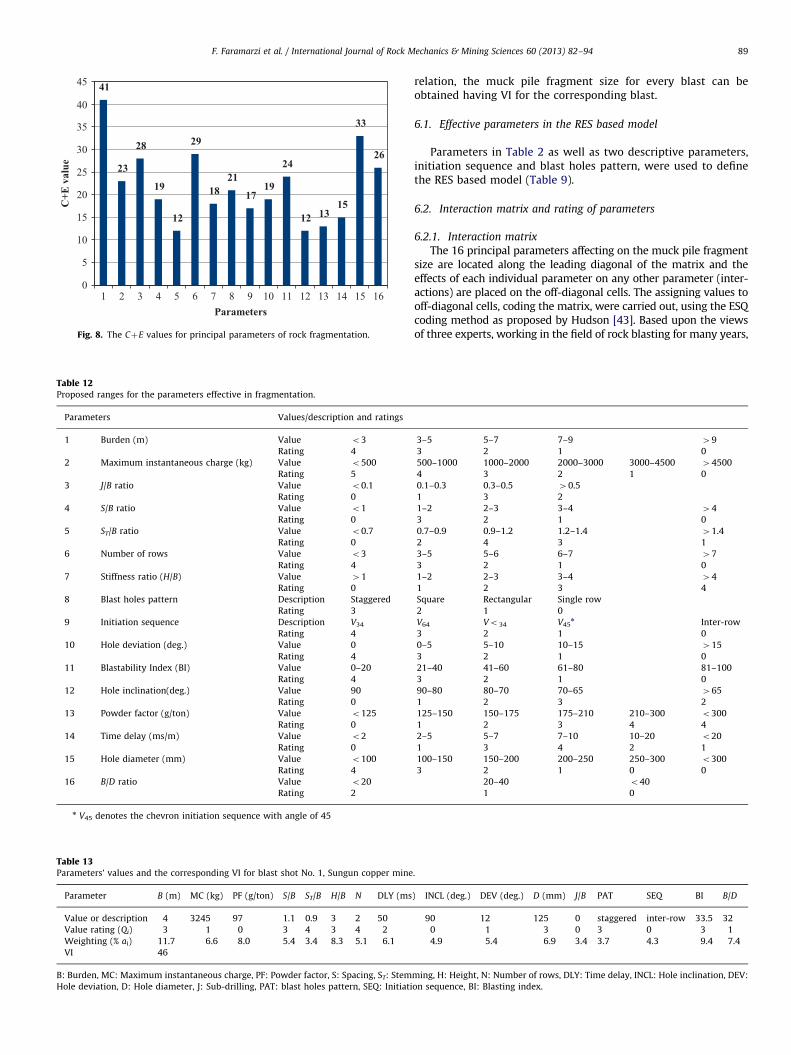
Fig. 7. E–C plot for principal parameters of rock fragmentation.
41
23
28
19
12
29
1821
1719
24
12 1315
33
26
0
5
10
15
20
25
30
35
40
45
1 2 3 4 5 6 7 8 9 10 11 12 13 14 15 16
C+E
val
ue
Parameters
Fig. 8. The CþE values for principal parameters of rock fragmentation.
Table 12Proposed ranges for the parameters effective in fragmentation.
Parameters Values/description and ratings
1 Burden (m) Value o3
Rating 4
2 Maximum instantaneous charge (kg) Value o500
Rating 5
3 J/B ratio Value o0.1
Rating 0
4 S/B ratio Value o1
Rating 0
5 ST/B ratio Value o0.7
Rating 0
6 Number of rows Value o3
Rating 4
7 Stiffness ratio (H/B) Value 41
Rating 0
8 Blast holes pattern Description Staggered
Rating 3
9 Initiation sequence Description V34
Rating 4
10 Hole deviation (deg.) Value 0
Rating 4
11 Blastability Index (BI) Value 0–20
Rating 4
12 Hole inclination(deg.) Value 90
Rating 0
13 Powder factor (g/ton) Value o125
Rating 0
14 Time delay (ms/m) Value o2
Rating 0
15 Hole diameter (mm) Value o100
Rating 4
16 B/D ratio Value o20
Rating 2
n V45 denotes the chevron initiation sequence with angle of 45
Table 13Parameters’ values and the corresponding VI for blast shot No. 1, Sungun copper mine
Parameter B (m) MC (kg) PF (g/ton) S/B ST/B H/B N DLY (ms
Value or description 4 3245 97 1.1 0.9 3 2 50
Value rating (Qi) 3 1 0 3 4 3 4 2
Weighting (% ai) 11.7 6.6 8.0 5.4 3.4 8.3 5.1 6.1
VI 46
B: Burden, MC: Maximum instantaneous charge, PF: Powder factor, S: Spacing, ST: Stem
Hole deviation, D: Hole diameter, J: Sub-drilling, PAT: blast holes pattern, SEQ: Initiati
F. Faramarzi et al. / International Journal of Rock Mechanics & Mining Sciences 60 (2013) 82–94 89
relation, the muck pile fragment size for every blast can beobtained having VI for the corresponding blast.
6.1. Effective parameters in the RES based model
Parameters in Table 2 as well as two descriptive parameters,initiation sequence and blast holes pattern, were used to definethe RES based model (Table 9).
6.2. Interaction matrix and rating of parameters
6.2.1. Interaction matrix
The 16 principal parameters affecting on the muck pile fragmentsize are located along the leading diagonal of the matrix and theeffects of each individual parameter on any other parameter (inter-actions) are placed on the off-diagonal cells. The assigning values tooff-diagonal cells, coding the matrix, were carried out, using the ESQcoding method as proposed by Hudson [43]. Based upon the viewsof three experts, working in the field of rock blasting for many years,
3–5 5–7 7–9 49
3 2 1 0
500–1000 1000–2000 2000–3000 3000–4500 44500
4 3 2 1 0
0.1–0.3 0.3–0.5 40.5
1 3 2
1–2 2–3 3–4 44
3 2 1 0
0.7–0.9 0.9–1.2 1.2–1.4 41.4
2 4 3 1
3–5 5–6 6–7 47
3 2 1 0
1–2 2–3 3–4 44
1 2 3 4
Square Rectangular Single row
2 1 0
V64 Vo34 V45n Inter-row
3 2 1 0
0–5 5–10 10–15 415
3 2 1 0
21–40 41–60 61–80 81–100
3 2 1 0
90–80 80–70 70–65 465
1 2 3 2
125–150 150–175 175–210 210–300 o300
1 2 3 4 4
2–5 5–7 7–10 10–20 o20
1 3 4 2 1
100–150 150–200 200–250 250–300 o300
3 2 1 0 0
20–40 o40
1 0
.
) INCL (deg.) DEV (deg.) D (mm) J/B PAT SEQ BI B/D
90 12 125 0 staggered inter-row 33.5 32
0 1 3 0 3 0 3 1
4.9 5.4 6.9 3.4 3.7 4.3 9.4 7.4
ming, H: Height, N: Number of rows, DLY: Time delay, INCL: Hole inclination, DEV:
on sequence, BI: Blasting index.

F. Faramarzi et al. / International Journal of Rock Mechanics & Mining Sciences 60 (2013) 82–9490
the interaction matrix for the parameters affecting on the muck pilefragment size is established as presented in Table 10.
Table 11 gives cause (C), effect (E), interactive intensity (CþE),dominance (C–E) and weight of each parameter (ai) for
4640 41 44 41 44
37 35 35 38 39 37 3543
5
0102030405060708090
100
1 2 3 4 5 6 7 8 9 10 11 12 13 14 1
VI
Bla
Fig. 9. VI for 30 blasts, S
0
10
20
30
40
50
60
70
80
90
100
1 2 3 4 5 6 7 8 9 10 11 12 13 14 15 16
VI
Blast N
VI X80
Fig. 10. Agreement between the measured X80 an
0
20
40
60
80
100
120
0 10 20 30 40 5
X80
, mea
sure
d (c
m)
V
Fig. 11. X80-VI pred
fragmentation purposes. As it can be seen in Table 11, burdenhas the highest weight in the system, and highly controls otherelements. The E–C histogram and CþE for each parameter areillustrated in Figs. 7 and 8, respectively. The points below the C¼E
1
3743 45 48
41
5853
4742 46 43 39
52
3645
5 16 17 18 19 20 21 22 23 24 25 26 27 28 29 30st NO.
ungun copper mine.
0102030405060708090100110120
17 18 19 20 21 22 23 24 25 26 27 28 29 30
Mea
sure
d X
80(c
m)
O.
d VI for different blasts, Sungun copper mine.
R2 = 0.55
0 60 70 80 90 100I
ictive model.

F. Faramarzi et al. / International Journal of Rock Mechanics & Mining Sciences 60 (2013) 82–94 91
line are called dominant and the points above the C¼E line arecalled subordinate.
y = 1.744 x-40.43 R2 = 0.65
100
120
140
cm)
6.2.2. Rating of parameters
The rating of the parameter’s values was carried out basedupon their effect on the muck pile fragment size. Totally sixclasses of rating, from 0 to 5 were considered, where 0 denotesthe worst case (most unfavorable condition (poor fragmentation))and 5 the best (most favorable condition (good fragmentation)) Inthe case of rock fragmentation, the rating of each parameter ispresented in Table 12. The ranges of parameters in Table 12 wereproposed based on the judgments of three experienced experts inthe field of rock blasting and also the results obtained by otherresearchers [37–41].
0
20
40
60
80
0 20 40 60 80 100 120M
easu
re X
80(
Predicted X80(cm)
Fig. 12. The measured and predicted X80, RES based model.
y = 3.527 x - 61.60R2 = 0.46
100
120
140
)
6.2.3. Risk analysis and fragmentation prediction
The data related to 30 production blasts (out of 39 blasts),carried out at Sungun copper mine, were applied to determine theassociated VI for each blast, using Eq. (14). For all blasts, theinitiation sequence was inter-row. To make the methodologymore understandable, an example of determining VI for blastno. 1 is shown in Table 13. Variations in the VI for the 30 blastsare shown in Fig. 9. As it can be seen, VI varies from 35 to 58,showing that the level of risk is in the second category (Medium–High). Also, there is a good agreement between VI and X80 foreach blast, as shown in Fig. 10.
Variation in X80 with VI for 30 blasts (Fig. 10) suggests a goodcorrelation between X80 and VI. Based on the calculated VI andmeasured X80 for 30 blasts, a linear regression analysis wascarried out (Fig. 11) and Eq. (15) with coefficient of determination(R2) of 0.55 was obtained. This relation can be used as a predictivemodel to predict X80 based on VI.
X80ðcmÞ ¼ 2:568ðVIÞ�58:44 ð15Þ
0
20
40
60
80
0 10 20 30 40 50 60 70 80
Mea
sure
X80
(cm
Predicted X80(cm)
Fig. 13. Comparison between the measured and predicted X80, Kuz–Ram model.
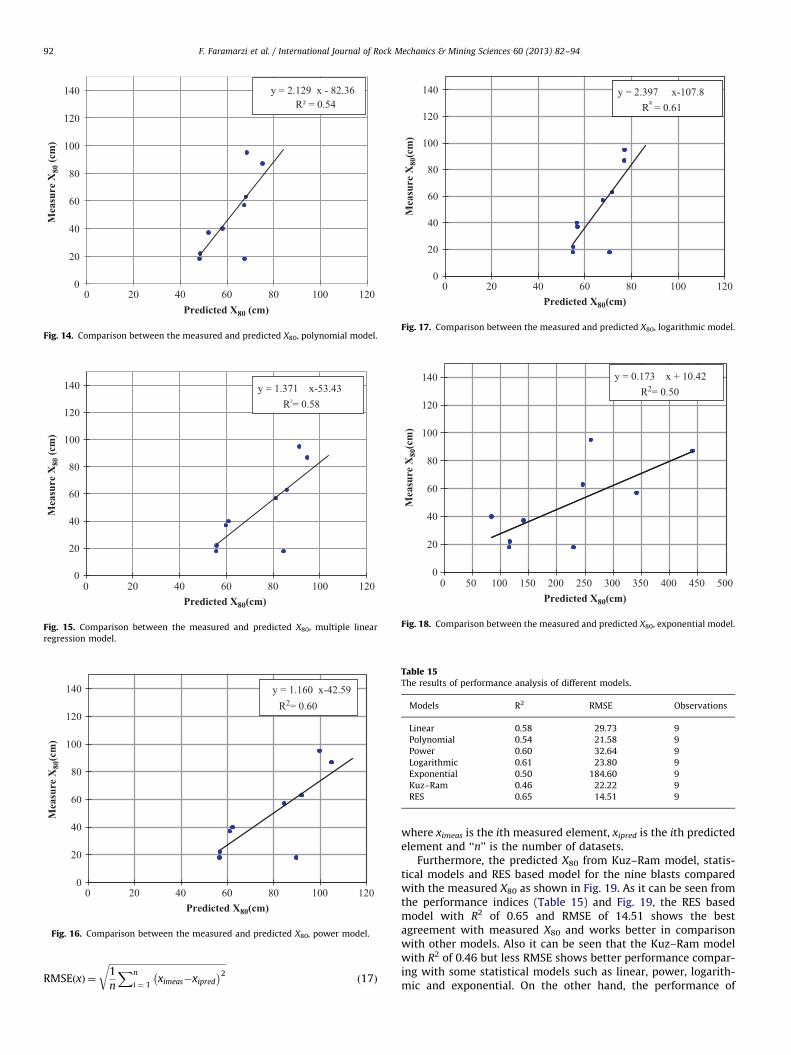
7. Evaluation of models performance
To evaluate the performance of the newly proposed model(RES model), Kuz–Ram and statistical models, nine blasts (out of39 blasts) carried out at Sungun copper mine were used and theresults obtained are shown in Table 14. Also for nine blasts, acomparison was made between the predicted X80 and the mea-sured X80 for different models as shown in Figs. 12–18.
Two indices, coefficient of determination (R2) and root meansquare error (RMSE) [Eqs. (16) and (17)] were used to carry outthe performance analysis of the models and the results obtained
Table 14X80 predicted by various models for nine blasts, Sungun copper mine.
Blast no. VI Measured X80 (cm) Predicted X80 (cm)
RES Kuz–Ram
31 46 95 61 36
32 35 22 33 25
33 37 18 37 23
34 38 37 38 27
35 43 40 52 29
36 44 57 55 31
37 51 63 71 39
38 48 87 65 36
39 41 18 47 35
are illustrated in Table 15.
R2¼ 100
Pni ¼ 1 xipred�xipred
� �ximeas�ximeasð ÞÞ
2ffiffiffiffiffiffiffiffiffiffiffiffiffiffiffiffiffiffiffiffiffiffiffiffiffiffiffiffiffiffiffiffiffiffiffiffiffiffiffiffiffiffiffiffiffiffiffiffiffiffiffiffiffiffiffiffiffiffiffiffiffiffiffiffiffiffiffiffiffiffiffiffiffiffiffiffiffiffiffiffiffiffiffiffiffiffiffiffiffiffiffiPni ¼ 1 xipred�xipred
� �2Pni ¼ 1 ximeas�ximeasð Þ
2q
0B@
375
264 ð16Þ
Logarithmic Linear Power Polynomial Exponential
77 91 100 68 260
55 56 57 48 117
55 56 57 48 116
57 60 61 52 141
57 61 62 58 84
68 81 84 67 341
72 86 92 68 246
77 95 105 75 441
71 84 90 68 230
y = 1.371 x-53.43 R²= 0.58
0
20
40
60
80
100
120
140
0 20 40 60 80 100 120
Mea
sure
X80
(cm
)
Predicted X80(cm)
Fig. 15. Comparison between the measured and predicted X80, multiple linear
regression model.
y = 1.160 x-42.59 R2= 0.60
0
20
40
60
80
100
120
140
0 20 40 60 80 100 120
Mea
sure
X80
(cm
)
Predicted X80(cm)
Fig. 16. Comparison between the measured and predicted X80, power model.
y = 2.397 x-107.8 R² = 0.61
0
20
40
60
80
100
120
140
0 20 40 60 80 100 120
Mea
sure
X80
(cm
)
Predicted X80(cm)
Fig. 17. Comparison between the measured and predicted X80, logarithmic model.
Table 15The results of performance analysis of different models.
Models R2 RMSE Observations
Linear 0.58 29.73 9
Polynomial 0.54 21.58 9
Power 0.60 32.64 9
Logarithmic 0.61 23.80 9
Exponential 0.50 184.60 9
Kuz–Ram 0.46 22.22 9
RES 0.65 14.51 9
y = 0.173 x + 10.42R2= 0.50
0
20
40
60
80
100
120
140
0 50 100 150 200 250 300 350 400 450 500
Mea
sure
X80
(cm
)
Predicted X80(cm)
Fig. 18. Comparison between the measured and predicted X80, exponential model.
y = 2.129 x - 82.36 R² = 0.54
0
20
40
60
80
100
120
140
0 20 40 60 80 100 120
Mea
sure
X80
(cm
)
Predicted X80 (cm)
Fig. 14. Comparison between the measured and predicted X80, polynomial model.
F. Faramarzi et al. / International Journal of Rock Mechanics & Mining Sciences 60 (2013) 82–9492
RMSE xð Þ ¼
ffiffiffiffiffiffiffiffiffiffiffiffiffiffiffiffiffiffiffiffiffiffiffiffiffiffiffiffiffiffiffiffiffiffiffiffiffiffiffiffiffiffiffiffiffiffiffiffiffiffiffi1
n
Xn
i ¼ 1ximeas�xipred
� �2
rð17Þ
where ximeas is the ith measured element, xipred is the ith predictedelement and ‘‘n’’ is the number of datasets.
Furthermore, the predicted X80 from Kuz–Ram model, statis-tical models and RES based model for the nine blasts comparedwith the measured X80 as shown in Fig. 19. As it can be seen fromthe performance indices (Table 15) and Fig. 19, the RES basedmodel with R2 of 0.65 and RMSE of 14.51 shows the bestagreement with measured X80 and works better in comparisonwith other models. Also it can be seen that the Kuz–Ram modelwith R2 of 0.46 but less RMSE shows better performance compar-ing with some statistical models such as linear, power, logarith-mic and exponential. On the other hand, the performance of
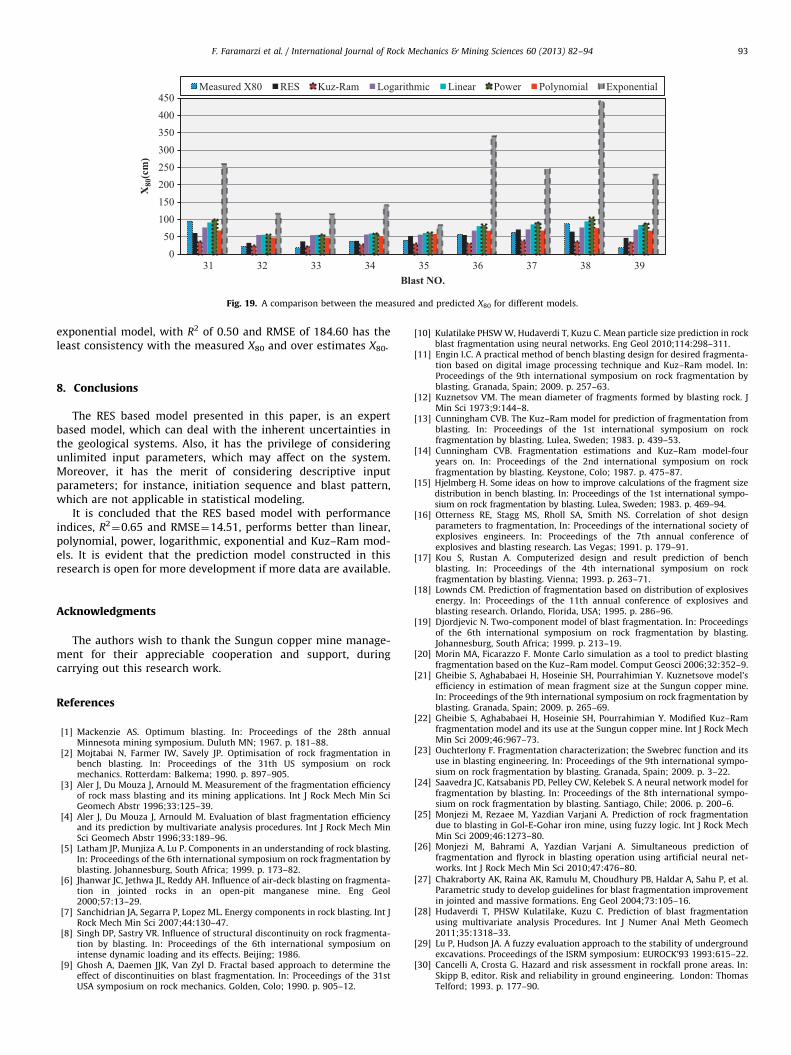
050
100150200250300350400450
31 32 33 34 35 36 37 38 39
X80
(cm
)
Blast NO.
Measured X80 RES Kuz-Ram Logarithmic Linear Power Polynomial Exponential
Fig. 19. A comparison between the measured and predicted X80 for different models.
F. Faramarzi et al. / International Journal of Rock Mechanics & Mining Sciences 60 (2013) 82–94 93
exponential model, with R2 of 0.50 and RMSE of 184.60 has theleast consistency with the measured X80 and over estimates X80.
8. Conclusions
The RES based model presented in this paper, is an expertbased model, which can deal with the inherent uncertainties inthe geological systems. Also, it has the privilege of consideringunlimited input parameters, which may affect on the system.Moreover, it has the merit of considering descriptive inputparameters; for instance, initiation sequence and blast pattern,which are not applicable in statistical modeling.
It is concluded that the RES based model with performanceindices, R2
¼0.65 and RMSE¼14.51, performs better than linear,polynomial, power, logarithmic, exponential and Kuz–Ram mod-els. It is evident that the prediction model constructed in thisresearch is open for more development if more data are available.
Acknowledgments
The authors wish to thank the Sungun copper mine manage-ment for their appreciable cooperation and support, duringcarrying out this research work.
References
[1] Mackenzie AS. Optimum blasting. In: Proceedings of the 28th annualMinnesota mining symposium. Duluth MN; 1967. p. 181–88.
[2] Mojtabai N, Farmer IW, Savely JP. Optimisation of rock fragmentation inbench blasting. In: Proceedings of the 31th US symposium on rockmechanics. Rotterdam: Balkema; 1990. p. 897–905.
[3] Aler J, Du Mouza J, Arnould M. Measurement of the fragmentation efficiencyof rock mass blasting and its mining applications. Int J Rock Mech Min SciGeomech Abstr 1996;33:125–39.
[4] Aler J, Du Mouza J, Arnould M. Evaluation of blast fragmentation efficiencyand its prediction by multivariate analysis procedures. Int J Rock Mech MinSci Geomech Abstr 1996;33:189–96.
[5] Latham JP, Munjiza A, Lu P. Components in an understanding of rock blasting.In: Proceedings of the 6th international symposium on rock fragmentation byblasting. Johannesburg, South Africa; 1999. p. 173–82.
[6] Jhanwar JC, Jethwa JL, Reddy AH. Influence of air-deck blasting on fragmenta-tion in jointed rocks in an open-pit manganese mine. Eng Geol2000;57:13–29.
[7] Sanchidrian JA, Segarra P, Lopez ML. Energy components in rock blasting. Int JRock Mech Min Sci 2007;44:130–47.
[8] Singh DP, Sastry VR. Influence of structural discontinuity on rock fragmenta-tion by blasting. In: Proceedings of the 6th international symposium onintense dynamic loading and its effects. Beijing; 1986.
[9] Ghosh A, Daemen JJK, Van Zyl D. Fractal based approach to determine theeffect of discontinuities on blast fragmentation. In: Proceedings of the 31stUSA symposium on rock mechanics. Golden, Colo; 1990. p. 905–12.
[10] Kulatilake PHSW W, Hudaverdi T, Kuzu C. Mean particle size prediction in rockblast fragmentation using neural networks. Eng Geol 2010;114:298–311.
[11] Engin I.C. A practical method of bench blasting design for desired fragmenta-tion based on digital image processing technique and Kuz–Ram model. In:Proceedings of the 9th international symposium on rock fragmentation byblasting. Granada, Spain; 2009. p. 257–63.
[12] Kuznetsov VM. The mean diameter of fragments formed by blasting rock. JMin Sci 1973;9:144–8.
[13] Cunningham CVB. The Kuz–Ram model for prediction of fragmentation fromblasting. In: Proceedings of the 1st international symposium on rockfragmentation by blasting. Lulea, Sweden; 1983. p. 439–53.
[14] Cunningham CVB. Fragmentation estimations and Kuz–Ram model-fouryears on. In: Proceedings of the 2nd international symposium on rockfragmentation by blasting. Keystone, Colo; 1987. p. 475–87.
[15] Hjelmberg H. Some ideas on how to improve calculations of the fragment sizedistribution in bench blasting. In: Proceedings of the 1st international sympo-sium on rock fragmentation by blasting. Lulea, Sweden; 1983. p. 469–94.
[16] Otterness RE, Stagg MS, Rholl SA, Smith NS. Correlation of shot designparameters to fragmentation, In: Proceedings of the international society ofexplosives engineers. In: Proceedings of the 7th annual conference ofexplosives and blasting research. Las Vegas; 1991. p. 179–91.
[17] Kou S, Rustan A. Computerized design and result prediction of benchblasting. In: Proceedings of the 4th international symposium on rockfragmentation by blasting. Vienna; 1993. p. 263–71.
[18] Lownds CM. Prediction of fragmentation based on distribution of explosivesenergy. In: Proceedings of the 11th annual conference of explosives andblasting research. Orlando, Florida, USA; 1995. p. 286–96.
[19] Djordjevic N. Two-component model of blast fragmentation. In: Proceedingsof the 6th international symposium on rock fragmentation by blasting.Johannesburg, South Africa; 1999. p. 213–19.
[20] Morin MA, Ficarazzo F. Monte Carlo simulation as a tool to predict blastingfragmentation based on the Kuz–Ram model. Comput Geosci 2006;32:352–9.
[21] Gheibie S, Aghababaei H, Hoseinie SH, Pourrahimian Y. Kuznetsove model’sefficiency in estimation of mean fragment size at the Sungun copper mine.In: Proceedings of the 9th international symposium on rock fragmentation byblasting. Granada, Spain; 2009. p. 265–69.
[22] Gheibie S, Aghababaei H, Hoseinie SH, Pourrahimian Y. Modified Kuz–Ramfragmentation model and its use at the Sungun copper mine. Int J Rock MechMin Sci 2009;46:967–73.
[23] Ouchterlony F. Fragmentation characterization; the Swebrec function and itsuse in blasting engineering. In: Proceedings of the 9th international sympo-sium on rock fragmentation by blasting. Granada, Spain; 2009. p. 3–22.
[24] Saavedra JC, Katsabanis PD, Pelley CW, Kelebek S. A neural network model forfragmentation by blasting. In: Proceedings of the 8th international sympo-sium on rock fragmentation by blasting. Santiago, Chile; 2006. p. 200–6.
[25] Monjezi M, Rezaee M, Yazdian Varjani A. Prediction of rock fragmentationdue to blasting in Gol-E-Gohar iron mine, using fuzzy logic. Int J Rock MechMin Sci 2009;46:1273–80.
[26] Monjezi M, Bahrami A, Yazdian Varjani A. Simultaneous prediction offragmentation and flyrock in blasting operation using artificial neural net-works. Int J Rock Mech Min Sci 2010;47:476–80.
[27] Chakraborty AK, Raina AK, Ramulu M, Choudhury PB, Haldar A, Sahu P, et al.Parametric study to develop guidelines for blast fragmentation improvementin jointed and massive formations. Eng Geol 2004;73:105–16.
[28] Hudaverdi T, PHSW Kulatilake, Kuzu C. Prediction of blast fragmentationusing multivariate analysis Procedures. Int J Numer Anal Meth Geomech2011;35:1318–33.
[29] Lu P, Hudson JA. A fuzzy evaluation approach to the stability of undergroundexcavations. Proceedings of the ISRM symposium: EUROCK’93 1993:615–22.
[30] Cancelli A, Crosta G. Hazard and risk assessment in rockfall prone areas. In:Skipp B, editor. Risk and reliability in ground engineering. London: ThomasTelford; 1993. p. 177–90.

F. Faramarzi et al. / International Journal of Rock Mechanics & Mining Sciences 60 (2013) 82–9494
[31] Mazzoccola DF, Hudson JA. A comprehensive method of rock mass char-acterization for indicating natural slope instability. Q J Eng Geol 1996;29:37–56.
[32] Latham JP, Lu P. Development of an assessment system for the blastability ofrock masses. Int J Rock Mech Min Sci 1999;36:41–55.
[33] Benardos AG, Kaliampakos DC. A methodology for assessing geotechnicalhazards for TBM tunneling-illustrated by the Athens Metro, Greece. Int J RockMech Min Sci 2004;41:987–99.
[34] Shin HS, Kwon YC, Jung YS, Bae GJ, Kim YG. Methodology for quantitativehazard assessment for tunnel collapses based on case histories in Korea. Int JRock Mech Min Sci 2009;46:1072–87.
[35] SRK Consulting Engineers and Scientists. Sungun copper project, mining geotech-nics and slope design studies. Final report. Sungun copper company; 2008.
[36] Lilly PA. An empirical method of assessing rock mass blastability. In:Proceedings of the large open-pit conference, IMM. Australia; 1986. p. 89–92.
[37] Langefors U, Kihlstrom B. The modern technique of rock blasting. New York:Wiley; 1978.
[38] Konya CJ, Walter EJ. Rock blasting and overbreak control. FHWA Report-FHWA-HI-92-101; 1991.
[39] Jimeno CL, Jimeno EL, Carcedo FJA. Drilling and blasting of rocks. Rotterdam:Balkema; 1995.
[40] Bhandari S. Engineering rock blasting operations. Rotterdam: Balkema; 1997.[41] Hustrulid W. Blasting principles for open-pit mining. Rotterdam: Balkema; 1999.[42] Montgomery DC, Peck EA. Introduction to linear regression analysis. New
York: Wiley; 1992.[43] Hudson JA. Rock engineering systems: theory and practice. Chichester: Ellis
Horwood; 1992.[44] Lu P, Latham JP. A continuous quantitative coding approach to the interaction
matrix in rock engineering systems based on grey systems approaches. In:Proceedings of the 7th international congress of IAEG. 1994; p. 4761–70.