a proposal of measures towards a qualitative enhancement
TRANSCRIPT

50 Scientific Journal of Maritime Research 32 (2018) 50-58 © Faculty of Maritime Studies Rijeka, 2018
Multidisciplinary SCIENTIFIC JOURNAL OF
MARITIME RESEARCH
Multidisciplinarni znanstveni časopis
POMORSTVO
A Proposal of Measures Towards a Qualitative Enhancement of Bus Transport Services in the Primorsko-goranska County Siniša Vilke, Tomislav Krljan, Borna DebelićUniversity of Rijeka, Faculty of Maritime Studies, Studentska 2, 51000 Rijeka, Croatia, e-mail: [email protected]
ARTICLE INFO
Preliminary communicationReceived 2 May 2018Accepted 21 May 2018
Key words:Passenger flows Bus transport Bus stations/terminals Transport service quality
ABSTRACT
The survey, which consisted of counting, polling and recording, has provided data on the existing volume of passenger flows in public bus stations/terminals within the Primorsko-goranska (Littoral-Mountainous) County (hereinafter: the PG County), the density rate of passengers on bus lines that operate on County connections and on bus lines connecting the PG County with other counties in Croatia. In addition to the quantitative parameters, the qualitative data were analyzed that had been obtained by polling passengers at the Rijeka bus terminal, whereupon detailed opinions of direct users of the service were elaborated with the aim of obtaining a picture of the current situation of the public bus transport in the PG County. The data collected were used in evaluating the quality of the passenger transport service provided and in determining measures to be taken in order to bring both the actual quality of transport and the satisfaction of passengers to a higher level.
1 Introduction
Observation and analysis of passenger flows directly in-dicate the quality and distribution of the transport network and connectivity of every single region. With the intensive development of technology and the emergence of “modern society,” an increasing number of new needs of the popula-tion are manifested at ever greater geographical distances. Travel needs are becoming increasingly popular as much in terms of travel and tourism as in the context of business and various needs of the population. The development of activities which have been forced, due to the overcrowding of city centres, to relocate and concentrate in areas far more distant from cities and/or from their homes, has caused much of commuting that has resulted in increased demand for transport. The commuter traffic between urban areas within the PG County, as one of the counties that make part of the Northern Adriatic Functional Region, results from the demand for regular liner bus services.
The aim of this paper is to evaluate the existing quality level of the service by analyzing the quantitative and quali-tative parameters obtained from the polled bus line com-muters and passengers in the PG County and to suggest
the measures that need to be taken to bring the quality of transport and passenger satisfaction to a higher level.
2 Road Connections Between the Republic of Croatia and the PG County
The Republic of Croatia is situated in a particularly fa-vourable geographical area of Central Europe. It is its po-sition that has caused its connections with other states of Western, Central and South-Eastern Europe. Good link-age and construction of the necessary infrastructure and superstructure results in the development of the overall economic and social development of the country. Traffic connections with other parts of Europe are of great impor-tance for the Republic of Croatia. One significant element in the integration of the Republic of Croatia with other coun-tries of the European continent is the Mediterranean trans-port corridor linking the eastern and western European territories. The linkage of the Republic of Croatia is sig-nificantly enabled by Corridor V as an integral part of the Mediterranean Corridor. Traffic connections are realized through two branches of Corridor V passing across the ter-ritory of the Republic of Croatia, i.e. branches Vb and Vc.

51S. Vilke et al. / Scientific Journal of Maritime Research 32 (2018) 50-58
The division of the Republic of Croatia into regions is significant in the analysis of their impacts. Functional re-gions are characterized by a high level traffic interaction [8]. It is important to note that functional regions do not necessarily coincide with the administrative regions or state borders. The Republic of Croatia is divided into the following functional regions:• Eastern Croatia,• Central Croatia,• Northern Adriatic,• Northern Damatia• Central Dalmatia,• Southern Dalmatia.
The Northern Adriatic functional region is a significant region in the Republic of Croatia with regard to move-ments of goods and passengers within and between func-tional regions.
2.1 The Northern Adriatic Functional Region
The geographical position of the Northern Adriatic functional region is one of its main advantages compared to other regions of the Republic of Croatia. This functional region encompasses three areas: [8]• the Istra County with the city of Pula; the area of Istria
(Istra) is specific due to its historical development and a great influence of the proximity of Western Europe, that has greatly contributed to the development of the travel and tourism industry and tourist destinations in the area;
• the PG County with the port of Rijeka; the port of Rijeka is the largest port in the Republic of Croatia and the most important commercial and industrial centre. There are
Figure 1 Functional regions within the territory of the Republic of Croatia
Source: Adapted by authors according to: The Transport Development Strategy of the Republic of Croatia (2017 – 2030), Ministry of the Sea, Transport and Infrastructure, Zagreb, August 2017, p. 35.
Figure 2 Cartographic display of significant and busiest roads in the PG County
Source: Adapted by authors according to http://www.zuc.hr/index_htm_files/index_htm_files/KARTA_4.jpg (15 April 2018)
four large islands comprised within the Kvarner Bay that are important for the development of the travel and tour-ism industry: Krk, Cres, Rab and Mali Losinj.
• the Lika-Senj County covers a large part of the hilly area situated far from the sea, which is of lesser economic importance.

52 S. Vilke et al. / Scientific Journal of Maritime Research 32 (2018) 50-58
2.2 Road Connections of the PG County with Other Regions of the Republic of Croatia
The most congested roads in the PG County are mo-torways A6 and A7, and motorways A8 and A9 in the area of Istria. State road D8, which used to be the main artery along the Croatian coast before the construction of the motorway, is also important for the region. The Rijeka road hub comprises the Rijeka ring-road from Matulji to Krizisce with all the pertaining nodes and connections to the port area and to the free and industrial zones. The two most important road junctions in the area of the node are: motorway A6 Bosiljevo – Rijeka and the Adriatic motor-way A7 Rupa – Rijeka – Zuta Lokva. The Zagreb-Rijeka rail-way line is part of the international corridor and the most important one in the region. These roads are of particular importance by their flows of passengers coming from dif-ferent parts of the Republic of Croatia and other countries.
In the railway transport, the backbone of the Rijeka node is made of railway lines of importance for the inter-national traffic on the branch of the Pan European corri-dor Vb from the state border with Hungary and further in the direction of Botovo – Koprivnica – Zagreb – Rijeka – Sapjane. This railway line is important in connecting cen-tral Croatia, the mountainous region of Gorski Kotar and the northern littoral area.
In the air traffic, the dominant role concerns the Rijeka airport, while the airports of Mali Losinj, Unije and Grobnik are of local importance only. [7]
3 Analysis of Passenger Flows and of Nodes Within the Public Liner Transport of Passengers in the PG County
Passenger flows can be viewed from different points, among which it is important to mention the flows of pas-sengers in dependence on the spatial (territorial) scope of travel, mode of transport, distribution of time, structure of passengers and many other factors. The internal road transport of passengers in the Republic of Croatia is cat-egorized into several groups: [6]• Public liner transport• Special liner transport• Shuttle transport• Occasional transport of passengers• Auto taxi transport.
Like any other system, the passenger transport system consists of several elements that are mutually connected in horizontal and vertical directions, thus being enabled to achieve undisturbed achievement of the intended purpose and therefore, in considering the public liner passenger transport system, there are three essential elements to be identified: transport service users, transport service pro-viders, and passenger terminals. Their mutual interaction and synchronized performance of each of the elements are essential for the normal operation and unhindered flow. The analysis of the public liner transport, the flow of passengers and the observation of their habits represent
an important process in evaluating the transport links of individual functional regions. The survey of the liner pas-senger transport has been performed in the area of the PG County considered as their starting, destination, and tran-sit point respectively. Movements of passengers within and outside the County was provided by the County and inter-County public buses.
3.1 Data Collection Process
The data on the movement of passengers and their habits were obtained on the basis of the conducted re-search that consisted of counting, polling and recording of any data relevant for the analysis of passenger flows. The survey was conducted in the period January – March 2018 on specific midweek days (Tuesday, Wednesday and Thursday). It was the selected days that contributed to the presentation of the current state of passenger flows and congestion of bus stations in the PG County.
The data collection process was carried out in the Northern Adriatic functional region and the whole analy-sis is based on the data collected in the PG County which is one of the most important counties that make up the functional region. There were 9 nodes and/or bus stations selected for the analysis: Vrbovsko, Delnice, Rijeka, Novi Vinodolski, Opatija, Krk, Cres, Mali Losinj, Rab. The data recorded at each station referred to the lines having their starting, destination or transit points at these stations re-spectively. At each of the stations/terminals, the respective bus lines callings were monitored over a period of three midweek days (Tuesdays, Wednesdays and Thursdays) in order for the data obtained to be as representative as possible, i.e. to provide a real picture of the number of bus lines, road loads and the volume of passengers on each of the lines. The survey results show that there are 411 pub-lic buses in the area of the PG County providing services to 7389 passengers altogether.
Table 1 Bus terminals and the number of bus lines per each terminal in the area of the PG County
Bus terminal Number of bus linesRijeka 173Vrbovsko 11Delnice 28Novi Vinodolski 60Opatija 32Krk 15Cres 15Mali Lošinj 20Rab 57Σ 411
Source: Prepared and adapted by authors according to collected statistics.
The data in Table 1 indicate that the Rijeka bus termi-nal compared to other bus stations significantly stands out by the number of 173 lines in total, which make a
53S. Vilke et al. / Scientific Journal of Maritime Research 32 (2018) 50-58
42 % share in the total of the County and inter-county lines within the analyzed area. The remaining data on the number of lines refer to smaller-scale bus stations that are yet particularly important in connecting urban areas with-in the PG County.
3.2 Analysis of Public Passenger Lines in the City of Rijeka
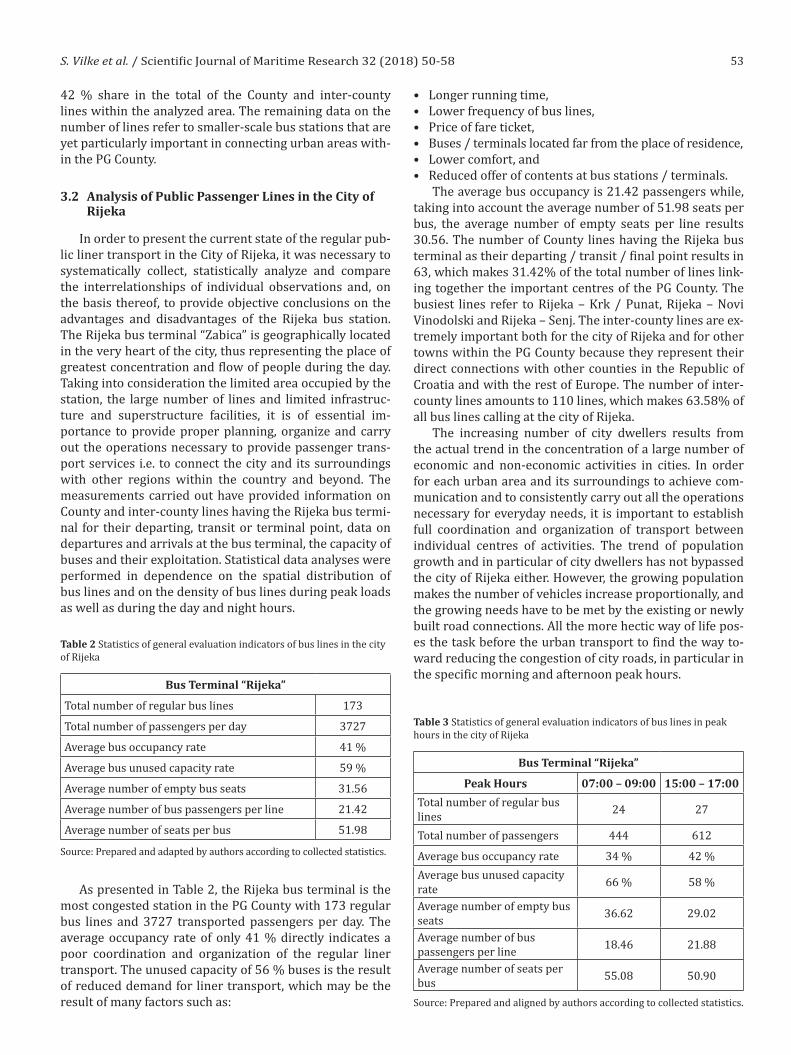
In order to present the current state of the regular pub-lic liner transport in the City of Rijeka, it was necessary to systematically collect, statistically analyze and compare the interrelationships of individual observations and, on the basis thereof, to provide objective conclusions on the advantages and disadvantages of the Rijeka bus station. The Rijeka bus terminal “Zabica” is geographically located in the very heart of the city, thus representing the place of greatest concentration and flow of people during the day. Taking into consideration the limited area occupied by the station, the large number of lines and limited infrastruc-ture and superstructure facilities, it is of essential im-portance to provide proper planning, organize and carry out the operations necessary to provide passenger trans-port services i.e. to connect the city and its surroundings with other regions within the country and beyond. The measurements carried out have provided information on County and inter-county lines having the Rijeka bus termi-nal for their departing, transit or terminal point, data on departures and arrivals at the bus terminal, the capacity of buses and their exploitation. Statistical data analyses were performed in dependence on the spatial distribution of bus lines and on the density of bus lines during peak loads as well as during the day and night hours.
Table 2 Statistics of general evaluation indicators of bus lines in the city of Rijeka
Bus Terminal “Rijeka”
Total number of regular bus lines 173
Total number of passengers per day 3727
Average bus occupancy rate 41 %
Average bus unused capacity rate 59 %
Average number of empty bus seats 31.56
Average number of bus passengers per line 21.42
Average number of seats per bus 51.98
Source: Prepared and adapted by authors according to collected statistics.
As presented in Table 2, the Rijeka bus terminal is the most congested station in the PG County with 173 regular bus lines and 3727 transported passengers per day. The average occupancy rate of only 41 % directly indicates a poor coordination and organization of the regular liner transport. The unused capacity of 56 % buses is the result of reduced demand for liner transport, which may be the result of many factors such as:
• Longer running time,• Lower frequency of bus lines,• Price of fare ticket,• Buses / terminals located far from the place of residence,• Lower comfort, and• Reduced offer of contents at bus stations / terminals.
The average bus occupancy is 21.42 passengers while, taking into account the average number of 51.98 seats per bus, the average number of empty seats per line results 30.56. The number of County lines having the Rijeka bus terminal as their departing / transit / final point results in 63, which makes 31.42% of the total number of lines link-ing together the important centres of the PG County. The busiest lines refer to Rijeka – Krk / Punat, Rijeka – Novi Vinodolski and Rijeka – Senj. The inter-county lines are ex-tremely important both for the city of Rijeka and for other towns within the PG County because they represent their direct connections with other counties in the Republic of Croatia and with the rest of Europe. The number of inter-county lines amounts to 110 lines, which makes 63.58% of all bus lines calling at the city of Rijeka.
The increasing number of city dwellers results from the actual trend in the concentration of a large number of economic and non-economic activities in cities. In order for each urban area and its surroundings to achieve com-munication and to consistently carry out all the operations necessary for everyday needs, it is important to establish full coordination and organization of transport between individual centres of activities. The trend of population growth and in particular of city dwellers has not bypassed the city of Rijeka either. However, the growing population makes the number of vehicles increase proportionally, and the growing needs have to be met by the existing or newly built road connections. All the more hectic way of life pos-es the task before the urban transport to find the way to-ward reducing the congestion of city roads, in particular in the specific morning and afternoon peak hours.
Table 3 Statistics of general evaluation indicators of bus lines in peak hours in the city of Rijeka
Bus Terminal “Rijeka”
Peak Hours 07:00 – 09:00 15:00 – 17:00
Total number of regular bus lines 24 27
Total number of passengers 444 612
Average bus occupancy rate 34 % 42 %Average bus unused capacity rate 66 % 58 %
Average number of empty bus seats 36.62 29.02
Average number of bus passengers per line 18.46 21.88
Average number of seats per bus 55.08 50.90
Source: Prepared and aligned by authors according to collected statistics.

54 S. Vilke et al. / Scientific Journal of Maritime Research 32 (2018) 50-58
According to the data in Table 3, bus lines and their parameters were analysed that are relevant for the spe-cific time of departure and arrival at the Rijeka bus sta-tion. Since the peak congestion hours are extremely liable to changes, it is important to take into consideration the earliest and latest observation time of the occurrence. The peak hours typically occur in certain hours of the day.
The number of bus lines that add load to already over-loaded road connections during the afternoon peak hours exceeds only by 12.5 % the number of bus lines that run during the morning road congestion hours. The number of passengers carried during peak hours compared with the total number of passengers carried as indicated in Table 2, results in the following conclusions: the total number of passengers transported by buses operating during morn-ing congestions makes only 12 % of the total number of passengers carried during the day, while the number of passengers in the afternoon peak hours makes 16 % of the total number of passengers carried per day. The av-erage bus occupancy in peak hours compared to the one in the afternoon is by 8 % lower and by analogy the aver-age number of passengers in the morning is smaller than the number of passengers travelling during the afternoon peak hours.
It can be concluded based on the observed parameters that there are no significant deviations in the number of bus lines, the number of passengers and the bus occu-pancy coefficient during the morning and afternoon peak loads. However, since quantitative data do not show the high loads of roads caused by buses, it is important to consider the location of the bus station/terminal and its layout within the small area. The biggest problem that pre-vents unhindered traffic flow is seen in the simultaneous arrival of more buses at the station, which causes, due to the limited bus manoeuvring space, interruption of nor-mal traffic flow on the main and most heavily loaded roads in the city of Rijeka. The problem is additionally aggravat-ed by prohibited stops of private vehicles and taxi services on platforms intended for buses. The interruption of the regular traffic flow is particularly pronounced during the specific daytime peak hours.
The daily distribution of bus lines was analyzed in a way that bus lines were classified to those providing the day service and those providing the night service. Table 4 clearly shows that the average number of passengers car-ried during the night line service is 145.2, representing 3.9 % of the total number of passengers carried, while the remaining 96.1 % refers to the number of passen-gers transported by daytime line services. Proportional increase or decrease in the bus occupancy rate is directly related to the number of passengers carried and the aver-age number of seats per bus. According to data indicating the occupancy of buses it is concluded that the number of passengers in the daytime liner bus service is by 34.95 % higher than the number of night service passengers. The distribution of lines by the time of their arrival at the plat-form is shown in the following graph.
Graph 1 Bus arrivals at bus terminal platforms shown by the arrival time
Source: Prepared and adapted by authors according to collected statistics.
According to Graph 1, it can be concluded that bus ar-rivals at the Rijeka terminal platforms are presented by the smallest number at night time, i.e. between 00:00 and 05:00 AM. The maximum number of buses running by the night schedule, i.e. 3, is recorded in the period between 03:00 and 05:00. The maximum number of buses running on a daily schedule is recorded between 13:00 and 14:00 and amounts to 18. The following graph shows the distri-bution of bus departures from the bus terminal.
Table 4 Statistics of general evaluation indicators of bus lines in the city of Rijeka shown by the line service time
Bus Terminal “Rijeka”
Bus Lines Night Lines Day Lines
Total number of regular bus lines 9 164Total number of passengers 145.2 3581.8Average bus occupancy rate 30 % 42 %Average bus unused capacity rate 70 % 58 %Average number of empty bus seats 36.70 30.23Average number of bus passengers per line 16.08 21.70Average number of seats per bus 52.78 51.93
Source: Prepared and aligned by authors according to collected statistics.

55S. Vilke et al. / Scientific Journal of Maritime Research 32 (2018) 50-58
Graph 2 Bus departures from bus terminal platforms shown by the departure time
Source: Prepared and adapted by authors according to collected statistics.
It can be seen in Graph 2 that the largest number of bus departures in the night hours was recorded between 04:00 and 05:00, i.e. 3. During the day, the largest number of buses departed from 06:00 to 07:00 and from 15:00 to 16:00 i.e. 12 of them. However, these parts of the day also recorded increased frequency of bus departures, i.e. 10 bus departures on the average in the period from 06:00 to 09:00 and 11.33 bus departures on the average in the pe-riod from 13:00 to 16:00.
3.3 The Rijeka Bus Terminal Compared to Other Bus Stations in The PG County
Apart from the Rijeka bus terminal, and in order to obtain a more accurate projection of bus connections be-tween particular parts of the County and other areas of the Republic of Croatia, the analysis also comprised the other 8 bus stations/terminals within the PG County.
The results of the comparison of the Rijeka bus termi-nal and the other stations/terminals with regard to the
number of bus lines, the number of passengers and the av-erage bus occupancy rate are shown in the following table.
Table 4 clearly shows that the Rijeka bus terminal records the largest number of lines, i.e. 42.09 % of all lines operating in the PG County. Likewise, the Rijeka bus termi-nal stands out in relation to the other ones by the number of passengers with 50.44 % of the total number of bus rid-ers on County and inter-county lines per day. The next ma-jor bus station is in Novi Vinodolski. The number of bus lines calling at the station of Novi Vinodolski on a daily ba-sis amounts to 60, thus allowing for the transport of a total of 963 passengers in the mentioned area. The lines with a large number of daily commuters are an indispensable el-ement of their daily life serving their requirements related to work, school or college, food shopping or visits to the variety of facilities generally offered by larger urban areas.
4 Enhancement of the Rijeka Bus Terminal Efficiency and Transport Service Quality
The quality of transport services is the primary re-quirement that both the service provider and the service user tend towards. From the passenger’s point of view the quality of service is provided through the following requirements: frequency of transport, accuracy, regular-ity, speed, price, availability on specific days (Saturday, Sunday), and the time of the first and last bus departures.
Proper definition of transport user requirements as well as of the transport provider contributes to the timely response through actions that need to be taken to bring quality to the desired level. The quality of the service is the factor that will make the difference between the serv-ice provider and their numerous competitors in the mar-ket. Setting quality above the tolerance level will result in a positive outcome for the carrier, making the service
Table 4 Comparative display of data concerning bus terminals within the PG County
Bus Terminal
Rijeka Opatija Delnice VrbovskoNovi
VinodolskiKrk Cres
Mali Lošinj
Rab
Total number of regular bus lines 173 32 28 11 60 15 15 20 57
Total number of passengers 3727 455 726 312 963 166 215 192 633
Average bus occupancy rate 41 % 27 % 50 % 54 % 32 % 22 % 32 % 18 % 23 %
Average bus unused capacity rate 59 % 73 % 50 % 46 % 68 % 78 % 68 % 82 % 77 %
Average number of empty bus seats 30.56 38.36 25.75 24.13 34.20 39.28 24.27 33.75 36.84
Average number of bus passengers per line 21.42 14.23 25.93 28.32 16.05 11.05 14.33 9.60 11.11
Average number of seats per bus 51.98 52.59 51.68 52.45 50.25 50.33 38.60 43.35 47.95
Source: Prepared and adapted by authors according to collected statistics.

56 S. Vilke et al. / Scientific Journal of Maritime Research 32 (2018) 50-58
users more satisfied with the service provided, thus con-tributing to higher bus occupancy rate and consequently to higher revenue. Owing to the increased quality of the service provided, service users i.e. passengers will become more loyal and will use the same service provider on a more frequent basis.
4.1 Analysis of Passenger Transport Service Quality
It is the task of the quality management system to achieve the above goals but also to analyze and evaluate the requirements that need to be met to ensure that both sides are satisfied. Logistics manages the collected mate-rials and information, in addition to planning, organizing, controlling and managing the company resources in order to achieve the optimum operation process. On the basis of the existing situation at the Rijeka bus terminal, proce-dures may be carried out which would enhance the quality of the service, which would further result in greater sat-isfaction of users and hence in higher occupancy rate and use frequency rate concerning the public passenger trans-port service.
In order to propose measures to increase the quality, data on user/passenger opinions were collected. The data were collected using a survey conducted at the Rijeka bus terminal. A number of data were analyzed mainly relat-ed to user age, gender, occupation, station of departure/destination, reason for public transport selection, travel/commuting frequency, evaluation of the public transport service offer, and user motivation.
Table 5 Polled population by the age
Age of the polled Number of the polled
15-20 6621-25 5926-30 1731-35 836-40 941-45 1146-50 851-55 956-60 561-65 766-70 1
>70 4
Source: Prepared and adapted by authors according to polling results.
According to Table 5, it is evident that the largest num-bers of polled persons who are public transport users on a regular basis (commuters) fall between the age of 15 to 20 and 21 to 25 years respectively, representing 61.27 % of transport users. According to the age of respond-
ents, 56.86 % refers to school and university students, 32.35 % to employed persons and 10.79 % to the retired and unemployed.
Graph 3 Polled users breakdown by the motivation for bus ride
Source: Prepared and adapted by authors according to polling results.
According to data displayed in Graph 3, there were as many as 28.43 % of users who answered that they use public transport most commonly for educational purposes (school, university), 24.51 % of those surveyed were com-muters for work, and the remaining 21.57 % were “going home”.
The data referring to the distribution of surveyed passengers by their station of destination showed that most passengers travel outside the area of PG County, i.e. 59.31 % of them are users of 31 inter-county lines, while the remaining 40.69 % of passengers travel the lines with-in the County. According to the aforementioned, it was no-ticed that these were relatively shorter or commutation rides for work, visiting a doctor or an educational insti-tution, the city of Rijeka being the nearest area with the highest concentration of services and contents.
Graph 4 shows user satisfaction rating that represent an input determining whether the service provided gen-erally requires to be completely transformed and signifi-cantly revised. It was recorded that as many as 25.49 % of passengers expressed their full satisfaction with the qual-ity of the service provided, 45.10 % of passengers were satisfied with the service, while 21.08 % of them remained neutral in terms of service rating. It is important to note that only 5 % of respondents rated that they were dissatis-fied with the service and 3 % of them were completely dis-satisfied with the service.
Table 6 Reasons of polled users for selecting public passenger transport
Reason for selecting public transport
Polling population
Subsidies 18Financial terms 26The sole means available 151Ecological awareness 9
Source: Prepared and adapted by authors according to polling results.
As it clearly results from Table 6, the reason for choos-ing public transport as the sole means of transport was

57S. Vilke et al. / Scientific Journal of Maritime Research 32 (2018) 50-58
stated by 151 polled users, while subsidies, financial rea-sons and ecological awareness of the surveyed were re-corded as answers to a significantly lesser extent.
One of the most important questions asked in respect of measures to be taken to increase the quality of the bus liner transport service is the issue of motivation that would increase the interest in public transport. By increas-ing the transport user interest, the number of passengers would also grow and consequently the bus occupancy co-efficient would be increased.
As shown in Graph 5, shorter travel times and cheaper fare tickets were the most frequent answers from the polled. However, both these answers are today reversely propor-tional to the quality of service. The negative side of the bus liner transport system rests with the economic component which has become the main motive for business.
4.2 Measures for Enhancement of Bus Liner Transport Services Within the PG County
Based on the surveys conducted, the counting of traffic and the analysis of the data obtained it is possible to de-
cide what measures should be taken in order to increase the quality of transport services to a satisfactory level. Every decision needs to be based on certain conclusions in order to have the service personalized exactly to the requirements of service users on a most frequent basis. However, the service itself needs to be upgraded to other criteria as well, in order to make it attractive to potential future users.
In determining the actions that need to be taken to bring the quality of service to the desired level, the sta-tistical data were used that had been obtained from pas-senger polling results and from counting the traffic. These data represent the starting point for hierarchical set-up of terms and conditions required by transport users of differ-ent age groups, different economic possibilities and differ-ent habits and travel needs.
According to the polling results concerning users’ mo-tivation for bus ride, it is important to emphasize that us-ers’ age is in direct relation to the most common answer regarding the motivation for bus ride. Thus, younger us-ers of up to 25 years are predominantly commuters using public buses for going to or returning from school or col-
Graph 4 Rating of polled users’ dis(satisfaction) with the public transport offer
Source: Prepared and adapted by authors according to polling results.
Graph 5 Answers of polled users explaining their motivation for frequent use of public transport
Source: Prepared and adapted by authors according to polling results.

58 S. Vilke et al. / Scientific Journal of Maritime Research 32 (2018) 50-58
lege, those aged between 25 and 65 are commuters going to or returning from work, while motives of the retired population vary in nature.
One of the most important questions related to the criteria and priorities to be used in order to increase the quality of service is answered within the question of users’ rating of their satisfaction with the service and the overall offer of the public passenger transport.
By increasing the number of passenger transport modes and properly organized bus lines, it is possible to relieve road connections and increase the quality of trans-port. Greater use of bus passenger transport lines also contributes to ecological awareness, whereby the nega-tive environmental impacts are reduced that are caused by the highly congested traffic on roadways. By increasing the frequency and comfort of buses would greatly increase the passenger’s satisfaction, hence the more frequent use of bus lines.
The monopoly imposes acceptance of conditions that are not suitable for other participants or companies at-tempting to compete on the market. Competition in the public transport market, in addition to reducing the fare price, will also contribute to increasing the quality of transport services.
5 Conclusion
The analysis of the data obtained by counting and polling has shown the actual trends of passenger flows through public bus stations/terminals in the PG County as well as the load rate of the lines connecting urban cen-tres within the County and the city of Rijeka with other counties. In addition, qualitative data on bus riding mo-tives, passenger satisfaction/ dissatisfaction have been elaborated in detail, reasons for choosing public transport of passengers and possible motivation for more frequent public bus riding.
The conducted survey may serve as the basis for fur-ther consideration and planning towards achieving higher quality of service, passenger satisfaction and greater effi-ciency of road connections with other counties.
The collected data have identified the Rijeka bus ter-minal as the centre of all activities within the city area as it represents a place that links together the local, County
and inter-county areas in the Republic of Croatia. Data processing shows the current situation that can be of help in future activities towards a more efficient organization of bus lines and enhanced quality of bus ride services.
With a view to enhancement of the quality of trans-port services, our proposal focuses on increased frequen-cy of bus lines. By increasing the comfort, greater use of buses as a means of transport would be achieved, that would contribute to a lower rate of harmful emissions of exhaust gases from road vehicles. Competition in the public passenger transport market can contribute to re-ducing fare costs and to increasing the quality of trans-port services.
References
[1] Bauer, Z.: Razvoj i planiranje prometa u gradovima, Infor-mator, Zagreb, 1989.
[2] Dugina, M., Bogdanović, T., Feletar, P.: Analiza putničkih (željezničkih i cestovnih) prometnih tokova na relaciji Križevci – Zagreb i Zagreb – Križevci, Cris, Historical Society of Križevci, Year XIV, No. 1/2012, pp. 374-381.
[3] Gibbs, D., Krueger, R., MacLeod, G.: “Planning smart city – regions in an age of market – driven – urbanism”, 2013.
[4] Malić, A.: Prijevozna potražnja u međumjesnom cestovnom putničkom linijskom prometu, Editorial House Dr. Feletar, Zagreb, 1999.
[5] Pađen, J.: Osnove prometnog planiranja, Informator, Zagreb, 1999.
[6] Road Transport Act, Narodne novine 82/13. [7] Spatial and Integrated Transport Studies of the PG County
and the City of Rijeka – County Institute for Sustainable De-velopment and Spatial Planning, 2011.
[8] The Transport Development Strategy of the Republic of Croatia (2017–2030), Ministry of the Sea, Transport and In-frastructure, Zagreb, 2017.
[9] Štefančić, G.: Tehnologija gradskog prometa I, Faculty of Transport and Traffic Sciences, Zagreb, 2008.
[10] Vičević, D., Hess, S.: Analiza potražnje za javnim linijskim prijevozom u Republici Hrvatskoj, Journal of Maritime and Transportation Sciences, Association for Research and De-velopment of Maritime Industries in the Republic of Croatia, Rijeka, 2013, 47-48, pp. 159-168.
[11] Urban Mobility Package, EU, Bruxelles, 2013. [12] http://www.zuc.hr/index_htm_files/index_htm_files/KAR-
TA_4.jpg (15.04.2018)