a practical means for assessing circular economic...
TRANSCRIPT

A PRACTICAL MEANS FOR ASSESSING CIRCULAR ECONOMIC VALUE OF AN ICT PRODUCT
Lisa Dender1, Cintia Gates5, Nicholas Jackson4, Grace O’Malley3, Tom Okrasinski6, Wayne
Rifer2, Mark Schaffer3, Ken Wolenski6
(1) IBM, (2) GEC Emeritus, (3) iNEMI, (4) METECH, (5) Microsoft, (6) Nokia
Abstract: A review of existing recyclability and reusability metrics revealed that the industry has limited means of practically assessing the circular economic value (recyclability, reusability, reparability and refurbish-ability) of an information and communication technology (ICT) product. Current mass-based metrics, in their most simplistic form, are deficient. The iNEMI Reuse and Recycling Metrics project team has been developing a practical means for assessing the circular economic value of an ICT product with the focus on incorporating score factors that assign reasonable impact value to product design features along with the ability to recover and return scrap value back to the market. The resulting system assesses the economic feasibility and physical practicality to separate and liberate the materials from ICT type products. The assessment is divided into three tiers: material choice, ease of liberation, and the available recycling technology. Regional factors have also been researched and incorporated in the assessment criteria. Additionally, the team reviewed the hierarchy of recovery (repair and reuse, parts harvesting, material recovery, or energy recovery/landfill), which impacts the ease of returning value to the market.
1. “IF YOU CAN’T MEASURE IT, YOU CAN’T MANAGE IT”
The iNEMI Recycling and Reuse Metrics project team was formed to assess the type and quality of metrics available to the electronics industry, and to determine if they are adequate to meet the needs of the industry. Stakeholders include customers, regional authorities, recyclers, environmental activists, and manufacturers, and encompass environmental departments as well as product developers.
After its initial analysis, the project focused on developing a method to estimate a product’s potential recovery value based on criteria that can be evaluated early in the product’s development phase. It should help enable designers to improve the product’s performance and value when it reaches the end of its first life. 1.1. What does this mean? The current status of
the industry
The iNEMI project team found mass-based metric standards that define calculations, terms, and methodology for recyclability (e.g., IEC TR 62635). While the team did not find any standards regarding reusability, reparability, and refurbish-ability, they analyzed a system developed by iFixit, a company that develops repair manuals for the public. The mass-
based recyclability metrics are by far the most commonly used and easiest to calculate. However, this metric generally ignores the reality of liberation, separation and recovery of the materials, and the economic realities of the recycling process in the region where the product ends its life. Cost drivers and economics are the primary factors that determine if a product or material will be recycled.
Product designers have two key challenges with regards to liberation of materials and the recycle technologies available. At the time of design, there may not be any recycle technologies available to recover the product, which dramatically affects the environmental impact. For example, while component materials such as plastics are recyclable and would result in a good mass-based recycle metric score, the reality is the materials could not be liberated. The second challenge is one of product use lifecycle. Some products have a very long-life recovery cycle, and demand, usage models, recycle capacity and capability can dramatically change between the time of product introduction and product retirement.
Another critical gap in recycling metrics is the failure to include the economic realities of recycling. A product or material’s potential to be recycled or repaired does not mean it actually is recycled or repaired. There are striking differences in recovery rates based on economics. We found two main drivers of this economic reality:

• Value of the recovered material: Can the material be recovered? Can it be sold?
• Cost of liberation/separation: Can the materials be separated into clean streams? What does it take to liberate the materials (hazardous materials included)? Any metric that does not consider the economic
realities is not likely to be a driver of informed choices and improvement. Product designers do have control over several factors that improve the performance of recycling and reuse metrics. • Material selection: choosing materials that are, or
can be, recycled • Product design: designing the product for easy
repair, disassembly, and ease of separation will benefit the creation of clean material streams at the end of life. This aspect will also improve the product’s reparability, refurbish-ability, and reusability.
• Disclosure: providing needed information to consumers to facilitate repair and disassembly.
1.2. The life cycle model Traditional environmental life cycle assessment, or LCA, evaluates the full life cycle (i.e., all life cycle stages that an electronics product undergoes). This includes raw materials extraction, pre-processing, intermediate materials and components manufacturing, final product assembly and testing, finished product transport and distribution, installation, usage and repair, and end-of-life treatment for its first and subsequent uses. Ideally, a product designer should understand the environmental impacts of a product being developed throughout all its life cycle stages. The environmental impacts associated specifically with a product’s end of life have significant implications in addressing value recovery. The circular economy demonstrates the mechanisms by which product value recovery at end of life can be improved. The recycling and reuse metric defined in this paper recognizes life cycle assessment through the integration of LCA principles in the material choice process, and that process includes environmental impact of product materials over the full life cycle. 1.3. Importance of knowing what you are
measuring It is important to understand what is being measured and how that associated impact affects the overall goal of the iNEMI project. The project team defined three categories into which the key features of a product have significant impact on its recovery value: material choice, ease of liberation, and availability of recovery technology. Characteristics of these three value
recovery features can be further broken down into sub-categories that are relevant to the product designer. In this way, the designer can foresee the importance of a specific product characteristic and how it relates to improving product value recovery.
A successful metric tool will be able to provide an immediate response to the user regarding how a particular product attribute can affect the product value recovery “score,” and the associated characteristics that interrelate with each other. For example, the presence of a hazardous substance can reduce the product value recovery in multiple ways such as with whole product reuse potential, parts/components reuse potential, and with materials recovery and recycling potential. A proper metric tool will show those interrelated characteristics to the designer, and thereby provide a more holistic measurement process. 1.4. Who are the key users? Product designer
and recycler The key user is the product designer with the primary objective being informed choices at the initial stages of design, when it is still possible to change the outcome of the design. Other users include customers, regional authorities, recyclers, environmental activists, and manufacturers — including their environmental organizations and product developers, — and anyone interested in LCA.
ICT stakeholders, including product designers, manufacturers, customers, recyclers, governmental authorities, and environmental advocates, can use the tool to assess the relative impact of product design choices early in the product life cycle. This will benefit both the industry and the environment to achieve sustainability. The intention for the metric is to identify gaps that prevent return to market value by highlighting the most impactful action(s) needed to close the gaps, and to inform product designers and manufacturers of the end-of-life impacts of their decisions.
2. HOW TO MEASURE IT? THE PROPOSED
METRIC While designing the Repair and Recycle Metric prototype, the project team first asked “what is the thing we are trying to measure?” And the answer, while seemingly obvious, is not. We are measuring the ability of the system to return value back to the market. For electronic products, the system includes the

product designers, the recovery agents1 and the return-to-market agents2. The objective is to harvest as much value out of an electronic product as possible while reducing waste to a minimum. As with any interlocking system there are silos where the objective of one actor conflicts with another in the value chain. The trick is to get them to work together to return the maximum total value.
For the electronics industry, we have identified three major areas of impact: product design, the recovery process and return to market. The product designers select the materials and the assembly of those materials (i.e., form, fit, function). The recovery agents control the ‘how’ and ‘if’ of recovery by investments in capital (tools, processes, handling and safety equipment), labor (training, hiring) and choices made based on the profitability of recovering material from e-waste. The return-to-market agents create the paths to return recovered materials back into the worldwide market.
A choice made at any point in the value chain is affected by the other two. The process starts with the product designer as this is where the ability to tweak a design for better recovery resides along with the ability to envision the recovery process needed to tear it apart. Who better to understand how to break down a product to its materials and sub-assemblies than the person who put them together? The product designer has the most influence over the value delivery chain by his choice of material and the design itself. What is missing is a clear picture of what happens to the design after first use and how the choices influence the success of the downstream processes. 2.1. Three key features that affect value recovery The proposed iNEMI metric assesses the circular economic value of an ICT product with the focus on incorporating score factors that assign reasonable impact value to product design features as well as the ability to recover and return scrap value back to the market. Included in this scoring are aspects that are within the product designer’s control, such as material choice and ease of liberation of components and materials, and those aspects outside the product designer’s control, such as the availability of recovery technologies in the markets where the product is placed.
The proposed metric assigns an impact value based on the design and a weighted recovery rate, which brings the actual recycle results into the traditional mass-based metrics. The iNEMI project is developing an assessment tool to gauge the ability to disassemble a product for repair and recovery of whole product, components and parts. 1 Recovery agents include those organizations that provide for repair, refurbishment, part harvesting, remanufacturing after first use, recycling and eventually return to earth services.
The resulting metric assesses the economic feasibility and physical practicality of separating and liberating the materials from ICT type products. The assessment is divided into three tiers: material choice, ease of liberation, and the available recycling technology. Regional factors have also been researched and incorporated in the assessment criteria. Additionally, the team reviewed the hierarchy of recovery, which impacts the ease of returning value to the market. This includes repair and reuse, parts harvesting, material recovery, or energy recovery/landfill. 2.1.1. Material choice Material choice is a critical factor that affects value recovery in electronic products. Designers have choices in components and materials that are selected early in the development phase of an electronic product. Researchers can have earlier input in material choice, because substances may be chosen or eliminated based on their associated attributes that can impact the resulting product at end of life. By providing the designer with immediate feedback on the material choice of his design, the product designer can focus his attention on how to improve his score (i.e., make better material choices).
In developing a recycling and reuse metric, the authors determined that the key feature of material choice can be suitably modeled by evaluating material efficiency. In a study by the European Commission (EC), product design was identified as key to achieving material efficiency and resource savings from recycling and waste prevention [1]. Material efficiency can be understood as "doing more with less". Product researchers and designers use “ecodesign” aspects to understand material efficiency implications, but also environmental impacts of those materials over the full life cycle of the product. From a recycling and reuse perspective, material choice has a direct impact on material efficiency, which then has a consequential impact on the value recovery of a product at end of life. This is driven by various aspects such as quantity of materials; origin of materials; environmental impacts of the extraction and transformation of materials; reparability and durability of the product; and recyclability, reusability, and recovery of the product. The relevance of these aspects was studied and published by BIO Intelligence Service S.A.S. for the EC [2].
In developing a set of criteria for the material choice segment of a recycling and reuse metric, the following criteria was chosen from the material efficiency aspects as published for the EC:
2 Return-to-market agents are those who take the materials from the recovery agents and sell or introduce that material back into the worldwide market.

• Quantity of material used in product life cycle, including: § Critical raw materials (CRM) § Material input per service (MIPS)
• Environmental impact of product materials over the life cycle, including: § Abiotic depletion potential § Recyclability benefit ratio
• Recoverability of material/product, including: § Recoverability benefit ratio
• Origin of materials, including: § Recycled content § Reused components § Raw materials with sustainable origin
• Reusability of components and products, including: § Reusability benefit ratio
• Reparability and durability of components and products, including: § Lifetime and warranty
2.1.2. Ease of liberation Previous attempts to develop metrics for recyclability, such as the IEC Technical Report 62635, neglect liberate-ability, that is, the ease and effectiveness of separating components and materials in the condition needed for economically viable recovery. The technical report assumes when a material is present, its recover-ability can be estimated with a generic percentage. However, in the real world, where time is money, how the material is joined with others can strongly affect the ability to create a marketable resource. This shortcoming of the IEC TR 62635 methodology is understandable because it can be the most difficult factor to measure objectively. However, several attempts have been made by academics and consultants from which to start.
For the purpose of evaluating ease of liberation of materials, the designer must evaluate the following: 1) removal of hazards only (e.g., battery), then shredding; 2) liberation of a few key components or material, then shredding; or 3) the liberation of a majority of components and materials into pure streams.
The metric will award more points for the design based on the ease with which someone in the recovery industry, with limited training and access to very few to no tools, can perform the disassembly process. The most points are awarded for designs where parts and materials can be harvested with no damage to the components and materials. Because shredding
produces lower-grade, and thus less valuable, materials less points are awarded in the metric. The worst-case scenario occurs with materials that cannot be liberated. Examples include fused designs, especially if there are hazardous substances in the design such as those found in lights and batteries. 2.1.3. Availability of recovery* technology (AR*T)
While the concept of AR*T3 is straight-forward — can we recycle this device? — the answers and capabilities of the global market are not so simple. Each country or region is organized based on demand and ability. Simply put, no two countries or regions recover e-waste in the same manner nor with the same results. The most important feature that distinguishes a country’s ability to collect, transform and return e-waste value to the market is the economic health of the country (i.e., does the country or region have funds to purchase electronic products and do they have enough discretionary funds to invest in recycling?). Next is the capability of the country or region to provide the services (repair, recovery, recycle). And finally proof of performance.
The factors used to rank a country or region’s availability of recovery technology are: 1) Regulatory and infrastructure (capability) 2) Economic or development (investment potential)
and 3) Electronics recycling rate (performance).
The output is a ranking score by country which is weighted based on the percentage of sales targeted for that country or region. Weighting the AR*T score based on the targeted market or region shows the designer which target market is improving his score (i.e., those countries where e-waste handling is performing well) and which are not (i.e., those countries with lagging or no e-waste handling capability.) This alone can inform the designer how the system, the circular economy, is impacted by his design and might spur action to develop e-waste handling capabilities in areas that are lacking.
2.2. How the recycling and reuse metric works 2.2.1. Tool introduction The iNEMI Recycling and Reuse Metric (R&RM) tool is configured for simplified graphical input screens. A product criteria summary is provided in the overview worksheet. The three main R&RM categories are listed: material choice, ease of liberation, and available
3 Recovery* means all the various Rs – recycling, reuse, remanufacturing, repair, refurbishment. AR*T is a term the iNEMI project team uses to represent all methods of recovery.

recycle technology. Each of these product categories is then linked to its respective input page. Results are summarized in the product criteria worksheet along with sparklines and percent of range scores for the three categories.
Three worksheets are subsequently provided to input product criteria relating to material choice, ease of liberation and available recycle technology. The input fields are listed along with graphical connectivity that allows the user to easily follow the input path, which is set according to the criteria’s category and query listing. The listing provides guidance on questions in the form of comment boxes, drop-down menu tables, and links to associated worksheets with supporting information.
The tool is currently built as a spreadsheet using Microsoft Excel. It provides data connectivity and interfacing throughout the workbook and allows for logical operations to check and provide feedback to the user depending on the question and other input within the worksheets. 2.2.2. Input required (summary list) Initially, the product type (e.g., server, laptop, cell phone) is selected along with input on the criteria regarding the product’s methods for ease of liberation and pathway optimization criteria.
For the Ease of Liberation worksheet, the input is graphically provided in two sections: Product Recovery Objective after the first use lifetime; and Product Parts/Materials Ease of Liberation Method. In the first section, the user selects a primary and secondary objective for the product based on its first use lifetime. The intended objective will be compared to the likely outcome generated by the tool based on the detailed choices of the product designer (a check and balance system for ease of liberation).
For the Availability of Recovery Technology worksheet, the input is graphically provided regarding the product’s target markets as measured by percentage of sales to a country or region, adding to 100%. A large dropdown list is provided for the user to enter the regions and/or countries in which the product will be sold and located. Percent of estimated sales for these respective regions/countries is also provided in the worksheet.
For all three input worksheets, the user can choose from preselected choices that are built into the input fields. These input choices are arranged in tables within the worksheet, along with their respective pre-populated scoring and weighting factors. This is designed so that updates to these factors can be easily made based on updated factors. Scores for each query are positioned next to the respective input fields so that the user can see the resulting output based on the scoring input selected. 2.2.3. Output (what it means)
The results within each worksheet are systematically determined based on the input choices made. This allows for the user to gauge how the input is affecting the output score. For instance, a material choice can quickly show the resulting R&RM score for that specific question. The resulting score is summed for each of the three R&RM product categories. Sparklines and percent of overall range scores are also shown so that the user can further visualize the results relative to an overall best and worst score for the R&RM tool. 2.2.4. Dependencies (assumptions, where the data
comes from, how to maintain it) Data is shared among three worksheets of the R&RM tool. For many of the questions, dependencies are built into the tool’s spreadsheets, scoring factors, and algorithms. For example, if hazardous substances are present and selected in the Material Choice worksheet, the output of this selection then impacts several other criteria and associated scoring relationships, such as within the Ease of Liberation worksheet.
For the Material Choice spreadsheet, entry choices for many of the questions follow the guidance provided by the European Commission for a circular economy, such as the inclusion of Critical Raw Materials in the input criteria. Here the data on CRM only covers the European Union (EU) for this initial version of the R&RM tool. Environmental impact of product materials was provided for high, medium and low priority materials as defined again by the EU [2].
For the Ease of Liberation spreadsheet, entry choices follow questions designed around the initial product recovery objective (e.g., whole product reuse, parts reused, mixed materials recycling, etc.). Further criteria are included regarding this initial choice and the type of product. Ease of Liberation Method criteria are then answered based on this choice. Scoring responses have been provided based on data from iFixit and other ease of liberation product analyses. Additional pathway optimization criteria have been included such as: • Material connectivity • Connector types • Types of tools required • Disassembly difficulty • Training requirements • Information availability in achieving the ease of
liberation pathway
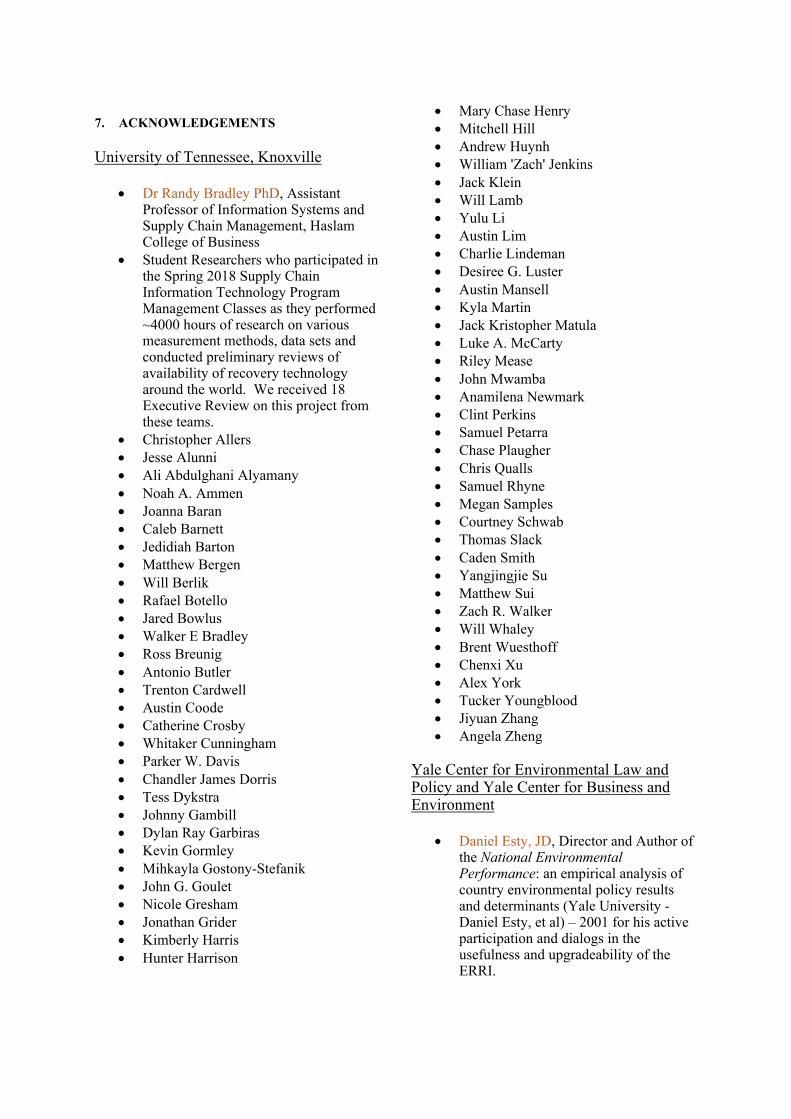
The Availability of Recovery* Technology (AR*T) worksheet is built around the product’s targeted markets. The dependencies for scoring based on the regions and/or countries selected are related to two criteria: regional/country recycling rate (RR) and environmental regulatory regime index (ERRI). Values for the region or country RR have been taken

from the OECD Environment at a Glance 2015 – Environmental Indicators report published in October 2015. The ERRI concept has been defined in a publication by Daniel Esty [3]. ERRI was chosen from this legacy publication, although the need for its values to be updated with contemporary information is apparent, and discussion of such is provided in section 5. Nonetheless, 2016 GDP data from the World Bank was used to correlate values for countries listed in the table of the AR*T worksheet. ERRI combined with RR values provides the net score for regions and countries listed in the AR*T worksheet.
To provide a level of balance between the three worksheets, weighting criteria were included to yield
a 30%: 30%: 40% balance, and thus a 100% total sum. These summary scores are provided both within the individual worksheets and as a summation in the Product Criteria Overview worksheet along with a grand score. 2.3. Desired Outcome Product designers can use the R&RM tool to quickly and more easily see how their design affects a product’s return of value to the market. Concepts can be evaluated early in the concept stage of the design cycle so that changes can be made to impart a higher return of value.
Based on the AR*T score and a particular target market, product manufacturers can see where to proactively engage with product recovery agents and determine what actions can be initiated to improve the score. To help in this effort, the R&RM tool includes a worksheet to assess certain government drivers for a circular economy. Based on the scores from the three R&RM worksheets, drivers related to better product design, creating incentives, improving production processes, and innovating industrial processes can be further considered. There can also be policy choices that support the health of the entire value chain.
Entrepreneurs can benefit from this R&RM tool by being able to see opportunities to create recovery technology in a variety of ways, and simple recovery projects in places where little to no technology exists. 2.4. R&RM tool example Figures 1-4 provide an example of the R&RM tool populated with a fictitious “high-scoring” product under development., The figures show populated Material Choice, Ease of Liberation, Available Recycle Technology, and Product Summary worksheets.
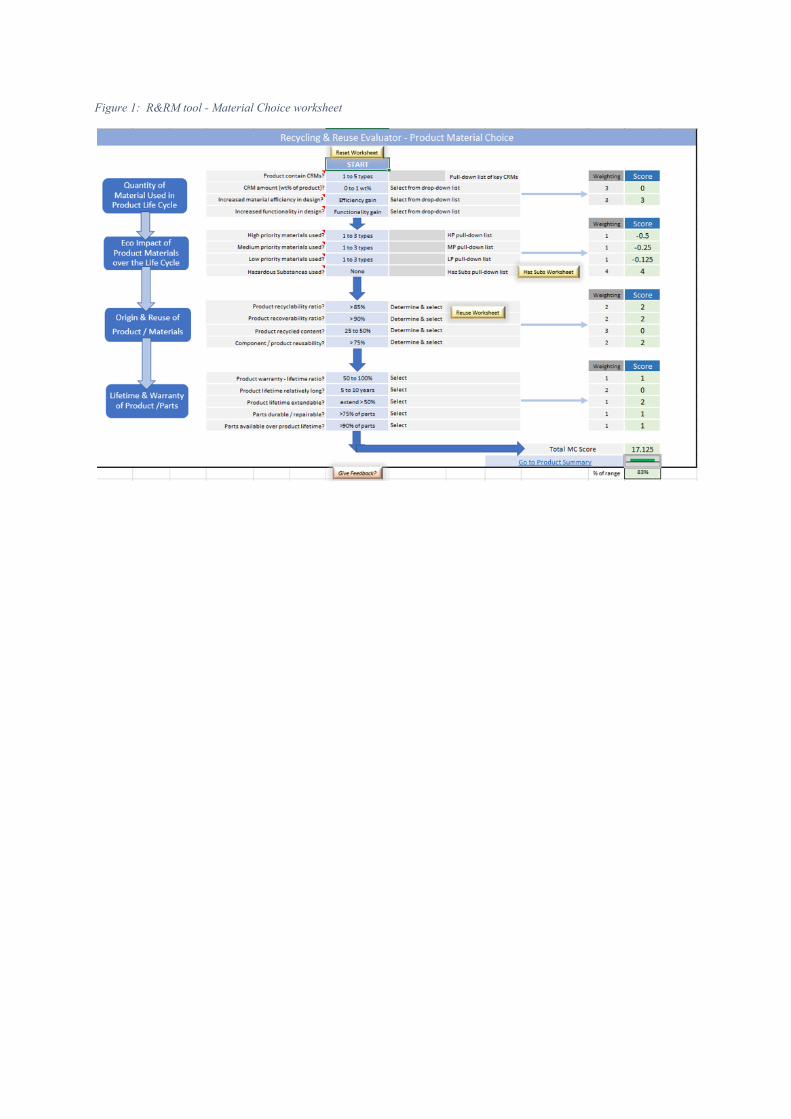
Figure 1: R&RM tool - Material Choice worksheet
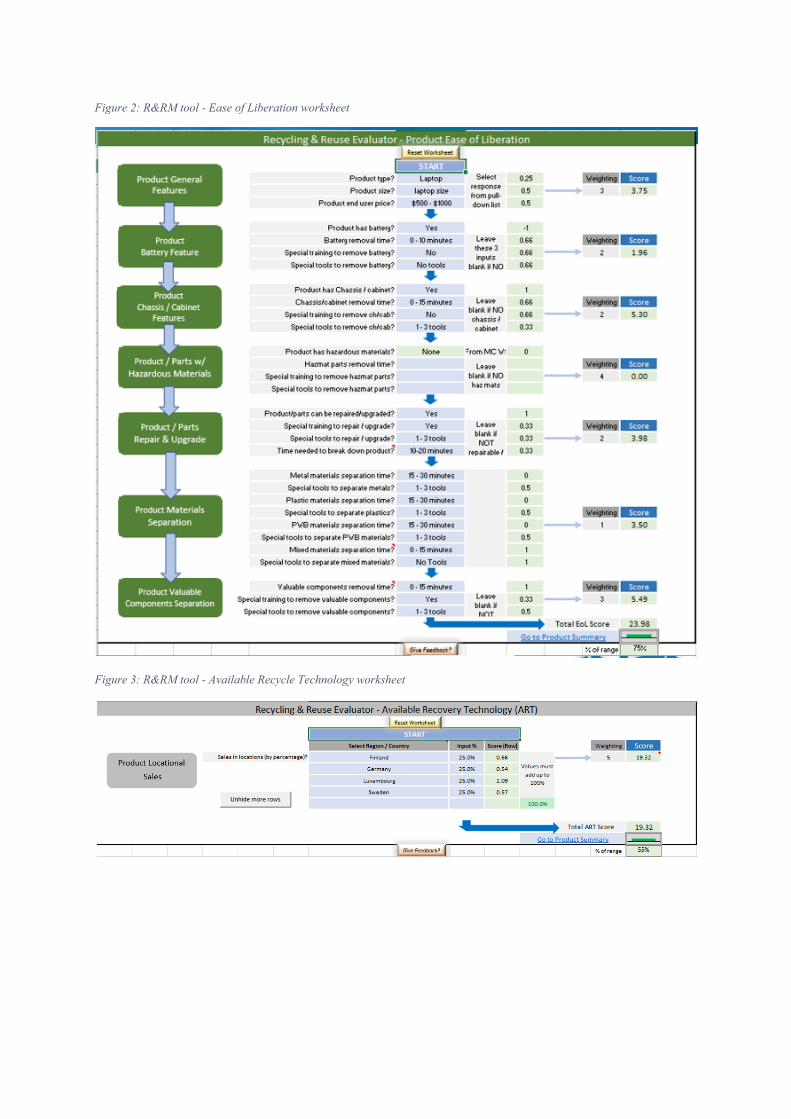
Figure 2: R&RM tool - Ease of Liberation worksheet
Figure 3: R&RM tool - Available Recycle Technology worksheet

Figure 4: R&RM tool - Product Score Summary worksheet
In this product example, scores for Material Choice, Ease of Liberation, and Available Recycle* Technology are shown to be 17.1, 24.0 and 19.3, which is 83%, 75% and 55% of their respective maximum category score range. A grand score of 60.4 is shown, with an associated maximum overall score range of 73%. This reflects relatively high MC, EoL and AR*T scores for a product that exhibits good R&RM characteristics. 3. HOW TO MANAGE IT? INTERPRETING
RESULTS FROM THE METRIC 3.1. Transparency and visibility of factors in the
metric The intention of the R&RM tool is to provide a relative score by which a product under development can be evaluated and improved. This relative score can be compared to a product’s previous generation or to like kind products currently being produced. The tool is not designed to be used for competitive comparison or for compliance assessment. In responding to the category questions, the user will be relying on judgement of the new product’s attributes and how they measure against the criteria defined within the tool. Thus, a level of subjectivism is inherent in the tool’s usage,
It has been an objective in the development of the R&RM tool to give the user transparency and visibility into the factors used in the metric. As such, choices provide immediate score responses so that the user can understand the differential scoring when different choices are made for a specific worksheet question. This visibility also allows the user to evaluate product design options and determine the R&RM score sensitivity to available choices. The sparklines and percent of scoring ranges also provide the user with an overall sense of impact to the categorical scores as well as the cumulative grand R&RM score.
Additionally, data tables are visible to the user as are the scoring criteria and algorithms used in the R&RM tool.
3.2. Focusing resources to overcome the identified opportunities/risks from the metric
The metric tool is only as good as the data it uses. Various datasets within the tool are known to need additional refinement, especially in how the availability of recycling technology by country is evaluated and how the ease of liberation (or lack thereof) is counted.

4. INTEGRATING THE MEASUREMENT METRIC INTO PRODUCT DESIGN CYCLE FOR MORE INFORMED DECISIONS
The R&R Metric team employed design thinking methodologies to identify pain points and opportunities across the entire life cycle of an electronic product. The team discovered that the very best time to affect change is at the drawing board for a new product. The pain point for the designer is lack of insight. The designer doesn’t have time to research the recycle methods for the product and certainly can’t find recycling rate data easily. We know, we tried! The metric will allow the designer to play “What if” with his design: What if I changed to this plastic, that to metal, changed where the mercury back-light lamp is placed or replaced mercury entirely, changed where the gold connectors are located on the board? It also allows for some forward thinking. When designing a brand-new technology…can it be recycled?
If the product is going to ship into the EU, then the designer’s company will eventually be required to pay recovery fees when their product arrives at the waste handling facilities. Other than not selling into the EU, the only real option for lowering costs is to have efficient recovery technology available in advance! That and maybe think about the second life uses of the materials being recycled.
The metric can help the recycle and recovery industry. The key to value recovery is to have value to recover and then recover it! The Material Choice feature of the metric aims to inform the product designers of material choices that retain their value through the transformation processes. The Ease of Liberation feature of the metric aims to inform the designers of the impact their physical design choices have on the recovery process (i.e., glue, heat staking, embedded chips). The AR*T metric can inform electronics manufacturers of significant gaps in their
worldwide recovery system to recover e-waste by country and, better still, perhaps identify gaps in recovery technology before new products arrive as e-waste at the recovery agent’s facility. Nature abhors a vacuum and information is money. When a company is challenged to reduce their fees for handling e-waste, they invest in methods to do so. When entrepreneurs find a money-making opportunity, they will rush in to harvest it. The R&R Metric is designed to show such opportunities. 5. CONCLUSIONS, RECOMMENDATIONS,
NEXT STEPS Why does this matter? We constantly are reminded that the product designer has no control of the market forces and capability of the after-market. How does use of the R&R metric improve performance of an interlocking system? Awareness. The only way to unlock the value of the entire system is to link it together. The single best place to influence the recyclability of a product is when the company is developing a product for market. Major electronics manufacturers are under pressure to lower the cost of recovery and the environmental damage caused by the e-waste they generate. The R&R Metric can help.
The work on the metric is a continuous process and to that end, a Phase 3 project will begin in 2019 to further research, develop and expand datasets and to further refine the tool. Finding an organization to host and maintain the tool will also be an objective.
6. REFERENCES [1] BIO Intelligence Service (2011) Analysis of the key contributions to resource efficiency, Final Report - Prepared for European Commission, DG ENV. [2] Material-efficiency Ecodesign Report and Module to the Methodology for the Ecodesign of Energy- related Products (MEErP); Final report to the European Commission - DG Enterprise and Industry, 5 December 2013. [3] National Environmental Performance: An Empirical Analysis of Policy Results and Determinants, Daniel C. Esty & Michael E. Porter; Jan. 1, 2005.
7. ACKNOWLEDGEMENTS University of Tennessee, Knoxville
• Dr Randy Bradley PhD, Assistant Professor of Information Systems and Supply Chain Management, Haslam College of Business
• Student Researchers who participated in the Spring 2018 Supply Chain Information Technology Program Management Classes as they performed ~4000 hours of research on various measurement methods, data sets and conducted preliminary reviews of availability of recovery technology around the world. We received 18 Executive Review on this project from these teams.
• Christopher Allers • Jesse Alunni • Ali Abdulghani Alyamany • Noah A. Ammen • Joanna Baran • Caleb Barnett • Jedidiah Barton • Matthew Bergen • Will Berlik • Rafael Botello • Jared Bowlus • Walker E Bradley • Ross Breunig • Antonio Butler • Trenton Cardwell • Austin Coode • Catherine Crosby • Whitaker Cunningham • Parker W. Davis • Chandler James Dorris • Tess Dykstra • Johnny Gambill • Dylan Ray Garbiras • Kevin Gormley • Mihkayla Gostony-Stefanik • John G. Goulet • Nicole Gresham • Jonathan Grider • Kimberly Harris • Hunter Harrison
• Mary Chase Henry • Mitchell Hill • Andrew Huynh • William 'Zach' Jenkins • Jack Klein • Will Lamb • Yulu Li • Austin Lim • Charlie Lindeman • Desiree G. Luster • Austin Mansell • Kyla Martin • Jack Kristopher Matula • Luke A. McCarty • Riley Mease • John Mwamba • Anamilena Newmark • Clint Perkins • Samuel Petarra • Chase Plaugher • Chris Qualls • Samuel Rhyne • Megan Samples • Courtney Schwab • Thomas Slack • Caden Smith • Yangjingjie Su • Matthew Sui • Zach R. Walker • Will Whaley • Brent Wuesthoff • Chenxi Xu • Alex York • Tucker Youngblood • Jiyuan Zhang • Angela Zheng
Yale Center for Environmental Law and Policy and Yale Center for Business and Environment
• Daniel Esty, JD, Director and Author of the National Environmental Performance: an empirical analysis of country environmental policy results and determinants (Yale University - Daniel Esty, et al) – 2001 for his active participation and dialogs in the usefulness and upgradeability of the ERRI.

• Jon Powell, PhD, P.E for his support in defining updates to the ART part of the model including possible development of an Electronics Value Recovery Index (EVRI).