a novel transmission scanner framework for real … meeting proceedings/rto... · a novel...
TRANSCRIPT
A Novel Transmission Scanner Framework for Real-Time Applications
Dirk Kolb 1,2, Ulla Uebler1, Elmar Noth2
1 - MEDAV GmbH, Grafenberger Str. 32-34, 91080 Uttenreuth, Germany2 - Pattern Recognition Lab, Department of Computer Science, Friedrich-Alexander-University
Erlangen-Nuremberg, Martensstr. 3, 91058 Erlangen, Germany
[email protected], [email protected], [email protected]
ABSTRACT
The strong need for a robust and real-time transmission classification can be found both in civil and non-civilapplications. In this paper, we propose a new technique based on modern and low-complexity object detec-tion approaches. The transmission scanner uses a combination of Haar-like and technical features to detectand classify different, co-occurring narrowband transmissions within wideband signals. The transmissionscanner is evaluated with recorded real world data in order to fulfill real conditions. The evaluation showsthat this system performs very well with 99.5% accuracy.
1.0 INTRODUCTION
To know what is on air has always been a strong interest of civil and non-civil institutions. The civil areaof research has the aim to detect white spaces in frequency bands in order to establish secondary usage, asit is done in Cognitive Radio (CR) [1, 2]. In contrast to this, the non-civil institutions try to identify everysignal or a special type of signal. This signal interception is called Communications Intelligence (COMINT).Both benefit from increasing instantaneous receiver bandwidths, made possible by Software-Defined Radio(SDR) [3]. The wider the bandwidth, the higher the knowledge gain can be. The drawback of such a wide-band receiver is that the requirements for a real-time signal processing in CR and COMINT applications arehigher than before, as the search space increases.
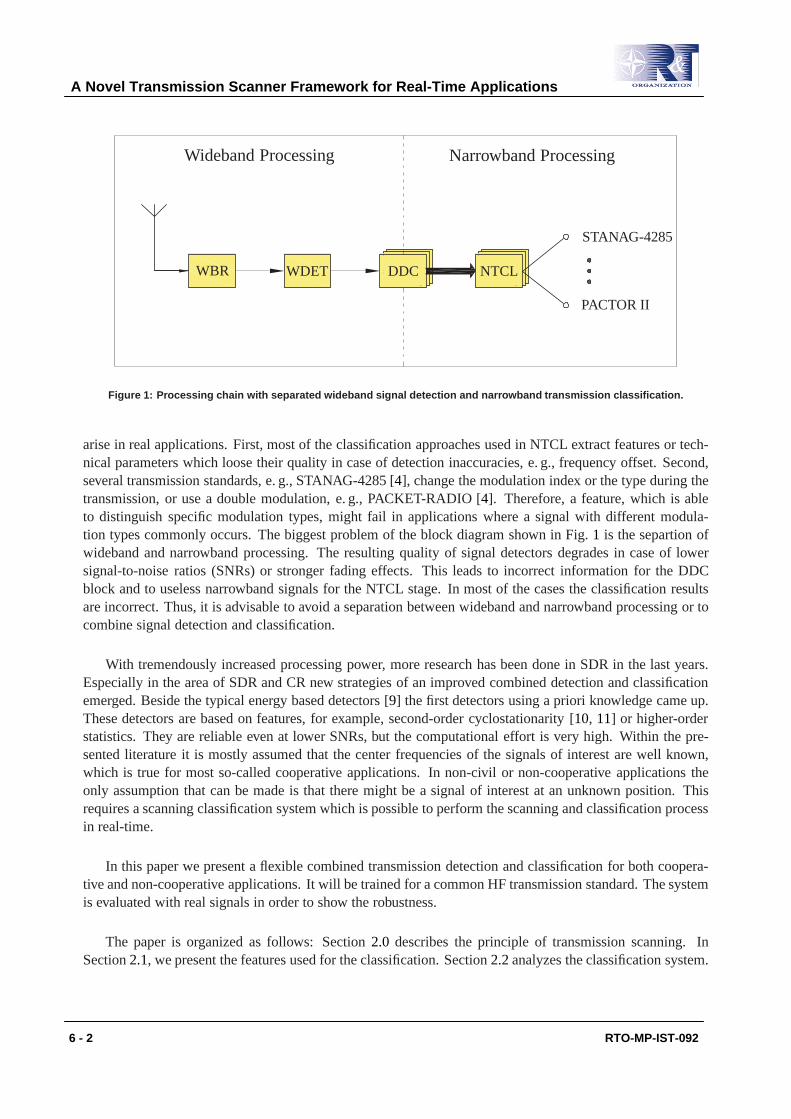
In Fig. 1 the traditional procedural method is shown. A Wideband Receiver (WBR) digitizes the antennasignal with a specific sampling frequency. The typical sampling frequencies for the High Frequency (HF),Very and Ultra High Frequency (VUHF) bands vary betweenfS = 625 kHz andfS = 20 MHz. The dis-cretized signal is led to a Wideband Signal Detection (WDET). The most approaches for this stage are basedon an energy detection. They use no a knowledge to extract the information regarding the center frequency,bandwidth, transmission start and duration. The information of WDET is used within the Digital Down Con-version (DDC) to cut the narrowband signals out of the wideband signal and transfer them to the NarrowbandTransmission Classification (NTCL). The NTCL extracts specific features, e. g., modulation type and baudrate, in order the get the information about the used transmission standard, e. g., STANAG-4285 or PACTORII [ 4]. Approaches for the modulation classifier are presented in [5–8]. The evaluation of most of thesealgorithms has been done without consideration of inaccuracies of the first stage and furthermore almostall test signals have been created without consideration of transmission standards. Therefore, two problems
RTO-MP-IST-092 6 - 1
WBR WDET DDC NTCL
STANAG-4285
PACTOR II
Wideband Processing Narrowband Processing
Figure 1: Processing chain with separated wideband signal detection and narrowband transmission classification.
arise in real applications. First, most of the classification approaches used in NTCL extract features or tech-nical parameters which loose their quality in case of detection inaccuracies, e. g., frequency offset. Second,several transmission standards, e. g., STANAG-4285 [4], change the modulation index or the type during thetransmission, or use a double modulation, e. g., PACKET-RADIO [4]. Therefore, a feature, which is ableto distinguish specific modulation types, might fail in applications where a signal with different modula-tion types commonly occurs. The biggest problem of the block diagram shown in Fig.1 is the separtion ofwideband and narrowband processing. The resulting quality of signal detectors degrades in case of lowersignal-to-noise ratios (SNRs) or stronger fading effects. This leads to incorrect information for the DDCblock and to useless narrowband signals for the NTCL stage. In most of the cases the classification resultsare incorrect. Thus, it is advisable to avoid a separation between wideband and narrowband processing or tocombine signal detection and classification.
With tremendously increased processing power, more research has been done in SDR in the last years.Especially in the area of SDR and CR new strategies of an improved combined detection and classificationemerged. Beside the typical energy based detectors [9] the first detectors using a priori knowledge came up.These detectors are based on features, for example, second-order cyclostationarity [10, 11] or higher-orderstatistics. They are reliable even at lower SNRs, but the computational effort is very high. Within the pre-sented literature it is mostly assumed that the center frequencies of the signals of interest are well known,which is true for most so-called cooperative applications. In non-civil or non-cooperative applications theonly assumption that can be made is that there might be a signal of interest at an unknown position. Thisrequires a scanning classification system which is possible to perform the scanning and classification processin real-time.
In this paper we present a flexible combined transmission detection and classification for both coopera-tive and non-cooperative applications. It will be trained for a common HF transmission standard. The systemis evaluated with real signals in order to show the robustness.
The paper is organized as follows: Section2.0 describes the principle of transmission scanning. InSection2.1, we present the features used for the classification. Section2.2analyzes the classification system.
A Novel Transmission Scanner Framework for Real-Time Applications
6 - 2 RTO-MP-IST-092

Section3.0 reports on the performance of our system. In Section4.0, we present conclusions along withrecommendations for future improvements.
2.0 TRANSMISSION SCANNER FRAMEWORK
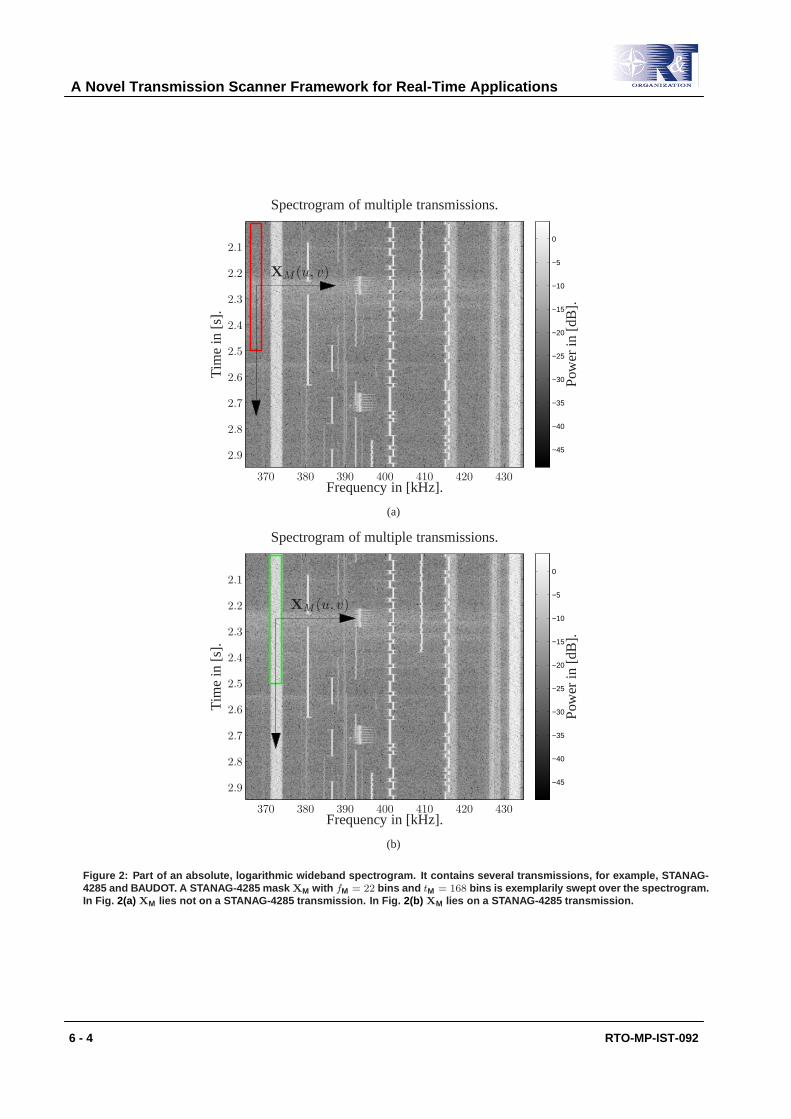
The basis of our approach is the spectrogram of a wideband signal. In Fig.2 only a small part of a widebandspectrogram is shown. Many experts are able to detect and classify transmissions only by looking at thisspecial visualization. Thus, the principle of our proposed transmission scanner is comparable to well-knownobject detection techniques (e. g., face detection [12]), which are applied to images. In short, the scan is aseries of detections and classifications of different masks which are moved over the image. In our case, theimage is comparable with the complex spectrogramX
X =
x1
...xi
...xtN
=
X [1, 1] . . . X [1, j] . . . X [1, fFFT]...
. . ....
X [i, 1] . . . X [i, j] . . . X [i, fFFT]...
..... .
X [tN, 1] . . . X [tN, j] . . . X [tN, fFFT]
, (1)
where|xi| are the bins of the power spectrum andtN is the number of short-time spectrums used for classi-fication.xi is computed within the wideband receiver, a ComCatTM-Tuner delivered by MEDAV [13]. Withan applied FFT lengthfFFT = 4096 samples, a sampling frequencyfS = 625 kHz and a Hann window with50% overlapping, we receive a frequency resolution∆f = 153 Hz and a time resolution∆t = 0.003 sec1.The mentioned mask is fitted to the transmission we are looking for. In Section3.0 the transmission ofinterest is a STANAG-4285 signal. It is a continuous, fixed frequency and3.0 kHz wide signal. It becameevident that 0.500 s signal length is sufficient for a robust classification. Thus, the mask is3.3 kHz wide and0.500 sec long. Lower time lengths are possible, but will result in a lower classification rate. This leads to amaskXM , fM = 22 bins wide andtM = 168 bins long,
XM (u, v) =
X [u, v] . . . X [u, v + fM]...
. . ....
X [u+ tM , v] . . . X [u+ tM , v + fM ]
, (2)
whereu = [1, ..., tN − tM ] is the position in time direction andv = [1, ..., fFFT − fM] the position in fre-quency direction ofX. In Fig. 3 the block diagram for the new system is shown. By sweeping ofXM orrather varyingu andv, all possible mask positions withinX are sent to the wideband feature extractionand then to the wideband classification. The wideband feature extraction is described in Section2.1and thewideband classification in Section2.2.
1These resolutions are adapted to the High Frequency (HF) range. For the Very and Ultra High Frequency (VUHF) bands otherresolutions should be chosen.
A Novel Transmission Scanner Framework for Real-Time Applications
RTO-MP-IST-092 6 - 3
−45
−40
−35
−30
−25
−20
−15
−10
−5
0
Spectrogram of multiple transmissions.T
ime
in[s
].
Frequency in [kHz].
XM (u, v)
Pow
erin
[dB
].
2.1
2.2
2.3
2.4
2.5
2.6
2.7
2.8
2.9
370 380 390 400 410 420 430
(a)
−45
−40
−35
−30
−25
−20
−15
−10
−5
0
Spectrogram of multiple transmissions.
Tim
ein
[s].
Frequency in [kHz].
XM (u, v)
Pow
erin
[dB
].2.1
2.2
2.3
2.4
2.5
2.6
2.7
2.8
2.9
370 380 390 400 410 420 430
(b)
Figure 2: Part of an absolute, logarithmic wideband spectrogram. It contains several transmissions, for example, STANAG-4285 and BAUDOT. A STANAG-4285 mask XM with fM = 22 bins and tM = 168 bins is exemplarily swept over the spectrogram.In Fig. 2(a) XM lies not on a STANAG-4285 transmission. In Fig. 2(b) XM lies on a STANAG-4285 transmission.
A Novel Transmission Scanner Framework for Real-Time Applications
6 - 4 RTO-MP-IST-092

WBA
f1
fNFeat
Cla
ssifi
er
STANAG-4285
PACTOR II
Combined Wideband Processing
Wideband Features Wideband Classification
XM
Figure 3: Processing chain with a combined wideband signal detection and transmission classification.
2.1 Wideband Features
For transmission classification, it is desirable to defineNFeatdifferent feature types. There are features whichare very efficient but not definite, and there are features which allow exact decisions but are very inefficient.Thus, the proposed framework gives us the possibility to include different feature groups and to benefit fromthe different advantages. At the end of the feature extraction, we obtain a feature vectorf
f = [f1, . . . , fNFeat] (3)
with N
N = N1 + . . .+NNFeat (4)
dimensions.
In the research area of object detection optical features, like Haar-like features, are state of the art.They are very efficient and obtain a good quality. In our approach, we apply the Haar-like features to thelogarithmic, absolute maskXM,log
XM,log = 10 · log10
(
|XM |2)
. (5)
The original, complex maskXM gives us the possibility to extract more information, which is invisiblein the logarithmic, absolute spectrogram. In addition to the optical Haar-like features, we use technical,phase-related features, too.
A Novel Transmission Scanner Framework for Real-Time Applications
RTO-MP-IST-092 6 - 5

2.1.1 Haar-like Features
The evaluation of every single bin within the mask does not give any information other than signal powerand phase information, which is not sufficient for the classification process. So, first of all we need featuresthat encode the relation of different signal power values within one observed maskXM,log. Haar-like featuresare typically used to describe contrasts within images. Applied to our problem, these features characterizethe two-dimensional energy distribution.
Our Haar-like feature, which is shown in Fig.4, set was inspired by Papageorgiouet al. in [14]. Wereduced the number of Haar-like features to a radio signal specific set. It contains now 20 2-D windows, andcan be used for different transmission types. Depending on the Haar-feature that is used for extraction, dif-ferent tasks can be fulfilled. Fig.4(f) and Fig.4(g) are for the symbol alternations of a 2-FSK transmission,whereas Fig.4(h) is useful for the bandwidth estimation.
(a) (b) (c) (d) (e)
(f) (g) (h) (i) (j)
Figure 4: Haar-like features used for detection and classification. Dark-colored areas have negative and light-colored areaspositive weights.
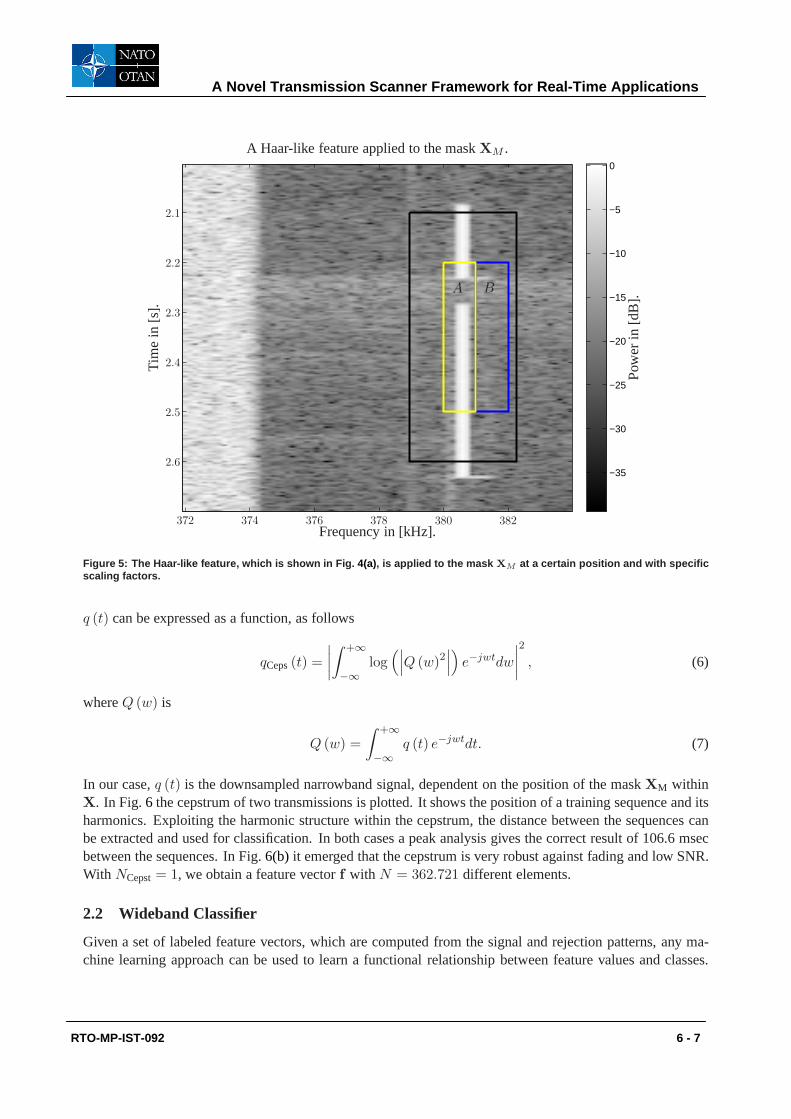
The Haar-like features are applied to different positions with variable scale factors within the maskXM ,as it shown in Fig.5. In this case, the resulting feature value is the difference between the rectangleA andrectangleB. Considering all possible positions and scaling factors,NHaar = 362.720 Haar-like features areextracted. Violaet al. showed in [12] a very fast computation scheme based on integral images, which hasbeen adapted in our implementation.
2.1.2 Phase-related Feature
In this paper we introduce a technical feature which is especially suited to detect periodic sequences withina transmission. These sequences are part of the standard and often used, in order to enable equalizationalgorithms. This feature is based on a cepstral analysis, which is suitable for the detection of periodicvalues, as described by Bogertet al. in [15]. In contrast to the cyclostationary feature, presented by Gardneret al. in [10], the cepstral feature is modulation type independent. Thus, it is suitable for transmissionswith changing modulation types or double modulated content. Additionally, the distance between trainingsequences is often unique for different transmission standards. The cepstrumqCeps(t) of a complex signal
A Novel Transmission Scanner Framework for Real-Time Applications
6 - 6 RTO-MP-IST-092
−35
−30
−25
−20
−15
−10
−5
0
A Haar-like feature applied to the maskXM .T
ime
in[s
].
Frequency in [kHz].
A B
Pow
erin
[dB
].
2.1
2.2
2.3
2.4
2.5
2.6
372 374 376 378 380 382
Figure 5: The Haar-like feature, which is shown in Fig. 4(a), is applied to the mask XM at a certain position and with specificscaling factors.
q (t) can be expressed as a function, as follows
qCeps(t) =
∣
∣
∣
∣
∫
+∞
−∞
log(∣
∣
∣Q (w)2
∣
∣
∣
)
e−jwtdw
∣
∣
∣
∣
2
, (6)
whereQ (w) is
Q (w) =
∫
+∞
−∞
q (t) e−jwtdt. (7)
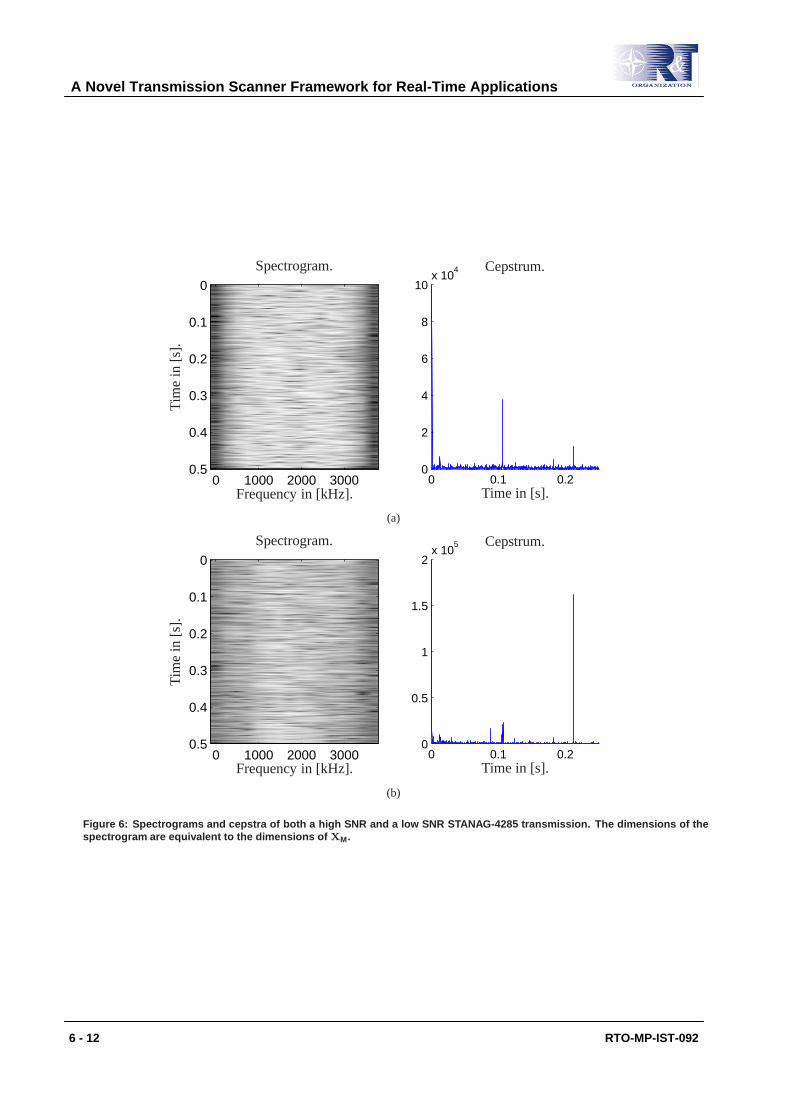
In our case,q (t) is the downsampled narrowband signal, dependent on the position of the maskXM withinX. In Fig.6 the cepstrum of two transmissions is plotted. It shows the position of a training sequence and itsharmonics. Exploiting the harmonic structure within the cepstrum, the distance between the sequences canbe extracted and used for classification. In both cases a peak analysis gives the correct result of 106.6 msecbetween the sequences. In Fig.6(b) it emerged that the cepstrum is very robust against fading andlow SNR.With NCepst= 1, we obtain a feature vectorf with N = 362.721 different elements.
2.2 Wideband Classifier
Given a set of labeled feature vectors, which are computed from the signal and rejection patterns, any ma-chine learning approach can be used to learn a functional relationship between feature values and classes.
A Novel Transmission Scanner Framework for Real-Time Applications
RTO-MP-IST-092 6 - 7
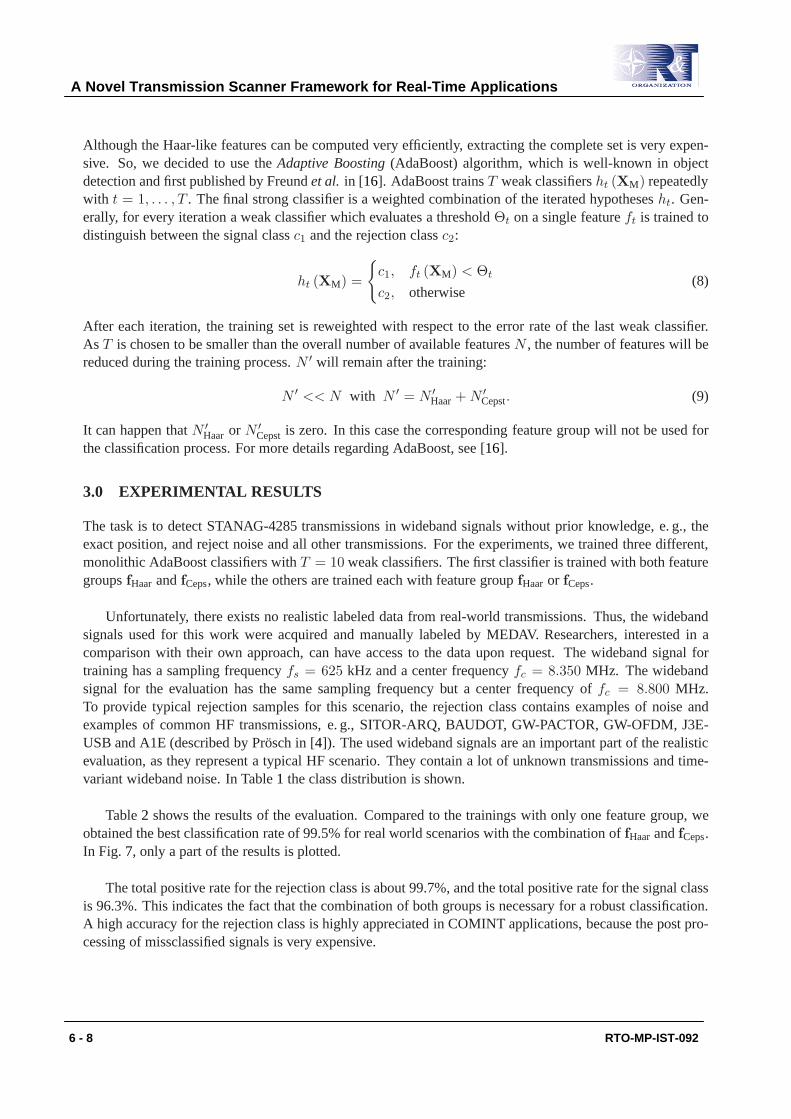
Although the Haar-like features can be computed very efficiently, extracting the complete set is very expen-sive. So, we decided to use theAdaptive Boosting(AdaBoost) algorithm, which is well-known in objectdetection and first published by Freundet al. in [16]. AdaBoost trainsT weak classifiersht (XM) repeatedlywith t = 1, . . . , T . The final strong classifier is a weighted combination of the iterated hypothesesht. Gen-erally, for every iteration a weak classifier which evaluates a thresholdΘt on a single featureft is trained todistinguish between the signal classc1 and the rejection classc2:
ht (XM) =
{
c1, ft (XM) < Θt
c2, otherwise(8)
After each iteration, the training set is reweighted with respect to the error rate of the last weak classifier.As T is chosen to be smaller than the overall number of available featuresN , the number of features will bereduced during the training process.N ′ will remain after the training:
N ′ << N with N ′ = N ′
Haar+N ′
Cepst. (9)
It can happen thatN ′
Haar or N ′
Cepst is zero. In this case the corresponding feature group will not be used forthe classification process. For more details regarding AdaBoost, see [16].
3.0 EXPERIMENTAL RESULTS
The task is to detect STANAG-4285 transmissions in wideband signals without prior knowledge, e. g., theexact position, and reject noise and all other transmissions. For the experiments, we trained three different,monolithic AdaBoost classifiers withT = 10 weak classifiers. The first classifier is trained with both featuregroupsfHaar andfCeps, while the others are trained each with feature groupfHaar or fCeps.
Unfortunately, there exists no realistic labeled data from real-world transmissions. Thus, the widebandsignals used for this work were acquired and manually labeled by MEDAV. Researchers, interested in acomparison with their own approach, can have access to the data upon request. The wideband signal fortraining has a sampling frequencyfs = 625 kHz and a center frequencyfc = 8.350 MHz. The widebandsignal for the evaluation has the same sampling frequency but a center frequency offc = 8.800 MHz.To provide typical rejection samples for this scenario, the rejection class contains examples of noise andexamples of common HF transmissions, e. g., SITOR-ARQ, BAUDOT, GW-PACTOR, GW-OFDM, J3E-USB and A1E (described by Prosch in [4]). The used wideband signals are an important part of the realisticevaluation, as they represent a typical HF scenario. They contain a lot of unknown transmissions and time-variant wideband noise. In Table1 the class distribution is shown.
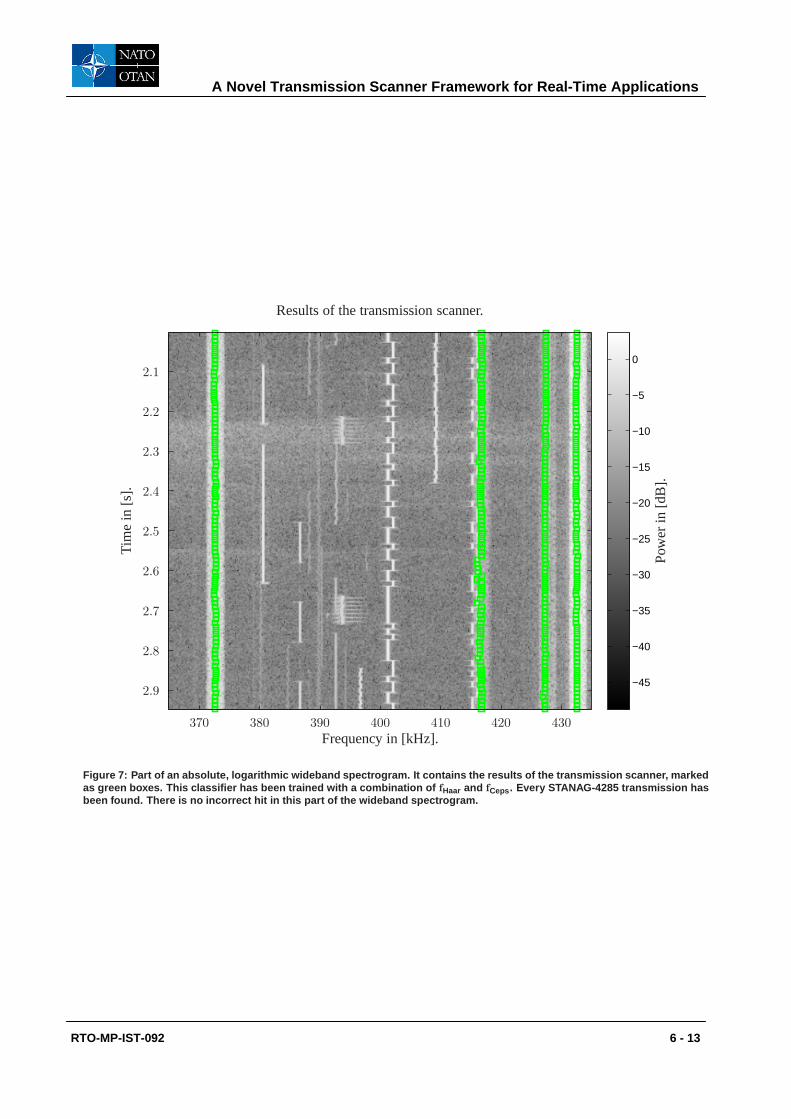
Table2 shows the results of the evaluation. Compared to the trainings with only one feature group, weobtained the best classification rate of 99.5% for real world scenarios with the combination offHaarandfCeps.In Fig. 7, only a part of the results is plotted.
The total positive rate for the rejection class is about 99.7%, and the total positive rate for the signal classis 96.3%. This indicates the fact that the combination of both groups is necessary for a robust classification.A high accuracy for the rejection class is highly appreciated in COMINT applications, because the post pro-cessing of missclassified signals is very expensive.
A Novel Transmission Scanner Framework for Real-Time Applications
6 - 8 RTO-MP-IST-092
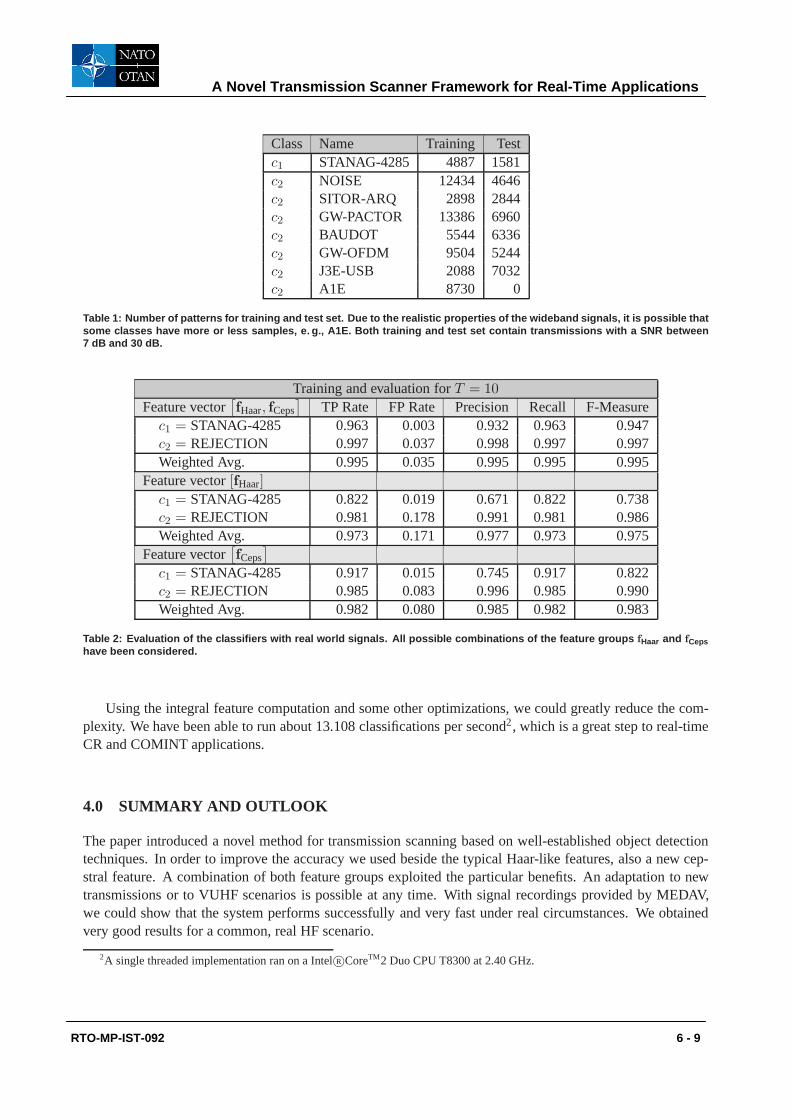
Class Name Training Testc1 STANAG-4285 4887 1581c2 NOISE 12434 4646c2 SITOR-ARQ 2898 2844c2 GW-PACTOR 13386 6960c2 BAUDOT 5544 6336c2 GW-OFDM 9504 5244c2 J3E-USB 2088 7032c2 A1E 8730 0
Table 1: Number of patterns for training and test set. Due to th e realistic properties of the wideband signals, it is possible thatsome classes have more or less samples, e. g., A1E. Both training and test set contain transmissions with a SNR between7 dB and 30 dB.
Training and evaluation forT = 10
Feature vector[
fHaar, fCeps]
TP Rate FP Rate Precision Recall F-Measurec1 = STANAG-4285 0.963 0.003 0.932 0.963 0.947c2 = REJECTION 0.997 0.037 0.998 0.997 0.997Weighted Avg. 0.995 0.035 0.995 0.995 0.995
Feature vector[fHaar]
c1 = STANAG-4285 0.822 0.019 0.671 0.822 0.738c2 = REJECTION 0.981 0.178 0.991 0.981 0.986Weighted Avg. 0.973 0.171 0.977 0.973 0.975
Feature vector[
fCeps]
c1 = STANAG-4285 0.917 0.015 0.745 0.917 0.822c2 = REJECTION 0.985 0.083 0.996 0.985 0.990Weighted Avg. 0.982 0.080 0.985 0.982 0.983
Table 2: Evaluation of the classifiers with real world signals . All possible combinations of the feature groups fHaar and fCepshave been considered.
Using the integral feature computation and some other optimizations, we could greatly reduce the com-plexity. We have been able to run about 13.108 classifications per second2, which is a great step to real-timeCR and COMINT applications.
4.0 SUMMARY AND OUTLOOK
The paper introduced a novel method for transmission scanning based on well-established object detectiontechniques. In order to improve the accuracy we used beside the typical Haar-like features, also a new cep-stral feature. A combination of both feature groups exploited the particular benefits. An adaptation to newtransmissions or to VUHF scenarios is possible at any time. With signal recordings provided by MEDAV,we could show that the system performs successfully and very fast under real circumstances. We obtainedvery good results for a common, real HF scenario.
2A single threaded implementation ran on a IntelR©CoreTM2 Duo CPU T8300 at 2.40 GHz.
A Novel Transmission Scanner Framework for Real-Time Applications
RTO-MP-IST-092 6 - 9
In future we will implement an efficient multiclass version ofthe transmission scanner, based on featuresharing. In order to show the flexibility of our system, we will focus on VUHF transmission standards.
REFERENCES
[1] Mitola III, J. and Maguire, Jr., G., “Cognitive Radio: Making Software Radios More Personal,”Per-sonal Communications, IEEE, Vol. 6, No. 4, Aug 1999, pp. 13–18.
[2] Mitola III, J., “Cognitive Radio for Flexible Mobile Multimedia Communications.”MONET, Vol. 6,No. 5, 2001, pp. 435–441.
[3] Mitola III, J., “”Software Radios: Survey, Critical Evaluation and Future Directions”,”Aerospace andElectronic Systems Magazine, IEEE, Vol. 8, No. 4, Apr 1993, pp. 25–36.
[4] Prosch, R.,Technical Handbook For Radio Monitoring I., Book on Demand GmbH, 1st ed., 2007.
[5] Azzouz, E. and Nandi, A.,Automatic Modulation Recognition of Communication Signals, KluwerAcademic Publishers, 1996.
[6] Fargues, M. and Hatzichristos, G., “A Hierarchical Approach to the Classifiaction of Digital Modu-lations in Multipath Environments,” Tech. rep., Department of Electrical and Computer Engineering,May 2001, NPS-EC-01-004.
[7] Wikstrom, M., “A Survey of Modulation Classification Methods for QAM Signals,” Tech. rep., Com-mand and Control Systems, 2005.
[8] Dobre, O., Abdi, A., Bar-Ness, Y., and Su, W., “A Survey of Automatic Modulation ClassificationTechniques: Classical Approaches and New Trends,”IET Communications, Vol. 1, 2007, pp. 137–156.
[9] Digham, F., Alouini, M., and Simon, M., “On the Energy Detection of Unknown Signals Over FadingChannels,”IEEE Transactions on Communications, Vol. 55, No. 1, 2007.
[10] Gardner, W. and Spooner, C., “Cyclic spectral analysis for signal detection and modulation recogni-tion,” Military Communications Conference, 1988. MILCOM 88, Conference record. ’21st CenturyMilitary Communications - What’s Possible?’. 1988 IEEE, Vol. 2, Oct 1988, pp. 419–424.
[11] Gardner, W., “Exploitation of spectral redundancy in cyclostationary signals,”Signal Processing Mag-azine, IEEE, Vol. 8, No. 2, Apr 1991, pp. 14–36.
[12] Viola, P. and Jones, M., “Robust Real-Time Face Detection.”Int. J. Comput. Vision, Vol. 57, No. 2,2004, pp. 137–154.
[13] MEDAV GmbH, “ComCatTM-Tuner - CCT-NG,” 2006.
[14] Papageorgiou, C., Oren, M., and Poggio, T., “A General Framework for Object Detection,”ICCV,1998, pp. 555–562.
[15] Bogert, B., Healy, M., and Tukey, J., “The Frequency Analysis of Time Series for Echoes: cepstrum,pseudo-Autocovariance, Cross-Cepstrum, and saphe cracking,”Proc. Symp. Time Series Analysis, Ed.:M. Rosenblatt,John Wiley, 1963, pp. 209–243.
A Novel Transmission Scanner Framework for Real-Time Applications
6 - 10 RTO-MP-IST-092
[16] Freund and Schapire, “A Decision-Theoretic Generalization of On-Line Learning and an Applicationto Boosting.”JCSS: Journal of Computer and System Sciences, Vol. 55, 1997.
A Novel Transmission Scanner Framework for Real-Time Applications
RTO-MP-IST-092 6 - 11
0 1000 2000 3000
0
0.1
0.2
0.3
0.4
0.50 0.1 0.2
0
2
4
6
8
10x 10
4Spectrogram.
Tim
ein
[s].
Frequency in [kHz].
Cepstrum.
Time in [s].
(a)
0 1000 2000 3000
0
0.1
0.2
0.3
0.4
0.50 0.1 0.2
0
0.5
1
1.5
2x 10
5Spectrogram.
Tim
ein
[s].
Frequency in [kHz].
Cepstrum.
Time in [s].
(b)
Figure 6: Spectrograms and cepstra of both a high SNR and a low SNR STANAG-4285 transmission. The dimensions of thespectrogram are equivalent to the dimensions of XM.
A Novel Transmission Scanner Framework for Real-Time Applications
6 - 12 RTO-MP-IST-092
−45
−40
−35
−30
−25
−20
−15
−10
−5
0
Results of the transmission scanner.
Tim
ein
[s].
Frequency in [kHz].
Pow
erin
[dB
].
2.1
2.2
2.3
2.4
2.5
2.6
2.7
2.8
2.9
370 380 390 400 410 420 430
Figure 7: Part of an absolute, logarithmic wideband spectrogram. It contains the results of the transmission scanner, markedas green boxes. This classifier has been trained with a combination of fHaar and fCeps . Every STANAG-4285 transmission hasbeen found. There is no incorrect hit in this part of the wideband spectrogram.
A Novel Transmission Scanner Framework for Real-Time Applications
RTO-MP-IST-092 6 - 13
A Novel Transmission Scanner Framework for Real-Time Applications
6 - 14 RTO-MP-IST-092