a new graphical method for pinch analysis and energy ... · are colder than heat sinks. therefore...
TRANSCRIPT

CHEMICAL ENGINEERING TRANSACTIONS
VOL. 43, 2015
A publication of
The Italian Association of Chemical Engineering Online at www.aidic.it/cet
Chief Editors: Sauro Pierucci, Jiří J. Klemeš Copyright © 2015, AIDIC Servizi S.r.l., ISBN 978-88-95608-34-1; ISSN 2283-9216
A New Graphical Method for Pinch Analysis and Energy Integration
Mamdouh A. Gadalla
The British University in Egypt, Chemical Engineering Dept. El-Shorouk City, Egypt 11837 [email protected]
This research proposes a new graphical method for the analysis of heat recovery systems, applicable to both phases of grassroots and revamping. The new graphical method is based on plotting temperatures of process hot streams versus temperatures of process cold streams. A new graph is constructed for representing existing preheat trains. For a given preheat train, each existing exchanger is represented by a straight line, whose slope is proportional to the ratio of heat capacities and flows. Further, the length of each exchanger line is related to the heat flow transferred across this exchanger. This new graphical representation can easily identify exchangers-across-the-pinch, Network Pinch, pinching matches and improper placement of fuel consumption. Furthermore, such a graph can recognise promising modifications to improve the energy performance and hence less fuel and cooling water requirement. Graphs developed in this work can be used to analyse the energy performance of existing networks with respect to energy targets. They can also be used in junction with the background process to modify basic designs or existing network for better energy integration opportunities and minimum fuel demands.
1. Introduction
Pinch technology is an outstanding methodology for energy saving in processes where heating and cooling are characterising the processing operations. The concept of Pinch Analysis is originally discovered and further developed in late 70s by Hohman (1971), Huang and Elshout (1976), Linnhoff et al. (1979, 1982) and Umeda et al. (1978). Yet it is evolving along the years and its applicability is broadening, mainly for saving material flows (El-Halwagi, 2012) and energy supplies. Pinch Analysis is found very popular and successful given the fact that it is conceptually simple and with impressive results, i.e. 10 to 35% in energy savings (NR Canada, 2003). The Pinch Analysis principles are set of rules, established using graphical representations such as Composite Curves, or by calculation-based methods known as the ‘Problem Table Algorithm’ (Linnhoff and Flower, 1978). Smith (2005) and Klemes (2013) provide a systematic procedure on how to construct Composite Curves for a given process, and outline the main features of such graphs. Maximum heat recovery is achieved within a given process, by complying with the principles of Pinch Analysis in the design for a given ∆Tmin. Also in retrofit situation, the energy efficiency can be improved by removing violations to these principles. Existing HENs are conventionally represented using grid diagrams. These diagrams are kind of sketches and can describe existing networks with details of connections but cannot interpret the principles of Pinch Analysis qualitatively nor quantify the energy inefficiencies particularly for very large HENs. In addition, the location of Network Pinch and Pinched Matches are not easy to detect using HEN grid diagrams, particularly for very complex networks, such as in refining processes. At the time that Composite Curves can describe fully new HEN designs, existing exchangers cannot be represented using such curves. It is valuable then if the existing network can be represented fully with its exact details of stream matches, temperatures and duties for better understanding to improve energy performances. It is also significant to graphically identify the locations of
DOI: 10.3303/CET1543216
Please cite this article as: Gadalla M., 2015, A new graphical method for pinch analysis applications: energy integration, Chemical Engineering Transactions, 43, 1291-1296 DOI: 10.3303/CET1543216
1291

Network Pinch and limiting exchanger matches. Having represented an existing HEN with all associated details using new graphs, the Pinch Analysis principles and guidelines can be interpreted easier and thus energy improvement are obtained. Such graphs would be a key in performing revamping studies. The current research aims to tackle these previous observations and is to develop a new graphical tool featured with a new visualisation capability that will address such issues in existing methods.
2. A New Graphical Representation for Energy Analysis
The new graphical representation is obtained by plotting the temperatures of hot streams entering and leaving an exchanger unit versus those corresponding temperatures for cold streams. Thus, the y-axis is to represent the temperatures of all hot streams around exchangers whereas the x-axis is representing the corresponding cold streams temperatures, as demonstrated in Figure 1. Any process or utility hot stream can be represented by two horizontal lines on the diagram of Figure 1. The upper horizontal line will represent the supply temperature of the stream, whereas the lower horizontal line will represent the target temperature. Similarly, cold process or utility streams will be represented through two vertical lines, one for the supply temperatures (to left side) and another for the target temperatures (to right side). The pinch temperatures of the process are plotted on the graph as a vertical line for the cold pinch temperature and a horizontal line for the hot pinch temperature. These two lines divide the graph into four distinct regions, left upper, right upper, left lower, right lower regions. Each region reflects the location of a group of exchanger matches within the heat exchanger network, as follows: 1. Left upper region: exchangers located in this region represent the matches exchanging or integrating heat
between hot streams above the pinch with cold streams below the pinch. 2. Right upper region: exchangers located in this region represent the matches exchanging or integrating
heat between hot streams above the pinch with cold streams above the pinch. 3. Left lower region: exchangers located in this region represent the matches exchanging or integrating heat
between hot streams below the pinch with cold streams below the pinch. 4. Right lower region: exchangers located in this region represent the matches exchanging or integrating
heat between hot streams below the pinch with cold streams above the pinch.
Figure 1: A new graphical representation for energy analysis
The new graphical representation shown in Figure 1 features the following: 5. Any point located inside the graph is defined by two temperature coordinates, i.e. (Tc, Th). 6. The minimum temperature approach difference appears twice, first with the vertical cold pinch
temperature and then with the horizontal hot pinch temperature. 7. The diagonal line in the graph represents the case when hot stream temperatures approach cold stream
temperatures or Th=Tc. Accordingly the diagonal divides the graph into two regions of heat integration, feasible energy integration above the diagonal, and infeasible energy integration below the diagonal. The infeasibility region below the diagonal is due to the fact that within this region any possible heat sources
Cold pinch temperature
Hot pinch temperature
Hot Above/Cold Below
Hot Above/Cold Above
Hot Below/Cold Below
Hot Below/Cold Above
∆Tmin
∆Tmin
1292

are colder than heat sinks. Therefore heat integration is thermodynamically impossible. This implies that all exchangers integrating heat must lie above the diagonal.
8. The ‘Right Upper Region’ is in energy balance with external hot utilities. Thus it is expected in this region that only heaters may appear.
9. The ‘Left Lower Region’ is similarly in energy balance with external cold utilities. Thus it is only allowed for energy efficient networks to have coolers within this region.
10. Exchanger matches located in the ‘Left Upper Region’ would transfer heat across the pinch. The heat integration of this region is still feasible, although it violates Pinch Analysis principles.
11. Energy integration or heat recovery for maximum energy efficiency will only take place through the exchangers in the two regions ‘Right Upper’ and ‘Left Lower’. Although the situation in many real plants of refining units or preheat trains is different that several exchanger matches are exchanging heat and are located within the region ‘Left Upper Region'. This last situation of poor design leads to inefficient heat integration or recovery in existing refineries and preheat trains. Thus considerable amounts of fuels and cooling utilities are consumed as a result of such a poor design. Therefore, these exchanger matches need particular consideration if the energy efficiency is to be maximised.
12. Coolers located in the Left Upper Region’ violate the Pinch Analysis principles. For this, the identification of such units is useful and would help in increasing the energy efficiency of an existing networks, i.e. heat loads on these coolers can be exploited for more energy integration. This feature may help in creating paths for heat integration. A path is linking a hot process stream and cold process stream with an exchanger unit at the presence of a relevant cooler and heater for these streams (Smith, 2005).
13. Exchanger matches touching the pinch temperatures from one point signify that these matches start or end heat integration between streams at the corresponding pinch temperatures, i.e. energy integration takes place at the pinch temperatures.
Consider a heat exchanger hx, transferring heat between a hot stream H and a cold stream C with a heat integration load of Q. The inlet temperature of hot and cold streams are Thin and Tcin respectively, while these streams leave the exchanger unit at Thout for the hot stream and Tcout for the cold stream. The hot stream has a mass flow rate of mh and a specific heat of Cph. On the other hand, the cold stream has a mass flow rate of mc and a heat capacity Cpc. Performing an energy balance on the given exchanger match results in: = × × − = × × ∆ (1) = × × − = × × ∆ (2)
If the heat capacities of hot and cold streams are considered constant across the range of temperatures, then Eq(1) and Eq(2) can be written as: = × − = × ∆ (3) = × − = × ∆ (4)
where, is the mean heat capacity flow for the hot stream, and is the mean heat capacity flow for the cold stream. Note that Eq(1) and Eq(2) imply heat transfer based on sensible heat; however, in cases of phase changes, terms for latent heats are added. Dividing Eq(3) by Eq(4): ⁄ = ∆ ∆⁄ (5)
If the exchanger match is plotted on the new graphical representation as a straight line (with an arrow), then the line should start at the point (Tcout, Thin) and end at (Tcin, Thout); see Figure 2. The exchanger line is bounded by the temperatures of both the hot stream and cold stream. The hot temperatures could be the supply and target temperatures of the hot stream, or some of its intermediate temperatures. Likewise, the cold temperatures could represent the supply and target temperatures of the cold stream or its intermediate temperatures. Given the assumption of constant specific heat within the range of temperatures, exchangers are represented by straight lines. Still, variable thermal properties can be taken into account in the plot. The slope of the line representing exchangers is given by Eq(5), as the ratio between the heat capacity flows of cold stream to hot stream or the temperature difference of hot stream divided by that of the cold stream. Thus the vertical distance of the line is equivalent to ∆Th, while the horizontal distance is equivalent to ∆Tc. Note that the exchanger line is vertical for vaporisation and horizontal for condensation.
1293

Figure 2: Representation of an exchanger match on the new graphical plot
A significant feature observed in Figure 2 is that the vertical distance between the straight line and the diagonal gives the temperature driving force profile across each exchanger (∆T). The closet the exchanger line to the diagonal, the smallest the temperature driving force the exchanger has. Then if the line is parallel to the diagonal, this implies a constant temperature driving force along the exchanger match. An exchanger match becomes a limiting for heat recovery as the line approaches the diagonal, and hence a decreased temperature driving force. This feature would help in identifying limiting exchanger matches for heat recovery by locating those matches with the smallest vertical distances to the diagonal, and hence temperature driving forces. The maximum heat recovery for an existing network is identified when exchanger matches tend to touch the diagonal in the graphical representation, where Th=Tc. Thus, these matches are pinching matches whenever heat recovery is maximised and a Network Pinch takes place.
3. An Illustrative Example – An Existing HEN
An existing heat exchanger network presented in previous work by Asante and Zhu (1997) is considered for the application of the new graphical representation. The case represents a real network of five exchanger units, as shown in Figure 3. The existing network has four hot streams and one cold streams. The existing network consumes hot utility and cold utility at the rate of 160 MW and 50 MW respectively. The existing heat exchanger network is described using the new graphical method, and is demonstrated in Figure 4. A minimum temperature approach difference of 10 degrees Celsius is used in the new representation. Cold stream c1 is displayed by the vertical line at 100 oC for the supply temperature, and the vertical line at 190 oC for the target temperature. In the same way, hot stream h1 is represented through two horizontal lines at 160 oC and 120 oC for the supply and target temperatures respectively. Hot stream h4 is represented between the supply temperature of 200 oC and target temperature of 130 oC. For this ∆Tmin, the pinch temperatures for the process streams are 150 and 140 oC for the hot and cold respectively; these pinch temperatures are easily obtained by using any traditional Pinch Analysis method such as given by Smith (2005). The energy targets for this process at ∆Tmin=10 oC are 125 MW and 15 MW for hot energy and cold energy respectively. It is obvious that the existing network performs away from the energy targets. External hot utility is consumed by 28% more than energy target. This means that the real process excessively consumes a fuel oil or natural gas to provide the process heating. Therefore, a potential of fuel savings is available at the rate of 28%. The existing heat exchanger network shown in Figure 4 can then easily be evaluated with respect to Pinch Analysis principles and energy targets, as follows: (1) The heater E104 is appropriately placed in the region ‘Right Upper’. (2) The two coolers E100 and E106 are partly inappropriately placed in the region ‘Left Upper’, where energy
integration is to take place across the pinch.
Th(C)
Tc (C)
Th
in
Th
out
Tc
outT
c
in
∆Th
Th=T
c
∆Tc
Hot supply
Hot target
Cold supply
Cold target
ΔT
1294

(3) The exchanger matches E103 and E101 are integrating heat consistently with the Pinch design method. E103 is integrating energy from hot stream above the pinch to a cold stream above the pinch. Likewise, E101 is transferring the heat from hot stream below the pinch to a cold stream below the pinch. This means a Network Pinch may probably takes place at this exchanger match when energy integration is to be performed.
(4) The exchanger E101 is close to the diagonal, hence it is a potential limiting exchanger in energy saving projects.
(5) The exchanger E102 is integrating heat across the pinch, i.e. exchanging heat from above the pinch into below the pinch.
(6) For the current performance, there appears no pinching matches as none of the exchanger matches (represented by lines) touch the diagonal (∆Tmin=0 oC) or the line corresponding to ∆Tmin=10 oC. On the contrary, there is still a positive vertical distance between the exchanger lines and the diagonal. This implies positive temperature driving forces and hence more potential for energy integration.
Figure 3: An existing heat exchanger network (numbers below exchangers refer to heat duties in MW)
Figure 4: A new graphical representation for an existing HEN (small arrows refer to streams h1, h4 and c1)
Guided by the conclusions drawn from the graphical method of Figure 4, a modified HEN is proposed in Figure 5. The modifications proposed to the existing HEN are: modification #1; relocating the cooler E100 to
75
100
125
150
175
200
225
250
275
0 25 50 75 100 125 150 175 200 225 250
Hot
Tem
pera
ture
, C
Cold Temperature, C
E102
E104
E103
E101E100
E106
c1 c1
h1
h1
h4
h4
Th = T
c
Hot pinch
Cold pinch Th=T
c+ΔT
min
C
H
20
160 oC
200 oC
190 oC
160 oC
135 oC
120 oC
2040160
h1
h2
c1
150 oC 120 oCh3
200 oC 130 oCh4
100 oC
C
140
30
160 oC
150 oC 140 oC
E100
E106
E104
E103
E102
E101
1295
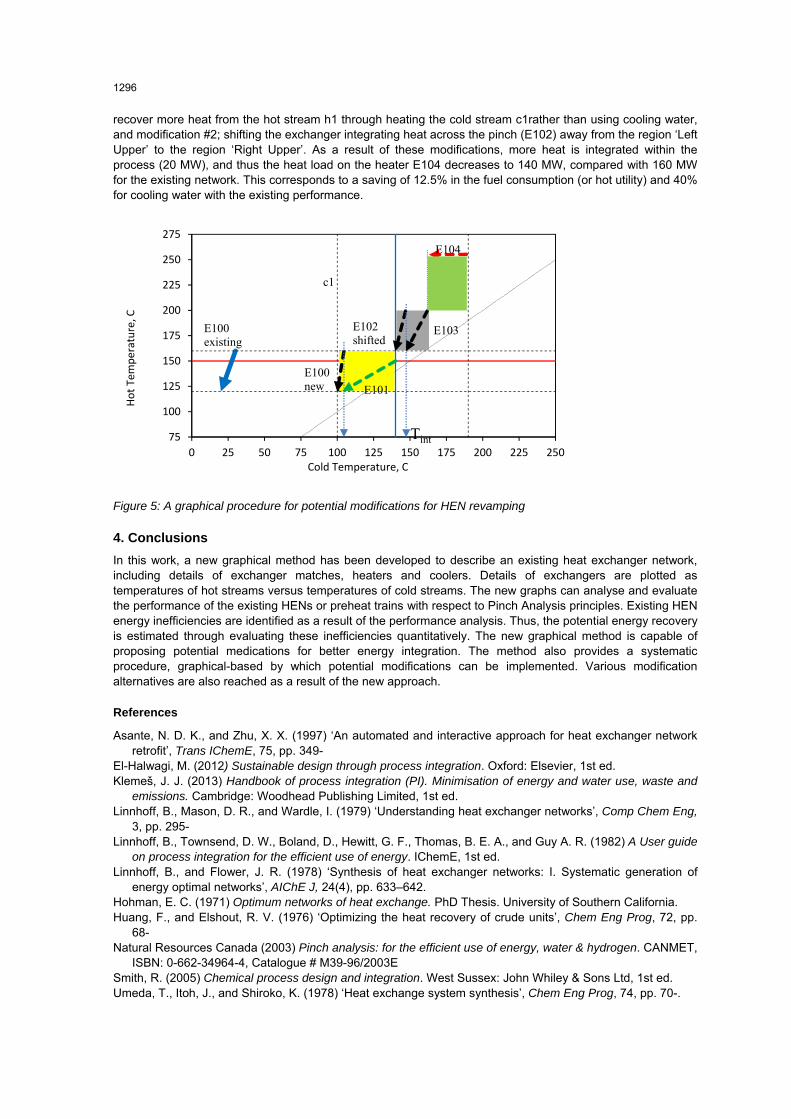
recover more heat from the hot stream h1 through heating the cold stream c1rather than using cooling water, and modification #2; shifting the exchanger integrating heat across the pinch (E102) away from the region ‘Left Upper’ to the region ‘Right Upper’. As a result of these modifications, more heat is integrated within the process (20 MW), and thus the heat load on the heater E104 decreases to 140 MW, compared with 160 MW for the existing network. This corresponds to a saving of 12.5% in the fuel consumption (or hot utility) and 40% for cooling water with the existing performance.
Figure 5: A graphical procedure for potential modifications for HEN revamping
4. Conclusions
In this work, a new graphical method has been developed to describe an existing heat exchanger network, including details of exchanger matches, heaters and coolers. Details of exchangers are plotted as temperatures of hot streams versus temperatures of cold streams. The new graphs can analyse and evaluate the performance of the existing HENs or preheat trains with respect to Pinch Analysis principles. Existing HEN energy inefficiencies are identified as a result of the performance analysis. Thus, the potential energy recovery is estimated through evaluating these inefficiencies quantitatively. The new graphical method is capable of proposing potential medications for better energy integration. The method also provides a systematic procedure, graphical-based by which potential modifications can be implemented. Various modification alternatives are also reached as a result of the new approach.
References
Asante, N. D. K., and Zhu, X. X. (1997) ‘An automated and interactive approach for heat exchanger network retrofit’, Trans IChemE, 75, pp. 349-
El-Halwagi, M. (2012) Sustainable design through process integration. Oxford: Elsevier, 1st ed. Klemeš, J. J. (2013) Handbook of process integration (PI). Minimisation of energy and water use, waste and
emissions. Cambridge: Woodhead Publishing Limited, 1st ed. Linnhoff, B., Mason, D. R., and Wardle, I. (1979) ‘Understanding heat exchanger networks’, Comp Chem Eng,
3, pp. 295- Linnhoff, B., Townsend, D. W., Boland, D., Hewitt, G. F., Thomas, B. E. A., and Guy A. R. (1982) A User guide
on process integration for the efficient use of energy. IChemE, 1st ed. Linnhoff, B., and Flower, J. R. (1978) ‘Synthesis of heat exchanger networks: I. Systematic generation of
energy optimal networks’, AIChE J, 24(4), pp. 633–642. Hohman, E. C. (1971) Optimum networks of heat exchange. PhD Thesis. University of Southern California. Huang, F., and Elshout, R. V. (1976) ‘Optimizing the heat recovery of crude units’, Chem Eng Prog, 72, pp.
68- Natural Resources Canada (2003) Pinch analysis: for the efficient use of energy, water & hydrogen. CANMET,
ISBN: 0-662-34964-4, Catalogue # M39-96/2003E Smith, R. (2005) Chemical process design and integration. West Sussex: John Whiley & Sons Ltd, 1st ed. Umeda, T., Itoh, J., and Shiroko, K. (1978) ‘Heat exchange system synthesis’, Chem Eng Prog, 74, pp. 70-.
75
100
125
150
175
200
225
250
275
0 25 50 75 100 125 150 175 200 225 250
Hot T
empe
ratu
re, C
Cold Temperature, C
E101
E100existing
E102shifted
c1 c1
E100new
E103
Tint
E104
1296