a multi-sensor water vapor climatology
TRANSCRIPT

National Aeronautics and Space Administration
Jet Propulsion Laboratory California Institute of Technology Pasadena, California
A Multi-Sensor Water Vapor Climatology
Eric J. Fetzer, Evan F. Fishbein, Brian H. Kahn, Bjorn Lambrigtsen, Joao Teixeira, Bill Read and Brian D. Wilson
Jet Propulsion Laboratory, California Institute of Technology
Sounding Science Workshop Caltech, May 7, 2009
National Aeronautics and Space Administration
Jet Propulsion Laboratory California Institute of Technology Pasadena, California
Our MEaSUREs Proposal
2
ROSES 2006 MEaSUREs
NRA NNH06ZDA001N WATER VAPOR CLIMATE RECORD
i Use or disclosure of information contained on this sheet is subject to the restriction on the Cover Page of this proposal.
A Multi-Sensor Water Vapor Climate Data Record Using Cloud Classification
Eric J. Fetzer, Evan F. Fishbein, Brian D. Wilson, Joao Teixeira, Brian H. Kahn, Bjorn H.
Lambrigtsen, William G. Read and Tim Barnett
Contents
1 Science, Technical, and Management ................................................................................ 1-1
1.1 Introduction........................................................................................................... 1-1
1.2 Objectives and Expected Significance.................................................................... 1-2
1.2.1 Objectives ................................................................................................... 1-2
1.2.2 Expected Significance ................................................................................. 1-3
1.3 Technical Approach and Methodology................................................................... 1-5
1.3.1 Cloud Classification .................................................................................... 1-5
1.3.2 Effects of Clouds on Water Vapor Sampling from Space ............................. 1-5
1.3.3 Using Cloud Classes to Monitor Long-Term Variability of Water Vapor..... 1-7
1.3.4 Creating Water Vapor Climatologies by Cloud Classes................................ 1-8
1.3.5 Water Vapor Data Sets from Operational Weather Sounders........................ 1-9
1.3.6 Correcting Sampling and Characterizing Diurnal Variability ......................1-10
1.3.7 Upper Tropospheric RHi from UARS/MLS and Aura/MLS........................1-11
1.3.8 Three Science Topics..................................................................................1-13
1.3.9 SciFlo Implementation................................................................................1-14
1.4 Relevance to NASA Programs and ESDWG participation ....................................1-17
1.5 Work Plan ............................................................................................................1-18
1.5.1 Statement of Work......................................................................................1-18
1.5.2 Key Milestones...........................................................................................1-19
1.5.3 Management Structure................................................................................. 1-2
1.5.4 Contributions of Principal Investigator and Key Personnel .......................... 1-2
1.5.5 Collaborators/Consultants............................................................................ 1-4
2 Acronyms, References and Citations ................................................................................. 2-1
2.1 Acronyms.............................................................................................................. 2-1
2.2 References and Citations........................................................................................ 2-2
3 Facilities and Equipment ................................................................................................... 3-1
3.1 Jet Propulsion Laboratory ...................................................................................... 3-1
4 Budget Justification........................................................................................................... 4-1
4.1 JPL Direct Labor ................................................................................................... 4-1
5 Biographical Sketch .......................................................................................................... 5-1
5.1 Principal Investigator............................................................................................. 5-1
5.2 Co-Investigators .................................................................................................... 5-3
6 Current and Pending Support............................................................................................. 6-1
6.1 Current Awards ..................................................................................................... 6-1
6.2 Pending Awards .................................................................................................... 6-2
7 Statements of Commitment ............................................................................................... 7-2
National Aeronautics and Space Administration
Jet Propulsion Laboratory California Institute of Technology Pasadena, California
What
• Create a merged, reconciled record of water vapor from all sensors, but relating clouds and water vapor.
• We are coordinating with the NVAP project.
– We will provide a ʻseamlessʼ record between earlier sensors (TOVS, SSM/I) and A-Train.
• Our Grand Goal: Extend back into the disco-era TOVS data.
3
National Aeronautics and Space Administration
Jet Propulsion Laboratory California Institute of Technology Pasadena, California
Some Questions • Can we simultaneously monitor water vapor and changes in
its viewing conditions (due to clouds in the IR, precip in the MW), over years to decades?
• How do moist thermodynamics vary with cloud state? – Climate model physics is regime dependent.
• Is the relationship between cloud state and water vapor universal?
• How dominant are effects in the radiatively important middle and upper troposphere?
• How precise and accurate should earlier sounders be to separate trends in water vapor by cloud state? – Assuming cloud state can be well characterized by ISCCP or
similar observations. 4

National Aeronautics and Space Administration
Jet Propulsion Laboratory California Institute of Technology Pasadena, California
Background:AIRS Mean Total Water Vapor
25 Dec 02-9 Jan 03
5
Fetzer, E. J., et al., 2006: Biases in total precipitable water vapor climatologies from Atmospheric Infrared Sounder and Advanced Microwave Scanning Radiometer, J. Geophys. Res., 111, D09S16, doi:10.1029/2005JD006598.

National Aeronautics and Space Administration
Jet Propulsion Laboratory California Institute of Technology Pasadena, California
Fraction of AIRS Profiles in Mean (Yields)25 Dec 02-9 Jan 03
6
Fetzer, E. J., et al., 2006: Biases in total precipitable water vapor climatologies from Atmospheric Infrared Sounder and Advanced Microwave Scanning Radiometer, J. Geophys. Res., 111, D09S16, doi:10.1029/2005JD006598.
National Aeronautics and Space Administration
Jet Propulsion Laboratory California Institute of Technology Pasadena, California
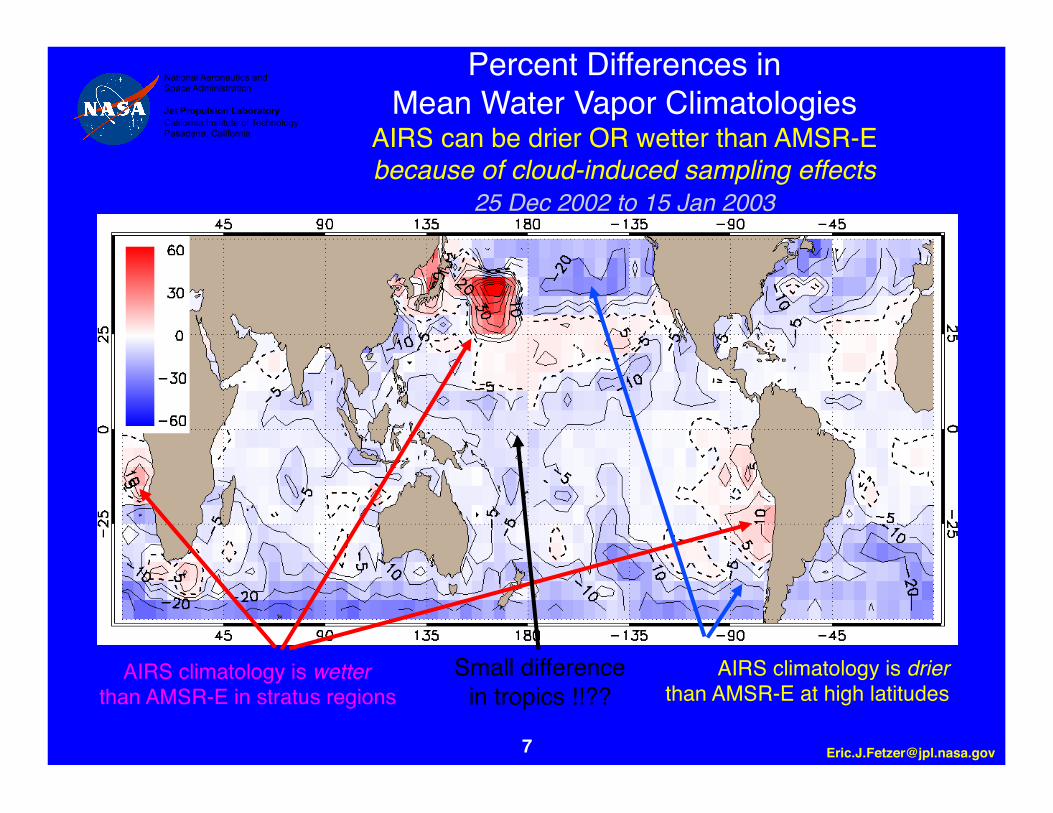
Percent Differences inMean Water Vapor Climatologies
AIRS can be drier OR wetter than AMSR-Ebecause of cloud-induced sampling effects
25 Dec 2002 to 15 Jan 2003
AIRS climatology is wetter than AMSR-E in stratus regions
AIRS climatology is drier than AMSR-E at high latitudes
Small difference in tropics !!??
National Aeronautics and Space Administration
Jet Propulsion Laboratory California Institute of Technology Pasadena, California
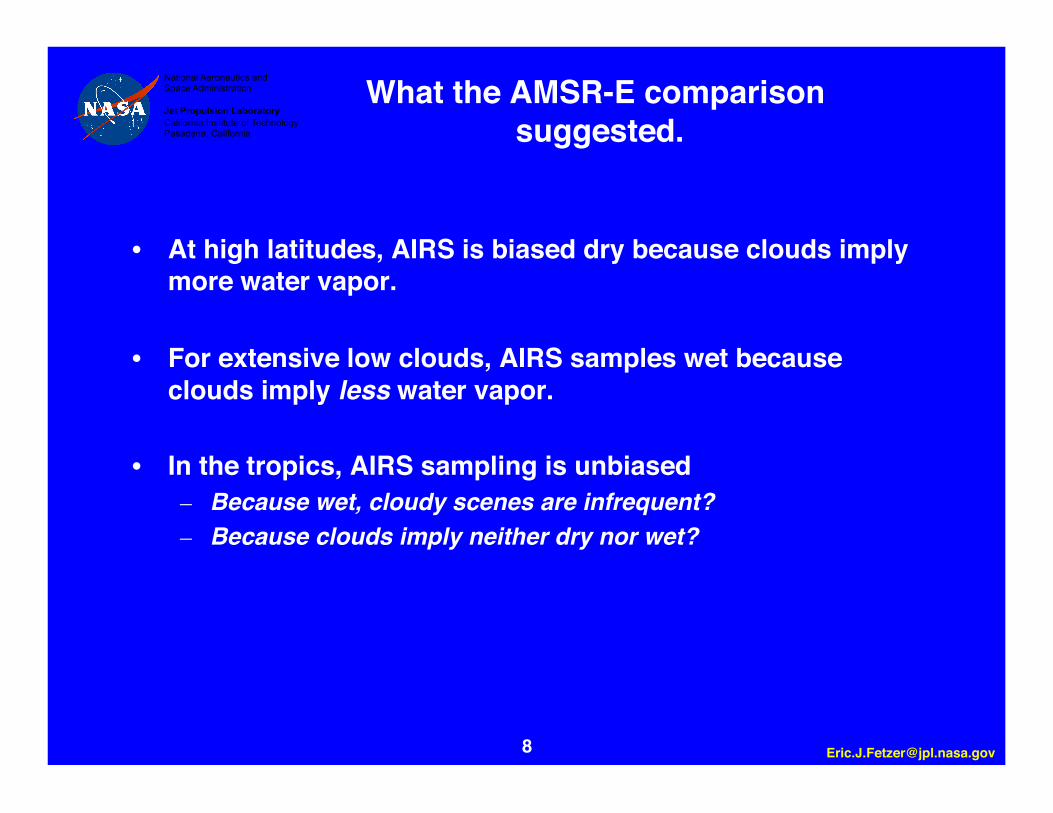
What the AMSR-E comparison suggested.
• At high latitudes, AIRS is biased dry because clouds imply more water vapor.
• For extensive low clouds, AIRS samples wet because clouds imply less water vapor.
• In the tropics, AIRS sampling is unbiased – Because wet, cloudy scenes are infrequent? – Because clouds imply neither dry nor wet?
8

National Aeronautics and Space Administration
Jet Propulsion Laboratory California Institute of Technology Pasadena, California
1. Atmospheric Infrared Sounder (AIRS) water vapor profiles. 2. CloudSat cloud classes overlie AIRS near nadir.
Showing Data from Two Independent Instruments (Same data was shown by Sean Casey yesterday)
9
CloudSat AIRS
X
National Aeronautics and Space Administration
Jet Propulsion Laboratory California Institute of Technology Pasadena, California
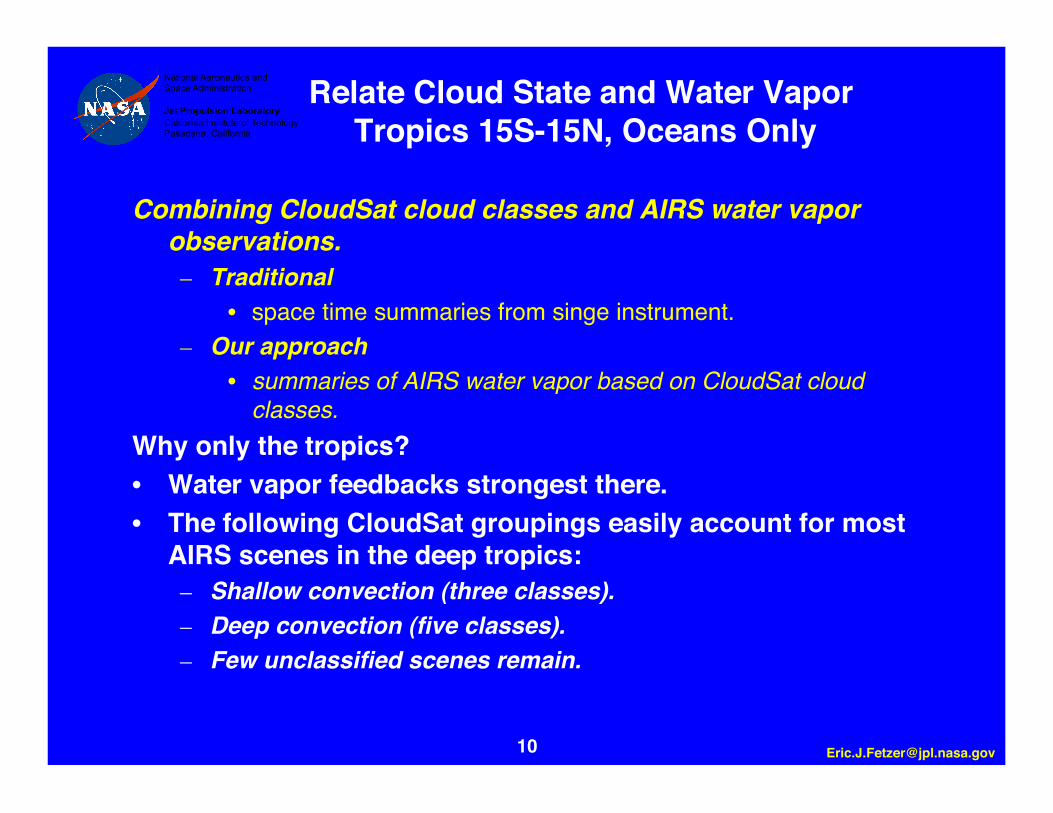
Relate Cloud State and Water Vapor Tropics 15S-15N, Oceans Only
Combining CloudSat cloud classes and AIRS water vapor observations. – Traditional
• space time summaries from singe instrument. – Our approach
• summaries of AIRS water vapor based on CloudSat cloud classes.
Why only the tropics? • Water vapor feedbacks strongest there. • The following CloudSat groupings easily account for most
AIRS scenes in the deep tropics: – Shallow convection (three classes). – Deep convection (five classes). – Few unclassified scenes remain.
10

National Aeronautics and Space Administration
Jet Propulsion Laboratory California Institute of Technology Pasadena, California
AIRS-CloudSat Matched Data
Color fill = CloudSat Class (Sassen and Wang, 2008, GRL)
11
Black lines: AIRS ʻbestʼ retrieval altitude X: no AIRS tropospheric profiling.
Western Equatorial Pacific
National Aeronautics and Space Administration
Jet Propulsion Laboratory California Institute of Technology Pasadena, California
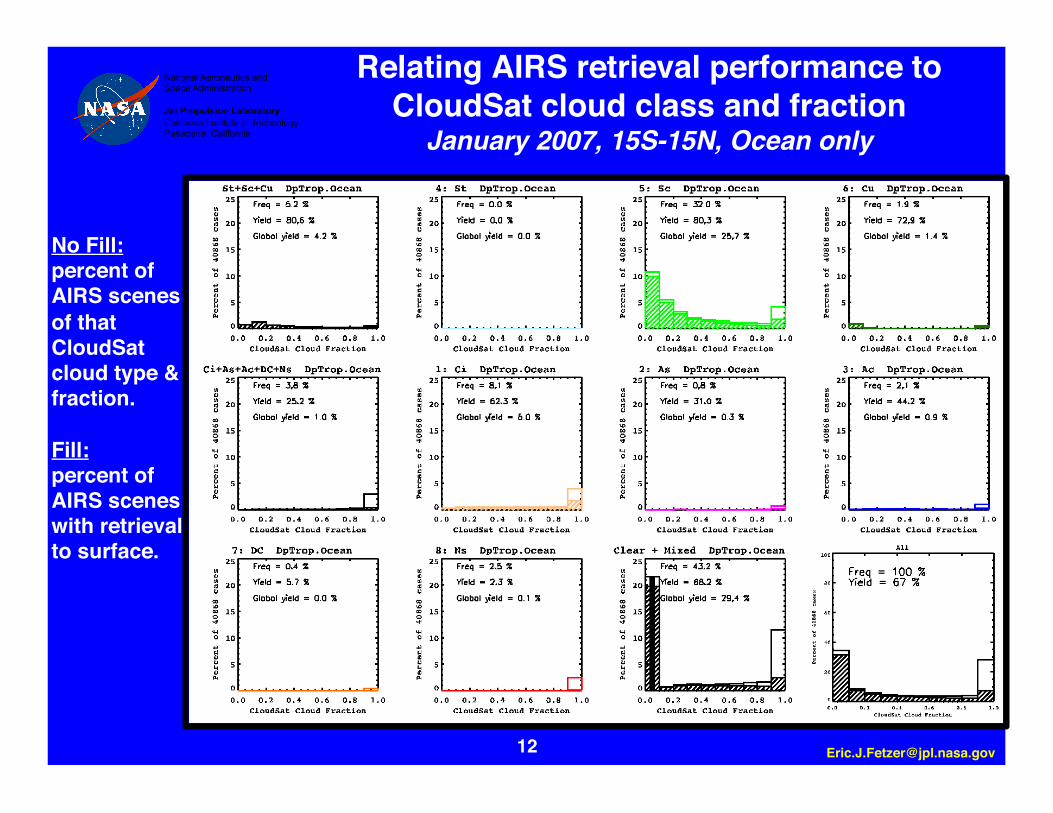
Relating AIRS retrieval performance toCloudSat cloud class and fraction
January 2007, 15S-15N, Ocean only
12
No Fill: percent of AIRS scenes of that CloudSat cloud type & fraction.
Fill: percent of AIRS scenes with retrieval to surface.
National Aeronautics and Space Administration
Jet Propulsion Laboratory California Institute of Technology Pasadena, California
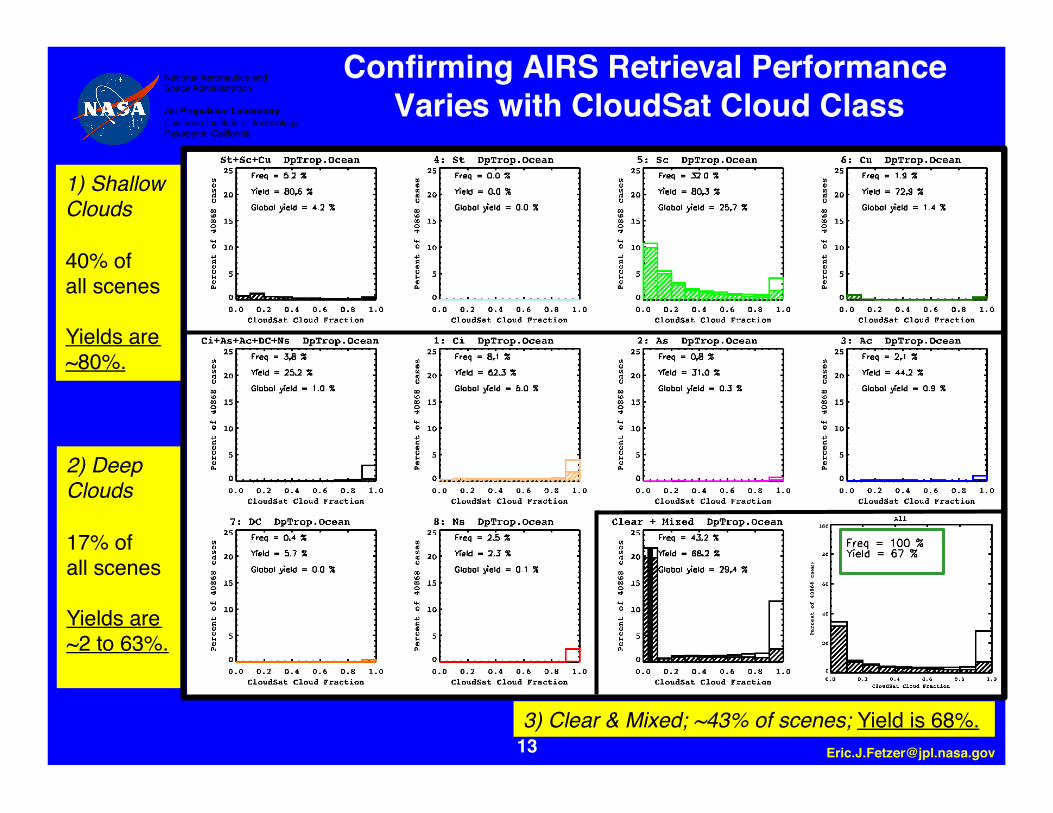
2) Deep Clouds
17% of all scenes
Yields are ~2 to 63%.
1) Shallow Clouds
40% of all scenes
Yields are ~80%.
Confirming AIRS Retrieval Performance Varies with CloudSat Cloud Class
13 3) Clear & Mixed; ~43% of scenes; Yield is 68%.
National Aeronautics and Space Administration
Jet Propulsion Laboratory California Institute of Technology Pasadena, California
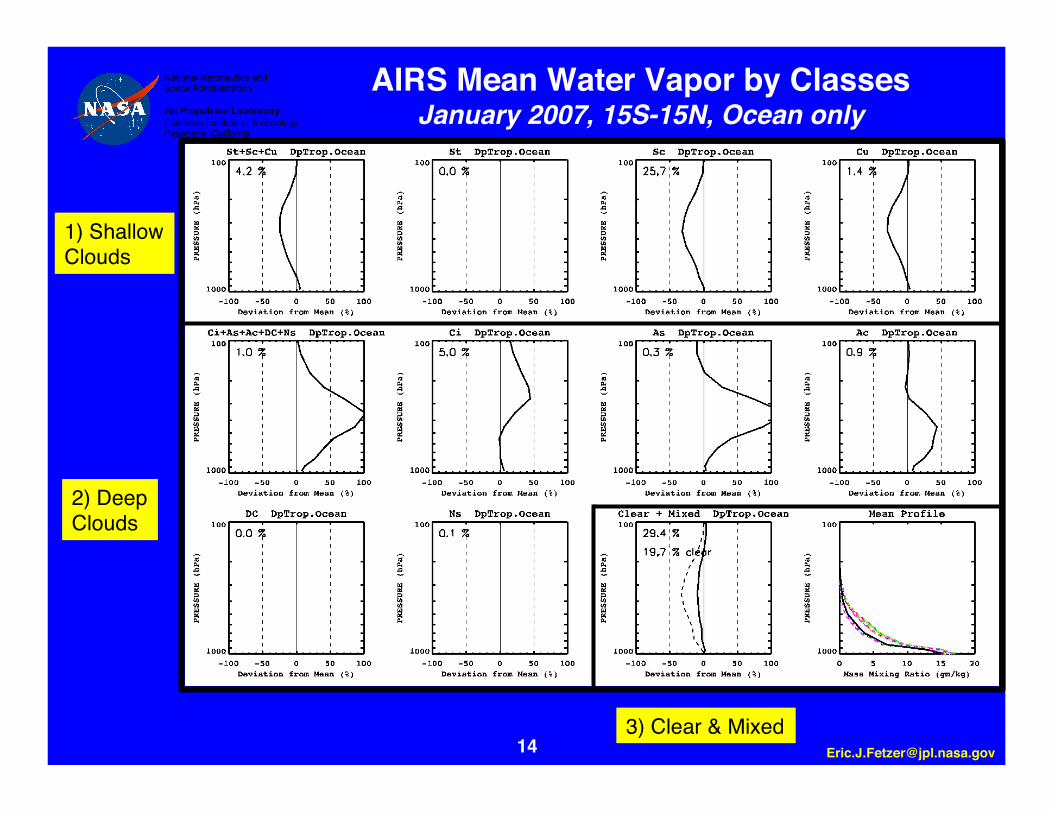
AIRS Mean Water Vapor by ClassesJanuary 2007, 15S-15N, Ocean only
14
1) Shallow Clouds
2) Deep Clouds
3) Clear & Mixed
National Aeronautics and Space Administration
Jet Propulsion Laboratory California Institute of Technology Pasadena, California
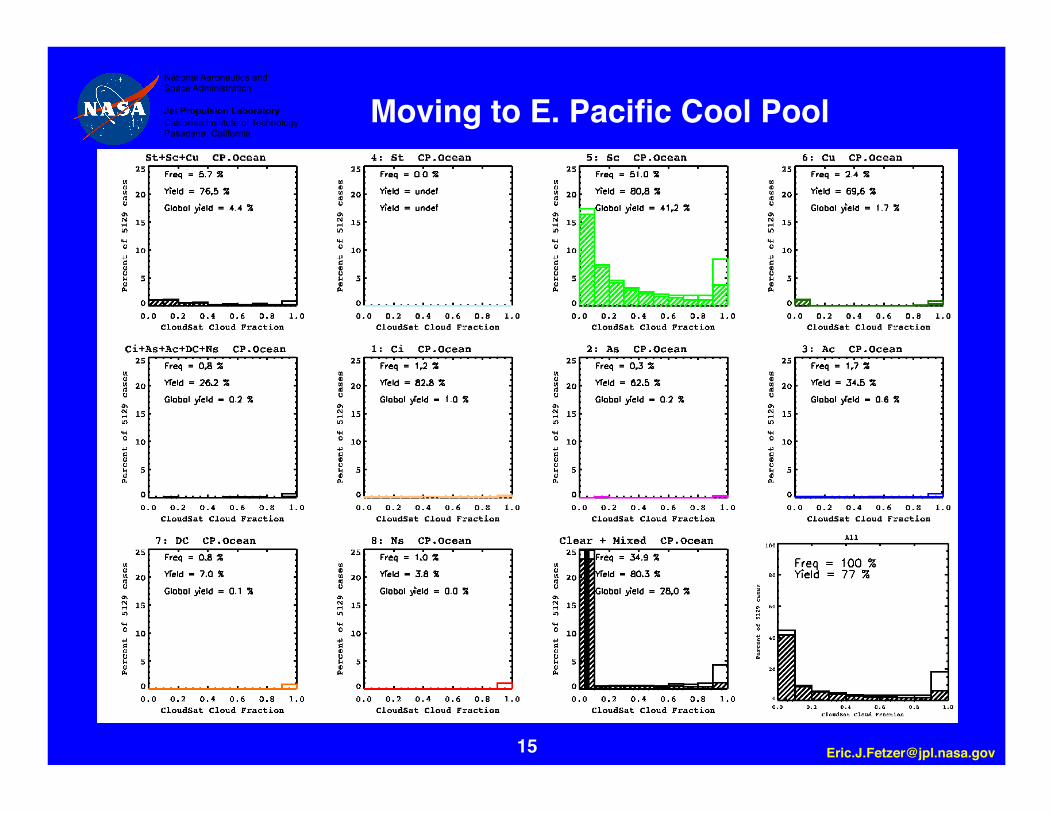
Moving to E. Pacific Cool Pool
15

National Aeronautics and Space Administration
Jet Propulsion Laboratory California Institute of Technology Pasadena, California
W. Pacific Warm Pool
16

National Aeronautics and Space Administration
Jet Propulsion Laboratory California Institute of Technology Pasadena, California
High yields in the E. Pacific due to prevalence of shallow, broken clouds.
Low yields in W. Pacific due to prevalence of deep, thick clouds.
17
National Aeronautics and Space Administration
Jet Propulsion Laboratory California Institute of Technology Pasadena, California
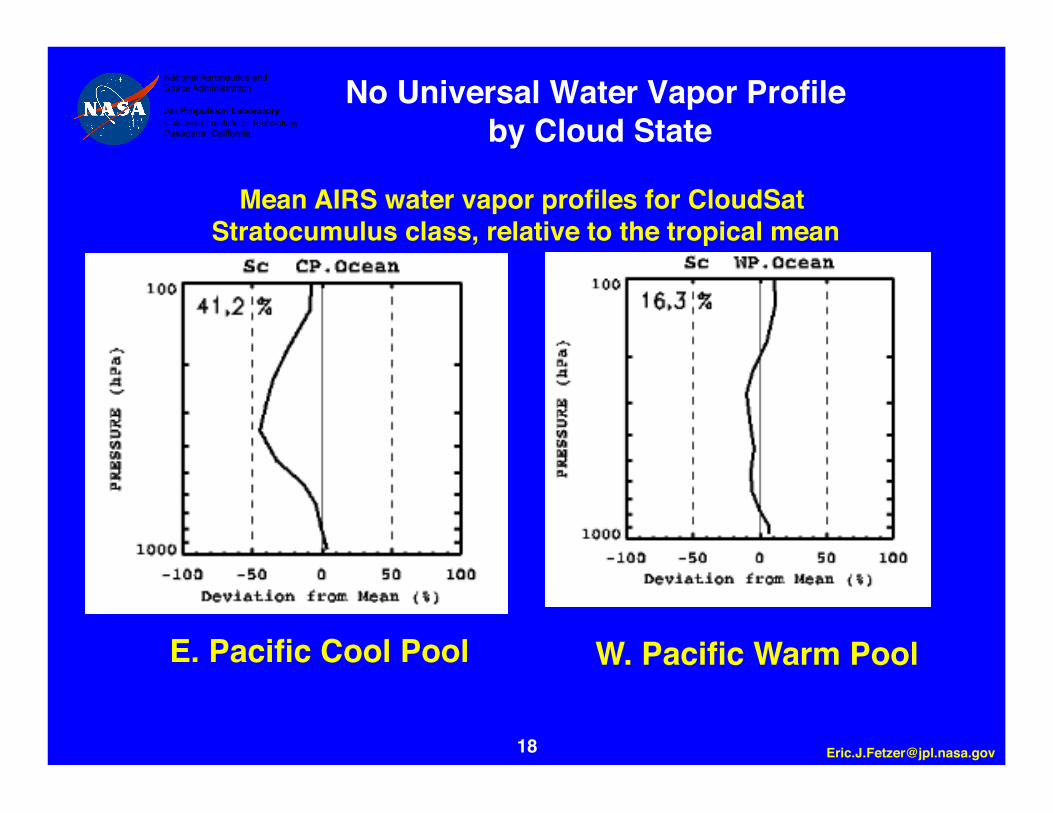
No Universal Water Vapor Profile by Cloud State
18
Mean AIRS water vapor profiles for CloudSat Stratocumulus class, relative to the tropical mean
E. Pacific Cool Pool W. Pacific Warm Pool
National Aeronautics and Space Administration
Jet Propulsion Laboratory California Institute of Technology Pasadena, California
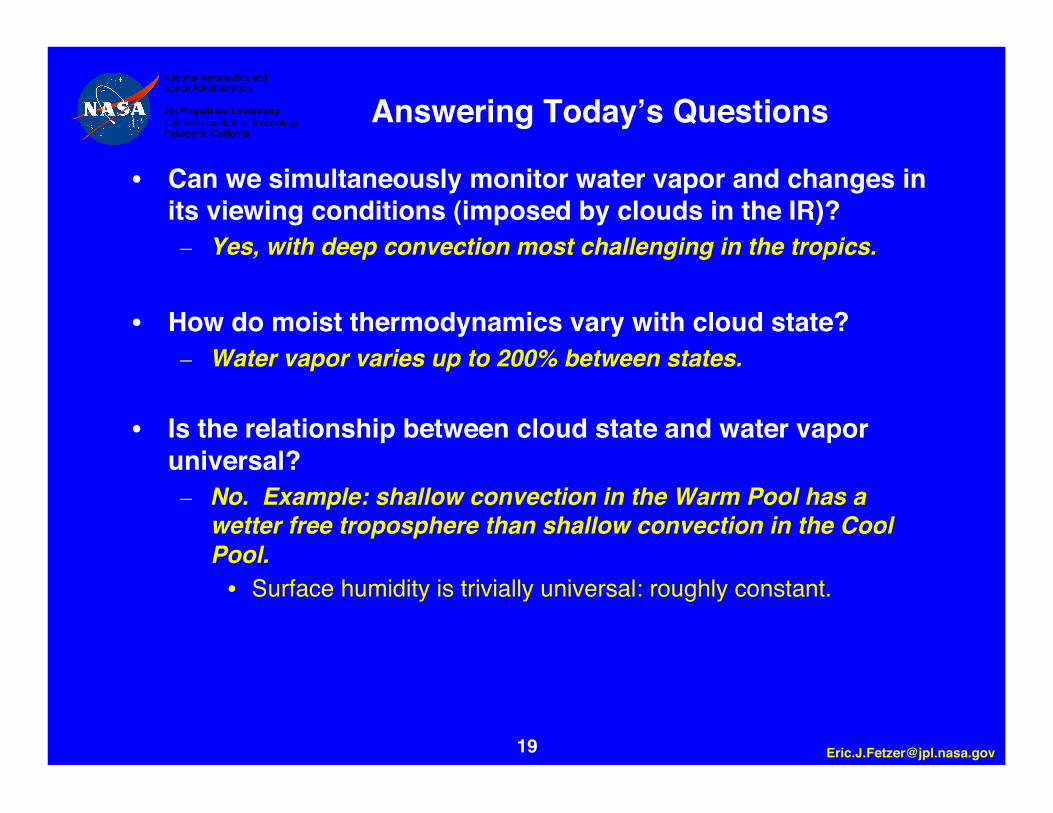
Answering Todayʼs Questions
• Can we simultaneously monitor water vapor and changes in its viewing conditions (imposed by clouds in the IR)? – Yes, with deep convection most challenging in the tropics.
• How do moist thermodynamics vary with cloud state? – Water vapor varies up to 200% between states.
• Is the relationship between cloud state and water vapor universal? – No. Example: shallow convection in the Warm Pool has a
wetter free troposphere than shallow convection in the Cool Pool.
• Surface humidity is trivially universal: roughly constant.
19

National Aeronautics and Space Administration
Jet Propulsion Laboratory California Institute of Technology Pasadena, California
Answering Some Questions (contʼd)
• How dominant are effects in the radiatively important middle and upper troposphere? – Most of the water vapor variations between cloud states occur
in the middle and upper troposphere.
• How precise and accurate do earlier sounders need to be to separate trends in water vapor by cloud state? Assuming cloud state can be well characterized by ISCCP or similar observations. – Donʼt know, yet, but distinguishing deep and shallow
convection may require ~25% biases.
20

National Aeronautics and Space Administration
Jet Propulsion Laboratory California Institute of Technology Pasadena, California
Next Steps
• Analyze entire CloudSat record matched to AIRS. – Look at T, RH, etc.
• Match CloudSat to Microwave Limb Sounder & AMSR-E.
These data will become publicly available through our MEaSUREs project via the Goddard DAAC.
21