a micro-analytical sem-eds method applied to the...
TRANSCRIPT

Per. Mineral. (2008), 77, 2, 63-73 doi:10.2451/2008PM0014 http://go.to/permin
PERIODICO di MINERALOGIAestablished in 1930
An International Journal ofMINERALOGY, CRYSTALLOGRAPHY, GEOCHEMISTRY,ORE DEPOSITS, PETROLOGY, VOLCANOLOGYandappliedtopicsonEnvironment,ArchaeometryandCultural Heritage
l
AbstrAct. — Inthiswork,anewmicro-analyticalSEM-method to perform quantitative chemicalanalysesofmineralfibersisdescribed.ThemethodmakesitpossibletocorrecttheEDSresultsoffiberanalyses, obtained by means of the conventionalprocedure (i.e., ZAF) utilizing, as compositionalreference“standards,”� small fragments of massivesmall fragmentsofmassivecrystalswhosecompositionwaspreviouslydeterminedwhosecompositionwaspreviouslydeterminedbyElectronMicroprobe(EMPA).Themethodreducestheerrorsinevaluatingthechemicalcompositionoffibersdue to twoprincipal effects: “absentmass”�and“reducedabsorption”�related to thesmallsizeofthefibers.Thecorrectquantitativeanalysesofthefiberswereobtainedonthebaseof:a)thetrends(i.e.,regressionequations)oftheelementconcentrationsin the “standard fragments”� (as obtained by ZAFcorrection)versusthefragmentsizes;b)thesettingofcorrectionfactorsthroughtheratiobetweenthetrueelementconcentrations(asdeterminedbyEPMAin the massive crystal) and the apparent elementconcentrationsrevealedbytheregressionequations;andc)theevaluationofthecorrectionfactorerrorsthroughtheresidualdispersions(standarddeviationσ) around the curves.
Themethodwasappliedforthefirsttimeonthefluoro-edeniteamphibolefibersfoundinBiancavilla
area,toobtainquantitativechemicalanalyses.Theunequivocalchemicalcharacterizationofthisfibrousmaterialisextremelyimportanttoverifytheireffectivetoxicity in environmental and health issues. Themicro-analyticalmethodwasalsoappliedtofibersoffluor-richteriteamphiboletoconfirmitsvalidityonfiberswithhighercompositionalvariability.
riAssunto.—E’statomessoapuntounnuovometodo microanalitico SEM-EDS finalizzato alladeterminazionedianalisichimichequantitativedifibreminerali. Ilmetodopermettedi correggere irisultatidellemicroanalisiXmediantespettroscopiaadispersionedienergia(EDS)ottenuticonleprocedureconvenzionali(p.e.metodoZAF).Laprocedurasibasasull’usodiframmentidicampionimassivi,comestandarddiriferimento,dellestessedimensionidellefibredaanalizzare,lacuicomposizioneèesattamentenota.
Ilmetodopermettedievitare igrossolanierroridovutiaicosiddettieffettidella“massamancante”�edel“ridottoassorbimento”�.
Irisultaticorrettinell’analisiquantitativadellefibrevengonodeterminaticonsiderando:a)l’andamentodelleconcentrazioniapparentideglielementi(ottenuteconlacorrezioneZAF)neiframmentidellostandardmassivoinfunzionedelledimensionideiframmentistessi; b) la valutazione dei fattori di correzioneutilizzandoirapportifraleconcentrazionieffettive
A micro-analytical SEM-EDS method applied to the quantitative chemical compositions of fibrous amphiboles
Luigi PAoLetti1 *, biAgio M. bruni
1, Lorenzo ArrizzA2, siMonA MAzziotti-tAgLiAni
3 and ALessAndro PAceLLA
3
1 DipartimentodiTecnologieeSalute,IstitutoSuperiorediSanità,V.leReginaElena,299–I-00161Roma,Italy.2 CentrodiMicroscopiaElettronicaeMicroanalisi,MontelucodiRoio–I-67040L’Aquila,Italy.
3 DipartimentodiScienzedellaTerra,UniversitàdegliStudidiRoma“LaSapienza”�,P.leA.Moro,5–I-00185Roma,Italy.
*Correspondingauthor,E-mail:[email protected]
64 L. PAoLetti , b.M. bruni, L. ArrizzA, s. MAzziotti-tAgLiAniandA. PAceLLA
(note)deglielementieleconcentrazioniapparentiottenutedallecurvediregressione;c)lavalutazionedell’erroredimisurasuifattoridicorrezionetramiteladispersionedeiresiduiintornoallecurve(deviazionestandard σ).σ).).
Ilmetodoèstatoapplicatoperlaprimavoltasullenuovefibredianfibolodifluoro-edenitediBiancavilla,alloscopodiottenereanalisichimichequantitative.Lacomposizionechimicainequivocabiledidettefibreèindispensabileperunamiglioreinterpretazionedeirisultatisperimentalideitestbiologiciincorsoeperdefinirne,quindi,l’effettivatossicità.
Ilmetodomicroanaliticoquipropostoèstatoinoltreverificatosufibredianfibolofluor-richteritealfinediconfermarnelavaliditàelaripetitivitàanchesufibreconmaggiorevariabilitàcomposizionale.
Key words: SEM-EDX micro-analysis, quantitative chemical analyses, EDS standardization, fibrous amphiboles.
introduction
Thedeterminationofthechemicalcompositionsofmineral fibers (asbestosornot) represents acomplexanalyticalproblemthatisstillunresolved.Forthequantitativedeterminationsofthefibrousminerals thereareseveralanalytical techniquesthat present advantages and disadvantages assummarized,forexample,inMeekeret al.(2003),Gunteret al. (2003,2007)andGianfagnaet al.(2007).WhileaScanningElectronMicroscopy(SEM) is useful for observing the morphologyofmineralparticles,the EDS systems commonlytheEDSsystemscommonlyusedonthemcanprovideforonlysemiquantitativechemicaldata.The quantitative analysis of fibersThequantitativeanalysisoffibersand small particles (e.g., less than 5 microns)presentmanychallenges.
Intheanalysisoflargerparticles,tocalculatethematrixeffects(i.e.ZAFmethod),boththesampleandthestandardareconsideredasinfinitelythickincomparisonwiththepenetrationoftheincidentelectronbeam,assumingmoreoverthatbothhavea smooth and often polished, regular surface(Goldsteinet al.,1981;ScottScottet al.,1995)..
Size and shape of fibrous or small particlescannot be controlled, therefore two importanteffectscandrasticallychangetheintensityofthecharacteristic X-rays generated by the sample
and invalidate the resultsobtainedwith routinecorrectionprocedures(Small,2002).
The first effect (“absent mass”�) is related tothe limited particle/fiber sizes and is stronglyinfluenced by the average atomic number ofthe particle, which determines the probabilityof elastic scatteringand the realvolumeof theelectronbeamdiffusioninner(oroutside)thesameparticle.Consequently,whenasignificantfractionof the incident beam goes outside the particle,andnoionizationeventsandX-rayemissionsaregenerated,theintensityofthecharacteristicX-raylinescannotbecorrectedbytheZfactor,whichtakes into consideration, in theZAFprocedureformassivesamples,thedifferenceintheaverageatomicnumber.
Thesecondeffect(“reducedX-Rayabsorption”�)islinkedtotheparticlegeometry,whichinfluencesboth the length of the absorption path withinthe particle and the X-ray take off angle. TheA correction factor, which takes into accountdifferencesintheX-rayabsorptionofthesampleandstandard, couldbe radicallydifferent,withrespect to the factornormallyused in theZAFalgorithm.
Many methods, both empirical and based onideally-shapedparticles,havebeenproposed totosolve these problems with EDS microanalysis EDS microanalysis(Laskin and Cowin, 2001; Ro et al., 2003).However, these methods only obtain semi-methods only obtain semi- only obtain semi-quantitativeresultsortheyassume,fortheanalyzedparticles,aspecificgeometry.Thus,forageneralapplicationtheyareonlypartiallyuseful.
AnalysisoffibrousamphibolesIn the Biancavilla area, located at southwest
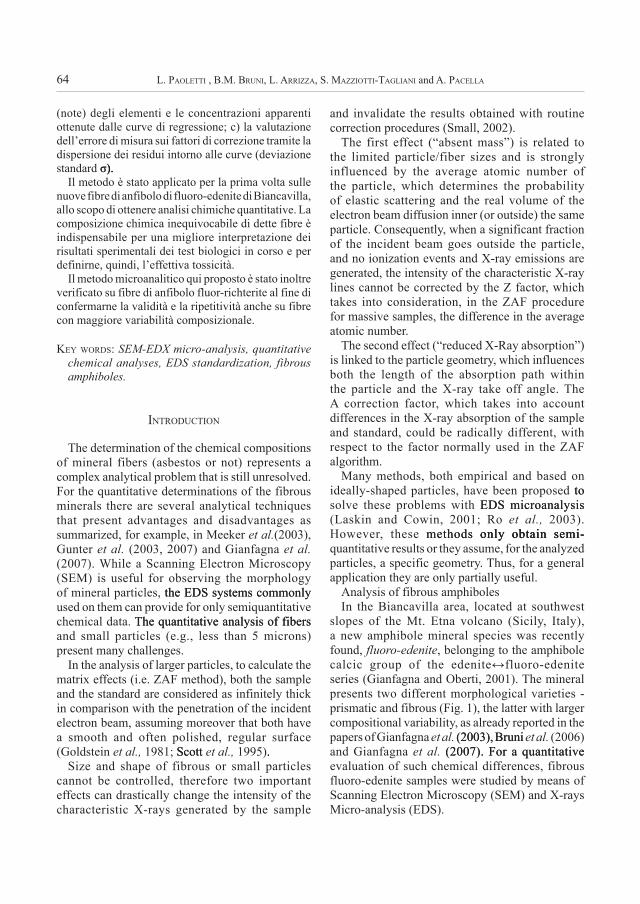
slopes of the Mt. Etna volcano (Sicily, Italy),a new amphibole mineral species was recentlyfound,fluoro-edenite,belongingtotheamphibolecalcic group of the edenite↔fluoro-edenite series(GianfagnaandOberti,2001).Themineralpresents twodifferentmorphologicalvarieties-prismaticandfibrous(Fig.1),thelatterwithlargercompositionalvariability,asalreadyreportedinthepapersofGianfagnaet al.(2003), Bruni(2003),Bruniet al.(2006)andGianfagnaet al. (2007). For a quantitative(2007).For aquantitativeevaluationofsuchchemicaldifferences,fibrousfluoro-edenitesampleswerestudiedbymeansofScanningElectronMicroscopy(SEM)andX-raysMicro-analysis(EDS).
A micro-analytical SEM-EDS method applied to the quantitative chemical compositions of fibrous amphiboles 65
Fig.1 –– a)Prismaticfluoro-edenite;b)fibrousfluoro-edenite;c)EDSspectrumofaprismaticfluoro-edenitecrystal;d)EDSspectrumoffibrousfluoro-edenite.
66 L. PAoLetti , b.M. bruni, L. ArrizzA, s. MAzziotti-tAgLiAniandA. PAceLLA
Toobviate theproblemof the small sizes ofthe fibers (averagediametersbetween0.30and0.70 µm) in SEM-EDS analysis, an empiricalSEM-EDS analysis, an empirical an empiricalprocedurewasdeveloped.Thisprocedureisbasedon the assumption that both the “absent mass”�and the“reducedabsorption”�effectswillhave,withgoodapproximation,thesamesignificancesignificanceintheanalysisofboththefibersandthefluoro-edenitecrystalfragmentswithsimilarsizes(0.2to1µm).Toevaluatetheseeffects,X-rayspectraoffragmentsofaprismaticfluoro-edenitecrystalwerecollectedandcomparedwiththespectrumobtainedbythesameoriginalcrystal,previouslyanalyzed in Electron Microprobe Analyzer(EPMA).
exPeriMentAL Methods
Sample preparation and observation conditions
Appropriately sized fragments of a fluoro-edenitecrystalwereobtainedbygrindingthelargeprismaticsampleinanagatemortarwithacetone.Theseparticlesweredispersedindoubly-distilledwater,mountedonasampleholder (aluminiumstubwithdoubleadhesivecarbontape)andcarboncoated.Thesizeofthefragmentsweredeterminedin the SEM; the error on the particle size wasevaluatedintherangeof±20nm.
During the EDS analysis of both the smallfragments and the large prismatic crystal, theinstrumentaloperatingconditionswerefixed:15keVbeamenergy,10mmWD,tiltangle0°,spotanalysismode.
resuLts
Analysis of the prismatic fluoro-edenite fragments
To determine the significance of the “absentmass”� and “reduced absorption”� effects, the the“apparent”�concentrationsofthedifferentchemicalelementsinthefragmentswerecalculatedontheacquiredspectrabytheordinary ZAF procedure,ordinary ZAF procedure,ZAFprocedure,adoptingthebulkcrystalasstandard.Fig.2showstheresultsforthirty-sixfragmentsoftheprismaticfluoro-edenitesample,withdimensionsbetween0.2 and 1 µm.The concentrations of the mostabundantfiveelements(Na,Mg,Si,CaandFe),
as obtained by the ZAF procedure, are plottedversustheparticlesizeswithoutconsiderationofthe“absentmass”�andthe“reducedabsorption”�effects. Moreover, the same figure shows forcomparison theactualelementalvalues(knownfromthemeasuresonthemassivecrystal)foreachelement.
Basedontheseplots,arelationshipbetweentheelementapparentconcentrationsandtheparticlesizescanbeobserved. InFig.2, the regressioncurves calculated on the results obtained forthe fiveanalyzedelements are also shown.Wedidnotselect thetypeof theregressionmodelsto use (e.g., a linear regression), because thee.g., a linear regression), because thea linear regression), because theexperimentalresultsarecausedbyacombinationofseveraldifferentprocesses(absentmass,reducedabsorption, fragment geometry), which do notshowalineardependencetothefragmentsize.Wethusselectedtheempiricalregressionmodelwhichyielded the best fit with our data (polynomial,linear,power).Suchmodelswereconsideredthebetterestimationof thecorrelationbetween theapparentconcentrationsoftheelementsandthesizesofthefragments.
In Table 1 the correlation coefficients R oftheregressionequationsarereported;moreoverthe widths of the residual distributions aroundthe relative regressioncurves (estimatedby thestandard deviation σ) are given.σ) are given.)aregiven.
Theobserveddispersionsaround theaveragetrend(theregressioncurves)arebasicallyduetotwoeffects:
1. The geometry (shape and orientation)ofthestandardcrystalshards:itcausesarandomtake-offanglewhichaffectstherangeoftheX-rayphotoninthesample,addingarandomeffectontheintensityofthepeaks;
2. The compositional variability of thefluoro-edenite shards: the standard prismaticcrystalisnotcompositionallyhomogeneoussotheshards,becausetheirverysmallsize,willshowavaryingcomposition;thiseffectmaybeparticularlyevidentfortheelementthatpresentsthegreatestsubstitutioninthefluoro-edenitestructure.
A third effect contributing to the observedspreading around the average trend is themeasurementerroronthefragmentsize;however,itispossibletoassumearandomdistributionofthiserrorwithavirtuallyzeromeanvalueandawidthequalto±theresolution(instrumentalerror)

A micro-analytical SEM-EDS method applied to the quantitative chemical compositions of fibrous amphiboles 67
obtainedintheinstrumentaloperativeconditions.Thus,theresultofthiseffectonthedataaverage
trend(theregressioncurves)maybedisregard.Theresultonthewidths of the residual distributionswidthsoftheresidualdistributionsdistributionss
Fig.2 –Concentrationsofthefivemoreabundantelements(Na,Mg,Si,Ca,andFe)asafunctionoftheparticlesizes,usingtheZAFprocedure.
Na Mg Si Ca FeCorrelationcoefficientsoftheregressioncurves 0.52 0.76 0.81 0.79 0.37Standarddeviationofresidualsaroundtheregressioncurves (σ)σ))
0.135 0.628 1.028 0.539 0.294
Data dispersion (σ) fro�� ��� anal�ses on a fluoro-edenite �ul��σ) fro�� ��� anal�ses on a fluoro-edenite �ul��)from14analysesonafluoro-edenitebulksample
0.040 0.135 0.165 0.107 0.085
Contributionofthefluoro-edenitecompositionalvariabilitytotheresidualdispersions
30% 22% 16% 20% 29%
Contributionofmeasurementerroronparticlesizestotheresidualdispersions
6% 19% 19% 18% 5%
tAbLe 1Correlation coefficients of the regression curves, and dispersions of the residual distributions (estimated by
the standard deviation around the curves)

68 L. PAoLetti , b.M. bruni, L. ArrizzA, s. MAzziotti-tAgLiAniandA. PAceLLA
maybeevaluated(Table1)takingintoaccounttheregressioncurveslopeinthesizerangeofinterest(0.2–1.1µm).
An evaluation of the significance of thesecond effect was attempted in consideringthe compositional variability of the fragmentscomparable to the observed variability in thechemical analyses carried out through EPMAtechnique,ondifferentzonesofaprismaticfluoro-edenite crystal. InTable1 thedatadispersions(standard deviation σ) of fourteen EPMA anal�ses arereported.
Boththecontribution (as percentage values) ofcontribution(aspercentagevalues)ofthefluoro-edenitecompositionalvariabilityandthethecontributionofthemeasurementerroronparticlesizestotheresidualdispersionsareshown.
Correction factors for the “apparent” concentrations
Theelementcorrectionfactorswerecalculatedcomparingtheregressioncurvesofthe“apparent”�elemental concentrations of the fluoro-edenitefragmentswiththe“true”�elementalconcentrationsofthemassivestandardsample.InthegraphsofFig.3thefactorsforSi,Mg,FeandNa,areplottedasafunctionofthedimensionsofthefragments.Thesewereusedtocorrectboththe“absentmass”�andthe“reducedabsorption”�effectsforthefibers.Also shown in Fig. 3 are the correction factorerrors,whichareassumedequaltothestandarderror (σ/√n) of the residual dispersion for each regressioncurve.
Theseresultsshowthattheconcentrationsofalltheelements,exceptforNa,areunderestimatedinthefragmentsanalysis,andevenmorewhenthefragment size decreases, therefore, the “absentmass”�effectispredominant,withtheexceptionof the Na Kα line (1.041 KeV) for which the“reducedabsorption”�effectprevails.FortheFeKαline,withrelativelyhighenergy(6.40KeV),boththe“absentmass”�andthe“reducedabsorption”�effectsappear tocanceleachotherforparticleswhosewidthsaregreaterthanabout0.6µm.Thevalidityofthecalibrationcurves,whichdescribethecorrectionfactormagnitude,islimitedtothedimensionalrangebetween0.2-1µm(i.e., thesizerangesfortheparticlesweanalyzed).
To obtain the true composition of a fibrousof a fibroussample, the correction factors, valued by thethe correction factors, valued by the
calibrationcurves,willbeappliedtothe“apparent”�composition obtained through the EDS spectra(true compositions �� apparent compositionstrue compositions �� apparent compositions xcorrectionfactors).
The “true”� composition of the fiber will bedeterminedthroughatotalrelativeerror[∆C%]correspondingtothesumbetweenthecorrectioncorrectionfactorrelativeerror[[∆F%]and the relative error onand the relative error ontherelativeerrorontheapparentfibercomposition[∆apparentC%]:
[∆C%]��[∆apparentC%]+[∆F%]
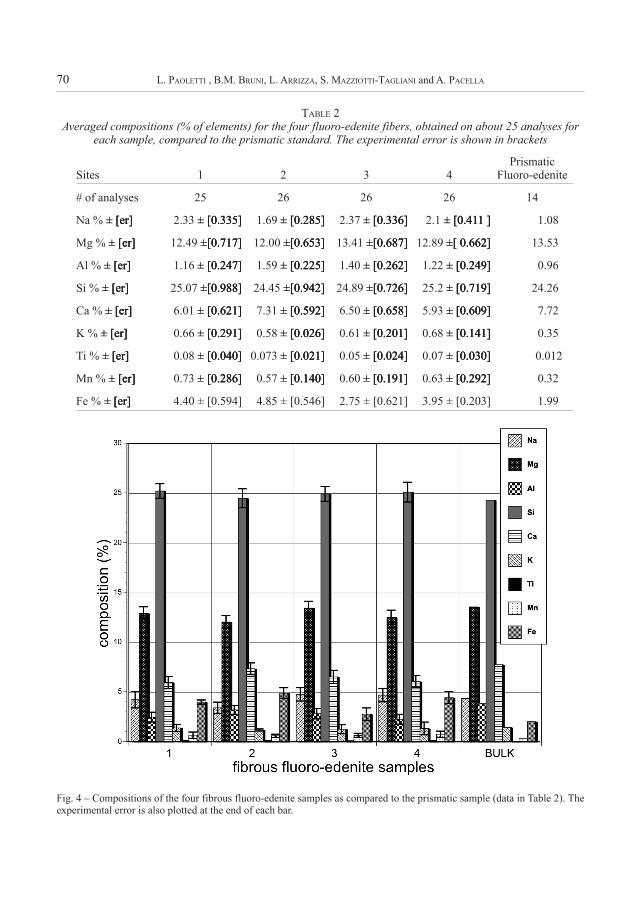
Compositions of the fluoro-edenite fibers
Four fibrous fluoro-edenite samples wereanalyzedusingtheabovedescribedmethod.Theanalyzedfiberswerecollectedinsitesnamed1,2,3,and4,fromtheBiancavillavolcanicarea,inwhichtheprismaticfluoro-edenitecrystalswerefirstdiscovered.Allfibersfromthefoursiteshavediametersintherange0.2to1.0µm.
For each fiber sample (each site), twenty-fivefiberswereanalysedandthecorrespondingaveragecompositionsdetermined.
The true compositions of each fiber sample,expressed as%of the element, are reported inTable2,togetherwiththeexperimentaltotalerrors[assu��ed equal to the standard error (σ/√n) of the datadispersion].Forcomparison,thecompositionof prismatic fluoro-edenite used to make thefragmentspreparationisalsoreported.Theabsenceof OH-groupsfor both the prismatic and fibersampleswasevaluatedbyInfra-redSpectroscopy;consequently, the fluorineandchlorinecontentwasfixedtothevalueoftheEPMAanalysis.Ageneralchemicalcharacteristic forallanalyzedfluoro-edenite fibers is the greater Fe contentwithrespecttotheprismaticsample,whereasAlandCaaregenerally lower.Thecompositionalcorrelationsbetweenfibrousandprismaticfluoro-edenite samples are reported in Fig. 5, wherethe“similarities”�of thecompositions, reportedinTable2andinFig.4respectively,weretakeninto account. Fig. 5 shows that the fibers ofsample2are“distant”�fromalltheothersamples,whereassample4andsample1areverysimilarincomposition;finally,sample3hasacompositionveryclosetothatofprismaticfluoro-edenite.

A micro-analytical SEM-EDS method applied to the quantitative chemical compositions of fibrous amphiboles 69
Fibrous Richterite
The same procedure used in the analysis ofthefibrousfluoro-edenitefromBiancavillawasadopted to analyze samples of richterite fibersfromLibby,Montana,USA(Meekeret al.,2003;Bandli et al., 2003; Gunter et al., 2003). Therichteriteamphibolecanbefoundinprismaticasinthefibrousmorphology,likethefluoro-edeniteamphibole.Therichteritefibersanalyzedinthisworkoccurredwithadiameterrangebetween0.2to1µm.Unlikely,intheLibbysamples(fibrousandnotfibrousmaterial)therearenotanyprismaticcrystalsso large touseasa referencestandard.
Therefore,aprismaticrichteritecrystalfromtheOntario,Canada,wasobtainedfromthecollectionoftheMineralogicalMuseumoftheEarthSciencesDepartment,“SapienzaUniversitàdiRoma”�,Italy.Thecrystal,whosecompositionwaspreviouslyand carefully determined by means of EPMAtechnique,wasusedasreferencestandard.Onthebasisofitscomposition,themassivecrystalwasdefinedasafluor-richteriteamphibole.
Thecrystalwasappropriately ground to obtainappropriately ground to obtaingroundtoobtainfragmentswithsuitablesizes.The acquired EDSTheacquiredEDSspectraofthefragmentswereutilizedtocalculatethe “apparent”� concentrations of the differentelements,usingtheZAFprocedure.The calibrationThecalibration
Fig.3 – CorrectionfactorscurvesforSi,Mg,FeandNa,asafunctionoffiberdiameters.Therearealsoreportedthecorrection factor errors assu��ed equal to the standard error (σ/√n) of the residual dispersion for each regression curve.
70 L. PAoLetti , b.M. bruni, L. ArrizzA, s. MAzziotti-tAgLiAniandA. PAceLLA
tAbLe 2Averaged compositions (% of elements) for the four fluoro-edenite fibers, obtained on about 25 analyses for
each sample, compared to the prismatic standard. The experimental error is shown in brackets
Sites 1 2 3 4Prismatic
Fluoro-edenite
#ofanalyses 25 26 26 26 14
Na%± [er]± [er][er] 2.33± [0.335]± [0.335][0.335] 1.69± [0.285]± [0.285][0.285] 2.37± [0.336]± [0.336][0.336] 2.1± [0.411 ]± [0.411 ][0.411] 1.08
Mg%± [er]± [er][er] 12.49±[0.717]±[0.717][0.717] 12.00±[0.653]±[0.653][0.653] 13.41±[0.687]±[0.687][0.687] 12.89±[ 0.662]±[ 0.662][0.662] 13.53
Al%± [er]± [er][er] 1.16± [0.247]± [0.247][0.247] 1.59± [0.225]± [0.225][0.225] 1.40± [0.262]± [0.262][0.262] 1.22± [0.249]± [0.249][0.249] 0.96
Si%± [er]± [er][er] 25.07±[0.988]±[0.988][0.988] 24.45±[0.942]±[0.942][0.942] 24.89±[0.726]±[0.726][0.726] 25.2± [0.719]± [0.719][0.719] 24.26
Ca%± [er]± [er][er] 6.01± [0.621]± [0.621][0.621] 7.31± [0.592]± [0.592][0.592] 6.50± [0.658]± [0.658][0.658] 5.93± [0.609]± [0.609][0.609] 7.72
K%± [er]± [er][er] 0.66± [0.291]± [0.291][0.291] 0.58± [0.026]± [0.026][0.026] 0.61± [0.201]± [0.201][0.201] 0.68± [0.141]± [0.141][0.141] 0.35
Ti%± [er]± [er][er] 0.08± [0.040]± [0.040][0.040] 0.073± [0.021]± [0.021][0.021] 0.05± [0.024]± [0.024][0.024] 0.07± [0.030]± [0.030][0.030] 0.012
Mn%± [er]± [er][er] 0.73± [0.286]± [0.286][0.286] 0.57± [0.140]± [0.140][0.140] 0.60± [0.191]± [0.191][0.191] 0.63± [0.292]± [0.292][0.292] 0.32
Fe%± [er]± [er][er] 4.40±[0.594] 4.85±[0.546] 2.75±[0.621] 3.95±[0.203] 1.99
Fig.4 –Compositionsofthefourfibrousfluoro-edenitesamplesascomparedtotheprismaticsample(datainTable2).Theexperimentalerrorisalsoplottedattheendofeachbar.

A micro-analytical SEM-EDS method applied to the quantitative chemical compositions of fibrous amphiboles 71
curveswereutilizedto correct both the “absenttocorrectboth the“absentmass”�andthe“reducedabsorption”�effects.
InTable3, theaveragechemicalcompositionof the richterite fibers,basedon theSEM-EDSanalysis(on22fibers), isshownalongwiththemeancompositionoftheprismaticrichterite(20analyses).
Forcomparison,Fig.6showsthecompositionofmassiverichterite,usedasareferencestandard,andthemeancompositionoffibersfromLibby.
Itisinterestingtonotethatthecompositionofthemassiverichteriteshowssignificantchemical
Fig.5 – Compositionalcorrelationsbetweenfibrous(1,2,3,and4)andprismaticfluoro-edenite(5)samples.
Fig.6 – CompositionoftherichteritefibersfromLibby,Montana,comparedwiththatofthemassivecrystal.Theexperimentalerrorisalsoplotted.
tAbLe 3Average chemical composition of the richterite fibers by SEM-EDS (the experimental error assumed equal to the standard error is shown), compared with the
mean composition of the prismatic richterite and the bundled richterite fibers (EMPA)
Prismatic crystal
(EMPA)
Bundled fibers
(EMPA)
Single fibers (SEM-EDS)
Experimental error on fiber compositions
#analyses 20 22 22Si 26.53 27.62 27.4 1.548Ti 0.21 0.05 0.14 0.06Al 0.49 0.07 0.16 0.058Mg 14.1 13.44 13.9 0.725Ca 6.59 5.22 4.69 0.658Mn 0.15 0.11 0.08 0.021Fe 1.81 3.26 3.11 0.409Na 1.7 1.87 1.84 0.338K 0.56 0.66 0.77 0.264

72 L. PAoLetti , b.M. bruni, L. ArrizzA, s. MAzziotti-tAgLiAniandA. PAceLLA
differences with respect to the analyzed fibersof the same mineralogical species, while thefluoro-edenitefiberspresentminorcompositionalvariabilityrespecttotheprismaticfluoro-edenite,utilizedasreferencestandard(seeTable2andFig.4).
Totestthevalidityofthemethodalsowhenareference standard is usedwith some chemicalvariabilitieswithrespecttothefibrousvariety,abundleofrichteritefiberswerepreparatedinthinsection,embeddedinresin,tosimulateamassivesample,andwereanalyzedbyEPMAtecnique.InTable3,theEPMAanalysesfortherichteritebundlefibersarereported.Itissignificantthataverystrictagreementoccursbetweenthecompositionofthebundled fibers, determined by EPMA, and thecompositionofthesinglefibers,determinedbytheSEM-EDSprocedure.
discussion And concLusion
The characterization of fibrous materials isverydifficult becauseof their small sizes (i.e.,thefiberwidth).Carefulanalysesarefrequentlyhinderedandsometimesstructuraldeterminationsareimpossible.Therefore,intheseparticularcases
itisimportanttodevelopinnovativemethodstocharacterize,identify,andcorrectlyclassifythesematerials.
Quantitativemicro-analysesof particles and/or fibers, and their subsequent interpretability,are very difficult to perform on samples withdimensionsintheorderofmicronorsub-micronrange,particularlyinpresenceoflowelementalconcentrations.
The experimental X-rays micro-analyticalmethodheredescribedovercomestheerrorsduetoso-called“absentmass”�and“reducedabsorption”�effectsinthequantitativeanalysisofsub-micronmineralfibers.
Thisnewmethodwasdevelopedandappliedonfiberswithdimensionalrangebetween0.2and1.0µm,andacompositionalreference“standard”�wasavailablefromwhichsmallfragments,withsizecomparabletothefiber,waspossibletoobtain.
Themethodwastestedandappliedforthefirsttimeonthenewfluoro-edeniteamphibolefibersfrom Biancavilla, Italy, and it was verified onfluor-richteritefibersfromLibby,Montana,USA.Themethodcanbealsousedforfibroussampleswith slightlydifferentelementalconcentrationswithrespecttothemassivestandardcrystal.
Fig.7 – Trendofthetotalerror(%)asafunctionoftheabsoluteconcentrationofthemeasuredelementinafibroussample.

A micro-analytical SEM-EDS method applied to the quantitative chemical compositions of fibrous amphiboles 73
Concerning the influence of the elementalabundances in the fibrous samples, the error(%) increases with the decrease of the relativecontents (Fig.7).Thiswasverified inboth thecasesconsidered in thepresentstudy.With thismethodological procedure a measured errornot greater than 5% can be expected when theelement is present in concentration not lessthan approximately 10%.The reliability of theprocedurerapidlydecreaseswhentheabundanceoftheelementsisbelow3to4%.
AcKnowLedgeMents
Theauthors thankDr.G.Cavarretta forEPMAanalysesat theCNR-IGAG,andM.Serracino fortechnicalassistance.Prof.A.Gianfagnaisthankedfortheencouragementandthesupportduringthepresentwork.ParticularthanksareduetothereviewerDr.XavierLlovet,fortheimprovementofthepaper,andtoProf.RomanoRinaldiforhisusefulsuggestions.The authors also thank Prof. Mickey E. Gunterwhoprovidedtherichteritesamplesandcompletelyrevisedthemanuscript.ThisworkwassupportedbyMIURfunds(Ateneo“SapienzaUniversitàdiRoma”�,andPRIN2004).
REFERENCES
bAndLi b.r., gunter M.e., twAMLey b., Foit F.F., Jr. and corneLius s.b. (2003) - Optical, compositional, morphological and X-ray data on eleven particles of amphibole from Libby, Montana, U.S.A.Can.Mineral.,41,1241-1253.
bruni b.M., PAceLLA A., MAzziotti tAgLiAni s., giAnFAgnA A. and PAoLetti L. (2006) -Nature and extent of the exposure to fibrous amphiboles in Biancavilla.Sci.TotalEnviron.,370,9–16.
giAnFAgnA A. and oberti r.(2001)-Fluoro-edenite from Biancavilla (Catania, Sicily, Italy): crystal chemistry of a new amphibole end-member.Am.Mineral.,86,1489-1493.
giAnFAgnA A., Andreozzi g.b., bALLirAno P.,
MAzziotti-tAgLiAni s. and bruni b.M.(2007).-Crystal chemistry of the new fibrous fluoro-edenite amphibole of volcanic origin from Biancavilla (Sicily, Italy).Can. Mineral.,Can.Mineral.,45,249-262.
giAnFAgnA A., bALLirAno P., beLLAtrecciA F., bruni b.M., PAoLetti L. and oberti r. (2003)-Characterization of amphibole fibres linked to mesothelioma in the area of Biancavilla, Eastern Sicily, Italy.Mineral. Mag.,Mineral.Mag.,67(6),1221-1229.
goLdstein J.i., newbury d.e., echLin P., Joy d.c., Fiori c.e. and LiFshin e. (1981) - Scanning Electron Microscopy and X-Ray Microanalysis.AText forBiologists,MaterialsScientists andGeologists.Ed.PlenumPress,673pp.
gunter M.e., dyAr M.d., twAMLey b., Foit F.F., Jr.andcorneLiusS.B.(2003)-Composition, Fe3+/ΣFe, and crystal structure of non-asbestiform and asbestiform amphiboles from Libby, Montana, U.S.A.Am.Mineral,88,1970-1978.
gunter M.e., sAnchez M.s. and wiLLiAMs t.J. (2007)-Characterization of chrysotile samples for the presence of amphiboles, Carey Canadian Deposit, Southeastern Quebec, Canada.Can.Mineral.,45,263-280.
LAsKin A. and cowin J. P. (2003) – Automated Single-Particle SEM/EDX Analysis of Submicrometer Particles down 0.1 µm. Anal.Chem.,73,1023-1029.
MeeKer g.P., bern A.M., brownFieLd i.K., Lowers h.A., sutLey s.J., hoeFen t.M.andVAnce J.s.(2003) - The Composition and Morphology of Amphiboles from the Rainy Creek Complex, near Libby, Montana.Am.Mineral.,88,1955-1969.
scott V.d., LoVe g. and reed s.J.b. (1995) -Quantitative electron probe microanalysis.2nded.,XIV,311S.,NewYork(EllisHorwood).
ro c., osAn J., szALoKi i., de hoog J., worobiec A. and VAn grieKen r. (2003) – A Monte Carlo Program for Quantitative Electron-Induced X-Ray Analysis of Individual Particles. Anal.Chem.,75,851-859.
sMALL J.A. (2002) - The analysis of particles at low accelerating voltages (≤ 10 kV) with Energy Dispersive X-Ray Spectroscopy (EDS). �. Res.�. Res.Natl.Inst.Stand.Technol.,107 (6),555-566.
