aas, xrpd, sem/eds, and ftir studies of the...
TRANSCRIPT

AAS, XRPD, SEM/EDS, AND FTIR STUDIES OF THE EFFECT OF CALCITE AND MAGNESITE ON
THE UPTAKE OF Pb2+ AND Zn2+ IONS BY NATURAL KAOLINITE AND CLINOPTILOLITE
A Thesis Submitted to the Graduate School of Engineering and Sciences of
İzmir Institute of Technology in Partial Fulfillment of the Requirements for the Degree of
MASTER OF SCIENCE
in Chemistry
by
BANU ZÜNBÜL
January 2005 İZMİR


ACKNOWLEDGEMENT
I wish to express my grateful thanks to my supervisor Assist. Prof. Dr. Talal
R.A. Shahwan for his guidance, motivations and endless supports during this project.
I would like to thank my co-supervisor, Assoc. Prof. Dr. Ahmet E. Eroğlu, for
his supports and helps.
I would like to thank Sinan Yılmaz, Betül Öztürk at Chemistry Department for
their help in AAS and FTIR measurements and Duygu Oğuz, Gökhan Erdoğan, Evrim
Yakut at Material Research Center at İzmir Institute of Technology for their help in
performing the SEM/EDS and XRPD analysis.
Special thanks go to all friends, research assistants, technicians and all staffs in
İzmir Institute of Technology for their helps and friendships.
Finally, I would like to express my endless thanks to my beloved family for
their endless support and motivation throughout the course of my studies.

i
ABSTRACT
In this study, the effect of magnesite and calcite on the uptake of lead and zinc
ions by mixtures of these carbonates with kaolinite and clinoptilolite was investigated at
various loadings and mixture compositions. The concentration of both ions in the liquid
phase was in measured using AAS, while XRPD, SEM/EDS, and FTIR techniques were
used in characterizing the solid samples. The study included the determination of
kinetics and sorption isotherms of lead and zinc on pure kaolinite and clinoptilolite.
Moreover, the sorption behavior of lead and zinc at different concentrations and pH
conditions was investigated on mixtures of calcite and magnesite with kaolinite and
clinoptilolite at carbonate mass percentage compositions of 5, 10, 25, 60 in addition to
pure calcite and magnesite. The morphologies of the formed precipitates, the plausible
structural change in the lattice of calcite, magnesite, kaolinite, and clinoptilolite
originating from sorption of lead and zinc ions was examined. According to obtained
results, the sorption affinity of kaolinite and clinoptilolite towards lead is larger than
their affinity towards zinc. Within the operating experimental conditions, the sorption
capacity increased with increasing the amounts of calcite, and magnesite. The overall
order of retention of lead and zinc was observed as magnesite ≥ calcite> clinoptilolite>
kaolinite under neutral and alkaline pH conditions and high loadings. When the initial
concentration of zinc and lead ions is raised to saturation conditions, rapid overgrowth
of cerussite and hydrozincite was observed. Increasing the initial pH to 10,0 caused
enhancement in the dissolution of calcite and magnesite, leading to the enhancing the
precipitation of hydrozincite, and an increased formation of hydrocerussite instead of
cerussite. The uptake of Zn2+ and Pb2+ ions by calcite and magnesite have lead to
modifying the geometry of the carbonate groups, the thing reflected as variation in their
vibrational bands.

ii
ÖZ
Bu çalışmada, Pb2+ ve Zn2+ iyonlarının kaolinit ve klinoptilolit minerallerince
tutulmasındaki kalsit ve magnezit etkisi çeşitli deneysel ortamlarda araştırılmıştır.
XRPD, SEM/EDS, ve FTIR teknikleri katı örnekleri karakterize etmek için
kullanılırken, her iki iyonun sıvı faz içindeki konsantrasyonu AAS kullanılarak ölçüldü.
Bu çalışma saf kaolinit ve klinoptilolit üzerindeki kurşun ve çinkonun kinetik ve
sorpsiyon izotermlerini de içermektedir. Ayrıca, farklı konsantrasyon ve pH
koşullarında kurşun ve çinkonun sorpsiyon davranışları saf kalsit ve magnezit ile olan
etkileşimine ek olarak, yüzde (kütle) 5,10, 25, ve 60 karbonat içeren klinoptilolit ve
kaolinit karışımları ile olan etkileşimi de araştırıldı. Oluşan çökelti morfolojisi, kurşun
ve çinko iyonlarının sorpsiyonundan dolayı kalsit, magnezit, kaolinit ve klinoptilolitteki
olası yapısal değişimi incelenmiştir. Elde edilen sonuçlara göre, kaolinit ve
klinoptilolitin kurşuna karşı sorpsiyon afinitesi, çinkoya karşı olan afinitesinden daha
büyüktür. Çalışılan deney koşullarında, kurşun ve çinko iyonlarının tutulma sırası
magnezit≥ kalsit> klinoptilolit> kaolinit şeklinde saptanmıştır. Çinko ve kurşun
iyonlarının başlangıç konsantrasyonları doygunluk koşullarına yükseltildiği zaman,
serusit (PbCO3) ve hidroserusit (Pb3(CO3)2(OH)2) çökeltilerin hızlı bir büyüme
gösterdiği gözlenmiştir. Magnezit ve kalsitin çözünürlüğünün artmasına neden olan
başlangıç pH ının 10’ a yükselmesi, hidrozinkitin çökmesinin artmasına ve serusit
yerine hidroserusit formunun oluşmasına yol açmıştır. Zn2+ ve Pb2+ iyonlarının kalsit ve
magnezit tarafından tutulması, karbonat gruplarının geometrisinin biraz değişmesine yol
açmakta, buda titreşim bantlarını etkilemektedir.

iii
TABLE OF CONTENTS
LIST OF FIGURES . . . . . . . . . . . . . . .. . . . . . . . . . . . . . . . . . . . . . . . . . . . . . . . ……...vi LIST OF TABLES . . . . . . . . . . . . . . . . . . . . . .. . . . . . . . . . . . . . . . . . . . . . . . . . ……...ix CHAPTER 1. INTRODUCTION . . . . . . . . . . . . . . . . . . . . . . . . . . . . . . . . . . . . . . …….1
1.1. General Consideration………………………………………………….1
1.2. Heavy Metals in the Environment ……………………………………2
1.2.1. Significance of Lead and Zinc…………………………………….2
1.2.1.1 Lead………………………………………………………….2
1.2.2.2. Zinc………………………………………………………….2
1.3. Soil Fractions: Clays, Zeolites, Carbonates…………………………...3
1.3.1. Clays………………………………………………………………3
1.3.1.1. Kaolinite…………………………………………………….5
1.3.2. Zeolites……………………………………………………………6
1.3.2.1. Clinoptilolite………………………………………………..8
1.3.3. Carbonates………………………………………………………10
1.3.3.1. Calcium Carbonate.. ……………………………………..11
1.3.3.2. Magnesium Carbonate……………………………………12
1.4. The Interaction Processes of Metal Ions and Soil…………………...13
1.5. The Present Study……………………………………………………15
1.5.1. Aim of Present Study…………………………………………….15
1.5.2. Applied Methods…………………………………………….......17
1.5.2.1. Atomic Absorption Spectroscopy (AAS)………………….17
1.5.2.2. X- ray Diffraction (XRPD)………………………………...19
1.5.2.3. Infrared Specroscopy (FTIR)………………………………21
1.5.2.4. Scanning Electron Microscope (SEM)…………………….21
1.5.2.5. Energy Dispersive X-Ray Spectroscopy (EDS)…………...23
CHAPTER 2. EXPERIMENTAL……………………………………………………...24
2.1. Preparation of Samples………………………………………………..24
2.1.1. Kinetic Experiments……………………………………………...24
2.1.2. Experiments on Mixtures…………………………………………25

iv
2.2. Analysis of Aqueous Solutions………………………………………..25
2.2.1. AAS……………………………………………………………….25
2.3. Analysis of Solid Phases………………………………………………26
2.3.1. FTIR…………………………………………………...................26
2.3.2. XRPD…………………………………………………………….26
2.3.3. SEM/EDS………………………………………………………..26
CHAPTER 3. RESULTS AND DISCUSSION…………………… ………………...28
3.1. Characterization of the Minerals……………………………………...28
3.1.1. Natural Kaolinite: XRPD, SEM/EDS and FTIR characterization..28
3.1.2. Natural Clinoptilolite:XRPD, SEM/EDS and FTIR characterization…………………………………………………...32
3.1.3. Calcite: XRPD, SEM/EDS, and FTIR characterization………….35
3.1.4. Magnesite : XRPD, SEM/EDS,and FTIR characterization………38
3.2. Sorption Studies on Natural Kaolinite and Natural Clinoptilolite…….40
3.2.1. Sorption of Zn2+ and Pb2+ on Natural Kaolinite…………………..40
3.2.1.1. Effect of Time……………………………………………....40
3.2.1.2. Effect of Concentration…………………………………. .42
3.2.1.3. Freundlich Isotherms of Loaded Kaolinite………………....43
3.2.1.4. XRPD and SEM/EDS Analysis of Loaded Kaolinite……...45
3.2.2. Sorption of Zn2+ and Pb2+ on Natural Clinoptilolite………………46
3.2.2.1. Effect of Time………………………………………………46
3.2.2.2. Effect of Concentration…………………………………….48
3.2.2.3. Freundlich Isotherms of Loaded Clinoptilolite…………….48
3.2.2.3. XRPD and SEM/EDS Analysis of Loaded Clinoptilolite….50
3.3. Sorption Studies on Mineral Mixtures…………………………...........51
3.3.1. Sorption of Zn2+ and Pb2+ on Calcite-Kaolinite Mixtures………...51
3.3.2. Sorption of Zn2+ and Pb2+ on Magnesite-Kaolinite Mixtures……..59
3.3.3. Sorption of Zn2+ and Pb2+ on Calcite-Clinoptilolite Mixtures……63
3.3.4. Sorption of Zn2+ and Pb2+ on Magnesite-Clinoptilolite Mixtures...66
3.4. Formation of Carbonate Phases of Zn2+ and Pb2+ ions……………….70
3.4.1. Carbonate Phases of Lead…………………………………………70
3.4.2. Carbonate Phases of Zinc…………………………………………78

v
CHAPTER 4. CONCLUSIONS AND RECOMMENDATIONS. . . . . . . . . . . . . . . . ..81 REFERENCES . . . . . . . . . . . . . . . . . . . . . . . . . . . . . . . . . . . . . . . . . . . . . . . . . . ……...84
APPENDICES . . . . . . . . . . . . . . . . . . . . . . . . . . . . . . . . . . . . …....................................91

vi
LIST OF FIGURES
Figure Page Figure 1.1. Structure of tetrahedral sheet and octahedral sheet of clay …………………4
Figure 1.2. Structure of kaolinite ………………………………………………….........5
Figure 1.3. Illusration of typical zeolite crystal formation………………………………7
Figure 1.4. a) Orientation of clinoptilolite channel axis b) Model framework for the structure of clinoptilolite ………………………………………………...9
Figure 1.5. The c-axis projection of the structure of clinoptilolite……………………..10
Figure 1.6. The structure of calcite ……………………………………………………………….11
Figure 1.7. Crystal-chemical structure of magnesite…………………………………...12
Figure 1.8. Illustration of the AAS……………………………………………………..18
Figure 1.9. Illustration of Bragg’s Law…………………………………………...........20
Figure 1.10. Basic features of the SEM………………………………………………...22
Figure 3.1. XRD-mineralogical analysis of kaolinite…………………………………..28
Figure 3.2. A typical SEM image of kaolinite…………………………………….........29
Figure 3.3. FTIR spectra of kaolinite……………………… ………………………..31
Figure 3.4. XRPD- pattern of clinoptilolite……………………………………….........32
Figure 3.5. A typical SEM image of clinoptilolite………………………………..........33
Figure 3.6. FTIR spectra of clinoptilolite………………………………………………35
Figure 3.7. XRPD diagram of calcite……………….………………………….............36
Figure 3.8. A typical SEM image of calcite……………………………………………36
Figure 3.9. FTIR spectrum of calcite…………………………………………………...38
Figure 3.10. XRPD of magnesite………………………………………………….........39
Figure 3.11. A typical SEM image of magnesite…………………………………… 39
Figure 3.12. FTIR spectrum of magnesite………………………………………...........40
Figure 3.13. The effect of time of mixing on the sorption of Zn2+ ion on kaolinite .....41
Figure 3.14. The effect of time of mixing on the sorption of Pb2+ ion on kaolinite.......41
Figure 3.15. Freundlich plots corresponding to sorption of Zn2+ ion on kaolinite…..... 44
Figure 3.16. Freundlich plots corresponding to sorption of Pb2+ ion on kaolinite…….44
Figure 3.17. EDS maps showing the distribution of (a) Al, Si, and Zn (b) Al, Si, and Pb on kaolinite surface………………………………………….........46

vii
Figure 3.18. The effect of time of mixing on the sorption of Zn2+ ion on clinoptilolite……………………………………………………………….47
Figure 3.19. The effect of time of mixing on the sorption of Pb2+ ion on clinoptilolite………………………………………………………………47
Figure 3.20. Freundlich plots corresponding to sorption of Zn2+ ion on kaolinite……49
Figure 3.21. Freundlich plots corresponding to sorption of Pb2+ ion on kaolinite… ..49
Figure 3.22. EDS maps showing the distribution of (a) Al, Si, and Zn (b)Al, Si, and Pb on clinoptilolite surface…………………………………………..51
Figure 3.23. Variation of the equilibrium concentration on the solid phase with that in the liquid phase for different Zn2+ loading, and mixture compositions for calcite-kaolinite………………………………………..53
Figure 3.24. Variation of the equilibrium concentration on the solid phase with that in the liquid phase for different Pb2+ loading, and mixture compositions for calcite-kaolinite……………………………………….54
Figure 3.25. The change of percentage sorption with the fraction of calcite at initial loadings of 500, 3000, and 10000 mg/L of Zn(NO3)2 on calcite-kaolinite.55
Figure 3.26. The change of percentage sorption with the fraction of calcite at initial loadings of 500, 3000, and 10000 mg/L of Pb(NO3)2 on calcite-kaolinite.55
Figure 3.27. Variation of the concentration of sorbed Zn2+ ion (mg/g) with the equilibrium liquid concentration (mg/L) on magnesite-kaolinite……61
Figure 3.28. Variation of the concentration of sorbed Pb2+ ion (mg/g) with the equilibrium liquid concentration (mg/L) on magnesite-kaolinite……61
Figure 3.29. Change in the percentage sorption of Zn2+ ion with the amount of magnesite in the mixtures of magnesite-kaolinite …………………….62
Figure 3.30. Change in the percentage sorption of Pb2+ ion with the amount of magnesite in the mixtures of magnesite-kaolinite …………………….62
Figure 3.31. Variation of the equilibrium concentration on the solid phase with that in the liquid phase for different Zn2+ loading, and mixture compositions for calcite-clinoptilolite…………………………………...64
Figure 3.32. Variation of the equilibrium concentration on the solid phase with that in the liquid phase for different Pb2+loadings, and mixture compositions for calcite-clinoptilolite…………………………………...65
Figure 3.33. The change of percentage sorption with the fraction of calcite at initial loadings of 500, 3000, and 10000 mg/L of Zn(NO3)26(H2O) on calcite- clinoptilolite………………………………………………………………65
Figure 3.34. The change of percentage sorption with the fraction of calcite at initial loadings of 500, 3000, and 10000 mg/L of Pb(NO3)2 on calcite- clinoptilolite………………………………………………………………66
Figure 3.35. Variation of the concentration of sorbed Zn2+ ion (mg/g) with the equilibrium liquid concentration (mg/L) on magnesite-clinoptilolite mixture……………………………………………………………….........68

viii
Figure 3.36. Variation of the concentration of sorbed Pb2+ ion (mg/g) with the equilibrium liquid concentration (mg/L) on magnesite-clinoptilolite mixture……………………………………………………………….........68
Figure 3.37. Change in the percentage sorption of Zn2+ ion with the amount of magnesite in the mixtures of magnesite-clinoptilolite…………………69
Figure 3.38. Change in the percentage sorption of Pb2+ ion with the amount of magnesite in the mixtures of magnesite-clinoptilolite…………………69
Figure 3.39. XRPD patterns showing the features of cerussite and hydrocerussite obtained upon interaction of Pb2+ ions with magnesite with no pH modification ……………………………………………………………...71
Figure 3.40. XRPD patterns showing the features of hydrocerussite obtained upon interaction of Pb2+ ions with magnesite with initial pH of 10.0……………………………………………………………...................71
Figure 3.41. XRPD patterns showing features of cerussite and hydrocerussite obtained upon interaction of Pb2+ ions with magnesite with no pH modification……………………………………………………………….72
Figure 3.42. XRPD patterns showing (a) the features of hdrocerussite obtained upon interaction of Pb2+ ions with magnesite with pH 10……...72
Figure 3.43. Typical SEM microimages showing the features of cerussite and hydrocerussite obtained upon interaction of Pb2+ ions with calcite
with (a)no pH modification, and (b) the features of hydrocerussite obtained upon interaction of Pb2+ ions with calcite with initial pH of 10,0………………………………………………………………………..73
Figure 3.44. Typical SEM microimages of (a) cerussite crystals embedded in between crystals of hydrocerussite and magnesite (b)hydrocerussite crystals……………………………………………………………….........74
Figure 3.45. Typical SEM micrographs of: cerussite powder stored under ambient conditions for nine months………………………………………….........75
Figure 3.46. FTIR spectra of calcite and Pb-loaded calcite no pH control ……………76
Figure 3.47. FTIR spectra of calcite and Pb-loaded calcite pH=10………………… .77
Figure 3.48. FTIR spectra of Pb-loaded magnesite no pH control ……………………77
Figure 3.49. FTIR spectra of Pb-loaded magnesite for pH=10………………………..78
Figure 3.50. XRPD patterns showing the features of hydronzincite obtained upon interaction of Zn2+ ions with magnesite…………………………………..79
Figure 3.51. XRPD patterns showing the features of hydronzincite obtained upon interaction of Zn2+ ions with calcite………………………………………80
Figure 3.52. Typical SEM microimages of hydrozincite for (a) calcite (b) magnesite…………………………………………………………….........80
Figure 3.53. FTIR spectra of calcite (a), Zn-loaded calcite……………………….........81
Figure 3.54. FTIR spectra of magnesite (a), Zn loaded magnesite……………… …..81
ix
LIST OF TABLES
Table Page
Table 1.1. Natural Zeolite Deposits in Turkey and Types ………………………………8
Table 3.1. Elemental content of Kaolinite as obtained by EDS ………………….........30
Table 3.2. Assignments of the bands appearing in the FTIR spectrum of natural Kaolinite……………………………………………………………….........31
Table 3.3. Elementel composition of Clinoptilolite as obtained by EDS ……………...34
Table 3.4. The values of percentage sorption of Zn2+ and Pb2+on individual kaolinite……………………………………………………………….........42
Table 3.5. Freundlich parameters , n and k, obtained from the fits of the sorption data of Zn2+ and Pb2+ ion on kaolinite. R corresponds to the linear correlation coefficient of the plots…………………………………………..45
Table 3.6. The values of percentage sorption of Zn2+ and Pb2+on individual clinoptilolite………………………………………………………………...48
Table 3.7. Freundlich parameters , n and k, obtained from the fits of the sorption data of Zn2+ Pb2+ ion on kaolinite and clinoptilolite. R corresponds to the linear correlation coefficient of the plots …………………………………..50 Table 3.8. The values of percentage sorption of Zn2+ on individual kaolinite, and calcite minerals, in addition to calcite- kaolinite………………............52
Table 3.9. The values of percentage sorption of Pb2+ on individual kaolinite, and calcite minerals, in addition to calcite-kaolinite mixtures……………..52
Table 3.10. The ionic radii of Ca2+, Zn2+, and Pb2+ and Gibbs free energies of formation of the aqueous cations in addition to their rhombohedral carbonates. The table provides also the calculated log DMe, ideal which shows the theoretical partitioning at the calcite/solution interface………...57
Table 3.11. The values of percentage sorption of Zn2+ on individual kaolinite and magnezitezite minerals, in addition to magnezite-kaolinite mixtures………………………………………………………………........59
Table 3.12. The values of percentage sorption of Pb2+ on individual kaolinite, and calcite minerals, in addition to calcite-kaolinite mixtures……….........60 Table 3.13. The values of percentage sorption of Zn2+ on individual clinoptilolite and calcite minerals, in addition to calcite-clinoptilolite mixtures…………………………………………………………………...63
Table 3.14. The values of percentage sorption of Pb2+ on individual clinoptilolite
and calcite minerals, in addition to calcite-clinoptilolite mixtures……………………………………………………………….......64

x
Table 3.15. The values of percentage sorption of Zn2+ on individual clinoptilolite and magnesite minerals, in addition to magnesite-clinoptilolite mixtures……………………………………………………………….......67
Table 3.16. The values of percentage sorption of Pb2+ on individual clinoptilolite and magnesite minerals, in addition to magnesite-clinoptilolite mixtures……………………………………………………………….......67

1
CHAPTER 1
INTRODUCTION
1.1. General Consideration
The term ‘heavy metal’ is used to describe any metallic chemical element
which has a relatively high density and is toxic or poisonous even at low concentrations.
Heavy metals are natural components of the Earth's crust which cannot be degraded or
destroyed. Therefore, they tend to accumulate in soils and sediments. Examples of
heavy metals include lead, zinc, copper, nickel, mercury, chromium, and cadmium.
[Pierzynski et al. 1995, p.167, Hooda et al. 1998, p.121]
Heavy metals can be toxic to living things at certain levels. Although they occur
naturally, they might also come from many different sources. These include some
mining industries, burning of fossil fuels, like coal, burning garbage or tobacco, and
even forest fires, the thing leading to release of a variety of heavy metals into the
environment. [Allen et al. 1995, p.255, Sekar et al. 2004, p.1]
Heavy metals can enter our bodies via food, drinking water and air to a small
extent. Although some heavy metals are very important to maintain the metabolism of
the human body as trace elements, they can lead to poisoning at higher concentrations.
Heavy metal poisoning could result, for example, from drinking-water contamination
(e.g. lead pipes), high ambient air concentrations near emission sources, or intake via
the food chain. There are a lot of health effects of heavy metals. These include various
types of cancer, kidney damage, and even death in some instances of exposure to very
high concentrations. [Appel et al. 2002, p.582]

2
1.2. Heavy Metals in the Environment
1.2.1. Significance of Lead and Zinc
1.2.1.1. Lead:
Lead is a well- known metal toxicant which has an atomic number of 82, an
atomic mass of 207.19, and is located in Group IVA of the Periodic Table. It is a bluish
- white, soft metal with a density of 11.34 gr\cm3, a melting point of 327.5 oC, and
boiling point about 1740 oC.
Lead is a naturally occurring element which consists of 52 % 208Pb, 24% 206Pb,
23% 207Pb, and 1 % 204Pb. Radioactive 210Pb, from radon decay, plays also a role, for
example, in waters and sediments. It can be found in all environmental media (air, soil,
rocks, sediments, water) and in all components of the biosphere. The most important
lead minerals are galena (lead sulfide), cerussite (lead carbonate), and anglesite (lead
sulfate). [Ohnesorge et al. 1991, p. 971-974].
Although lead is used in batteries, petrol additives, extruded products, alloys,
pigments, cable sheathing, lead pollution, irrespective of source, is of major concern
because of its long residence time in the soil and its possible association with cognitive
development in children. Lead can be transported into water bodies by natural
circulation and consequently threaten human life because of its well known toxicity,
accumulation in food chains and persistence in nature. Accumulation of lead is mainly
in the bones, brain, kidney and muscles and may cause, many serious disorders like
anemia, kidney disease, nervous disorders and sickness even death. [Yu et al. 2001,
p.83, Prasad et al. 2000, p.3034]
1.2.1.2. Zinc:
Zinc plays an important role as an essential trace elements in all living systems
from bacteria to humans. Zinc is a bluish white, rather soft metal, which solidifies in
3
hexagonal crystals and belongs to the group IIB elements of the Periodic Table. It is a
member of transition elements. Its atomic number is 30, its atomic mass 65.39, and its
density 7,14 g/cm3. The melting point is 419.58 oC and the boiling point 907 oC.
[Ohnesorge et al. 1991, p.1309]
Zinc is used in soldering compounds, galvanized wire, batteries, steel works
with galvanizing lines, fiber production, newsprint paper production and certain paints.
Zinc is not very toxic. Significiant excesses are toxic and produce signs similar to lead
poisoning. It usually enters the body when a person consumes food, drink, or dietary
supplements containing the element. For humans and animals, a deficiency of Zn can
cause anorexia and growth depression. Normally, zinc leaves the body in urine and
feces. There are alot of health effects of zinc if people are exposed with elevated levels.
It may interfere with the body's immune system and affect the body's ability to utilize
other essential minerals and cause digestive problems such as stomach cramps, nausea,
and vomiting. When large amounts of zinc are inhaled, a short-term disease called metal
fume fever may occur. Scientists doubt that zinc plays a role in cancer. [Pardo-Botello
et al. 2004, p.292, Nachtegaal et al. 2004, p.14].
Turkey contains natural deposits of some heavy metals. Lead and Zinc deposits
occur mainly in Balıkesir (Balya Mine), Çanakkale (Yenice Mines), Yozgat, Niğde,
Adana (Horzum), Kayseri, Sivas (Koyulhisar ve Aktepe Mines) WEB_1 (1996).
1.3. Soil Fractions: Clays, Zeolites, Carbonates
1.3.1. Clays:
Clay is a naturally occuring, inorganic component of most soils. Clays are the
products of the weathering of rocks and are widely distributed. Clay minerals are
essentially hydrous aluminum silicates of very small particle size (<2 µm). In some, Mg
and Fe substitute in part for aluminum and alkali or alkaline earths may be present as
essential constituents as a result of isomorphous substitution. [Rouquerol et al. 1999,
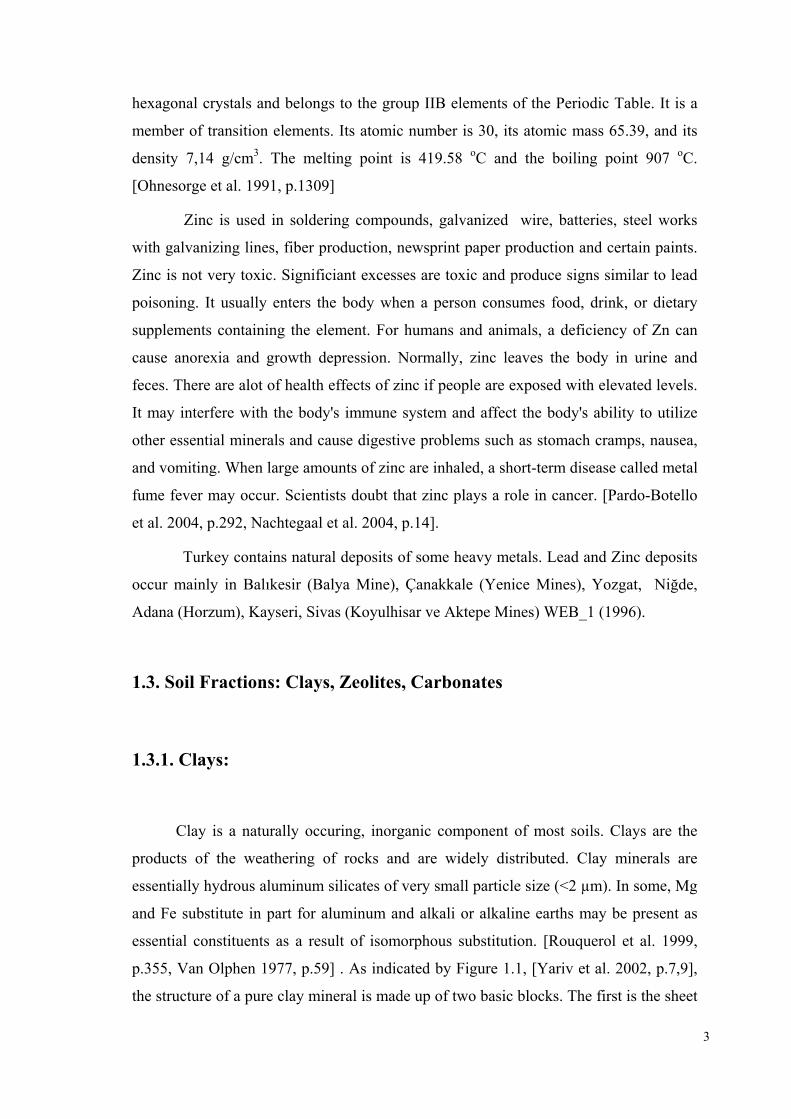
p.355, Van Olphen 1977, p.59] . As indicated by Figure 1.1, [Yariv et al. 2002, p.7,9],
the structure of a pure clay mineral is made up of two basic blocks. The first is the sheet
4
formed of silicon tetrahedral units and the second is another sheet composed of
aluminum octahedral units. The stacking of these sheets into layers, the bonding
between layers, and the substitution of other ions for Al and Si determines the type of
the clay minerals. Among the properties of clay minerals are their plasticity, when
mixed with a small amount of water, their low permeability, thermal stability, and wide
availability. Although a clay may be made up of a single clay mineral, there are usually
several mixed with other minerals such as fieldpars, quartz, carbonates, and micas.
[Shahwan 2000, p.8]
Tetrahedral Layer
Octahedral Layer
Figure 1.1. Structure of tetrahedral sheet and octahedral sheet of clay
Clay deposits can be found in estuaries, coastal plains, continental shelves, and
offshore islands of various parts of the world. These geographic zones are usually the
economic, industrial, commercial, and residential hubs of regions [Lim et al. 2002,
p.806]. Turkey has plenty of clay deposits. Deposits of clays, suitable for ceramics
manufacture, are produced in Bilecik regions, İstanbul, Şile and Beykoz. Most of
Kaolin deposits in Turkey are concentrated in the Marmara Sea Region, particularly in
Balıkesir zone. WEB_1 (1996)

5
1.3.3.1. Kaolinite:
Kaolinite is the most known example of 1:1 type clay. The ideal formula of
kaolinite is Al2Si2O5(OH)4. As Figure 1.2, [Shahwan 2000, p.10], indicates,
kaolinite consists of an octahedrally coordinated sheet of aluminium ions and
tetrahedrally coordinated sheet of silicon ions. When these sheets stack, OH ions of
one sheet, O ions of its neighbour sheet provide connection between tetrahedral
silicate (SiO4 ) and octahedral gibbsite layers (Al(OH)2). As a result the structure of
kaolinite becomes tightly bound by H bonding. Therefore, most sorption activity
occurs along the edges and surfaces of the structure. It is nonexpandable and possess
a cation exchange capacity (CEC) of 3-15 meq /100 g. [Coles et al. 2002, p.40,
Rouquerol et al. 1999, p.358, Hu et al. 2003, p.1279].
Figure 1.2. Structure of kaolinite
Kaolinite which is essential to the production of ceramics and porcelain is also
used as a filler for paint, rubber and plastics because of relatively inert and long

6
lasting, but the greatest demand for kaolinite is in the paper industry to produce a glossy
paper such as is used in most magazines.
Three kaolin production areas, which are dominate the world markets, are the
sedimentary kaolins in Georgia and South Carolina in the United States; the primary
kaolins in the Cornwall area of Southwestern England; and the sedimentary kaolins in
the lower Amazon basin in Brazil. Other kaolin deposits, which are regionally
important, are located in China, Australia, Argentina, Czech Republic, France,
Germany, Indonesia, Iran, Mexico, South Korea, Spain, Turkey, and Ukraine. [Kissel et
al. 1989, p.488]. The natural kaolinite used in this study was obtained from the Sındırgı,
located on the western part of Anatolia.
1.3.2. Zeolites:
Zeolites has three dimensional crystal structure. They are naturally occuring
crystalline, hydrated aluminasilicates of alkali and alkaline earth cations which are
characterized by cage-like structures, high surface areas (hundreds of m2/g) and high
cation exchange capacities (at least hundreds of meq/kg), [Sheta et al. 2003, p.127] .
Natural zeolites can occur in greater sized aggregates and are free of shrink
swell behavior observed in some clays. Most zeolites are rich in Na+, K +, and Ca2+ ,
which are usually exchangeable with other metal ions. Although zeolites have been
known for centuries, their value as adsorbent material was only realized some 4 decades
ago. Adsorption properties of zeolite are affected by structure, location and size of its
cations and presence of molecules formerly adsorbed [Feng et al. 2000, p.360]. Figure
1.3, WEB_2 (1996), shows a typical zeolite crystal formation with the open-cage
structure and the position of oxygen and silicon atoms. When silicon is replaced by
aluminium, an overall negative charge results, a well- known property of zeolites.

7
Figure 1.3. Illusration of typical zeolite crystal formation (circle = oxygen, square = silicon, aluminium)
Each zeolite mineral has a separate capacity and an ion exchange selectivity.
Several factors, which can affect both the ion exchange selectivity and capacity of the
specific zeolite mineral, must be considered in this process. These include ionic
strength, pH, temperature and the presence of other competing cations in the solution.
Alteration of glassrich volcanic rocks with fresh or saline water in playa lakes
or by seawater form most common natural zeolites. Also, zeolites are deposited in lava
flows. Because of their specific structure and physical and chemical properties, natural
zeolites have found applications in the field of pollution control, including control of
hardness, ammonium nitrogen, heavy metals, air pollutants, and radioactive
contaminants [Badillo-Almaraz et al. 2003, p.424, Trgo et al. 2003, p.167].
Internationally, zeolite deposits are found in Canada, Japan, New Zealand,
Bulgaria, USA, British Columbia, Austria and Turkey. Clinoptilolite and Analcime, two
types of zeolites, are found in Turkey with great amounts. Locations and types of
natural zeolites in Turkey are given in Table 1.1. [Özkan 1996, p.2, Narin 2001, p.15]

8
Table 1.1. Natural zeolite deposits in Turkey and types
Region Type
İzmir, Urla Clinoptilolite
Balıkesir, Bigadiç Clinoptilolite
Clinoptilolite
Chabazite
Mordenite Kapadokya Region (Tuzköy, Karain village)
Erionite
Gördes Clinoptilolite
Emet, Yukarı Yoncaağaç Clinoptilolite
Bahçecik, Gülpazarı, Göynük Analcime
Polatlı, Mülk, Oğlakçı, Ayaş Analcime
Nalıhan, Çayırhan, Sabanözü Analcime
Kalecik, Çandar, Hasayar Analcime
1.3.2.1. Clinoptilolite:
Clinoptilolite is the most abundant zeolite in nature because of wide geographic
distribution and the large size of deposits. The ideal formula of Clinoptilolite is
(Na,K,Ca)6Al6Si30O72*24H2O. [Tanaka et al. 2003, p.713]. As Figure 1.4 [Top
2001, p.23] shows, the structure of clinoptilolite consists of two dimensional
systems of three types of channel. A channel contains of 10 member ring, B channel

9
contains of 8 member ring, and perpendicularly intersected by C channel is 8
memberring.
(a) (b)
Figure 1.4. a) Orientation of clinoptilolite channel axis b) Model framework for the structure of clinoptilolite. As illustrated by Figure 1.5 [Top 2001, p.24], the structure of clinoptilolite
include cation sites. In this structure, the main cation positions; M(1), M(2), M(3)
located in channel A, B, C. In clinoptilolite, these channels are predominantly occupied
by Na, K, Ca and H2O. Na resides in the larger A channel, Ca resides in the smaller B
channel, K resides in the C channel. Na bonds to 2 framework O atoms and 5 of water
molecules, Ca bonds to 3 framework O atoms and 5 of water molecules, K bonds to 6
framework O atoms and 3 of water molecules.The CEC of clinoptilolite was reported
that to be 222-238 meq/100 g. [Langella et al 2000, p.339]

10
Figure 1.5. The c-axis projection of the structure of clinoptilolite.
Clinoptilolite is used in various applications such as adsorption processes, ion
exhanger, in gas seperation. This mineral has been used since several years as an
additive to feed for sheep, pigs, cattle and chickens. [Tanaka et al. 2003, p.713]
1.3.3. Carbonates:
Carbonates are common constituents of the Earth's near-surface crust. They
comprise about 4 % by weight of Earth’s Crust. They tend to originate in sedimentary
rocks where calcite and dolomite are the most abundant carbonate minerals, beside them
siderite, FeCO3 and rhodocrysite, MnCO3, may be present. The large availability of
carbonate minerals makes them among the most important minerals that can affect the
biogeochemical cycles of heavy metals in the environment.Carbonate minerals are
essential due to the fact that they regulate the aquatic environments via precipitation,
dissolution and sorption reactions which are controlled by chemical process and which
take place at the interface between mineral lattice and bulk solution. [Shahwan et al.
2002, p.563]. Due to the fact that carbonates are soluble in aqueous solutions the
determination of surface charge by potentiometric titration is diffucult.
11
When associated with clays and zeolites, carbonate minerals can affect the
uptake properties of them due to the difference in their sorption characteristics and
capacities.
1.3.3.1. Calcium Carbonate (CaCO3):
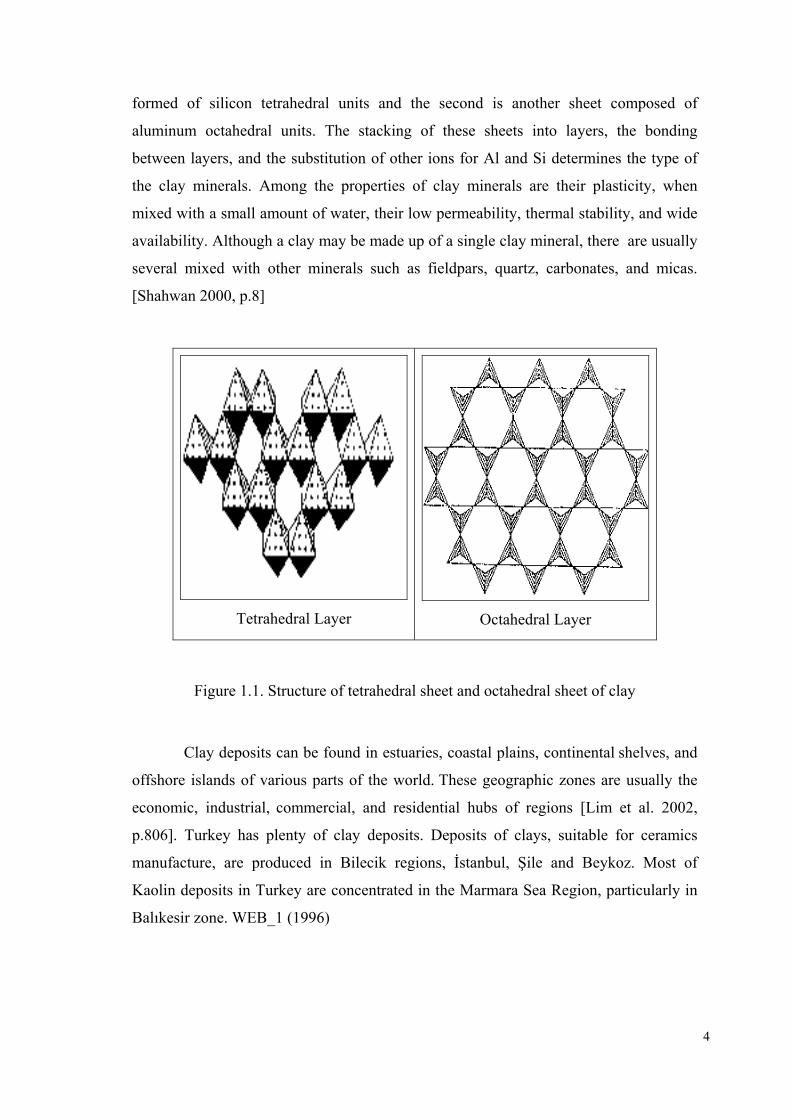
It is one of the most common minerals on the surface of the Earth and also have
an additional biological importance. CaCO3 can exist in three polymorphs; calcite,
aragonite, and vaterite. Calcite is the most thermodynamically stable one at room
temperature and atmospheric pressure. Also, calcite can exist as limestone or
marble. Limestone transforms marble under the effect of heat and pressure of
metamorphic events. Calcite occurs in all colors, sometimes even multicolored.
[Smyth et al 1997, p.1595]. It has hexagonal structure with the trigonal carbonate
ions being coplanar as seen in Figure 1.6 WEB_4 (1996).
Figure 1.6. The structure of calcite .
-
12
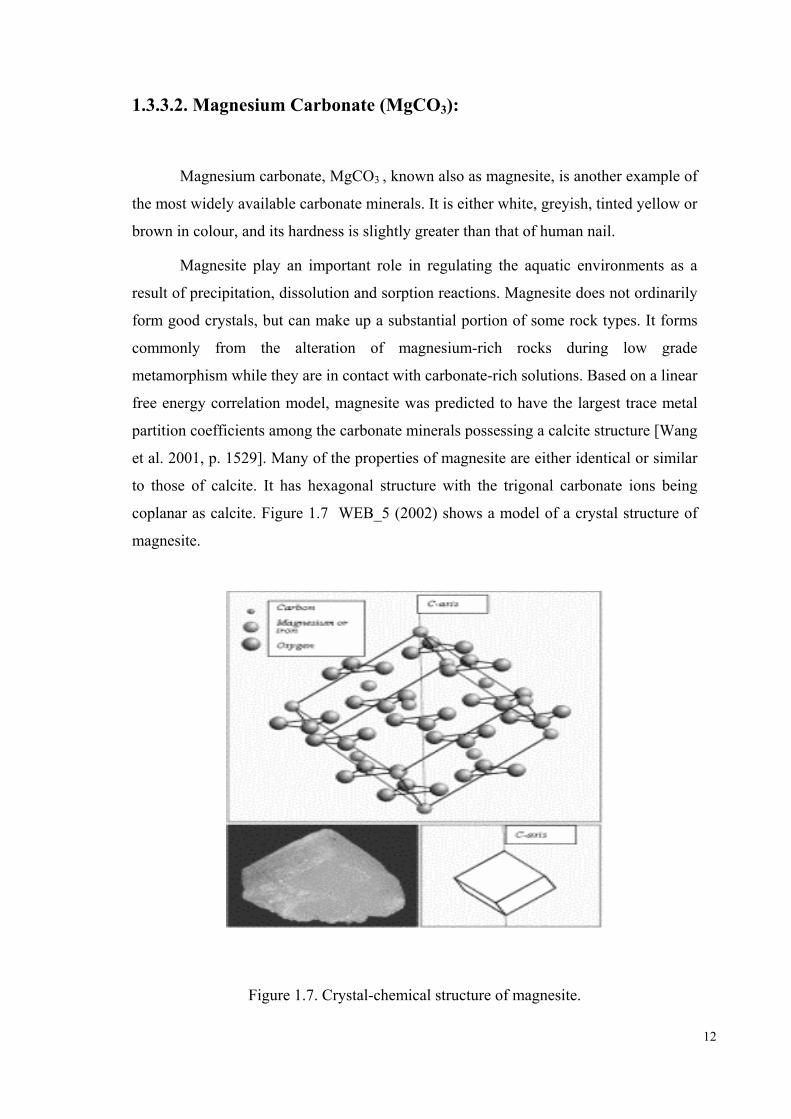
1.3.3.2. Magnesium Carbonate (MgCO3):
Magnesium carbonate, MgCO3 , known also as magnesite, is another example of
the most widely available carbonate minerals. It is either white, greyish, tinted yellow or
brown in colour, and its hardness is slightly greater than that of human nail.
Magnesite play an important role in regulating the aquatic environments as a
result of precipitation, dissolution and sorption reactions. Magnesite does not ordinarily
form good crystals, but can make up a substantial portion of some rock types. It forms
commonly from the alteration of magnesium-rich rocks during low grade
metamorphism while they are in contact with carbonate-rich solutions. Based on a linear
free energy correlation model, magnesite was predicted to have the largest trace metal
partition coefficients among the carbonate minerals possessing a calcite structure [Wang
et al. 2001, p. 1529]. Many of the properties of magnesite are either identical or similar
to those of calcite. It has hexagonal structure with the trigonal carbonate ions being
coplanar as calcite. Figure 1.7 WEB_5 (2002) shows a model of a crystal structure of
magnesite.
Figure 1.7. Crystal-chemical structure of magnesite.

13
1.4. The Interaction Processes of Metal Ions and Soil
Soil is both a heavy metals’s adsorbent and a source of them. The residence time
of most heavy metals is very long. The interaction of metal ions with natural soil
particles is complex therefore, it involves multiple mechanisms [Pierzynski et al. 1994,
p.167; Allen et al. 1995, p.255]. Sorption is an important process that can regulate the
transport of chemical species through the hydrosphere. The term “sorption” is generally
used to refer to three important processes: adsorption, surface precipitation, and
fixation. Adsorption is a two-dimensional accumulation of matter at the solid/water
interface and is understood primarily in terms of intermolecular interactions between
solute and solid phases. The surface complexation model is able to describe the
adsorption behavior at low cation concentrations very exactly but it is not able to
describe the adsorption curves obtained at higher concentrations. In the first case, the
curves can be described approximately by a Langmuir isotherm where a saturation of
the adsorption capacity is reached. In the second case a continuous increase without
saturation at the surface is observed, which is fitted better by a Freundlich isotherm. To
explain this behavior the so-called surface precipitation model has been developed,
which takes into account precipitation reactions in addition to adsorption reactions at
the surface. The third principal mechanism of sorption is fixation or absorption, which
involves the diffusion of an aqueous metal species into the solid phase. Like surface
precipitation or coprecipitation, absorption is three-dimensional in nature. Heavy metals
that are specifically adsorbed onto clay minerals and metal oxides may diffuse into the
lattice structures of these minerals. The metals become fixed into the pore spaces of the
mineral structure (solid-state diffusion). In order to remove the heavy metals, the total
dissolution of the particles in which they are incorporated may be required. [Bradl 2004,
p.6]
Sorption of heavy metal ions on soils and soil constituents is influenced by a
variety of parameters. These are pH, metal ion, soil type (composition, aging). Soil pH
is the most important parameter influencing metal-solution and soil surface chemistry.
The dependence of heavy metal adsorption on, e.g., clays on solution pH has been
noticed early. The number of negatively charged surface sites increases with pH. In
general, heavy metal adsorption is small at low pH values. At high pH values, the metal

14
ions are completely removed. The pH is a primary variable, which determines cation
and anion adsorption onto oxide minerals. [Bradl 2004, p.10]
The soil type and composition plays an important role for heavy metal
retention. In general, coarse-grained soils exhibit lower tendency for heavy metal
adsorption than fine grained soils. The fine-grained soil fraction contents soil particles
with large surface reactivities and large surface areas such as clay minerals, iron and
manganese oxyhydroxides, humic acids, and others, and displays enhanced adsorption
properties. Clays are known for their ability to effectively remove heavy metals by
specific adsorption and cation exchange as well as metal oxyhydroxides. Depending
upon the variability in physical and chemical characteristics of metals , their affinity to
soil components governs their speciation [Pendias et al. 1992, Bradl 2004, p.11].
Alternatively, the sorption mechanism on the calcite fractions can plausibly occur via
various processes; ion exchange, burial of the ions within the lattice of carbonate upon
recrystallization, formation of surface complexes with >CaOH and >CO3H groups,
precipitation as metal-carbonate, metal hydroxide, or both, and solid state diffusion. [Xu
et al. 1996, p.2801].
Generally consistent rules of metal selectivity cannot be given as it depends on a
number of factors such as the chemical nature of the reactive surface groups, the level
of adsorption (i.e., adsorbate/adsorbent ratio), the pH at which adsorption is measured,
the ionic strength of the solution in which adsorption is measured, which determines the
intensity of competition by other cations for the bonding sites, and the presence of
soluble ligands that could complex the free metal. All these variables may change the
metal adsorption isotherms. Competition from monovalent metal in background
electrolytes has relatively little effect on adsorption on heavy metals. Preference or
affinity is measured by a selectivity or distribution coefficient. The reduction of this
selectivity with increased adsorption is observed for metal adsorption on both clays as
soil components and pure minerals. [Bradl 2004, p.10)
The distribution ratio, Rd, is widely used in the description of the partition of a
sorbed cation/anion among the solid and liquid phases. Rd in an emprical constant, that
is subjective to the operating experimental conditions, and thus is not a fully
equilibrium constant.
Several types of reactions can be attributed to forces associated with charge
sites. The term for trading ions with the surrounding water is "ion exchange". Ion

15
exchange is an important process in soils. For the ion exchange reaction to take place,
three concurrent processes usually should take place. (1) diffusion of ions through the
solution film that surrounds the soil particles, usually called film diffusion; (2) diffusion
of ions through the hydrated surface of the soil particle, named as particle diffusion; and
(3) chemical exchange reaction of ions from the particle surface, referred to as chemical
reaction. [Liu et al. 1995, p.838).
The ordinary clays in many agricultural soils have a limited capacity for ion
exchange because of their two dimensional framework structure. Zeolites were the first
known materials capable of ion exchange since they have three dimensional structure.
The affinity for sorption differs depending on (i) the charge of the ion, (ii) the ionic
radious and the degree of hydration. The larger the charge on the ion, the greater is the
force that the functional groups of the opposite charge of the ion exchanger attract. The
greater the volume of the ion, the weaker is its electric field in the solution and
therefore, the smaller is its degree of hydratation. The hydrodynamic radii of ions
decrease with increasing atomic weight and hence their exchange energy when the ion
is transported from the solution to the ion exchanger. [Shahwan 2000, p.18].
1.5. The Present Study
1.5.1. Aim of Present Study
The primary aim of this study is to elucidate the effect of calcite and magnesite
on the uptake of lead and zinc by mixtures of these carbonates with kaolinite and
clinoptilolite. The study have also included determination of kinetics and sorption
isotherms of lead and zinc on pure kaolinite and clinoptilolite. In addition, the study is
discussing the mechanisms of uptake of lead and zinc at different concentration levels
for different mixtures and pH conditions, the morphologies of the formed precipitates,
the plausible structural changes in the lattice of calcite, magnesite, kaolinite,
clinoptilolite resulting from sorption of lead and zinc ions.
The sorption behavior of and/ Zn2+ or Pb2+ on kaolinite was investigated in a
number of studies. The uptake of Zn is reported to proceed via fast kinetics and to obey
Fruendlich and Dubinin –Radushkevich types of isotherm [Erten et al. 1994, p.375]. In
another study, it was concluded that the interactions of the heavy metals (Pb, Zn) with

16
kaolinite could affect the structure of this mineral and influence properties such as
swelling capacity, compaction capability and the double layer behaviour. [Miranda-
Trevino et al. 2003, p.133, Coles et al. 2002, p.39-40, Nachtegaal et al. 2004, p.14].
Also, it was found that Pb2+ adsorption is higher than Zn2+ on clay minerals for the
higher concentrations. [Auboiroux et al.1996, p.117, Ikhsan et al. 1999, p.408, Saha et
al. 2001, p.694, Bradl 2004, p.14, Badawy et al. 2002, p.167, Gupta et al. 2001, p.1131,
Jain et al. 1997, p.157, Singh et al. 2001, p.1961]
The uptake of both cations on clinoptilolite was reported in several studies.
According to these studies, clinoptilolite favors Pb2+ over Zn2+ [Peric et al. 2004,
p.1893, Badillo-Almaraz et al. 2003, p.424, Li et al. 2002, p.1106, Inglezakis et al.
2003, p.49, Çulfaz et al. 2003, p.94, Langella et al. 2000, p.337].
Retention of Pb2+ and /or Zn2+ on pure calcite was the subject of a number of
investigations. [Godelitsas et al. 2003, p.424, Sipos et al. 2004, p.363, Lin et al. 1995,
p.303-309, Mercy et al. 1998, p.739-745, Mesquita et al. 1996, p.137-146, Elzinga et al.
2002, p.3943]. On the contrary, the number of sorption studies of both ions on
magnesite is very limited. Calcite is reported to retard Pb in higher quantity, compared
to Zn [El-Korashy 2003, p.1709, Echeverria et al. 1998, p.275, Godelitsas et al. 2003,
p.3353]. The retardation mechanism of Pb2+ and Zn2+ is believed to range from ion-
exchange to precipitate formation (cerussite, hydrocerussite for Pb, hydrozincite for
Zn). It was found that upon of Pb2+, calcite disappeared almost totally, yielding the
formation of cerussite, PbCO3. Increasing the pH and initial concentration have caused
the formation of hydrocerussite. [Godelitsas et al. 2003, p.3351, Sipos et al. 2004,
p.369, Lin et al. 1995, p.303]. Mercy et al. 1998, p.739 concluded that hydrocerussite is
the most stable in waters. According to Prasad et al. 2000, p.3034 natural minerals
(carbonic rock) are effective in removing 65-99% of lead ions. On the other hand, Zn2+
retention on calcite occurs by precipitation as hydrozincite, Zn5(OH)6(CO3)2 under
appropriate loading and pH conditions. [Garcia-Sanchez et al. 2002, p.539]
The primary motivation of this study is the scarcity in literature resources of
studies dealing with the effect of association of clays and zeolites by calcite and
magnesite on the uptake capacities and mechanisms of these clays and zeolites. A
limited number of studies is available on the uptake of Pb2+ and/or Zn2+ by different
calcareous soils, but, to our knowledge, none is available on magnesite association with
soils. A radiotracer study of the sorption characteristics of Zinc (II) by calcareous soil

17
suggests that the contribution of calcite to the Zn2+ sorption by the two calcareous soils
was approximately 70 % of the total amount sorbed, thus the calcite in calcareous soil
is undoubtedly the most significant sink for zinc at high pH range.[Wenming et al.
2001, p.371]
The techniques applied in this study include Atomic Absorption Spectroscopy
(AAS), X Ray Powder Diffraction (XRPD), Infrared Spectroscopy (FTIR) and
Scanning Electron Microscope / Energy Dispersive Xray Spectroscopy (SEM/EDS).
Taking into consideration that most of the studies performed on sorption are carried out
using bulk techniques, applying a surface technique like SEM/EDS will be helpful in
figuring out sorption, as a surface phenomena, on a microscopic scale. Moreover, the
application of XRPD is helpfull in elucidating the structural stability of solids upon
uptake of Zn2+ and Pb2+ ions. In this study we report also how FTIR spectroscopy can
be used to follow the change in the vibrational modes of carbonate upon Zn2+ and Pb2+
fixation.
1.5.2. Applied Methods:
1.5.2.1. Atomic Absorption Spectroscopy (AAS):
Atomic-absorption spectroscopy (AAS) is based on the absorption of light
emitted from a hollow cathode lamp by gas –phase atoms of an atomized liquid sample
to find the concentration of these atoms. Ions or atoms in a sample must undergo
desolvation and vaporization in a high-temperature source such as a flame or graphite
furnace. The typical atomization temperature achieved by both the flame and furnace in
atomic absorption methods (2500-3100 oC). The majority of the atoms will remain in
the ground state. It is this factor which gives atomic absorption its characteristically
good sensitivity as an analytical technique for elemental determinations. Flame AAS
can only analyze solutions, while graphite furnace AAS can accept solutions, slurries, or
solid samples. [Haswell 1991, p.22]
The main parts of an AAS instrument are given in Figure 1.8 WEB_ 6 (1996).
Flame AAS uses a slot type burner to increase the path length, and therefore to increase
the total absorbance. Sample solutions are usually aspirated with the gas flow into a

18
nebulizing/mixing chamber to form small droplets before entering the flame. The
analyte concentration is determined from the amount of absorption. Applying the Beer-
Lambert law directly in AAS is difficult due to variations in the atomization efficiency
from the sample matrix, and nonuniformity of concentration and path length of analyte
atoms (in graphite furnace AA). Concentration measurements are usually determined
from a working curve after calibrating the instrument with standards of known
concentration.
Figure 1.8. Illustration of the AAS
The optical system essentially consists of the light source. Light source emits the
characteristic narrow line spectrum of the elements of interest and a monochromotor
which enables, through spectral dispersion, the selection of the specific emission lines
[Haswell 1991, p.22]. Generally, the light source is a hollow-cathode lamp of the
element that is being measured. Lasers are also used in research instruments. Since
lasers are intense enough to excite atoms to higher energy levels, they allow AA and
atomic fluorescence measurements in a single instrument. The disadvantage of these
narrow-band light sources is that only one element is measurable at a time.
AA spectrometers use monochromators and detectors for UV and visible light.
Monochromator isolates the absorption line from background light due to interferences.
This is the main purpose of the monochromator. Simple dedicated AA instruments often
replace the monochromator with a band pass interference filter. Photomultiplier tubes
are the most common detectors for AA spectroscopy.

19
Inspite the fact that AAS enables determination of a wide range of elements, it
still has some limitations. These include the restriction to single elemental
determination, the limited working calibration range, and the sensitivity to matrix
effects that complicates the accurate measurements of some elements.
In this study, AAS is used to determine the concentration of Zn2+ and Pb2+ in
solution, which is then used to calculate the concentration of both ions on the solids in
addition to percentage sorption.
1.5.2.2. X-ray Diffraction (XRD):
X ray diffraction is a versatile analytical technique that is used in examining
crystalline solids. Those solids include ceramics, metals, electronic materials, organics,
and polymers. Samples to be analyzed may be introduced as powders, single crystals,
multilayer thin films, sheets, fibers, or irregular shapes, depending on the desired
measurement. X ray diffractometers fall broadly into two classes: single crystal and
powder. Single-crystal diffractometers are most often used to determine the molecular
structure of new materials. Powder diffractometers are routinely used for phase
identification and quantitative phase analysis but can be configured for many
applications, including variable – temperature studies, texture and stress analysis,
grazing incidence diffraction, and reflectometry.The operative equation in X ray
diffraction is the Bragg equation [see Figure 1.9]
nλ=2dsinθ 1.1

20
Figure 1.9. Illustration of Bragg’s Law
In this formula, n is the order of a reflection, λ the wavelength of the X-ray
radiation, d is the distance between parallel lattice planes, and θ is the angle between the
incident beam and a lattice plane, known as the Bragg angle. When the pathlength in the
crystal (2dsinθ) is a multiple of the wavelength, constructive interference occurs and
diffracted intensity is obtained. In general, the d –spacing is a function of the lattice
parameters (a, b, c) and angles (α, β, γ) defining the unit cell, and the miller indices (b,
k, l) denoting a particular reflection. As such, it is the geometry of the crystal lattice that
determines the positions of the peaks in an X ray diffraction pattern. In general, the
more symmetrical the material, the fewer peaks in its diffraction pattern and the more
intense these peaks are. Moreover, the type and arrangement of atoms within the crystal
lattice determine diffracted intensities associated with those peaks.
The radiation used in a typical diffraction measurement, contains several
wavelengths. It is denoted by Kα1, Kα2, and Kβ, which are characteristic of the material
producing the X rays. When the wavelength is small, the radiation is energetic and
penetrating. Longer wavelength radiation spreads out the peaks in a diffraction pattern,
which may overcome line overlap problems or enhance small peak shifts due to stress.
The choice of radiation also depends on the sample characteristics.
XRPD is applied in this study to determine the mineralogical composition, and
test the structural stability of the minerals upon sorption. The formation of carbonate
phases of Pb2+ and Zn2+ will also be elucidated. (Setle 1997, p.341-342).

21
1.5.2.3. Infrared Spectroscopy (FTIR):
Infrared Spectroscopy is an important technique in chemistry. It is an easy way to
identify the presence of certain functional groups in a molecule. Also, one can use the
unique collection of absorption bands to confirm the identity of a pure compound or to
detect the presence of specific impurities. This technique measures the absorption of
various infrared light wavelengths by the material of interest. With the advent of Fourier
Transform Infrared Spectroscopy (FTIR) the range of applications and the materials
amenable to study has increased sensitivity, speed, wavenumber accuracy and stability.
The FTIR instrument consists of an IR light source, a sample container, a prism
to separate light by wavelength, a detector, and a recorder (which produces the infrared
spectrum).
One of the important features of FTIR is the ability to signal average a large
number of scans in a relatively short amount of time. Thus spectra on very small
quantities of material, or on highly absorbing materials, in which the signal to noise
ratio of individual scans is very poor, can be achieved. The second major advantage of
FTIR over conventional dispersive instruments is the high throughput of infrared
radiation, since narrow slits are no longer necessary to achieve resolution. [Connor et al.
2003, p.203-205]
In this study, FTIR will in particular be used in revealing the effect of uptake of
Zn2+ and Pb2+ on the stretching and bending modes of calcite and magnesite at different
loading conditions.
1.5.2.4. Scanning Electron Microscope (SEM)
SEM is a powerful technique applied in micro-imaging of a variety of surfaces.
This technique can be used in exploring the surface structure to determine particle size
and texture on that surface. The surface of a solid sample is scanned in a raster pattern
with a beam of energetic electrons. Several types of signals are produced from a surface
in this process, including backscattered, secondary, and Auger electrons; X ray
fluorescence photons; and other photons of various energies. All of these signals have

22
been used for surface studies, but the two most common are (1) backscattered and
secondary electrons, which serve as the basis of SEM, and (2) X ray emission, which is
used in electron microprobe analysis [Skoog et al. 1971, p.549].
Figure 1.10 [Connor et al. 2003, p.91] shows the essential elements of SEM.
The electron gun, fitted with a W, LaB6 or Field Emission (FE) gun operates typically
over the range 0.1-30 kV accelerating voltage. A condenser lens produces a
demagnified image of the source, which in turn is imaged by the probe forming lens
onto the specimen. The electron path and sample chamber are evacuated. Scanning coils
deflect the probe over the rectangular raster, the size of which, relative to the display
screen, determines the magnification. Detectors collect the emitted electron signals,
which after suitable amplification can be used to modulate the intensity of the beam of
the display video screen, which is rastered in synchronism with the probe.
Figure 1.10. Basic features of the SEM (showing electron gun, condenser and objective lenses, scanning system detectors and image display CRT).
In this work, SEM is applied in the morphological characterization of the
minerals prior to and following the sorption of Zn2+ and Pb2+ ions.

23
1.5.2.5. Energy Dispersive X- Ray Spectroscopy (EDS):
EDS is a technique that can be applied in determination of elemental
composition of surfaces. The technique makes use of X- rays emitted by elements
within the surface that are initially excited by bombarding electrons. X rays are
generated by the incident probe within a volume similar to, but rather larger than, that
for the backscattered electrons. Peaks at energies characteristic of the elements within
that volume can be identified and the concentrations of the elements can be calculated.
Thus the composition of the sample, and of the individual grains in a polycrystalline
sample can be determined for comparison with surface analytical data.
The dimension of the interaction volume depends on the mean atomic number
and the density of the material, and on the beam energy and the emitted X ray energy.
The sampling depth in EDS is approximately 1 µm. Diameters range from 0.03 µm to
several µm. Thus conventional EDS spectrometry will not reveal compositional changes
due to surface segregation. It is possible, however, by analysing a point at several
different beam energies, to determine the thicknesses and composition of this surface
layers. X ray maps of surfaces, with spatial resolutions of 0.1-1.0 µm are often valuable
in revealing compositional variation across a sample, especially if scanning Auger
microscopy is not available. [Connor et al. 2003, p.98]
EDS was used in this study to perform spot analysis of the elemental
composition at different points on the solid surface, and to examine the distribution of
structural and sorbed ions on the surfaces of the minerals via mapping analysis.
24
CHAPTER 2
EXPERIMENTAL
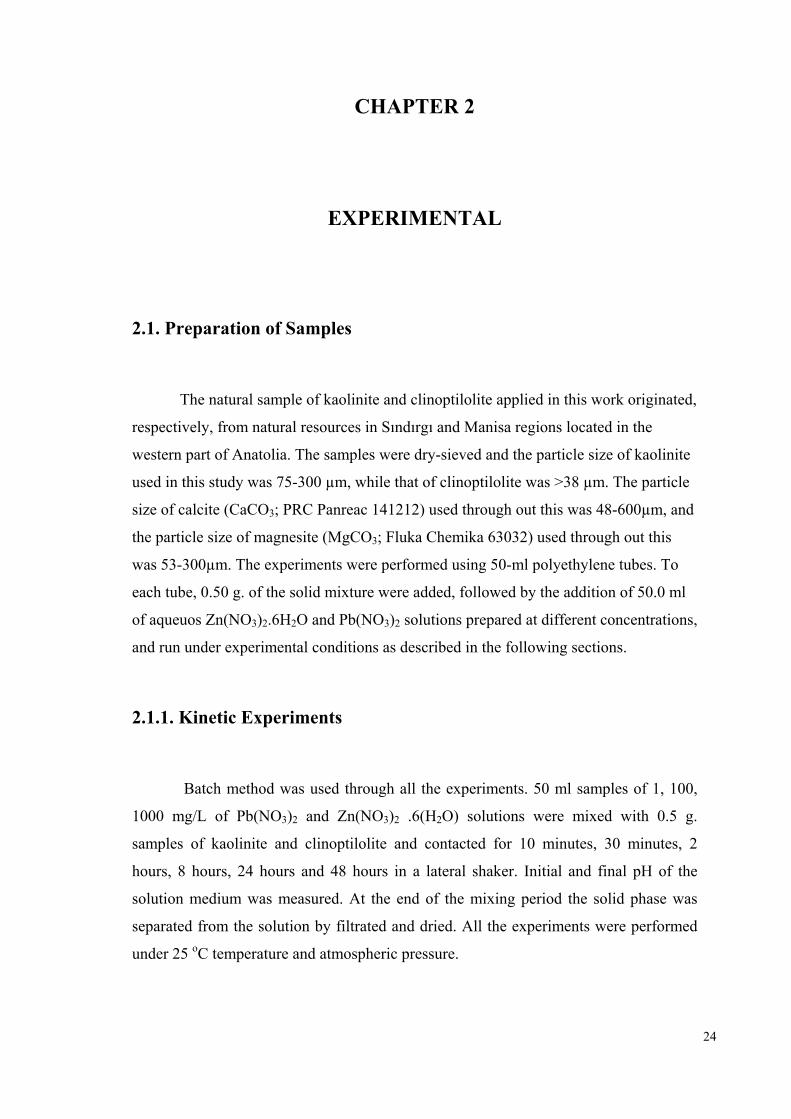
2.1. Preparation of Samples
The natural sample of kaolinite and clinoptilolite applied in this work originated,
respectively, from natural resources in Sındırgı and Manisa regions located in the
western part of Anatolia. The samples were dry-sieved and the particle size of kaolinite
used in this study was 75-300 µm, while that of clinoptilolite was >38 µm. The particle
size of calcite (CaCO3; PRC Panreac 141212) used through out this was 48-600µm, and
the particle size of magnesite (MgCO3; Fluka Chemika 63032) used through out this
was 53-300µm. The experiments were performed using 50-ml polyethylene tubes. To
each tube, 0.50 g. of the solid mixture were added, followed by the addition of 50.0 ml
of aqueuos Zn(NO3)2.6H2O and Pb(NO3)2 solutions prepared at different concentrations,
and run under experimental conditions as described in the following sections.
2.1.1. Kinetic Experiments
Batch method was used through all the experiments. 50 ml samples of 1, 100,
1000 mg/L of Pb(NO3)2 and Zn(NO3)2 .6(H2O) solutions were mixed with 0.5 g.
samples of kaolinite and clinoptilolite and contacted for 10 minutes, 30 minutes, 2
hours, 8 hours, 24 hours and 48 hours in a lateral shaker. Initial and final pH of the
solution medium was measured. At the end of the mixing period the solid phase was
separated from the solution by filtrated and dried. All the experiments were performed
under 25 oC temperature and atmospheric pressure.

25
2.1.2. Experiments on Mixtures
50 ml samples of 1, 100, 500, 3000, 10000 mg/L of Pb(NO3)2 and
Zn(NO3)2.6(H2O) solutions were added to mixtures of kaolinite or clinoptilolite with
calcite or magnesite at the compositions of 5%, 10%, 25%, 60%. The same
experiments were also performed for pure kaolinite, clinoptilolite, calcite, and
magnesite. The experiments were conducted in two sets for the concentration of 10000
mg/L, one of them with no pH control and the second with the initial pH raised to a
value of 10.0 units using a 0.1 M solution of NaOH. The solid phase was separated from
solution by filtration and dried at the end of the mixing period. The experiments were
carried out under 25 oC temperature and atmospheric pressure.
The initial pH (at the start of mixing) and final pH (at the end of mixing) values
of all the mixtures are given in Appendix D. In fresh water media, up to neutral pH
conditions, the chemical forms of zinc and lead predominantly present will be Pb2+ and
Zn2+ ions. As the pH increases beyond ~7, the hydroxy- ions, ZnOH+ and PbOH+, start
to compete with the above ions (Stumm et al., 1996, p. 296). The speciation curves of
Zn2+ and Pb2+ in aqueous media are provided in Figure D3-1, Figure D3-3. The fraction
of hydroxy species of both ions is expected to decrease as the initial concentration is
increased. In order to elucidate the effect of pH on the morphology of the evolving Zn-
and Pb-carbonate species, separate sets of the experiments with initial concentrations of
10000 mg/L were performed at initial pH of 10. The pH was modified using a 0.1 M
NaOH solution.
2.2. Analysis of Aqueous Solutions
2.2.1. AAS:
Flame AAS analysis was performed using a Thermo Elemental SOLAAR M6
Series Atomic Absorption Spectrometer with air-acetylene flame. Pb and Zn hollow
cathode lamps (λ(Pb)=217 nm, λ(Zn)=213.9 nm) were applied as sources. Standarts of
0.1, 0.5, 1, 5, 10, 20 mg/L of Pb and Zn were prepared from 1000 mg/L stock solutions.

26
The aqueous solutions of Zn and Pb ions were analyzed after making the necessary
dilution whenever required.
2.3. Analysis of Solid Phases
2.3.1. FTIR:
FTIR technique was applied to collect the spectra of the solid samples using a
Nicolet Magma 550 type instrument. The samples were introduced as pellets prepared
from powders mixed with KBr and the spectra were recorded in the range 400-4000
cm-1. KBr powder pellets were used as a background. A total of 32 scans were recorded
with a resolution of 4 cm-1 for each spectrum. Omnic 1.3 software was used to process
the results.
2.3.2. XRPD:
The XRPD analysis was performed using a Philips X’ Pert Pro diffractometer
located at the Center of Material Research at İzmir Institute of Technology. The
samples were first ground , mounted on holders then introduced for analysis. The source
consisted of Cu Kα radiation (λ=1.54 Ǻ). Each sample was scanned with a step size of
0.020 in the 2 theta range of 2-60. The features in the patterns of different powders were
idendified by a search- match procedure that was excuted using the software X’ Pert
Graphic & Identify.
2.3.3. SEM/EDS:
The SEM/EDS characterization was carried out using a Philips XL- 30S FEG
type instrument located at the Center of Material Research at İzmir Institute of
Technology. Prior to analysis, the solid samples were sprinkled onto adhesive aluminum

27
/carbon tapes supported on metallic disks. Images of the sample surfaces were then
recorded at different magnifications. Elemental analysis was performed at different
points randomly selected on the solid surface and the average of the results was
reported. EDS mapping was conducted at magnification of x500 and a voltage of 18 kV
under vacuum conditions of 3.5x10 -5 mbar.

28
CHAPTER 3
RESULTS AND DISCUSSION
3.1. Characterization of the Minerals
3.1.1. Natural Kaolinite: XRPD, SEM/EDS, and FTIR Characterization
The mineralogical purity of natural kaolinite was tested using XRPD. The
results showed that the natural kaolinite samples were composed of kaolinite in addition
to quartz as an impurity (Fig. 3.1). In the figure, kaolinite is characterized by the marked
001 and 002 features and the presence of quartz in the sample is evident from the well
known 101 and 100 peaks.
5 10 15 20 25 30
Qua
rtz(1
00) Q
uartz
(101
)
Kao
linite
(002
)
Kao
linite
(001
)
2θ
Figure 3.1. XRPD-mineralogical analysis of kaolinite.

29
SEM was used to reveal the morphology and particle size of kaolinite crystals.
SEM microimages indicated that kaolinite has a well-defined crystal structure revealed
by its hexagonal plates with edge sizes ranging from 300-500 nm. A typical SEM graph
is given in Figure 3.2.
Figure 3.2. A typical SEM image of kaolinite applied in our studies.
The elemental composition of kaolinite surface was determined using EDS. In
this analysis, 3 different random points on the surface were selected, and the results
were reported as an arithmetic average. A summary of the EDS results of kaolinite are
given in Table 3.1. The results revealed that the elemental content of kaolinite was O,
Si, Al in addition to minor quantities of Na, K, Mg, and Ca probably stemming from a
non-kaolinitic impurity that is below the detection limit of XRPD. The amount of Si is
seen to exceed that of Al by about 20 %. Taking into account that in pure kaolinite, on
molar basis, the quantity of Al and Si is equal, it can be concluded that the extra amount
of Si is primarly originating from the quartz impurity in the natural clay, which seems to
consequently account for about one fifth of the molar quantity of the clay. The fact that
quartz fraction gave a more intense signal in the XRPD diagram of natural kaolinite
(Fig. 3.1.), is due to the higher “impact factor” of the usually better crystalline quartz
phase. Another factor that frequently leads to the decrease in kaolinite signal compared

30
to quartz, is the smaller particle size of the former, thus increasing the internal scattering
of kaolinite particles and as a result decreasing the reflected signal.
Table 3.1. Elemental content of kaolinite as obtained by EDS
EDS Analysis % Atomic
O 66.84±0.80
Na 0.47±0.04
Mg 0.34±0.05
K 0.14±0.12
Al 14.09±1.95
Si 17.61±0.66
Ca 0.50±0.71
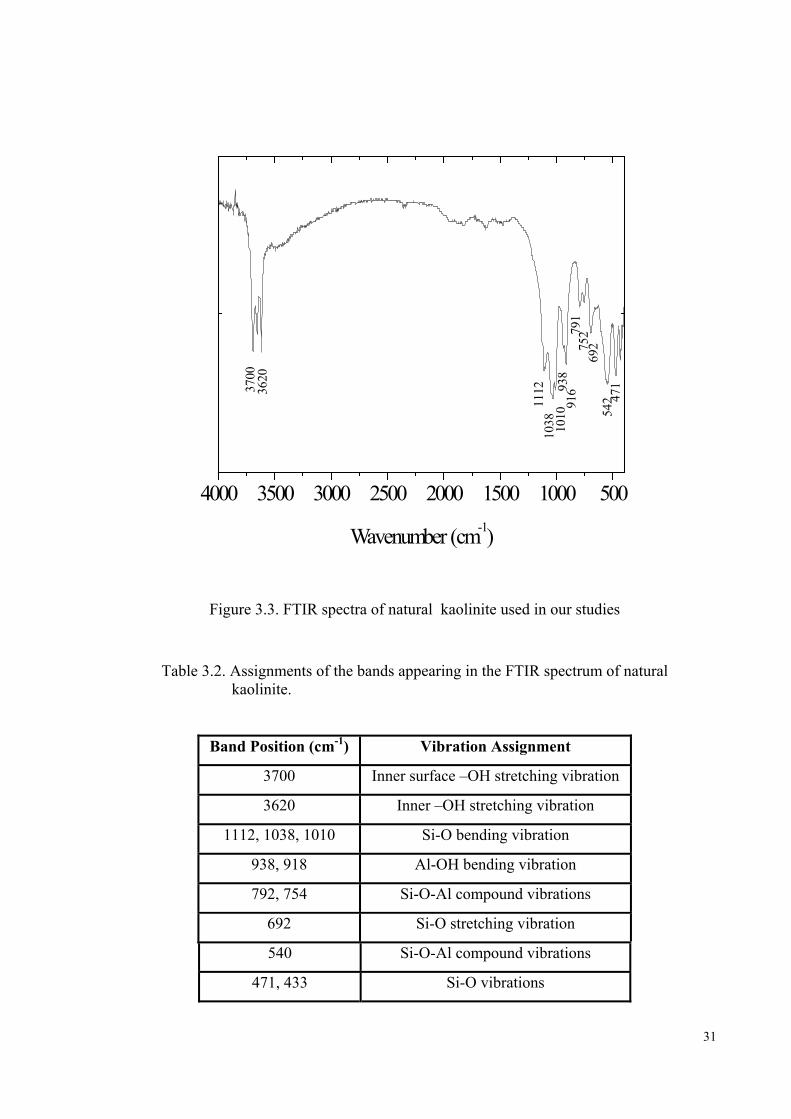
The FTIR spectrum of kaolinite is given in Figure 3.3. Kaolins can be readily
distinguished from other clays by differences in position and relative intensities of their
OH stretching bands. The OH stretchings occurring around the 3700-3620 cm-1 doublet
are characteristic for kaolin clays. The feature near 3700 cm-1 lies well separated from
those of most other mineral bands. The OH deformation bands near 938-916 cm-1 are
also typical for the kaolin group minerals and arise from vibrations of the inner and
inner surface OH groups within the clay matrix. Other features appearing in the
spectrum belong to a variety of Al-O and Si-O stretching and bending vibrations.
[Wilson 1994, p.52-55]. A detailed assignment of all the bands arising in the kaolinite
spectrum is given in Table 3.2.
31
4000 3500 3000 2500 2000 1500 1000 500
471
542
69275
2791
1010
1038
1112 93
891
63620
3700
Wavenumber (cm-1)
Figure 3.3. FTIR spectra of natural kaolinite used in our studies
Table 3.2. Assignments of the bands appearing in the FTIR spectrum of natural kaolinite.
Band Position (cm-1) Vibration Assignment
3700 Inner surface –OH stretching vibration
3620 Inner –OH stretching vibration
1112, 1038, 1010 Si-O bending vibration
938, 918 Al-OH bending vibration
792, 754 Si-O-Al compound vibrations
692 Si-O stretching vibration
540 Si-O-Al compound vibrations
471, 433 Si-O vibrations

32
3.1.2. Natural Clinoptilolite: XRPD, SEM/EDS, and FTIR Characterization The natural clinoptilolite was characterized using XRPD. The results indicated
that clinoptilolite appeared to be almost pure. Its peaks are sharp as seen in Figure 3.4,
the thing indicative of a good crystallinity of the mineral.
Figure 3.4. XRPD-pattern of clinoptilolite used in our research, C:Clinoptilolite
The shape and size of clinoptilolite crystals was elucidated using SEM imaging.
The SEM microimages indicated that clinoptilolite seems to be composed of crystals
with well-defined shape, and a particle size that amount to several micrometers. A
typical SEM image is given in Fig. 3.5.

33
Figure 3.5. A typical SEM image of clinoptilolite
The average elemental composition of clinoptilolite was found using EDS
performed with 3 different random points. The arithmetic average of these points is
given in Table 3.3. As the Table shows, the major elements of clinoptilolite were O, Si,
Al in addition to small amounts of Na, K, Mg, and Ca. If the ratio of Si/Al in the
analyzed mineral is compared to that in a pure clinoptilolite which has the formula
[(Na, K, Ca)6Al6Si30O72. 24H2O], it can be seen that a value of 4.5 is obtained. This is
slightly below the ideal value of 5.0 (calculated using the above formula). This might be
stimming from impurities that could not be detected using XRPD, the detection limit of
which is around 5-10 %. Another reason for such a difference might be caused by the
difference in bulk and surface composition, as EDS is capable of detecting the upper 1-2
µm of the surface. The element Si is partially replaced by Al in zeolites, the thing
believed to be responsible for the development of a negative charge on the zeolitic
structure, and lead to a local modification in the Si/Al ratio.

34
Table 3.3. Elemental composition of clinoptilolite as obtained by EDS
The FTIR spectrum of clinoptilolite is given in Figure 3.6. The fact that
zeolites are significantly hydrated is illustrated by the discrete water absorption bands in
the 3500 and 1640 cm-1 region. These bands, which were centered at 3450 and 1633,
refer to water molecules associated with Na and Ca in the channels and cages in the of
the zeolite structure. [Wilson 1994, p.45]. As can be seen from the figure, other bands
appear near 1204, 1057, 799 and 471 cm-1. The 1111 cm-1 band arises from asymmetric
stretching vibration modes of internal T-O bonds in TO4 tetrahedra (T=Si and Al ). The
799 and 471 cm-1 bands are assigned to the stretching vibration modes of O-T-O groups
and the bending vibration modes of T-O bonds, respectively. [Tanaka et al 2002, p.719]
EDS analysis %Atomic
O 61.94±0.7
Na 0.56±0.12
Mg 0.86±0.13
K 1.61±0.12
Al 5.30±0.02
Si 23.73±0.89
Ca 1.05±0.11
N 5.02±0.306

35
4000 3000 2000 1000
1204
3620 34
50
Wavenumber(cm-1)
1633
471
799
1057
Figure 3.6. FTIR spectrum of clinoptilolite used in this work.
3.1.3. CaCO3 : XRPD, SEM/EDS, and FTIR Characterization
CaCO3 is a mineral known to be present in three polymorphs; calcite, aragonite,
and vaterite. Among these, calcite is the thermodynamically stable polymorph and
vaterite is the least stable. The XRPD analysis showed that the CaCO3 fractions applied
in our research were completely composed of calcite polymorph. The calcite features
occur mainly at d104=3.069 Å, d110=2.488 Å, d202=2.092 Å , d108=1.949 Å, d116=1.892 Å
as shown in Figure 3.7.
The calcite samples were also characterized using SEM. The pictures obtained at
various locations on the surface showed that the mineral is composed of aggregates of
various sizes as given in Figure 3.8, with no specific regular morphological structure.

36
10 20 30 40 50 60
116
018
202
113
110
104
2θ
Figure 3.7. XRPD diagram of calcite applied in this study
Figure 3.8. A typical SEM image of calcite used in this study.

37
The EDS results showed that the mineral consists of C, O, and Ca with atomic
percentages of 36.9± 6.9, 47.3±3.2, 15.8 ±3.7. No other elements were detected, the
thing that illustrates the high purity of the mineral.
The FTIR spectrum of calcite is shown in Figure 3.9. The bands appearing near
1428, 878, and 714 cm-1 are diagnostic for calcite (Wilson 1995, p. 52-55). The
vibrational spectra of carbonate minerals contains modes arising from the symmetric
stretching mode (ν1), out-of-plane bending (ν2), the asymmetric stretching (ν3), the in-
plane-bending (ν4), in addition to the two combination modes (ν1+ν3) and (ν1+ν4)
(Böttcher et al. 1997, p.1379-1385). Based on this, the bands at 712, 878, 1437, 1789,
and 2509 cm-1 in the FTIR spectrum of pure calcite were assigned to the vibrational
modes ν4, ν2, ν3, ν1+ν3, and ν1+ν4, respectively. The band corresponding to the
vibrational mode ν1 was not observed. In calcite, the carbonate ion has a D3h point
group (Reig et al. 2002, p.811), for which the symmetric stretching mode (ν1) is IR
inactive. According to the theory of vibrational spectroscopy, in gaseous phase, the
carbonate ion possesses a trigonal planar shape with a point group of D3h. This molecule
possesses, as was previously stated, four first order internal modes; ν1, ν2, ν3, and ν4
with the last two modes being doubly degenerate adding up to a total of six normal
modes as predicted by the 3N-6 rule that applies for nonlinear polyatomic molecules.
Due to symmetry considerations, the selection rules predict that the ν1 mode is IR
inactive. Because of the intermolecular interactions, the symmetry of carbonate ion
might be lowered in a crystalline state and the selection rules might consequently be
affected, the thing leading to activating initially inactive bands and splitting the
degenerate vibrations. When considering molecular vibrations in crystalline states,
rather than the isolated gaseous states, the concept of site symmetry is used to predict
the plausible changes in the vibrational modes. The site symmetry concept refers to the
local symmetry around the center of gravity of a molecule in a unit cell. This approach
explains why, for example, calcite and aragonite have different vibrational spectra in
spite of the fact that they have the same chemical composition as both of the minerals
are polymorphs of CaCO3. It can be theoretically shown that the D3h symmetry of
carbonate ion is lowered to D3 in the case of calcite and Cs in the case of aragonite the
thing that leaves the carbonate vibrational modes unchanged in the case of calcite but
activates the ν1 mode and causes the ν3 and ν4 modes to split in the case of aragonite
(Nakamoto 1986, p.86-87). Experimental observations are in agreement with these

38
predictions, the thing also in line with our FTIR characterization of calcite samples
applied in this work.
4000 3500 3000 2500 2000 1500 1000 500
712
878
1437
176925
09
Wavenumber (cm-1)
Figure 3.9. FTIR spectrum of calcite used in our research
3.1.4. MgCO3: XRPD, SEM/EDS, and FTIR Characterization
MgCO3 was tested using XRPD. Characterization of this mineral validated its
purity as given in Figure 3.10. The major peaks of magnesite occurs at d104= 2.742 Å,
d006=2.503 Å,d113=2.102 Å,d202=1.939 Å as shown in Figure 3.10.
Moreover, the SEM microimages indicated that MgCO3 was composed mostly
of aggregates with sizes generally below 1 µm. A typical image is given in Figure 3.11.
The elementel content of magnesite was determined using EDS. The analysis
showed that the mineral is composed of Mg, C, and O with percentage composition of
17.6±0.74, 21.2±1.48, 61.2±0.94, respectively. Again, the results correspond to
arithmetic averages of 3 data points obtained from randomly selected locations on the
surface of magnesite.
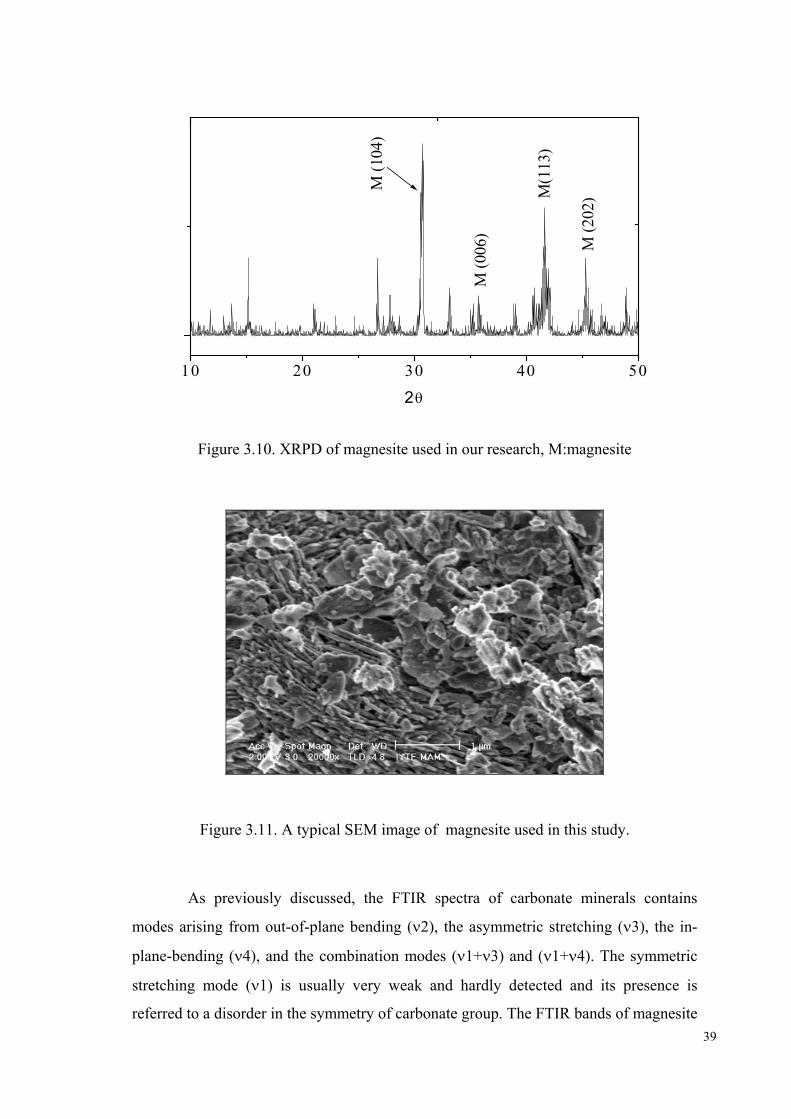
39
10 20 30 40 50
M (2
02)M
(113
)
M (0
06)
M (1
04)
2θ
Figure 3.10. XRPD of magnesite used in our research, M:magnesite
Figure 3.11. A typical SEM image of magnesite used in this study.
As previously discussed, the FTIR spectra of carbonate minerals contains
modes arising from out-of-plane bending (ν2), the asymmetric stretching (ν3), the in-
plane-bending (ν4), and the combination modes (ν1+ν3) and (ν1+ν4). The symmetric
stretching mode (ν1) is usually very weak and hardly detected and its presence is
referred to a disorder in the symmetry of carbonate group. The FTIR bands of magnesite

40
are demonstrated in Figure 3.12. The doublet at 1490, 1419 cm-1 correspond to
asymmetric stretching vibrations of carbonate. The reason for the split of this peak into
a doublet is unclear. The band at 1117 cm-1 correspond to symmetric stretching of
carbonate, and those at 886, 795 cm-1 are assigned to inplane and out-of-plane bending
vibrations of carbonate ion.
2000 1500 1000 500
1419
1117
1490
886 85
0
795
594
Wavenumber (cm-1)
Figure 3.12. FTIR spectrum of magnesite used in this study.
3.2. Sorption Studies on Natural Kaolinite and Natural Clinoptilolite
3.2.1. Sorption of Zn2+ and Pb2+ on Natural Kaolinite
3.2.1.1. Effect of Time
The effect of time on sorption was examined by mixing aliquots of 1, 100, 1000
mg/L of Pb(NO3)2 and Zn(NO3)2 .6H2O solutions with kaolinite samples for 10
minutes, 30 minutes, 2 hours, 8 hours, 24 hours and 48 hours. The results are given in
Figure 3.13 and Figure 3.14. It is clear that equilibrium was achieved at the initial

41
concentrations of 1 and 100 mg/L faster than at the higher concentration of 1000 mg/L
due to the increasing competition between the sorbate ions as concentration is increased.
In general, equilibrium is observed to be attained within the first 24 hours of mixing for
both ions.
0 10 20 30 40 50
0
2
4
6
8
10
12
1 mg/L 100 mg/L 1000 mg/L
[C] s(m
g/L)
Time (hr-1)
Figure 3.13. The effect of time of mixing on the sorption of Zn ions on kaolinite.
0 10 20 30 40 50
02468
1012141618
1 mg/L 100 mg/L 1000 mg/L
[C] s(m
g/g)
Time(hr -1)
Figure 3.14. The effect of time of mixing on the sorption of Pb ions on kaolinite.

42
3.2.1.2. Effect of Concentration
The effect of concentration on the uptake of aqueous Zn2+ and Pb2+ ions by
kaolinite was investigated at the initial concentration of 1, 100, 500, 3000, and 10000
mg/L of Pb(NO3)2 and Zn(NO3)2 .6(H2O) solutions, while keeping the mixing time
fixed at 48 hours. The experimental data were then fitted to Langmuir and Freundlich
isotherm models, and the latter was found to describe the data more adequetly as shown
in the next section. Moreover, the data was used to calculate percentage sorption using
the equation:
PS= ([C]o - [C]l )/ [C]o ×100 3.1
where;
PS : percentage sorption
[C]o and [C]l : initial and equilibrium concentration of Zn2+ or Pb2+ in
solution (mg/L).
The calculated values for both ions are given in Table 3.4. For the initial
concentrations of 1 and 100 mg/L, the results indicate almost a 100% removal of both
ions by kaolinite. The percentage sorption decreased with further increase in the initial
concentrations. Up to the initial concentration of 500 mg/L, Pb2+ sorption seems to be
favoured more, however, beyond this concentration Zn2+ uptake starts to exceed that of
Pb2+.
Table 3.4. The values of percentage sorption of Zn2+ and Pb2+ on individual kaolinite
% Sorption on Kaolinite
Initial Conc (mg/L)
Zn2+ Pb2+
1 >99.9 >99.9 100 86.4 98.4 500 36.4 45.4 3000 31.8 28.3 10000 9.5 5.2

43
3.2.1.3. Freundlich Isotherms of Loaded Kaolinite
The linear form of Freundlich isotherm is defined as follows.
log[C]s=logk+nlog[C]l 3.2
Where;
[C]s : equilibrium concentration of the sorbate on the solid (mg/g),
[C]l : equilibrium concentration of the sorbate in solution (mg/L),
n, k: Freundlich constants
This isotherm model was widely used in describing sorption of various ions on
kaolinite (Erten et al 1994, p.375, Jain et al. 1996, p.161). It is best adequate for
describing sorption taking place on heterogeneous surfaces which are composed of
different types of sites, each possessing varying capacity and sorption affinity. This
model does not predict any overall sorption capacity of the solid, thus allowing for
multilayer sorption. Freundlich plots are given in Figure 3.15 and Figure 3.16, and the
values of n and k are provided in Table 3.5. The non-linearity of the sorption indicated
by the relatively low n values implies that, within the studied concentration range, the
energy barrier against sorption becomes increasingly effective as loading is increased,
the thing resulting in a significant decrease in the fixation ability of kaolinite. The k
values are indicative of the larger sorption affinity of kaolinite towards lead compared
to its affinity towards zinc.
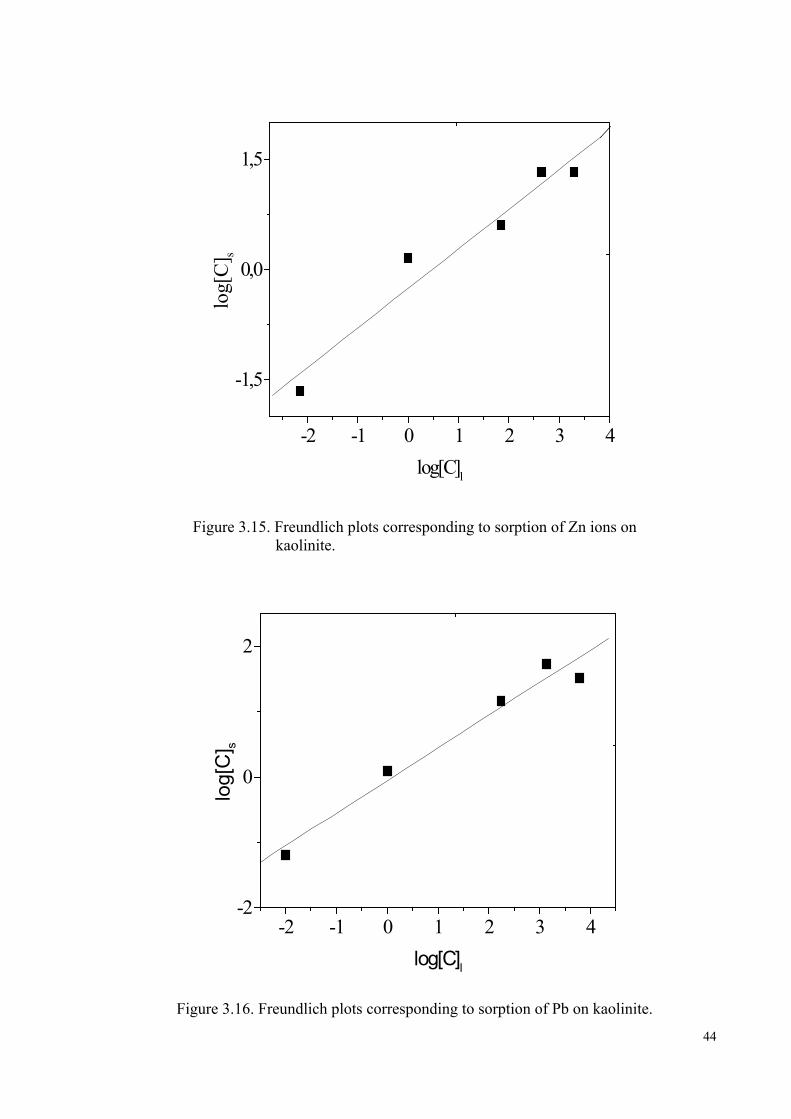
44
-2 -1 0 1 2 3 4
-1,5
0,0
1,5
log[
C] s
log[C]l
Figure 3.15. Freundlich plots corresponding to sorption of Zn ions on
kaolinite.
-2 -1 0 1 2 3 4-2
0
2
log[
C] s
log[C]l
Figure 3.16. Freundlich plots corresponding to sorption of Pb on kaolinite.

45
Table 3.5. Freundlich parameters, n and k, obtained from the fits of the sorption data of Zn2+ and Pb2+ ion on kaolinite. R corresponds to the linear correlation
coefficient of the plots.
3.2.1.4. XRPD and SEM/EDS Analysis of Sorbed Kaolinite
The XRPD characterization of Zn-, and Pb-reacted kaolinite samples showed
that no significant changes in the peak positions or peak intensities of the basic 001, 002
reflections of kaolinite have taken place. The fact that the initial reflections were
retained upon loading, indicates the structural stability of the clay upon sorption, within
the conditions of our studies.
In line with the XRPD predictions, SEM micro-images demonstrated no
distinguishable change in the kaolinite surface for the mineral samples, prior to or
following loading. The stability of kaolinite matrix is expected, as this clay is well
known to be non-expanding, i.e its interlayer structure is tightly bound by hydrogen
bonds, the thing that makes the interlayer sites inaccessible to ‘foreign’ ions. In
literature, it was reported that sorption on kaolinite takes place mainly on the sorption
sites located at the edges and external surface of the clay (Miranda-Trevino et al 2003,
p.134). Moreover, kaolinite is known to be among the most stable clay minerals against
attack by external factors. (Coles et al 2002, p.39-40).
The distribution of Zn2+ and Pb2+ ions on kaolinite surface was analyzed using
EDS mapping. The maps of these ions together with those of Al and Si are given in
Figure 3.17. This figure revealed that while Pb is distributed equally on the kaolinite
surface, Zn appears to show some sort of selectivity to Si richer regions on the kaolinite.
This might be indicative that Zn2+ is fixed by sorption sites different than those of Pb2+.
However, to validate this, a more precise and closer examination of the structural
environment of both cations on kaolinite is required, the thing that necessitates the
n k R
Zn-kaolinite 0.54 0.55 0.9741
Pb-kaolinite 0.5 0.88 0.9829

46
application of advanced techniques like ‘ Extended X-ray Absorption Fine Structure’,
EXAFS.
(a) Al
Si
Zn
(b) Al
Si
Pb
Figure 3.17. EDS maps showing the distribution of (a) Al, Si, and Zn (b) Al, Si, and Pb on kaolinite surface.
3.2.2. Sorption of Zn2+ and Pb2+ on Natural Clinoptilolite
3.2.2.1. Effect of Time
To study the effect of time, aliquots of 50 ml Pb(NO3)2 and Zn(NO3)2 .6(H2O)
solutions for 1, 100, 1000 mg/L were mixed with 0.5 g of clinoptilolite samples. The
mixtures were then stirred for 10 minutes, 30 minutes, 2 hours, 8 hours, 24 hours and 48
hours, contact periods. The obtained results are drawn in Figure 3.18 and Figure 3.19.
As was observed in kaolinite case, for the initial concentration of 1 and 100 mg/L, the
results indicated faster attainment of equilibrium than at the higher concentration of
1000 mg/L. Compared with the results of sorption of both cations on kaolinite (section
3.2.1), the results for sorption on clinoptilolite indicated that in particular at higher

47
loading, the sorption kinetics are faster for kaolinite than for clinoptilolite. This could be
referred to the presence of pore film diffusion which acts as an extra barrier against
sorption on the internal channels in the matrix of clinoptilolite. In general, Pb and Zn
ions sorption on clinoptilolite can reach equilibrium within the 48 hours of mixing.
Based on this, further experiments were carried out at this mixing period.
0 10 20 30 40 50
0
2
4
6
8
10
12
1 mg /L 100 mg/L 1000 mg/L
[C] s(m
g/L)
Time (hr-1)
Figure 3.18. The effect of time of mixing on the sorption of Zn ions on clinoptilolite
0 10 20 30 40 50
0
10
20
30
40
50
1 mg/L 100 mg/L 1000 mg/L
[C] s(m
g/L)
T ime(hr-1 )
Figure 3.19. The effect of time of mixing on the sorption of Pb ions on Clinoptilolite.

48
3.2.2.2. Effect of Concentration
In these experiments, sorption was carried out at neutral pH for the initial
concentration of Pb(NO3)2 and Zn(NO3)2.6H2O of 1, 100, 500, 3000, and 10000 mg/L.
The obtained data for both cations, were used to calculate percentage sorption, as given
in Table 3.6. The results showed that almost a 100% removal of both ions by
clinoptilolite for the initial concentrations of 1 and 100 mg/L. The percentage sorption
decreased with further increase in the initial concentrations. The overall results indicate
that clinoptilolite is more effective in sorption of both ion compared to kaolinite.
Comparing the amounts of fixed ions, it can be seen that Pb2+ uptake is more favoured,
but, at higher values of loading, Zn2+ sorption becomes competitive with that of Pb2+. A
similar trend was observed for sorption on kaolinite (section 3.2.1.2). The sorption data
of both ions on clinoptilolite was then examined using Freundlich isotherm model.
Table 3.6. The values of percentage sorption of Zn2+ and Pb2+on individual clinoptilolite
% Sorption on Clinoptilolite
Initial Conc (mg/L) Zn2+ Pb2+
1 >99.9 >99.9 100 95.5 >99.9 500 31.8 98.7 3000 22.9 52.3 10000 15.0 14.4
3.2.2.3. Freundlich Isotherms of Loaded Clinoptilolite
As was seen in kaolinite case, Freundlich isotherms described adequately the
sorption data on clinoptilolite. Freundlich isotherms shown in Figure 3.20 and Figure
3.21 reveal the non-linearity of sorption, leading to a decrease in percentage sorptionh
with further increase in the initial concentration. The values of Freundlich constants, n,
k are provided in Table 3.17. As previously stated, the small n values means that the

49
energy barrier against sorption becomes increasingly effective. Based on the values of
k, it is seen that the affinity of the mineral towards Pb2+ sorption is higher than its
sorption affinity towards Zn2.
-3 -2 -1 0 1 2 3 4
-1,5
0,0
1,5
3,0lo
g[C
] s
log[C]l
Figure 3.20. Freundlich plots corresponding to sorption of Zn2+ ions on clinoptilolite.
-4 -3 -2 -1 0 1 2 3 4-2
-1
0
1
2
3
log[
C] s
log[C]l
Figure 3.21. Freundlich plots corresponding to sorption of Pb2+ ions on clinoptilolite.

50
Table 3.7. Freundlich parameters, n and k, obtained from the fits of the sorption data of Zn2+ and Pb2+ ion on clinoptilolite. R corresponds to the linear correlation
coefficient of the plots.
n k R
Zn-clinoptilolite 0.6538 1.22 0.99075
Pb-clinoptilolite 0.56796 6.204 0.98337
3.2.2.4. XRPD and SEM \EDS Analysis of Sorbed Clinoptilolite
The XRPD characterization of Zn-, and Pb-reacted clinoptilolite samples
showed that no significant changes in the position and/or intensity of the basic
reflections of clinoptilolite were associated with sorption, indicating that the structure of
clinoptilolite was not affected by sorption. This was also supported by the SEM analysis
which showed no distinguishable change in the morphology or size of clinoptilolite
crystals. In addition, Zn- and Pb- loaded clinoptilolite samples were characterized using
EDS mapping analysis as given by Figure 3.22. The results indicate an even distribution
of Zn and Pb signals on the surface of clinoptilolite. No selectivity of either cation
towards aluminol or silanol sites is observed, as was observed in kaolinite case.
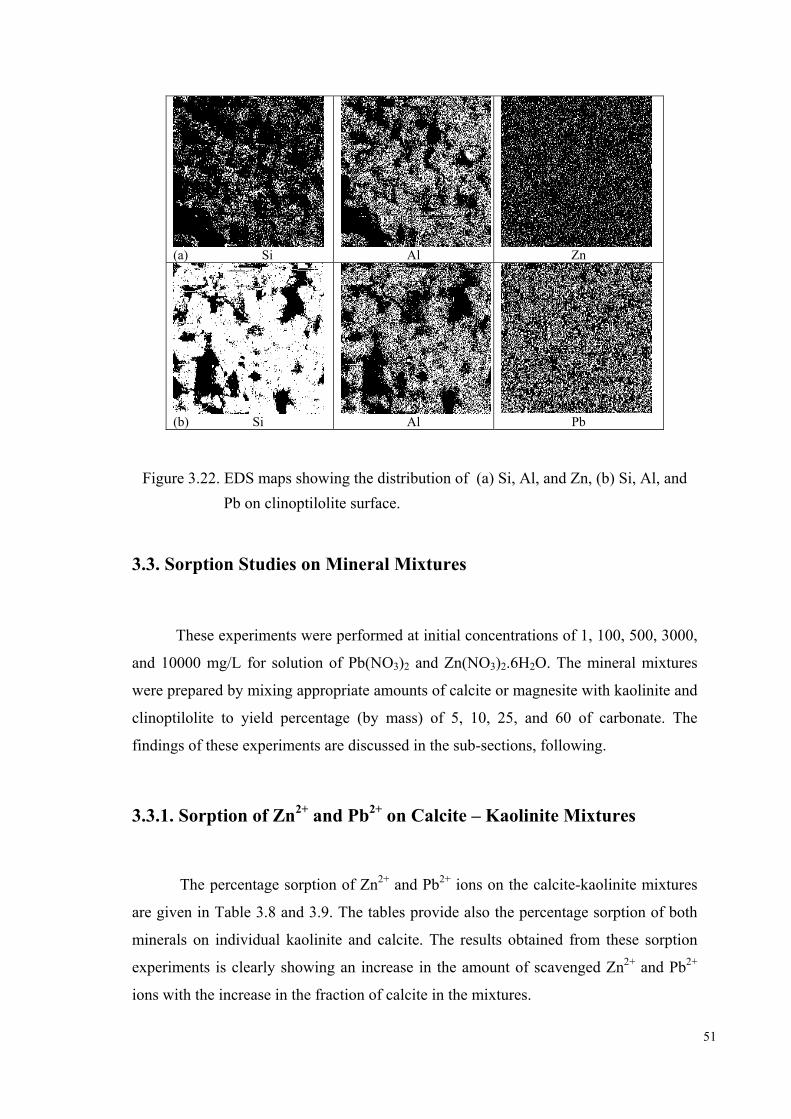
51
Figure 3.22. EDS maps showing the distribution of (a) Si, Al, and Zn, (b) Si, Al, and
Pb on clinoptilolite surface.
3.3. Sorption Studies on Mineral Mixtures
These experiments were performed at initial concentrations of 1, 100, 500, 3000,
and 10000 mg/L for solution of Pb(NO3)2 and Zn(NO3)2.6H2O. The mineral mixtures
were prepared by mixing appropriate amounts of calcite or magnesite with kaolinite and
clinoptilolite to yield percentage (by mass) of 5, 10, 25, and 60 of carbonate. The
findings of these experiments are discussed in the sub-sections, following.
3.3.1. Sorption of Zn2+ and Pb2+ on Calcite – Kaolinite Mixtures
The percentage sorption of Zn2+ and Pb2+ ions on the calcite-kaolinite mixtures
are given in Table 3.8 and 3.9. The tables provide also the percentage sorption of both
minerals on individual kaolinite and calcite. The results obtained from these sorption
experiments is clearly showing an increase in the amount of scavenged Zn2+ and Pb2+
ions with the increase in the fraction of calcite in the mixtures.
(a) Si Al
Zn
(b) Si Al
Pb
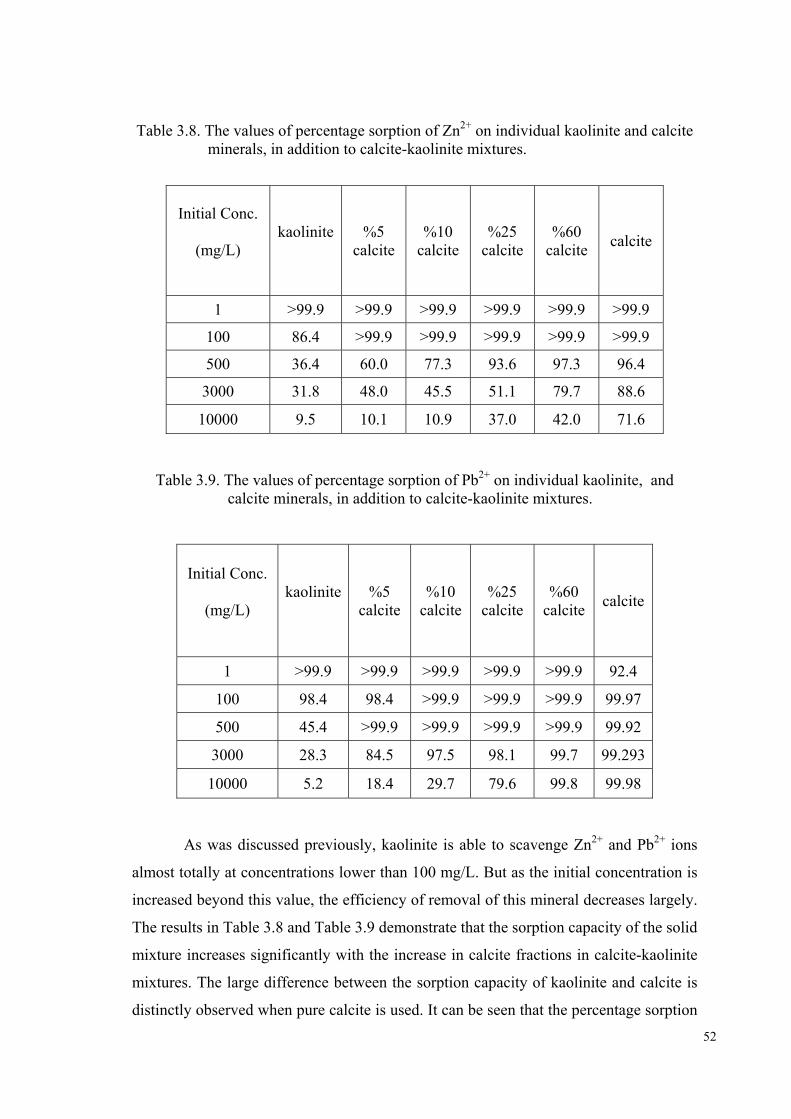
52
Table 3.8. The values of percentage sorption of Zn2+ on individual kaolinite and calcite minerals, in addition to calcite-kaolinite mixtures.
Initial Conc.
(mg/L) kaolinite %5
calcite %10
calcite %25
calcite %60
calcite calcite
1 >99.9 >99.9 >99.9 >99.9 >99.9 >99.9
100 86.4 >99.9 >99.9 >99.9 >99.9 >99.9
500 36.4 60.0 77.3 93.6 97.3 96.4
3000 31.8 48.0 45.5 51.1 79.7 88.6
10000 9.5 10.1 10.9 37.0 42.0 71.6
Table 3.9. The values of percentage sorption of Pb2+ on individual kaolinite, and calcite minerals, in addition to calcite-kaolinite mixtures.
Initial Conc.
(mg/L) kaolinite %5
calcite %10
calcite %25
calcite %60
calcite calcite
1 >99.9 >99.9 >99.9 >99.9 >99.9 92.4
100 98.4 98.4 >99.9 >99.9 >99.9 99.97
500 45.4 >99.9 >99.9 >99.9 >99.9 99.92
3000 28.3 84.5 97.5 98.1 99.7 99.293
10000 5.2 18.4 29.7 79.6 99.8 99.98
As was discussed previously, kaolinite is able to scavenge Zn2+ and Pb2+ ions
almost totally at concentrations lower than 100 mg/L. But as the initial concentration is
increased beyond this value, the efficiency of removal of this mineral decreases largely.
The results in Table 3.8 and Table 3.9 demonstrate that the sorption capacity of the solid
mixture increases significantly with the increase in calcite fractions in calcite-kaolinite
mixtures. The large difference between the sorption capacity of kaolinite and calcite is
distinctly observed when pure calcite is used. It can be seen that the percentage sorption

53
on calcite at the highest studied concentration (10000 mg/L Zn(NO3)2.6H2O, Pb(NO3)2 )
is almost eight-folds the percentage sorption of Zn2+ -pure kaolinite and about twenty
fold that of Pb2+ on the same mineral. Therefore, within the studied experimental
conditions, calcite stands as the prominent sink for zinc and lead among these two
minerals. Based on this, it can be concluded that , at neutral and high pH media,
calcareous soils is expected to possess outstanding sorption capacities towards both
cations, thus regulating the dispersion of these cations in the geosphere. Tables 3.8, and
3.9 show that, the percentage sorption values of Pb2+ are higher than that of Zn2+ in all
calcite containing mixtures.
The variation of the sorbed amounts of Zn2+ and Pb2+ ions with their
equilibrium liquid concentrations on calcite-kaolinite mixtures are given in Fig. 3.23
and Fig. 3.24. The amount of retarded Zn2+ and Pb2+ appears to approximately approach
the linear sorption as the mixtures become richer in calcite.
10 100 1000
1
10
100 kaolinite 5% calcite 10% calcite 25% calcite 60% calcite calcite
[Zn]
s(mg/
g)
[Zn]l (mg/L)
Figure 3.23. Variation of the equilibrium concentration on the solid phase with that in
the liquid phase for different Zn2+ loading, at various mixture compositions for calcite-kaolinite

54
10 100 1000
1
10
100
kaolinite 5 % calcite 10 % calcite 25 % calcite 60 % calcite calcite
[Pb]
s(mg/
g)
[Pb]l(mg/L)
Figure 3.24. Variation of the equilibrium concentration on the solid phase with that in the liquid phase for different Pb2+ loadings, at various mixture compositions for calcite-kaolinite.
If the mixtures were behaving ideally, then the total percentage sorption would
be predicted using the equation:
BBA
BA
BA
A PSmm
mPSmm
mPS )()(+
++
= 3.3
where ;
PS: the percentage sorption
mA and mB : masses of components A and B in their solid mixture.
The variation of percentage sorption obtained for the initial concentrations of
500, 3000, and 10000 mg/L of is plotted as a function of calcite fraction in the mixtures
as given by Fig. 3.25 and Figure 3.26. The same figure provides also the values
predicted by equation 3.3 (dotted lines). The figure suggests an exponential increase in
the percentage sorption of both ions as the fraction of calcite in the mixtures is
increased. It can be noticed that as the initial concentration of Zn(NO3)2 .6H2O and
Pb(NO3)2 solution is increased to 10000 mg/L, the experimental values of percentage
sorption become closer to those predicted by equation 3.3. This is merely stemming
from the fact that at higher loading, kaolinite becomes inefficient in sorption which is in
turn predominantly controlled by calcite, so that equation 3.3 can be approximated to:

55
CalciteKaoliniteCalcite
Caclcite PSmm
mPS )(
+≅ 3.4
0,0 0,2 0,4 0,6 0,8 1,00
20
40
60
80
100
500 mg/L 3000 mg/L 10000 mg/L
% S
orpt
ion
Xcalcite
Figure 3.25. The change of percentage sorption with the fraction of calcite at initial
loadings of 500, 3000, and 10000 mg/L of Zn(NO3)2 .6H2O on calcite- kaolinite.
0,0 0,2 0,4 0,6 0,8 1,00
20
40
60
80
100
500 mg/L 3000 mg/L 10000 mg/L
% S
orpt
ion
Xcalcite
Figure 3.26. The change of percentage sorption with the fraction of calcite at initial loadings of 500, 3000, and 10000 mg/L of Pb(NO3)2 on calcite-kaolinite.

56
It is obvious from the above discussion that calcite fractions in the mixtures are
responsible for the large retention of both cations. The data indicates also a larger
affinity for Pb2+ uptake compared to that of Zn2+. The differences between the sorbed
amounts of Pb and Zn cations by calcite fractions might be referred to their different
types of incorporation mechanisms. It is reported that, at low concentrations, the ionic
radii of the divalent cations determines the extent of uptake of these cations by calcite
so that ions with smaller radii are more preferably sorbed (Zachara et al, 1991, p.1549).
Although the ionic radii criterion proved to be successful in explaining the preferential
sorption of various ions on calcite (Zachara et al. 1991, p. 1549, Curti 1999, p.437), it
can not be used to explain the higher selectivity of calcite towards Pb2+ ions over that of
Zn2+ as the size of the latter is smaller than that of the former (r(Pb2+) = 1.18 Å, r(Zn2+)
= 0.745 Å ). Similar deviations of the ionic radii criteria were observed also for pairs of
cations possessing similar ionic radii like and Mg2+, Na+ and La3+ ions (Curti 1999,
p.437). The explanation offered for such anomalies relied on the hypothesis suggesting
that ions with lower partition coefficients are trapped within the limited number of
interstitial positions in calcite rather than exchanging with Ca2+ in lattice positions
(Busenberg et al. 1985, p.713).
The larger partition coefficient for Pb2+ can be verified from a thermodynamic
approach that is based on the Gibbs free energies of formation of carbonate phases and
ions in solution (Sverjinsky et al. 1992, p.232). These data can be used to estimate the
partition coefficients at the solid/solution interface utilizing the equation (Böttcher
1997, p.661):
log DMe,ideal = (∆Gof, CaCO3(s) - ∆Go
f, MeCO3(s) - ∆Gof, Ca
2+(aq) + ∆Go
f,Me2+
(aq)) /
((ln (10))RT) 3.5
Where ∆Gof correspond to the standard Gibbs free energies of formation for the
rhombohedral solid carbonates and the aqueous cations, T is the temperature in K, and
R is the gas constant. Based on the equation above and the corresponding values of ∆Gof
given in Table 3.10, it is possible to calculate log DMe,ideal of Zn2+ and Pb2+ as 0.053 and
1.8, respectively. This approach is useful in particular at lower metal concentrations
where the possibility of incorporation of the sorbed metal ions by the rhombohedral
calcite sites is higher. The larger uptake of Pb2+ ions compared with Zn2+ ions could be

57
indicative of a larger ability of Pb2+ ions in replacing Ca2+ ions in the regular matrix
sites of calcite, while a large fraction of Zn2+ ions apparently trapped in the limited
number of structural defects formed in the course of dissolution/recrystallization of
calcite.
Table 3.10. The ionic radii of Ca2+, Zn2+, and Pb2+ and Gibbs free energies of formation
of the aqueous cations in addition to their rhombohedral carbonates. The table provides also the calculated log DMe, ideal which shows the theoretical
partitioning at the calcite/solution interface.
Cation Radius (Å) ∆Go
f,cation
(kcal/mol)
∆Gof,MeCO3
(kcal/mol) log DMe, ideal
Ca2+ 1 -132.12 -270.0 -
Zn2+ 0.745 -35.17 -175.1 0.053
Pb2+ 1.18 -5.79 -146.0 1.8
The preference of Pb2+ uptake by calcite is also supported by the predictions of
another model (Wang et al. 2001, p.1530). This model makes use also of linear free
energy and correlates metal partition coefficients with metal cation properties. It states
that metal partitioning between minerals and aqueous solutions is controlled by three
factors; the chemical bonding energies of substituent cation with the host mineral
structure, the excessive energies created by the size difference between substituent and
host cations, and the difference in chemical potential between substituent and host
cations in solution. With all these factors taken into consideration, the partition
coefficient of aqueous Zn2+ and Pb2+ with calcite were given as 0.59 and 2.5 logarithmic
units, respectively.
At high loadings, the extent of precipitate overgrowth of a given cation can be
related with the Ksp of the cation-anion pair forming the precipitate. Theoretically, in a
mixture where the reactants are highly dispersed, the extent to which cation species
reacts with calcite can be estimated using the individual Ksp values (Hay et al., 2003,
p.3727):
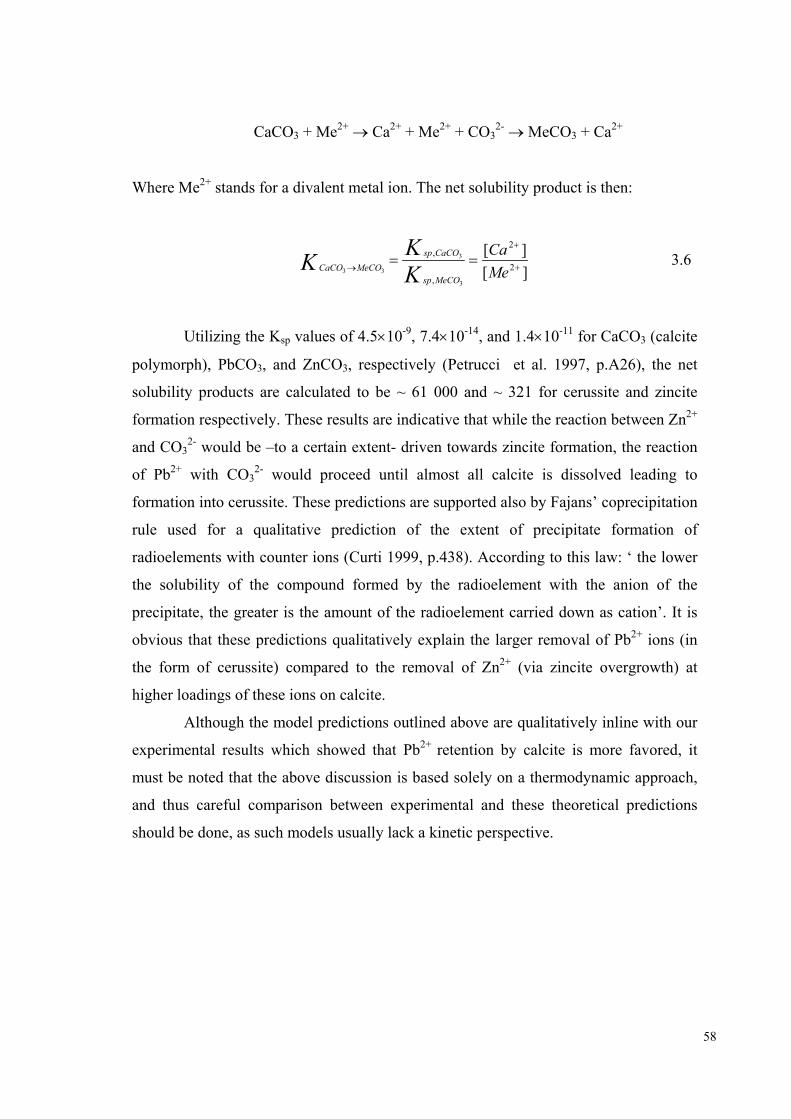
58
CaCO3 + Me2+ → Ca2+ + Me2+ + CO32- → MeCO3 + Ca2+
Where Me2+ stands for a divalent metal ion. The net solubility product is then:
][][
2
2
,
,
3
3
33 +
+
→==
MeCa
KKK
MeCOsp
CaCOspMeCOCaCO 3.6
Utilizing the Ksp values of 4.5×10⁻⁹, 7.4×10⁻¹⁴, and 1.4×10⁻¹¹ for CaCO3 (calcite
polymorph), PbCO3, and ZnCO3, respectively (Petrucci et al. 1997, p.A26), the net
solubility products are calculated to be ~ 61 000 and ~ 321 for cerussite and zincite
formation respectively. These results are indicative that while the reaction between Zn2+
and CO32- would be –to a certain extent- driven towards zincite formation, the reaction
of Pb2+ with CO32- would proceed until almost all calcite is dissolved leading to
formation into cerussite. These predictions are supported also by Fajans’ coprecipitation
rule used for a qualitative prediction of the extent of precipitate formation of
radioelements with counter ions (Curti 1999, p.438). According to this law: ‘ the lower
the solubility of the compound formed by the radioelement with the anion of the
precipitate, the greater is the amount of the radioelement carried down as cation’. It is
obvious that these predictions qualitatively explain the larger removal of Pb2+ ions (in
the form of cerussite) compared to the removal of Zn2+ (via zincite overgrowth) at
higher loadings of these ions on calcite.
Although the model predictions outlined above are qualitatively inline with our
experimental results which showed that Pb2+ retention by calcite is more favored, it
must be noted that the above discussion is based solely on a thermodynamic approach,
and thus careful comparison between experimental and these theoretical predictions
should be done, as such models usually lack a kinetic perspective.
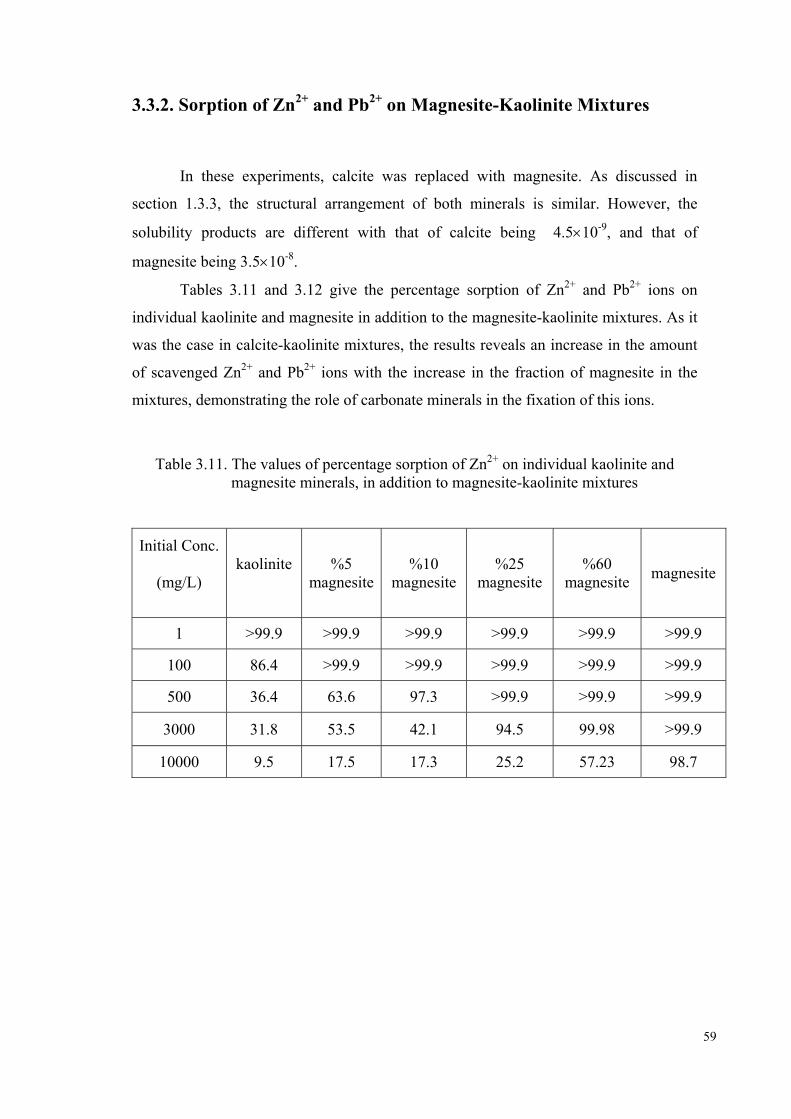
59
3.3.2. Sorption of Zn2+ and Pb2+ on Magnesite-Kaolinite Mixtures
In these experiments, calcite was replaced with magnesite. As discussed in
section 1.3.3, the structural arrangement of both minerals is similar. However, the
solubility products are different with that of calcite being 4.5×10⁻⁹, and that of
magnesite being 3.5×10⁻⁸.
Tables 3.11 and 3.12 give the percentage sorption of Zn2+ and Pb2+ ions on
individual kaolinite and magnesite in addition to the magnesite-kaolinite mixtures. As it
was the case in calcite-kaolinite mixtures, the results reveals an increase in the amount
of scavenged Zn2+ and Pb2+ ions with the increase in the fraction of magnesite in the
mixtures, demonstrating the role of carbonate minerals in the fixation of this ions.
Table 3.11. The values of percentage sorption of Zn2+ on individual kaolinite and magnesite minerals, in addition to magnesite-kaolinite mixtures
Initial Conc.
(mg/L) kaolinite %5
magnesite%10
magnesite %25
magnesite %60
magnesite magnesite
1 >99.9 >99.9 >99.9 >99.9 >99.9 >99.9
100 86.4 >99.9 >99.9 >99.9 >99.9 >99.9
500 36.4 63.6 97.3 >99.9 >99.9 >99.9
3000 31.8 53.5 42.1 94.5 99.98 >99.9
10000 9.5 17.5 17.3 25.2 57.23 98.7

60
Table 3.12. The values of percentage sorption of Pb2+ on individual kaolinite, and magnesite minerals, in addition to magnesite-kaolinite mixtures.
Initial Conc.
(mg/L) Kaolinite %5 magnesite
%10 magnesite
%25 magnesite
%60 magnesite magnesite
1 >99.9 >99.9 >99.9 >99.9 >99.9 >99.9
100 98.4 >99.9 >99.9 >99.9 >99.9 99.44
500 45.4 >99.9 >99.9 >99.9 >99.9 99.88
3000 28.3 84.4 99.4 99.7 99.9 99.96
10000 5.2 33.3 51.7 82.0 85.2 99.976
The variation of equilibrium concentration on the solid as a function of that in
the liquid for both of Zn2+, and Pb2+ ions are given in Fig. 3.27 and Fig. 3.28. In this
Figure, the sorbed amounts of zinc and lead ions shows nearly a perfect linearity with
the increase in magnesite fraction. The effect of increasing the fraction of magnesite
becomes clearer, in particular at higher loadings. For the initial concentrations of 500,
3000, and 10000 mg/L of Zn(NO3)2 .6H2O and Pb(NO3)2 , the percentage sorption is
plotted versus the amount of magnesite ( as shown in Figure 3.29 and Figure 3.30). The
figure includes also the data corresponding the sorption of Zn2+ and Pb2+ ion on pure
magnesite. If the mixtures were behaving ideally, the total percentage sorption would be
predicted using the equation 3.3. Zn2+ and Pb2+ ions seems to be almost linearly sorbed
at higher magnesite fractions. The shift towards linearity shows an enhancement in the
sorption capacity of the solids. The data of the percentage sorption of Zn2+ and Pb2+
indicate a more preferential sorption of the latter ion. It is reported that magnesite is
predicted to possess the largest partition coefficient among all carbonates with a calcite
structure, and therefore is a good scavenger of heavy metals (Wang at. al. 2001,
pp.1529-1530). According to the predictions presented by that study, the partition
coefficient of aqueous Zn2+ and Pb2+ with magnesite were 1.97 and 4.26 logarithmic
units, respectively.
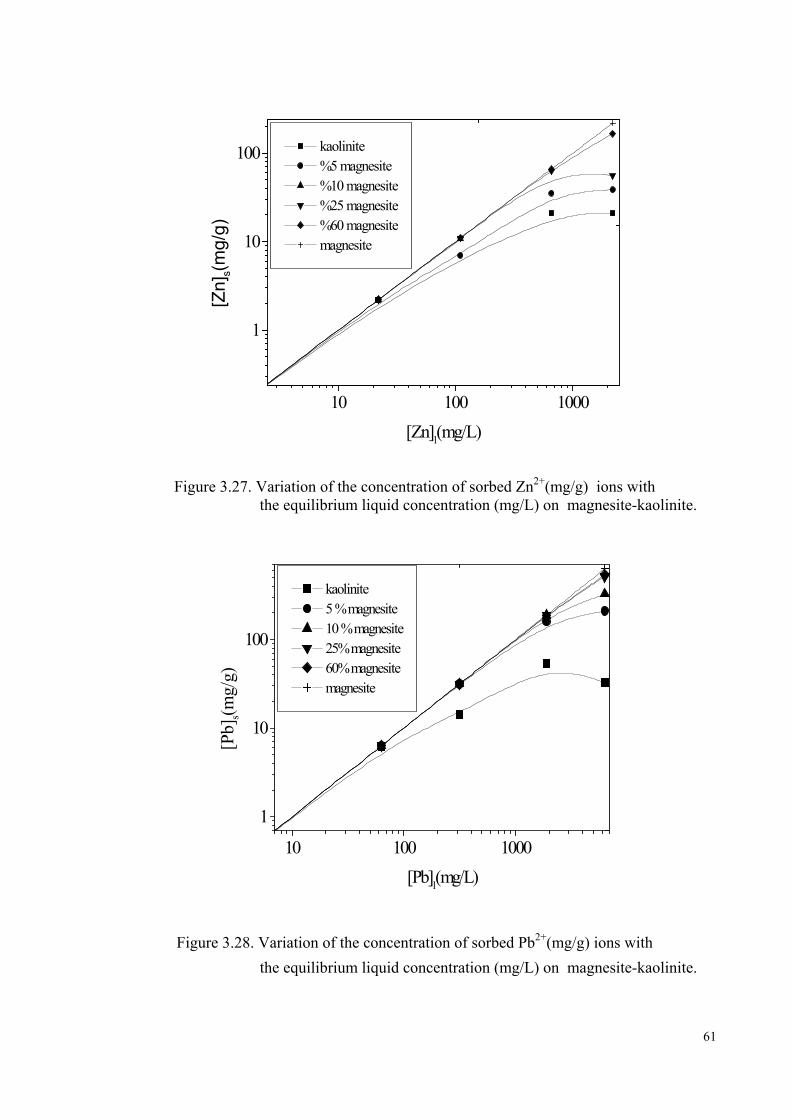
61
10 100 1000
1
10
100 kaolinite %5 magnesite %10 magnesite %25 magnesite %60 magnesite magnesite
[Zn]
s(mg/
g)
[Zn]l(mg/L)
Figure 3.27. Variation of the concentration of sorbed Zn2+(mg/g) ions with
the equilibrium liquid concentration (mg/L) on magnesite-kaolinite.
10 100 1000
1
10
100
kaolinite 5 % magnesite 10 % magnesite 25% magnesite 60% magnesite magnesite
[Pb]
s(mg/
g)
[Pb]l(mg/L)
Figure 3.28. Variation of the concentration of sorbed Pb2+(mg/g) ions with the equilibrium liquid concentration (mg/L) on magnesite-kaolinite.

62
0,0 0,2 0,4 0,6 0,8 1,00
20
40
60
80
100
500 mg/L 3000 mg/L 10000 mg/L
% S
orpt
ion
XMgCO3
Figure 3.29. Change in the percentage sorption of Zn with the amount of
magnesite in the mixtures of magnesite-kaolinite.
0,0 0,2 0,4 0,6 0,8 1,00
20
40
60
80
100
500 mg/L 3000 mg/L 10000 mg/L
% S
orpt
ion
XMgCO3
Figure 3.30. Change in the percentage sorption of Pb ions with the amount of magnesite in the mixtures of magnesite-kaolinite .

63
Comparing the sorption capacity of magnesite to that of calcite in their
mixtures with kaolinite, it can be seen that magnesite fractions were slightly more
efficient in the fixation of both cations. However, the detailed explanation of this result
on a mechanistic basis requires a seperate detailed study.
3.3.3. Sorption of Zn2+ and Pb2+ on Calcite- Clinoptilolite
In these experiments, the effect of calcite association with clinoptilolite is
investigated. The mixtures were prepared by mixing calcite with appropriate amount of
clinoptilolite to yield percentage compositions (weight percentages of calcite) of 5, 10,
25, and 60.
As in the case of calcite -kaolinite mixtures, the results showed an increase in
the amount of scavenged Zn2+ and Pb2+ ion with the increase of the fraction of calcite
in the mixtures as given Table 3.13 and Table 3.14.
The variation of the sorbed amounts of Zn2+ and Pb2+ ion with its equilibrium
liquid concentrations on calcite -clinoptilolite mixtures are given in Fig.3.31 and Fig.
3.32. The variation of percentage sorption of Zn2+ and Pb2+ at loadings of 500, 3000,
and 10000 mg/L with the fraction of calcite are illustrated by Figure 3.33 and Figure
3.34. The figure suggests an exponential increase in the percentage sorption of both ions
as the fraction of calcite in the mixtures is increased, the thing data observed in calcite -
kaolinite mixture, demonstrating again the high uptake capacity of calcite fractions.
Table 3.13. The values of percentage sorption of Zn2+ on individual clinoptilolite and calcite minerals, in addition to calcite-clinoptilolite mixtures
Initial Conc (mg/L) Clino %5 calcite %10
calcite %25
calcite %60
calcite calcite
1 >99.9 >99.9 >99.9 >99.9 >99.9 >99.9
100 95.5 >99.9 >99.9 >99.9 >99.9 >99.9
500 31.8 72.7 92.7 95.5 98.2 96.4
3000 22.9 4.7 48.6 61.5 86.4 88.6
10000 15.0 16.1 33.6 66.8 67.7 71.6
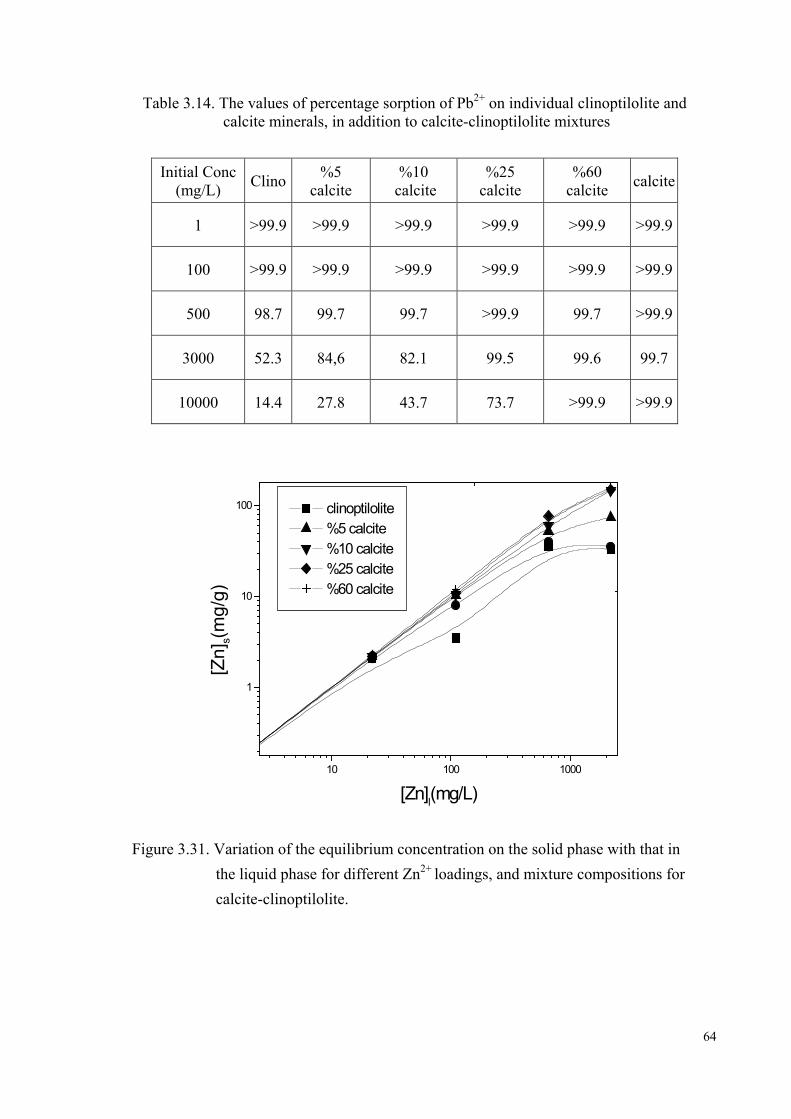
64
Table 3.14. The values of percentage sorption of Pb2+ on individual clinoptilolite and calcite minerals, in addition to calcite-clinoptilolite mixtures
Initial Conc (mg/L) Clino %5
calcite %10
calcite %25
calcite %60
calcite calcite
1 >99.9 >99.9 >99.9 >99.9 >99.9 >99.9
100 >99.9 >99.9 >99.9 >99.9 >99.9 >99.9
500 98.7 99.7 99.7 >99.9 99.7 >99.9
3000 52.3 84,6 82.1 99.5 99.6 99.7
10000 14.4 27.8 43.7 73.7 >99.9 >99.9
10 100 1000
1
10
100 clinoptilolite %5 calcite %10 calcite %25 calcite %60 calcite
[Zn]
s(mg/
g)
[Zn]l(mg/L)
Figure 3.31. Variation of the equilibrium concentration on the solid phase with that in the liquid phase for different Zn2+ loadings, and mixture compositions for calcite-clinoptilolite.

65
10 100 1000
1
10
100
clinoptilolite 5 % calcite 10% calcite 25% calcite 60% calcite
[Pb]
s(mg/
g)
[Pb]l(mg/L)
Figure 3.32. Variation of the equilibrium concentration on the solid phase with that in the liquid phase for different Pb2+ loadings, and mixture compositions for calcite-clinoptilolite.
0,0 0,2 0,4 0,6 0,8 1,0
20
40
60
80
100
500 mg/L 3000 mg/L 10000 mg/L
% S
orpt
ion
Xcalcite
Figure 3.33. The change of percentage sorption with the fraction of calcite at initial loadings of 500, 3000, and 10000 mg/L of Zn(NO3)2.6H2O on calcite-
clinoptilolite.

66
0,0 0,2 0,4 0,6 0,8 1,0
20
40
60
80
100
500 mg/L 3000 mg/L 10000 mg/L
% S
orpt
ion
Xcalcite
Figure 3.34. The change of percentage sorption with the fraction of calcite at initial loadings of 500, 3000, and 10000 mg/L of Pb(NO3)2 on calcite-
clinoptilolite.
3.3.4. Sorption of Zn2+ and Pb2+ on Magnesite –Clinoptilolite
In these experiments, calcite was replaced by magnesite to study the effect of the
latter on the sorption capacity of clinoptilolite. The results showed that Pb2+ and Zn2+
ions are increasing with the increase in the fraction of magnesite in the mixtures of
clinoptilolite as given Table 3.15 and Table 3.16. Figure 3.35 and Figure 3.36 show the
variation of the sorbed amounts of lead and zinc ions with their equilibrium liquid
concentration on magnesite - clinoptilolite mixtures. Lead and zinc ions seem to be
almost linearly sorbed at higher carbonate fractions. Here, it should be noted that, even
at lower magnesite fractions, the extent of curvature of the fits of experimental data is
less pronounced compared to the case of magnesite -kaolinite mixtures. This
observation is stimming from the higher sorption capacity of clinoptilolite, as compared
to that of kaolinite.
In addition, the variations of the percentage sorption with the amount of
magnesite in the mixtures at the initial concentrations of 500, 3000, and 10000 mg/L of

67
Pb(NO3)2 and Zn(NO3)2.6H2O solutions are given in Figure 3.37 and Figure 3.38. The
figure shows that initial concentration of lead and zinc ion is increased, then the
experimentel values of percentage sorption becomes closer to its predicted by equation
3.3, suggesting again that sorption becomes controlled by the carbonate phase in the
mixtures.
Table 3.15. The values of percentage sorption of Zn2+ on individual clinoptilolite and
magnesite minerals, in addition to magnesite-clinoptilolite mixtures
Initial Conc (mg/L) Clino %5
magnesite%10
magnesite%25
magnesite%60
magnesite magnesite
1 >99.9 >99.9 >99.9 >99.9 >99.9 >99.9
100 >99.9 >99.9 >99.9 >99.9 >99.9 >99.9
500 31.8 79.1 99.1 >99.9 >99.9 >99.9
3000 22.9 14.7 61.5 77.3 97.9 >99.9
10000 15.0 34.1 46.4 63.2 92.0 98.7
Table 3.16. The values of percentage sorption of Pb2+ on individual clinoptilolite and magnesite minerals, in addition to magnesite-clinoptilolite mixtures
Initial Conc (mg/L) Clino. %5
magnesite%10
magnesite%25
magnesite%60
magnesite magnesite
1 >99.9 >99.9 >99.9 >99.9 >99.9 >99.9
100 >99.9 >99.9 >99.9 >99.9 >99.9 >99.9
500 98.7 99.7 99.7 99.7 99.7 >99.9
3000 52.3 86.0 99.5 99.8 99.9 >99.9
10000 14.4 33.5 63.8 92.9 99.9 >99.9

68
10 100 1000
1
10
100 clinoptilolite %5 magnesite %10 magnesite %25 magnesite %60 magnesite magnesite
[Zn]
s(mg/
g)
[Zn]l(mg/g)
Figure 3.35. Variation of the concentration of sorbed Zn ion (mg/g) with the
equilibrium liquid concentration (mg/L) on magnesite- clinoptilolite mixture
10 100 1000
1
10
100
clinoptilolite 5% magnesite 10% magnesite 25% magnesite 60% magnesite magnesite
[Pb]
s(mg/
g)
[Pb]l(mg/L)
Figure 3.36. Variation of the concentration of sorbed Pb ion (mg/g) with the equilibrium liquid concentration (mg/L) on magnesite-
clinoptilolite mixture

69
0,0 0,2 0,4 0,6 0,8 1,0
20
40
60
80
100
500 mg/L 3000 mg/L 10000 mg/L
% S
orpt
ion
Xmagnesite
Figure 3.37. Change in the percentage sorption of Zn ions with the
amount of magnesite in the mixtures of clinoptilolite-magnesite .
0,0 0,2 0,4 0,6 0,8 1,0
20
40
60
80
100
500 mg/L 3000 mg/L 10000 mg/L
% S
orpt
ion
Xmagnesite
Figure 3.38. Change in the percentage sorption of Pb ion with the amount of magnesite in the mixtures of clinoptilolite-magnesite

70
3.4. Formation of Carbonate Phases of Zn2+ and Pb2+ Ions
3.4.1. Carbonate Phases of Lead
With the increase of calcite and magnesite fractions in the solid mixtures, the formation
of Pb- carbonate phases was observed. The formation of such phases was documented
using X-ray diffraction measurements, which showed that these phases were associated
with the mixtures containing 60% calcite or magnesite in addition to pure calcite and
magnesite. For the Pb-loaded mixtures of calcite, Figure 3.39 indicates the formation of
cerussite (PbCO3) in the samples that were prepared without any initial pH control.
When the initial pH was raised to 10.0, formation of hydrocerussite, (Pb3(CO3)2(OH)2),
was observed, indicating that this form is more stable at high pH values. However, in
the case of Pb2+ sorption on magnesite, the formation of a mixture of cerussite and
hydrocerussite was detected in the samples prepared with out any pH control, as seen in
Figure 3.40(a). As the initial pH was increased to 10.0, an entire precipitation of
hydrocerussite alone was seen in Figure 3.40(b).
The topic of relative stability of cerussite and hydrocerussite phases, formed
upon exposure of Pb ions to carbonate minerals , is a matter of dispute among different
researchers of this field. It is reported that cerussite and hydrocerussite equilibrium,
which is given by the reaction: 3 PbCO3(s) + H2O ⇔ Pb (OH)2.(PbCO3)2(s) + CO2(g), lies
very close to the partial pressure in the atmosphere (Godelitsas et al. 2003, p.3358). In
the same study, it was also argued that hydrocerussite formation might result from a
rapid pH increment but that a subsequent equilibrium with the atmospheric CO2(g) can
lead to a higher stability of cerussite. Our studies confirmed the fact that the formation
of hydrocerussite was caused by the increment in the pH, but it revealed also that
exchanging CO2 with the atmosphere during a period of four hours did not lead to any
conversion of hydrocerussite into cerussite. It must be stressed here that a time period of
four hours is very short to be able to draw a sharp conclusion about the relative stability
of cerussite/hydrocerussite within the solution medium as phase transitions might
sometimes be kinetically controlled.

71
Figure 3.39. XRPD patterns showing the features of cerussite and hydrocerussite obtained upon interaction of Pb ions with calcite with no pH
modification, C: Cerussite, HydC: Hydrocerussite
20 30 40
calcite (104)
HydC
HydCHydC
2θ
Figure 3.40. XRPD patterns showing the features of hydrocerussite obtained upon interaction of Pb ions with calcite with initial pH of 10.0. C: Cerussite, HydC: Hydrocerussite.
20 25 30 35 402θ
CC
C
CC
calcite(104)
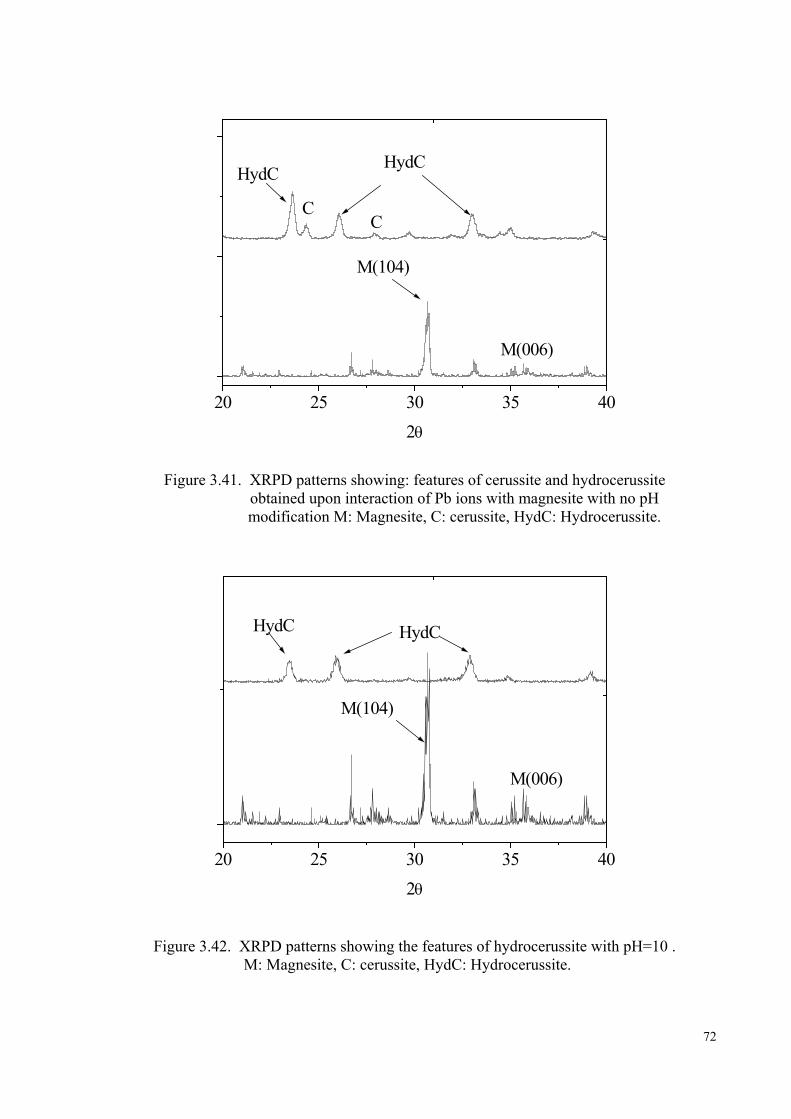
72
20 25 30 35 40
CC
M(006)
M(104)
HydCHydC
2θ
Figure 3.41. XRPD patterns showing: features of cerussite and hydrocerussite obtained upon interaction of Pb ions with magnesite with no pH modification M: Magnesite, C: cerussite, HydC: Hydrocerussite.
20 25 30 35 40
HydCHydC
2θ
M(006)
M(104)
Figure 3.42. XRPD patterns showing the features of hydrocerussite with pH=10 .
M: Magnesite, C: cerussite, HydC: Hydrocerussite.
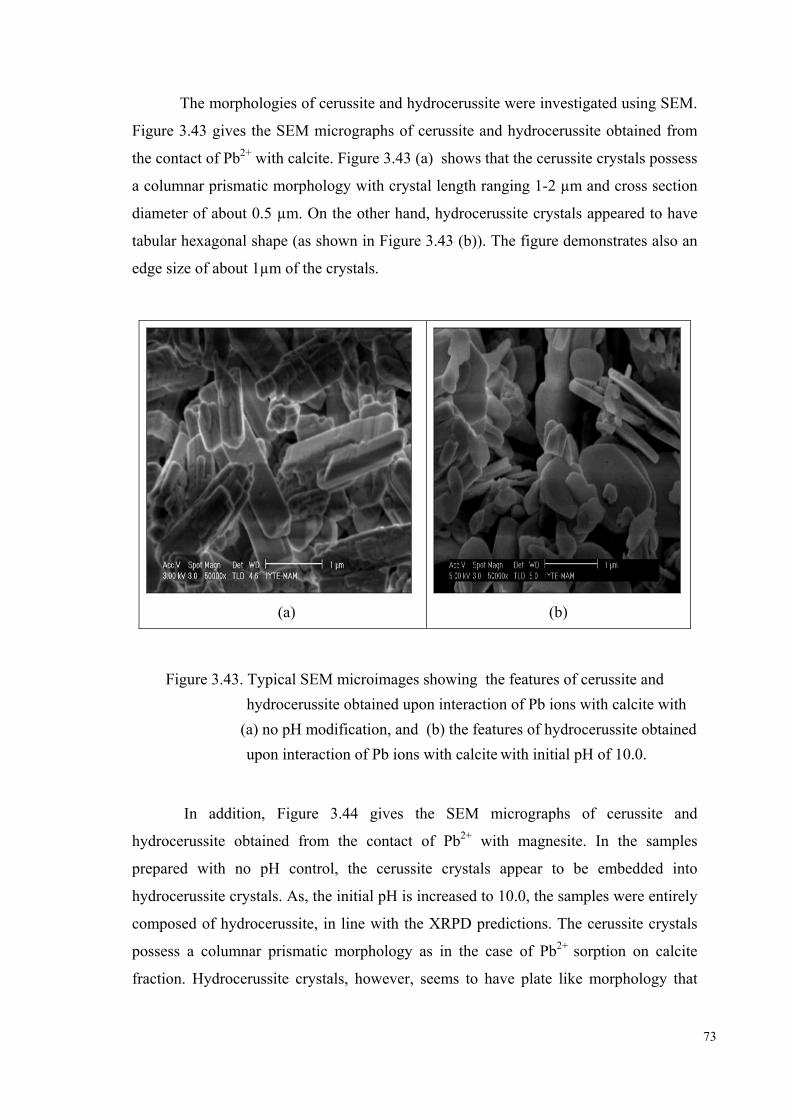
73
The morphologies of cerussite and hydrocerussite were investigated using SEM.
Figure 3.43 gives the SEM micrographs of cerussite and hydrocerussite obtained from
the contact of Pb2+ with calcite. Figure 3.43 (a) shows that the cerussite crystals possess
a columnar prismatic morphology with crystal length ranging 1-2 µm and cross section
diameter of about 0.5 µm. On the other hand, hydrocerussite crystals appeared to have
tabular hexagonal shape (as shown in Figure 3.43 (b)). The figure demonstrates also an
edge size of about 1µm of the crystals.
(a)
(b)
Figure 3.43. Typical SEM microimages showing the features of cerussite and hydrocerussite obtained upon interaction of Pb ions with calcite with
(a) no pH modification, and (b) the features of hydrocerussite obtained upon interaction of Pb ions with calcite with initial pH of 10.0.
In addition, Figure 3.44 gives the SEM micrographs of cerussite and
hydrocerussite obtained from the contact of Pb2+ with magnesite. In the samples
prepared with no pH control, the cerussite crystals appear to be embedded into
hydrocerussite crystals. As, the initial pH is increased to 10.0, the samples were entirely
composed of hydrocerussite, in line with the XRPD predictions. The cerussite crystals
possess a columnar prismatic morphology as in the case of Pb2+ sorption on calcite
fraction. Hydrocerussite crystals, however, seems to have plate like morphology that

74
posses a shape close to hexagonal but with rounded edges, and variable edge lengths
ranging 0.5-2 µm.
(a)
(b)
Figure 3.44. Typical SEM microimages showing; (a) cerussite crystals embedded in between crystals of hydrocerussite and magnesite (b)hydrocerussite crystals. The morphological stability of cerussite and hydrocerussite was also examined
over long periods of time. SEM and EDS analysis of the dried samples that were kept
under ambient conditions for a period of nine months revealed that while hydrocerussite
retained its morphologic configuration and chemical composition over this time period,
a slow morphological transition was observed in the case of cerussite from columnar
prismatic shape to what seems to be a rectangular plate-like shape, as shown in Fig.
3.45.

75
Fig. 3.45. SEM micrographs of: cerussite powder stored under ambient conditions for nine months (magnification of ×25 000)
The carbonate specie formed upon contact of Pb2+ with calcite and magnesite
were also examined using FTIR spectroscopy. Figure 3.46 shows IR modes of Pb-
loaded calcite compared to that of pure calcite. The band at 1074 cm-1 in the spectra of
Pb-loaded calcite belongs to the ν1 vibrational mode (symmetric stretching) that is IR
inactive in the spectrum of pure calcite. Moreover, a broadening is observed in the
asymmetric stretching peak (ν3)- which occured at 1437 cm-1 in calcite accompanied by
a slight splitting, particularly in the samples of Pb-loaded calcite. The split could be
caused by difference in chemical environment of lattice carbonate and surface
carbonate. Furhermore, the originally weak feature, appearing near 847 cm-1 in calcite,
is becoming more intense upon sorption of Pb2+ ions. The observed variations in various
vibrational bands of calcite indicate a decrease in the carbonate symmetry upon the
uptake of lead ions by calcite. As illustrated in Figure 3.47, the band occuring at 3538
cm-1 comes plausibly from the stretching vibrations of the structural –OH groups in
hydrocerussite. As in cerussite, hydrocerussite formation caused a slight split in the
band arising from the ν3 (asymetric stretching of carbonate) mode originally at 1437
cm-1, accompanied by a red shift of the band center to 1376 cm-1. The band
corresponding to the v1 mode (symmetric stretching that is IR inactive in calcite)
became more distinct upon hydrocerussite overgrowth compared to the case of
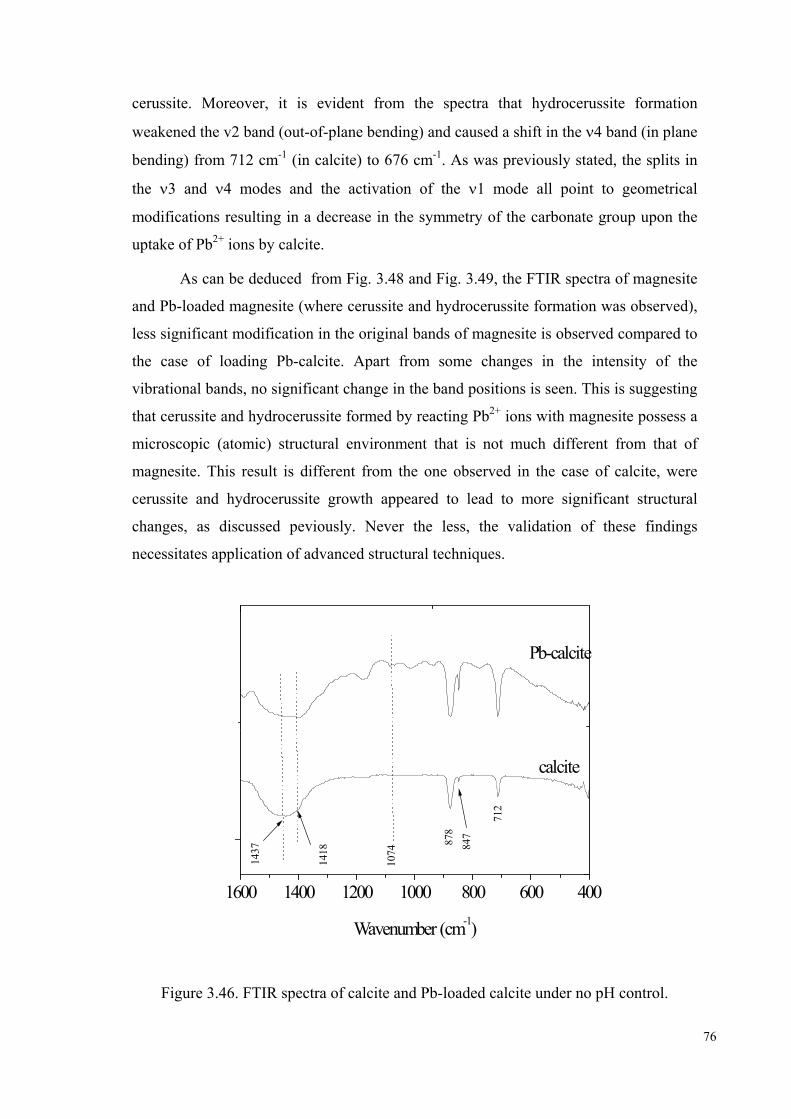
76
cerussite. Moreover, it is evident from the spectra that hydrocerussite formation
weakened the v2 band (out-of-plane bending) and caused a shift in the ν4 band (in plane
bending) from 712 cm-1 (in calcite) to 676 cm-1. As was previously stated, the splits in
the ν3 and ν4 modes and the activation of the ν1 mode all point to geometrical
modifications resulting in a decrease in the symmetry of the carbonate group upon the
uptake of Pb2+ ions by calcite.
As can be deduced from Fig. 3.48 and Fig. 3.49, the FTIR spectra of magnesite
and Pb-loaded magnesite (where cerussite and hydrocerussite formation was observed),
less significant modification in the original bands of magnesite is observed compared to
the case of loading Pb-calcite. Apart from some changes in the intensity of the
vibrational bands, no significant change in the band positions is seen. This is suggesting
that cerussite and hydrocerussite formed by reacting Pb2+ ions with magnesite possess a
microscopic (atomic) structural environment that is not much different from that of
magnesite. This result is different from the one observed in the case of calcite, were
cerussite and hydrocerussite growth appeared to lead to more significant structural
changes, as discussed peviously. Never the less, the validation of these findings
necessitates application of advanced structural techniques.
1600 1400 1200 1000 800 600 400
Wavenumber (cm-1)
Pb-calcite
calcite
712
847878
1074
1418
1437
Figure 3.46. FTIR spectra of calcite and Pb-loaded calcite under no pH control.

77
3600 3500 3400
3538
1376
1437
1046
847
878
676
712
Wavenumber (cm-1)
1500 1200 900 600
calcite
Pb-calcite pH=10Pb-calcite pH=10
calcite
Figure 3.47. FTIR spectra of calcite and Pb-loaded calcite under pH=10.
2000 1500 1000 500
1392 67
5
59479
5850
88611
17
1490
Pb-magnesite
magnesite
Wavenumber (cm-1)
1419
Figure 3.48. FTIR spectra of Pb-loaded magnesite

78
2000 1800 1600 1400 1200 1000 800 600 400
Pb-magnesite pH=10
Wavenumber (cm-1)
magnesite
679
1038
594
795
850
886
1117
141914
90
Figure 3.49. FTIR spectra of Pb-loaded magnesite for pH=10
3.4.2. Carbonate Phases of Zinc
XRPD examination of the Zn- loaded mixtures of both of calcite and magnesite
in addition to kaolinite and clinoptilolite mixtures containing 60% of magnesite and
calcite, revealed the formation of hydrozincite species as shown in Figure 3.50 and
3.51. It is reported that in the presence of carbonate and hydroxide ions, zinc can form
precipitates that exhibit the general formula Zn(CO3)x(OH)2-2x with 0<x<1 , where the
value of x can be controlled by the synthesis procedure (Zhang et al. 2004, p.1944).
Increasing the initial pH to 10.0 did not change the type of precipitated specie indicating
the stability of hydrozincite. The particles of this crystal did not show a distinct
morphology as it was the case in cerussite and hydrocerussite. A typical SEM image is
provided in Figures 3.52 (a) and (b) for hydrozincite.
The effect of Zn2+ retention on the structure of calcite and magnesite was also
followed using FTIR spectroscopy. Fig. 3.53 provides the FTIR spectra of calcite prior
to and after Zn2+ loading at the highest studied concentration of 10000 mg/L Zn(NO3)2

79
.6H2O. Again, incorporation of Zn2+ in the form of hydrozincite is seen to cause
changes in the vibrational bands. These changes include a split in the asymmetric
vibrational band of the mineral occurring initially at 1443 cm-1, activation of the
initially inactive symmetric stretching feature located at 1056 cm-1, development of a
hydroxide stretching feature at 3344 cm-1, possibly arising from the hydroxide groups in
the hydrozincite structure, and splitting of the in-plane and out-of-plane bending modes
occurring at 716 , 876 cm-1, respectively.
The FTIR spectra of magnesite is compared to that of Zn-loaded magnesite in
which hydrozincite formation was documented. The overgrowth of hydrozincite leads to
no significant modifications in the original vibrational bands. Interestingly, this result
resembles the one observed upon overgrowth of cerussite and hydrocerussite resulting
from sorption of Pb2+ on magnesite as shown in Fig. 3.54.
10 20 30 402θ
HydZHydZHydZ
M(006)
M(104)
Zn-magnesite
magnesite
Figure 3.50. XRPD patterns showing the features of hydronzincite obtained upon interaction of Zn ions with magnesite. M: magnesite, HydZ: hydrozincite

80
10 20 30 40
calcite(104)
HydZHydZ
HydZ
2θ
hydrozincite
calcite
Figure 3.51. XRPD patterns showing the features of hydronzincite obtained upon interaction of Zn ions with calcite. HydZ: hydrozincite
(a)
(b)
Figure 3.52. Typical SEM microimages of hydrozincite for (a) calcite (b) magnesite

81
4000 3000 2000 1000
1443
876
716
105613831509
3344
(b)
(a)
Wavenumber (cm-1)
Figure 3.53. FTIR spectra of (a)calcite, (b) Zn-loaded calcite.
2000 1500 1000 500
594
795
850
886
(b)
1117
1419
1490
Wavenumber (cm-1)
(a)
Figure 3.54. FTIR spectra of (a) magnesite, and (b) Zn-loaded magnesite.

82
CHAPTER 4
CONCLUSIONS AND RECOMMENDATIONS
The effect of magnesite and calcite on the uptake of lead and zinc by mixtures of
these carbonates with kaolinite and clinoptilolite was investigated. The study included
determination of kinetics and sorption isotherms of lead and zinc on pure kaolinite and
clinoptilolite. In addition, the mechanisms of uptake of lead and zinc at different
concentration levels for different mixtures and pH conditions, the morphologies of the
formed precipitates, the plausible structural changes in the lattice of calcite, magnesite,
kaolinite, and clinoptilolite, originating from sorption of lead and zinc ions were
discussed. The specific conclusions are listed below:
1. The sorption affinity of both of kaolinite and clinoptilolite towards Pb is larger
than their affinity towards Zn. The process of sorption appears to achieve
equilibrium rapidly. The sorption data are described by Freudlich isotherm
model.
2. The large increase in the scavenged amounts of Zn and Pb ions with the
increase in the fraction of magnesite and calcite in the mixtures suggests that
carbonates are a more favorable sink for these ions. Hence, carbonate presence
as a soil component is expected to correlate positively with the sorption
properties of soil, in particular in the alkaline media. The efficiency of calcite
and magnesite becomes clearer at higher loadings, where the sorption process
becomes predominantly controlled by the amount of calcite and magnesite in
the mixtures.
3. Precipitation mechanism of carbonate specie of Zn and Pb took place at higher
fractions of magnesite and calcite and higher loadings leading to enhancement
in the removal of both ions from the aqueous medium.
4. When the initial concentration of Zn and Pb ions is raised, a rapid overgrowth
of hydrozincite, and cerussite was observed. Increasing the initial pH to 10.0
caused enhancement in the dissolution of calcite and magnesite, increasing in

83
the amount of precipitated hydrozincite and the formation of hydrocerussite
instead of cerussite.
5. The SEM images showed that the morphologies of cerussite, and
hydrocerussite have columnar prismatic- like, and tabular hexagonal-like
shapes, respectively. The size of the crystals are roughly in the range 1-2 µm.
Alternatively, hydrozincite did not have a distinct morphology. Examination of
the morphological stability of the samples stored in dry conditions over a period
of nine months, indicated that hydrocerussite is more stable than cerussite.
6. The uptake of Pb2+ and Zn2+ results in decreasing the symmetry of the carbonate
group leading to activating the initially inactive symmetric stretching mode and
splitting the degenerate modes . By virtue of being able to trace the changes in
symmetry in the structure of a given sorbent, FTIR analysis could be helpful in
confirming the uptake of foreign ions by that sorbent, in particular, when the
concentration of these ions is so small that their sorption might not be clearly
followed by techniques like XRPD and SEM.
7. On the overall, magnesite fractions appears to show a slightly better sorption
capacity compared to calcite fractions. This observation needs to be validated
on a mechanistic basis in a separate detailed study in which kinetic and
thermodynamic factors should be examined in depth.

84
REFERENCES
Allen, H.E., Huang, C.P., Bailey, G.W., Bowers, A.R., 1995. Metal Speciation
and Contamination of Soil, ( Lewis Publishers, Florida,), p.255
Appel, C., Ma, L. 2002. “Concentration, pH, and surface charge effects on
cadmium and lead sorption in three tropical soils”, JEQ, Vol. 31, pp.581-589.
Auboiroux, M., Baillif, P., Touray, J.C., Bergaya F. 1996. “Fixation of Zn2+ and
Pb2+ by a Ca –montmorillonite in brines and dilute solutions: Preliminary results”,
Applied Clay Science, Vol. 11, pp.117-126.
Badawy, S.H., Helal, M.I.D., Chaudri, A., Lawlor, K. and McGrath, S.P. 2002.
“Solid solid-phase controls lead activity in soil solution”, JEQ, Vol. 31, pp.162-167.
Busenberg, E. and Plummer, L.N. 1985. “Kinetics and thermodynamics factore
controlling the distribution of SO42- and Na+ in calcites and selected arogonites”,
Geochimica et Cosmochimica Acta, Vol. 49, pp.713-725.
Badillo-Almaraz, V., Trocellier P., Davilla- Rangel I. 2003. “Adsorption of
aqueous Zn(II) species on synthetic zeolites”, Nuclear Instruments and Methods in
Physics Research, Vol. 210, pp.424 –428.
Böttcher, M. E., Gehlken, P., and Steele, D.F. 1997. “Characterization of
inorganic and biogenic magnesian calcites by Fourier Transform Infrared
Spectroscopy.”, Solid State Ionics, Vol. 101-103, pp.1379-1385.
Bradl, H.B. 2004. “Adsorption of heavy metal ions on soils and soils
constituents”, Journal of Colloid and Interface Science, Vol. 277, pp. 1-18.
Chiron, N., Guilet, R., Deydier, E. 2003. “Adsorption of Cu(II) and Pb(II) onto a
grafted silica: isotherms and kinetic models”, Water Research, Vol. 37, pp.3079-3086.
Coles, C.A., Yong, R.N. 2002. “Aspects of kaolinite characterization and
retention of Pb and Cd”, Applied Clay Science, Vol. 22, pp.39-45.
Connor, D.J., Sexton, B.A., Smart, R. 2003. Surface Analysis Methods in
Materials Science, (Springer-Verlag, Germany), pp.91, 98, 203-205.

85
Curti, E. 1999. “ Coprecipitation of radionuclides with calcite: estimation of
partition coefficients based on a rewiew of laboratory investigations and geochemical
data”, Applied Geochemistry, Vol.14, pp. 433-445.
Çulfaz, M., Yağız, M. 2003. “Ion exchange properties of natural
clinoptilolite:lead –sodium and cadmium –sodium equilibria”, Seperation and
Purification Technology, Elsevier, Vol.37, pp. 95-105.
Echeverria, J.C, Morera, M.T., Mazkiaran, C., Garrido, J.J. 1998. “Competitive
sorption of heavy metal by soils.Isotherms and fractional factorial experiments”,
Environmental Pollution, Vol. 101, pp.275-284.
El-Korashy, S.A. 2003. “Studies on diavalent ion uptake of transition metal
cations by calcite through crystallization and cation exchange process”, Journal of
Materials Science, Vol. 38, pp. 1709-1719.
Elzinga, E.J., Reeder, R. J. 2002. “ X-ray absorption spectroscopy study of Cu2+
and Zn2+ adsorption complexes at the calcite surface: Implications for site-specific
metal incorporation preferences during calcite crystal growth”, Geochimica et
Cosmochimica Acta, Vol. 66, pp.3943-3954.
Erten, H.N., Gökmenoğlu, Z. 1994. “Sorption behaviour of Co2+, Zn2+ and Ba2+
ions on alumina, kaolinite and magnesite”, Journal of Radioanalytical and Nuclear
Chemistry, Articles, Vol. 182, pp.375-384.
Esalah, J.O., Weber, M.E., Vera, J.H. 2000. “Removal of lead from aqueous
solutions by precipitation with sodium di-(n-octyl) phosphinate”, Seperation and
Purification Technology, Vol. 18, pp. 25-36.
Feng, D., Aldrich, C., Tan, H. 2000. “Removal of heavy metal ions by carrier
magnetic separation of adsorptive particulates”, Hydrometallurgy, Vol. 56, pp.359-368.
Garcia-Sanchez, A., Alvarez-Ayasu, E. 2002. “Sorption of Zn, Cd and Cr on
calcite. Application to purification of industrial waste waters”, Minerals Engineering,
Vol. 15, pp.539-547.
Godelitsas, A., Astilleros J.M., Hallam, K., Harissopoulos, S. and Putnis, A.
2003. “ Interaction of calcium carbonates with lead in aqueous solutions”, Environ. Sci.
Technol., Vol. 37, pp.3351-3360.

86
Gupta, V., K., Gupta, M., and Sharma S. 2001. “Process development for the
removal of lead and chromium from aqueous solutions using red mud –an aluminium
industry waste”, Water Research, Vol. 35, pp.1125-113 .
Haswell, S.J. 1991. Atomic Absorption Spectrometry: Theory, Design and
Applications , (Elsevier, Amsterdam,), p.22
Hay, M.B., Workman, R.K., and Manne, S. 2003. “Mechanisms of metal ion
sorption on calcite: composition mapping by Lateral Force Microscopy, Langmuir,
Vol. 19, pp. 3727-3740
Hooda, P.S., Alloway, B.J. 1998. “Cadmium and lead sorption behaviour of
selected English and Indian soils”, Geoderma, Vol. 84, pp. 121-134.
Hu, Y., Liu, X. 2003. “Chemical composition and surface property of kaolins” ,
Minerals Engineering, Vol.16, pp.1279-1284.
Inglezakis, V. J., Loizidou, M.D., and Grigoropoulou, H. P. 2003. “Ion exchange
of Pb+2, Cu+2, Fe+3, and Cr+3 on natural clinoptilolite; Selectivity determination and
influence of acidity on metal uptake.”, Journal of colloid and Interface Science, Vol.
261, pp.49-54.
Ikhsan, J., Johnson, B.B., and Wells, D. 1999. “A comparative study of the
adsorption of transition metals on kaolinite”, Journal of Colloid and Interface Science,
Vol. 217, pp.403-410.
Jain, C. K., and Ram, D. 1997. “Adsorption of lead and zinc on bed sediments of
the River Kali”, Wat. Res., Vol. 31, pp.154-162.
Kissel, D.E., Dixon, J.B., and Weed S.B. 1989. SSA Book series:1 Minerals in
Soil Environments, (Soil Science Society of America, Madison, Wisconsin USA),
p.488.
Kuriyavar, S.I., Vetrivel, R., Hegde, S.G., Ramaswamy, A.V., Chakrabarty, D.
and Mahapatra, S. 2000. “Insights into the formation of hydroxyl ions in calcium
carbonate: temperature dependent FTIR and molecular modelling studies”. J. Mater.
Chem., Vol. 10, pp. 1835-1840.
Langella, A., Pansini, M., Capeletti, P., Gennaro, B., Gennaro,M., Colella, C.,
2000. “NH4+, Cu2+, Zn2+, Cd2+ and Pb2+ exchange for Na+ in a sedimentary
clinoptilolite, North Sardinia, Italy”, Microporous and Mesoporous Materials, Vol. 37,
pp.337-343.

87
Lee, S., Z., Chang, L., Yang, H., Chen, C., M., and Liu, M.C. 1998.
“Adsorption characterictics of lead onto soils”, Journal of Hazardous Materials, Vol.
63, pp.37-49.
Li, Z., Alessi, D., and Allen, L. 2002. “Influence of quaternary ammonium on
sorption of selected metal cations onto clinoptilolite zeolite”, JEO, Vol. 31, pp.1106-
1114.
Lim, T.T., Tay, J.H., and Teh, C.I., 2002. “Contamination time effect on lead
and cadmium fractionation in a tropical coastal clay”, JEO, Vol. 31, pp.806-812.
Lin, Z., Cormet, B., Qvarfort, U. and Herbert, R., 1995. “The chemical and
mineralogical behaviour of Pb in shooting range soils from central Sweden”,
Environmental Pollution, 89, pp.303-309.
Liu, D., Hsu, C., Chuang, C. 1995. “Ion Exchange and sorption kinetics of
cesium and strontium in soils”, Appl. Radiat. Isot., Vol. 46, pp.839-846.
Mercy, M.A., Rock, P.A., Casey, W.H., Mokarrom, M.H. 1998. Am. Mineral,
Vol. 83, pp.739-745
Mesquita, M.E., Silva, J.M., 1996. “Zinc adsorption by a calcareous soil. Copper
interaction.”, Geoderma, Vol. 69, pp.137-146.
Miranda-Trevino, J.C., Coles, C.A., 2003. “Kaolinite properties, structure and
influence of metal retention on pH”, Applied Clay Science, Vol. 23, pp.133-139.
Nachtegaal, M., Sparks, D. 2004. “Effect of iron oxide coatings on zinc sorption
mechanisms at the clay-mineral/water interface”, Journal of Colloid and Interface
Science, Vol. 276, pp.13-23.
Nakamoto, K. 1986. Infrared and Raman Spectra of Inorganic and
Coordination Compounds, (John Wiley & Sons), pp.86-87.
Narin, G.,A. 2001. Chromotographic Study of Carbonmonoxide Adsorption in
Clinoptolite, MSc Thesis, İzmir Institue of Technology, İzmir, p.15
Ohnesorge, C.K., and Withem, M.,. 1991. Metals and Their Compounds in the
Environment, (VCH publishers, Germany,), pp.971-974, 1309
Özkan, S. F. 1996. Adsorbent Yataklarının Dinamik Davranışının incelenmesi ve
Doğal Kaynakların Adsorbent olarak Değerlendirimesi, Ph.D., Ege University, İzmir,
p.2.
88
Pardo-Botello, R., Fernandez-Gonzalez, C., Pinilla-Gil, E., Cuerda Correa,
E.M., Gomez-Serrano, V. 2004. “Adsorption kinetics of zinc in multicomponent ionic
systems”, Elsevier, Journal of Colloid and Interface Science, Vol. 277, pp.292-298.
Peric, J., Trgo, M., Medvidovic, N.V. 2004. “Removal of zinc, copper and lead
by natural zeolite – acomparison of adsorption isotherms”, Water Research, Vol. 38,
pp.1893-1899.
Petrucci, R.H., Harwood, W.S. 1997. General Chemistry, (Prentice-Hall
International, New Jersey), p.A26.
Pierzynski, G.M., Thomas, J. S., Vance, G. F., 1994. Soils and Environmental
Quality, (Lewis Publishers, Florida), p.167.
Pokrovsky, O.S., 1998. “Precipitation of calcium and magnesium carbonates
from homogeneous supersaturated solutions”, Journal of Crystal Growth, Vol. 186, pp.
233-239.
Prasad M., Saxena S., Amritphale S.S., and Chandra N. 2000. “Kinetics and
isoterms for aqueous lead adsorption by natural minerals”, Ind. Eng. Chem. Res., Vol.
39, pp.3034-3037.
Reig, F.B., Gimeno Adelantado, J.V. and Moya Moreno, M.C.M. 2002. “FTIR
quantitative analysis of calcium carbonate (calcite) and silica (quartz) mixtures using
the constant ratio method. Application to geological samples”, Talanta, Vol. 58,
pp.811-821.
Rouquerol, F., Rouquerol, J., and Sing, K., 1999. Adsorption by Powder and
Porous Solids Principles, Methology and Applications, (Academic Pres Inc. USA),
pp. 355, 358.
Settle, F.A. 1997. Handbook of Instrumental Techniques for Analytical
Chemistry, (Prentice Hall PTR), pp.341-342
Shahwan, T. 2000. “Radiochemical and spectroscopic studies of cesium, barium,
and cobalt sorption on some natural clays”, Ph. D. Thesis, Bilkent University, Ankara ,
pp.8, 18
Shahwan, T., Atesin, A.C., Erten, H.N., Zarasız, A., 2002. “Uptake of Ba2+ ions
by natural bentonite and CaCO3: A radiotracer, EDXRF and PXRD study”, Journal of
Radioanalytical and Nüclear Chemistry, Vol. 254, pp.563-568.

89
Shahwan, T., Sayan, S., Erten, H. N., Black, L., Hallam, K.R. and Allen, G.C.
2000. “Surface spectroscopic studies of Cs+, and Ba2+ sorption on chloride –illite mixed
clay”, Radiochim. Acta, Vol. 88, pp.681-686 .
Sheta A.S., Falatah, A.M., Al-Sewailem, M.s., Khaled, E.M., Salam, A.S.H.
2003. “Sorption characteristics of zinc and iron by natural zeolinite and bentonite”,
Microporous and Mesoporous Materials, Vol. 61, pp.127-136.
Singh, S.P., Ma, L.Q. and Harris, W.G. 2001. “Heavy metal interactions with
phosphatic clay”, JEO, Vol. 30, pp.1961-1968.
Sipos, P., Nemeth, T., Mohai, I., Dodony, I. 2004. “Effect of soil composition on
adsorption of lead as reflected by a study on a natural forest soil profile”, Geoderma,
Vol. 124, pp.363-374.
Skoog, D.A., and West, D.M., 1971. Principles of instrumental analysis ,
(Hardcover, NewYork), p.549.
Smyth, J.R., Ahrens, T.J., 1997. “The crystal structure of calcite III”,
Geophysical Research Letters, Vol. 24, pp.1595-1598.
Stumm, W., and Morgan, J.J. 1996. Aquatic Chemistry, (John Wiley& Sons,
New York, USA), p.296.
Sverjensky, D.A. and Molling, P.A. 1992. “A linear free energy relationship for
crystalline solids and aqueous ions.”, Nature, Vol. 356, pp. 231–234.
Tanaka, H., Yamasaki, N., Muratani, M., Hino, R., 2003 “Structure and
formation process of (K,Na)- clinoptilolite”, Material Research Bulletin”, Vol.38, pp.
713-722 .
Top, A. 2001. Cation Exchange (Ag+, Zn+2, Cu+2) behaviour of natural zeolites,
MSc Thesis, IYTE, İzmir, pp.23-24
Trgo, M., and Peric, J., 2003. “Interaction of the zeolitic tuff with zinc
containing simulated pollutant solutions”, Journal of Colloid and Interface Science,
Vol. 260, pp.1656-175.
Van Olphen, H., 1977. An Introduction to Clay Colloid Chemistry, 2nd ed.;
(Wiley, New York,), p.59.

90
Wang, Y., Xu, H., 2001. “Prediction of trace metal partitioning between minerals
and aqueous solutions: a linear free energy correlation approach”, Geochim.
Cosmochim. Acta , Vol. 65, pp.1529-1543.
Wenming, D., Zhijun, G., Jinzhou, D., Liying, Z., Zuyi, T., 2001. “Sorption
characteristic of zinc(II) by calcareous soil radiotracer study”, Applied Radiation and
Isotopes, Vol. 54, pp. 371-375.
Wilson, M.J. 1994. Clay Mineralogy: Spectroscopic and Chemical
Determinative Methods. (Chapman& Hall, New York,), pp.52-55.
Xu N., Hochella, M.F., Brown, G.E., Parks G.A., Parks, J. 1996. “Co(II)
sorption at the calcite-water interface: X-ray photoelectron spectroscopic study”,
Geochimica et Cosmochimica Acta , Vol. 60, pp.2801-2815
Yariv, S., Cross H. 2002. Organo Clay Complexes and Interactions, (Marcel
Dekker, Inc, Newyork-Basel), pp.2-9
Yu, B., Zhang, Y., Shukla, A.S., Dorris, S., and K., 2001. “The removal of
heavy metals from aqueous solutions by sawdust adsorption removal of lead and
comparison of its adsorption with copper”, Journal of Hazardous Materials, Vol. 84,
pp.83-94.
Zachara, J.M., Cowan, C.e. and Resch, C.T. 1991 “ Sorption of divalent metals
on calcite”, Geochimica et Cosmochimica Acta, Vol. 55 , pp.1549-1562.
Zhang, S., Fortier, H., and Dahn, J., 2004. “Characterization of zinc carbonate
hydroxides synthesized by precipitation from zinc acetate and potassium carbonate
solutions”, Mater. Res. Bullet., Vol. 39, pp. 1939-1948
WEB_1, 2002. TMMOB, 05.04.2004. http://www.maden.org.tr/yeni3/
english/mining sector in Turkey.pdf
WEB_2, 1996. Mouter River Co, 10.02.2004. http://www.moutere.com
WEB_3, 2004. Chemsoc, 01.01.2005. http://www.rsc.org.pdf
WEB_4, 1996. University of Melbourne. http://www.ph.unimelb.edu.au. htm
WEB_5, 2002. Nunnauuni, 10.01.2005. http://www.nunnauuni.com/english
/soapstone /rakenneosat.html
WEB_6, 1996. Science Hypermedia Home Page, 08.03.2003. http://elchem.
kaist .ac.kr/vt/ chem-ed/spec/ atomic/aa.htm
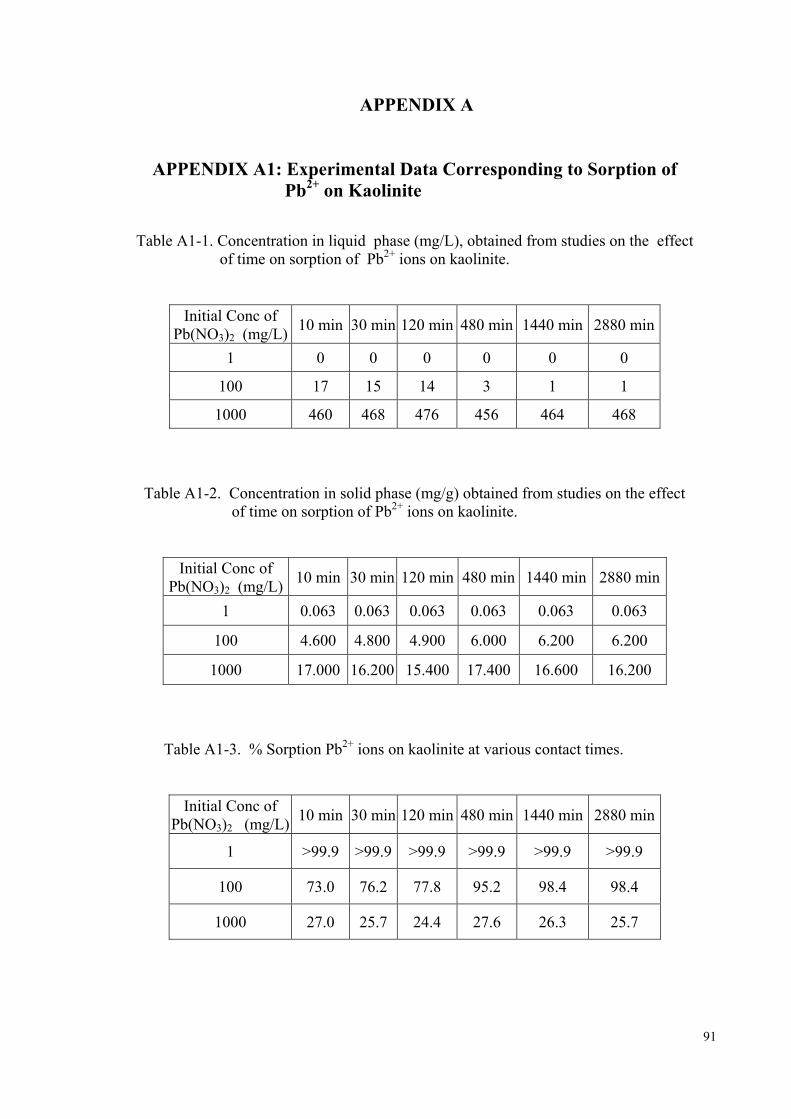
91
APPENDIX A
APPENDIX A1: Experimental Data Corresponding to Sorption of Pb2+ on Kaolinite Table A1-1. Concentration in liquid phase (mg/L), obtained from studies on the effect
of time on sorption of Pb2+ ions on kaolinite.
Initial Conc of Pb(NO3)2 (mg/L) 10 min 30 min 120 min 480 min 1440 min 2880 min
1 0 0 0 0 0 0
100 17 15 14 3 1 1
1000 460 468 476 456 464 468
Table A1-2. Concentration in solid phase (mg/g) obtained from studies on the effect of time on sorption of Pb2+ ions on kaolinite.
Initial Conc of
Pb(NO3)2 (mg/L) 10 min 30 min 120 min 480 min 1440 min 2880 min
1 0.063 0.063 0.063 0.063 0.063 0.063
100 4.600 4.800 4.900 6.000 6.200 6.200
1000 17.000 16.200 15.400 17.400 16.600 16.200
Table A1-3. % Sorption Pb2+ ions on kaolinite at various contact times.
Initial Conc of
Pb(NO3)2 (mg/L) 10 min 30 min 120 min 480 min 1440 min 2880 min
1 >99.9 >99.9 >99.9 >99.9 >99.9 >99.9
100 73.0 76.2 77.8 95.2 98.4 98.4
1000 27.0 25.7 24.4 27.6 26.3 25.7

92
APPENDIX A2: Experimental Data Corresponding to Sorption of Zn2+ on Kaolinite
Table A2-1. Concentration in liquid phase (mg/L) obtained from studies on the effect of time on sorption of Zn2+ ions on kaolinite
Initial Conc. of Zn(NO3)2.6H2
O (mg/L) 10 min 30 min 120 min 480 min 1440 min 2880 min
1 0 0 0 0 0 0
100 14 13 11 9 5 3
1000 118 116 122 118 108 104
Table A2-2. Concentration in solid phase (mg/g) obtained from studies on the effect of time on sorption of Zn2+ions on kaolinite
Table A2-3. % Sorption Zn2+ ions on kaolinite at various contact times.
Initial Conc. of Zn(NO3)2.6H2O
(mg/L) 10 min 30 min 120 min 480 min 1440 min 2880 min
1 0.022 0.022 0.022 0.022 0.022 0.022
100 0.800 0.900 1.100 1.300 1.700 1.900
1000 10.200 10.400 9.800 10.200 11.200 11.600
Initial Conc. of Zn(NO3)2.6H2O
(mg/L) 10 min 30 min 120 min 480 min 1440 min 2880 min
1 >99.9 >99.9 >99.9 >99.9 >99.9 >99.9
100 36.4 40.9 50.0 59.1 77.3 86.4
1000 46.4 47.3 44.5 46.4 50.9 52.7

93
APPENDIX B
APPENDIX B1: Experimental Data Corresponding to Sorption of
Pb2+ on Clinoptilolite Table B1-1. Concentration in liquid phase (mg/L), obtained from studies on the effect
of time on sorption of Pb2+ions on clinoptilolite
Initial Conc of Pb(NO3)2 (mg/L)
10 min 30 min 120 min 480 min 1440 min 2880 min
1 0 0 0 0 0 0
100 0.2 0 0.1 1.4 0.3 0
1000 276 244 236 181 120 96
Table B1-2. Concentration in solid phase (mg/g) obtained from studies on the effect of
time on sorption of Pb2+ ions on clinoptilolite
Initial Conc of Pb(NO3)2 (mg/L) 10 min 30 min 120 min 480 min 1440 min 2880 min
1 0.063 0.063 0.063 0.063 0.063 0.063
100 6.280 6.300 6.290 6.160 6.270 6.300
1000 35.400 38.600 39.400 44.900 51.000 53.400
Table B1-3. % Sorption Pb2+ ions on clinoptilolite at various contact times
Initial Conc of Pb(NO3)2 (mg/L)
10 min 30 min 120 min 480 min 1440 min 2880 min
1 >99.9 >99.9 >99.9 >99.9 >99.9 >99.9
100 99.7 100.0 99.8 97.8 99.5 100.0
1000 56.2 61.3 62.5 71.3 81.0 84.8
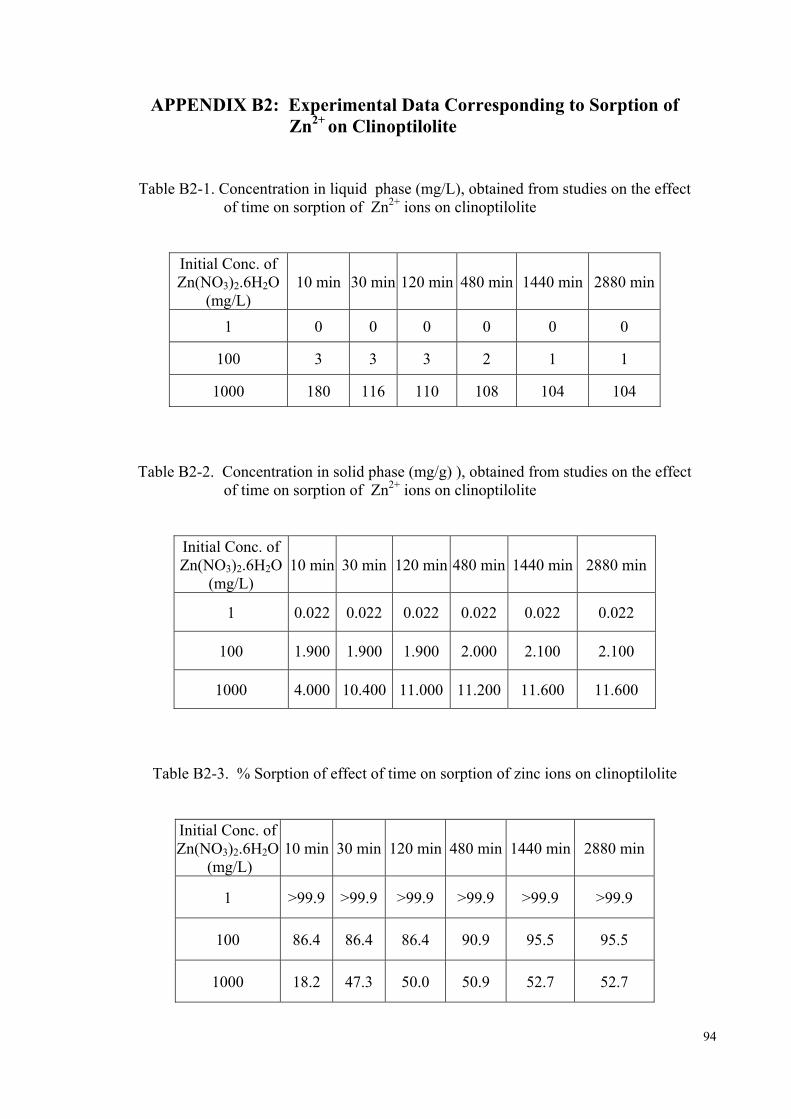
94
APPENDIX B2: Experimental Data Corresponding to Sorption of Zn2+ on Clinoptilolite
Table B2-1. Concentration in liquid phase (mg/L), obtained from studies on the effect
of time on sorption of Zn2+ ions on clinoptilolite
Initial Conc. of Zn(NO3)2.6H2O
(mg/L) 10 min 30 min 120 min 480 min 1440 min 2880 min
1 0 0 0 0 0 0
100 3 3 3 2 1 1
1000 180 116 110 108 104 104 Table B2-2. Concentration in solid phase (mg/g) ), obtained from studies on the effect
of time on sorption of Zn2+ ions on clinoptilolite
Initial Conc. of Zn(NO3)2.6H2O
(mg/L) 10 min 30 min 120 min 480 min 1440 min 2880 min
1 0.022 0.022 0.022 0.022 0.022 0.022
100 1.900 1.900 1.900 2.000 2.100 2.100
1000 4.000 10.400 11.000 11.200 11.600 11.600
Table B2-3. % Sorption of effect of time on sorption of zinc ions on clinoptilolite
Initial Conc. of Zn(NO3)2.6H2O
(mg/L) 10 min 30 min 120 min 480 min 1440 min 2880 min
1 >99.9 >99.9 >99.9 >99.9 >99.9 >99.9
100 86.4 86.4 86.4 90.9 95.5 95.5
1000 18.2 47.3 50.0 50.9 52.7 52.7
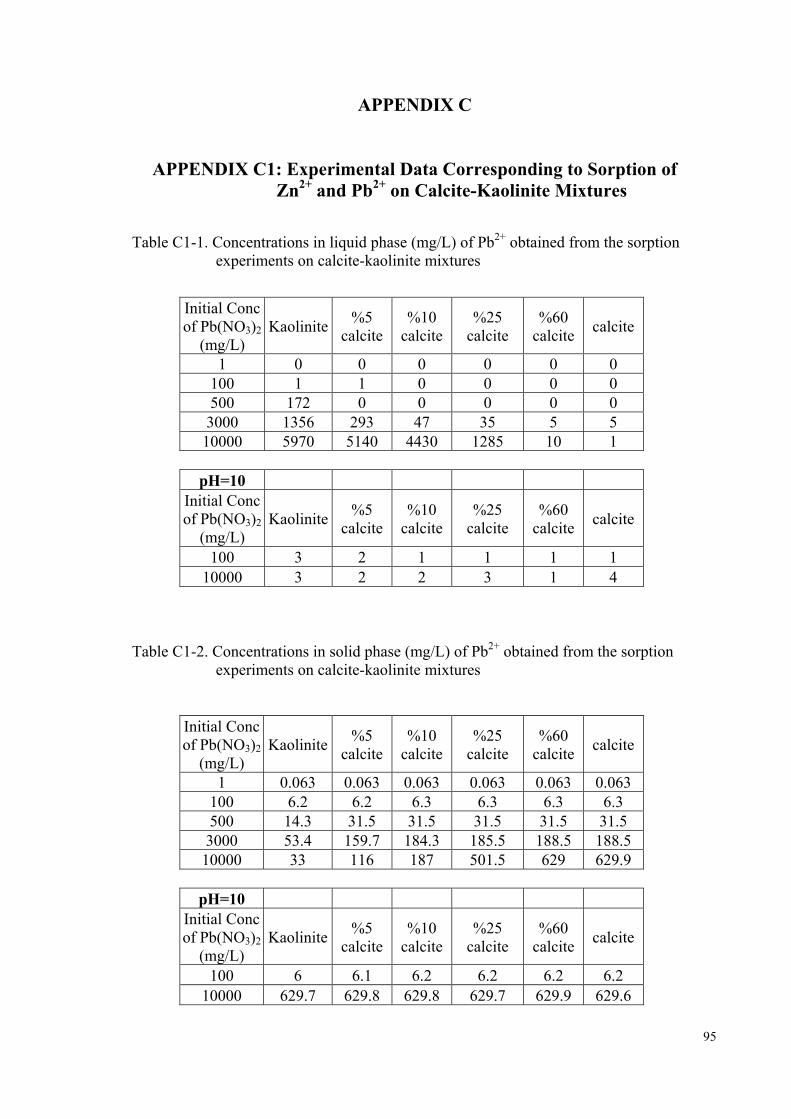
95
APPENDIX C
APPENDIX C1: Experimental Data Corresponding to Sorption of Zn2+ and Pb2+ on Calcite-Kaolinite Mixtures
Table C1-1. Concentrations in liquid phase (mg/L) of Pb2+ obtained from the sorption experiments on calcite-kaolinite mixtures
Initial Conc of Pb(NO3)2
(mg/L) Kaolinite %5
calcite %10
calcite %25
calcite %60
calcite calcite
1 0 0 0 0 0 0 100 1 1 0 0 0 0 500 172 0 0 0 0 0 3000 1356 293 47 35 5 5 10000 5970 5140 4430 1285 10 1
pH=10
Initial Conc of Pb(NO3)2
(mg/L) Kaolinite %5
calcite %10
calcite %25
calcite %60
calcite calcite
100 3 2 1 1 1 1 10000 3 2 2 3 1 4
Table C1-2. Concentrations in solid phase (mg/L) of Pb2+ obtained from the sorption experiments on calcite-kaolinite mixtures
Initial Conc of Pb(NO3)2
(mg/L) Kaolinite %5
calcite %10
calcite %25
calcite %60
calcite calcite
1 0.063 0.063 0.063 0.063 0.063 0.063 100 6.2 6.2 6.3 6.3 6.3 6.3 500 14.3 31.5 31.5 31.5 31.5 31.5 3000 53.4 159.7 184.3 185.5 188.5 188.5 10000 33 116 187 501.5 629 629.9
pH=10
Initial Conc of Pb(NO3)2
(mg/L) Kaolinite %5
calcite %10
calcite %25
calcite %60
calcite calcite
100 6 6.1 6.2 6.2 6.2 6.2 10000 629.7 629.8 629.8 629.7 629.9 629.6

96
Table C1-3. % Sorption of Pb2+ on calcite-kaolinite mixtures
Initial Conc of Pb(NO3)2
(mg/L) Kaolinite %5
calcite %10
calcite %25
calcite %60
calcite calcite
1 >99.9 >99.9 >99.9 >99.9 >99.9 >99.9
100 98.4 98.4 >99.9 >99.9 >99.9 >99.9
500 45.4 >99.9 >99.9 >99.9 >99.9 >99.9
3000 28.3 84.5 97.5 98.1 99.7 99.7
10000 5.2 18.4 29.7 79.6 99.8 100.0
pH=10 Initial Conc of Pb(NO3)2
(mg/L) Kaolinite %5
calcite %10
calcite %25
calcite %60
calcite calcite
100 95.2 96.8 98.4 98.4 98.4 98.4
10000 >99.9 >99.9 >99.9 >99.9 >99.9 99.9
Table C1-4. Concentrations in liquid phase (mg/L) of Zn2+obtained from the sorption experiments on calcite-kaolinite mixtures
Initial Conc of Zn(NO3)2.6H2O
(mg/L) Kaolinite %5
calcite %10
calcite %25
calcite %60
calcite calcite
1 0 0 0 0 0 0
100 3 0 0 0 0 0
500 70 44 25 7 3 4
3000 450 343 360 323 134 75
10000 1990 1977 1960 1385 1275 625
pH=10 Initial Conc
Zn(NO3)2.6H2O (mg/L)
Kaolinite %5 calcite
%10 calcite
%25 calcite
%60 calcite calcite
100 1 4 1 2 1 0
10000 17 3 4 14 6 4

97
Table C1-5. Concentrations in solid phase (mg/L) of Zn2+ obtained from the sorption experiments on calcite-kaolinite mixtures
Initial Conc of Zn(NO3)2.6H2O
(mg/L) Kaolinite %5
calcite%10
calcite%25
calcite %60
calcite calcite
1 0.022 0.022 0.022 0.022 0.022 0.022 100 1.9 2.2 2.2 2.2 2.2 2.2 500 4 6.6 8.5 10.3 10.7 10.6 3000 21 31.7 30 33.7 52.6 58.5 10000 21 22.3 24 81.5 92.5 157.5
pH=10
Initial Conc Zn(NO3)2.6H2O
(mg/L) Kaolinite %5
calcite%10
calcite%25
calcite %60
calcite calcite
100 2.1 1.8 2.1 2 2.1 2.2 10000 218.3 219.7 219.6 218.6 219.4 219.6
Table C1-6. %Sorption of Zn2+ on calcite-kaolinite mixtures
Initial Conc of Zn(NO3)2.6H2O
(mg/L) Kaolinite %5
calcite%10
calcite%25
calcite %60
calcite calcite
1 >99.9 >99.9 >99.9 >99.9 >99.9 >99.9
100 86.4 >99.9 >99.9 >99.9 >99.9 >99.9
500 36.4 60.0 77.3 93.6 97.3 96.4
3000 31.8 48.0 45.5 51.1 79.7 88.6
10000 9.5 10.1 10.9 37.0 42.0 71.6
pH=10 Initial Conc
Zn(NO3)2.6H2O (mg/L)
Kaolinite %5 calcite
%10 calcite
%25 calcite
%60 calcite calcite
100 95.5 81.8 95.5 90.9 95.5 >99.9
10000 99.2 99.9 99.8 99.4 99.7 99.8

98
APPENDIX C2: Experimental Data Corresponding to Sorption of Zn2+
and Pb2+ on Calcite-Clinoptilolite Mixtures
Table C2-1. Concentrations in liquid phase (mg/L) of Pb2+ obtained from the sorption experiments on calcite-clinoptilolite mixtures
Initial Conc of Pb(NO3)2
(mg/L) Clino. %5
calcite %10
calcite %25
calcite %60
calcite calcite
1 0 0 0 0 0 0 100 0 0 0 0 0 0 500 4 1 1 0 1 0 3000 901 291 339 9 8 5 10000 5390 4550 3545 1660 2 0
pH=10 Initial Conc of Pb(NO3)2
(mg/L) Clino %5
calcite %10
calcite %25
calcite %60
calcite calcite
100 1 0 1 0 1 1 10000 210 2 8 0 1 4
Table C2-2. Concentrations in solid phase (mg/g) of Pb2+ obtained from the sorption experiments on calcite-clinoptilolite mixtures
Initial Conc of Pb(NO3)2
(mg/L) Clino %5
calcite %10
calcite %25
calcite %60
calcite calcite
1 0.063 0.063 0.063 0.063 0.063 0.063 100 6.3 6.3 6.3 6.3 6.3 6.3 500 31.1 31.4 31.4 31.5 31.4 31.5 3000 98.9 159.9 155.1 188.1 188.2 188.5 10000 91 175 275.5 464 629.8 630
pH=10
Initial Conc of Pb(NO3)2
(mg/L) Clino %5
calcite %10
calcite %25
calcite %60
calcite calcite
100 6.2 6.3 6.2 6.3 6.2 6.2 10000 609 629.8 629.2 630 629.9 629.6

99
Table C2-3. % Sorption of Pb2+ on calcite-clinoptilolite mixtures
Initial Conc of Pb(NO3)2
(mg/L) Clino %5 calcite %10 calcite %25 calcite %60 calcite calcite
1 >99.9 >99.9 >99.9 >99.9 >99.9 >99.9
100 >99.9 >99.9 >99.9 >99.9 >99.9 >99.9
500 98.7 99.7 99.7 >99.9 99.7 >99.9
3000 52.3 84,6 82.1 99.5 99.6 99.7
10000 14.4 27.8 43.7 73.7 >99.9 >99.9
pH=10 Initial Conc of
Pb(NO3)2 (mg/L)
Clino %5 calcite %10 calcite %25 calcite %60 calcite calcite
100 98.4 >99.9 98.4 >99.9 98.4 98.4 10000 96.7 >99.9 99.9 >99.9 >99.9 99.9
Table C2-4. Concentrations in liquid phase (mg/L) of Zn2+ obtained from the sorption experiments on calcite-clinoptilolite mixtures
Initial Conc of Zn(NO3)2.6H2
O (mg/L) Clino %5 calcite %10 calcite %25 calcite %60 calcite calcite
1 0 0 0 0 0 0 100 1 0 0 0 0 0 500 75 30 8 5 2 4 3000 509 629 339 254 90 75 10000 1870 1845 1460 730 710 625
pH=10 Initial Conc of Zn(NO3)2.6H2
O (mg/L) Clino %5 calcite %10 calcite %25 calcite %60 calcite calcite
100 0 0 1 0 0 0 10000 5 3 4 4 3 4

100
Table C2-5. Concentrations in solid phase (mg/g) of Zn2+ obtained from the sorption experiments on calcite-clinoptilolite mixtures
Initial Conc of Zn(NO3)2.6H2O
(mg/L) Clino %5
calcite %10
calcite %25
calcite %60
calcite calcite
1 0.022 0.022 0.022 0.022 0.022 0.022
100 2.1 2.2 2.2 2.2 2.2 2.2
500 3.5 8 10.2 10.5 10.8 10.6
3000 35.1 23.1 52.1 60.6 77 78.5
10000 33 35.5 74 147 149 157.5
pH=10 Initial Conc of
Zn(NO3)2.6H2O (mg/L)
Clino %5 calcite
%10 calcite
%25 calcite
%60 calcite calcite
100 2.2 2.2 2.1 2.2 2.2 2.2
10000 219.5 219.7 219.6 219.6 219.7 219.,6
Table C2-6. % Sorption of Zn2+on calcite-clinoptilolite mixtures
Initial Conc of Zn(NO3)2.6H2
O (mg/L) Clino %5
calcite %10
calcite %25
calcite %60
calcite calcite
1 >99.9 >99.9 >99.9 >99.9 >99.9 >99.9
100 95.5 >99.9 >99.9 >99.9 >99.9 >99.9
500 31.8 72.7 92.7 95.5 98.2 96.4
3000 22.9 4.7 48.6 61.5 86.4 88.6
10000 15.0 16.1 33.6 66.8 67.7 71.6
pH=10
Initial Conc of Zn(NO3)2.6H2
O (mg/L) Clino %5
calcite %10
calcite %25
calcite %60
calcite calcite
100 >99.9 >99.9 95,5 >99.9 >99.9 >99.9
10000 99.8 99.9 99.8 99.8 99.9 99.8

101
APPENDIX C3: Experimental Data Corresponding to Sorption of Pb2+ and Zn2+ on Magnesite-Kaolinite
Mixtures
Table C3-1. Concentrations in liquid phase (mg/L) of Pb2+ obtained from the sorption
experiments on magnesite-kaolinite.
Initial Conc of Pb(NO3)2
(mg/L) Kaolinite %5
magnesite%10
magnesite%25
magnesite%60
magnesite magnesite
1 0 0 0 0 0 0 100 1 0 0 0 0 0 500 172 0 0 0 0 0 3000 1356 294 11 6 2 0 10000 5970 4200 3040 1135 935 1
pH=10 Initial Conc of
Pb(NO3)2 (mg/L)
Kaolinite %5 magnesite
%10 magnesite
%25 magnesite
%60 magnesite magnesite
100 3 1 3 2 2 2 10000 3 1 2 1 3 1
Table C3-2. Concentrations in solid phase (mg/g) of Pb2+ obtained from the sorption experiments on magnesite-kaolinite. Initial Conc of Pb(NO3)2
(mg/L) Kaolinite %5
magnesite %10
magnesite%25
magnesite %60
magnesite magnesite
1 0.063 0.063 0.063 0.063 0.063 0.063 100 6.2 6.3 6.3 6.3 6.3 6.3 500 14.3 31.5 31.5 31.5 31.5 31.5 3000 53.4 159.6 187.9 188.4 188.8 189 10000 33 210 326 516.5 536.5 629.9
pH=10 Initial Conc of Pb(NO3)2
(mg/L) Kaolinite %5
magnesite %10
magnesite%25
magnesite %60
magnesite magnesite
100 6 6.2 6 6.1 6.1 6.1 10000 629.7 629.9 629.8 629.9 629.7 629.9

102
Table C3-3. % Sorption of Pb2+ on magnesite-kaolinite mixtures
Initial Conc of Pb(NO3)2 (mg/L)
Kaolinite %5 magnesite
%10 magnesite
%25 magnesite
%60 magnesite magnesite
1 >99.9 >99.9 >99.9 >99.9 >99.9 >99.9
100 98.4 >99.9 >99.9 >99.9 >99.9 >99.9
500 45.4 >99.9 >99.9 >99.9 >99.9 >99.9
3000 28.3 84.4 99.4 99.7 99.9 >99.9
10000 5.2 33.3 51.7 82.0 85.2 >99.9
pH=10 Initial Conc of
Pb(NO3)2 (mg/L)
Kaolinite %5 magnesite
%10 magnesite
%25 magnesite
%60 magnesite magnesite
100 95.2 98.4 95.2 96.8 96.8 96.8
10000 >99.9 >99.9 >99.9 >99.9 >99.9 >99.9
Table C3-4. Concentrations in liquid phase (mg/L) of Zn2+ obtained from the sorption experiments on magnesite-kaolinite.
Initial Conc of Zn(NO3)2.6H2O
(mg/L) Kaolinite %5
magnesite %10
magnesite%25
magnesite%60
magnesite magnesite
1 0 0 0 0 0 0 100 0 0 0 0 0 0 500 70 40 3 0 0 0 3000 450 307 382 36 1 0 10000 1990 1815 1820 1645 546 29
pH=10
Initial Conc of Zn(NO3)2.6H2O
(mg/L) Kaolinite %5
magnesite %10
magnesite%25
magnesite%60
magnesite magnesite
100 1 1 2 3 2 1
10000 17 11 2 2 1 2

103
Table C3-5. Concentrations in solid phase (mg/g) of Zn2+ obtained from the sorption experiments on magnesite-kaolinite.
Initial Conc of Zn(NO3)2.6H2O
(mg/L) Kaolinite %5
magnesite%10
magnesite%25
magnesite %60
magnesite magnesite
1 0.022 0.022 0.022 0.022 0.022 0.022 100 2.2 2.2 2.2 2.2 2.2 2.2 500 4 7 10.7 11 11 11 3000 21 35.3 27.8 62.4 65.9 66 10000 21 38.5 38 55.5 165.4 217.1
pH=10 Initial Conc of
Zn(NO3)2.6H2O (mg/L)
Kaolinite %5 magnesite
%10 magnesite
%25 magnesite
%60 magnesite magnesite
100 2.1 2.1 2 1.9 2 2.1 10000 218.3 218.9 219.8 219.8 219.9 219.8
Table C3-6. % Sorption of Zn2+ on magnesite-kaolinite mixtures
Initial Conc of Zn(NO3)2.6H2O
(mg/L) Kaolinite %5
magnesite %10
magnesite %25
magnesite %60
magnesite magnesite
1 >99.9 >99.9 >99.9 >99.9 >99.9 >99.9
100 >99.9 >99.9 >99.9 >99.9 >99.9 >99.9
500 36.4 63.6 97.3 >99.9 >99.9 >99.9
3000 31.8 53.5 42.1 94.5 99.8 >99.9
10000 9.5 17.5 17.3 25.2 75.2 98.7
pH=10 Initial Conc of
Zn(NO3)2.6H2O (mg/L)
Kaolinite %5 magnesite
%10 magnesite
%25 magnesite
%60 magnesite magnesite
100 95.5 95.5 90.9 86.4 90.9 95.5
10000 99.2 99.5 99.9 99.9 >99.9 99.9

104
APPENDIX C4: Experimental Data Corresponding to Sorption of Pb2+
and Zn2+ on Magnesite-Clinoptilolite Mixtures
Table C4-1. Concentrations in liquid phase (mg/L) of Pb2+ obtained from the sorption experiments on magnesite-clinoptilolite.
Initial Conc of Pb(NO3)2
(mg/L) Clino %5
magnesite %10
magnesite %25
magnesite %60
magnesite magnesite
1 0 0 0 0 0 0 100 0 0 0 0 0 0 500 4 1 1 1 1 0 3000 901 264 10 3 1 0 10000 5390 4190 2280 445 4 1
pH=10 Initial Conc of Pb(NO3)2
(mg/L) Clino %5
magnesite %10
magnesite %25
magnesite %60
magnesite magnesite
100 3 1 1 3 2 3 10000 3 1 3 1 1 1
Table C4-2. Concentrations in solid phase (mg/g) of Pb2+obtained from the sorption experiments on magnesite-clinoptilolite
Initial Conc of Pb(NO3)2
(mg/L) Clino %5
magnesite %10
magnesite %25
magnesite %60
magnesite magnesite
1 0.063 0.063 0.063 0.063 0.063 0.063 100 6.3 6.3 6.3 6.3 6.3 6.3 500 31.1 31.4 31.4 31.4 31.4 31.5
3000 98.9 162.6 188 188.7 188.9 189 10000 91 211 402 585.5 629.6 629.9
pH=10
Initial Conc of Pb(NO3)2
(mg/L) Clino %5
magnesite %10
magnesite %25
magnesite %60
magnesite magnesite
100 6 6.2 6.2 6 6.1 6 10000 629.7 629.9 629.7 629.9 629.9 629.9
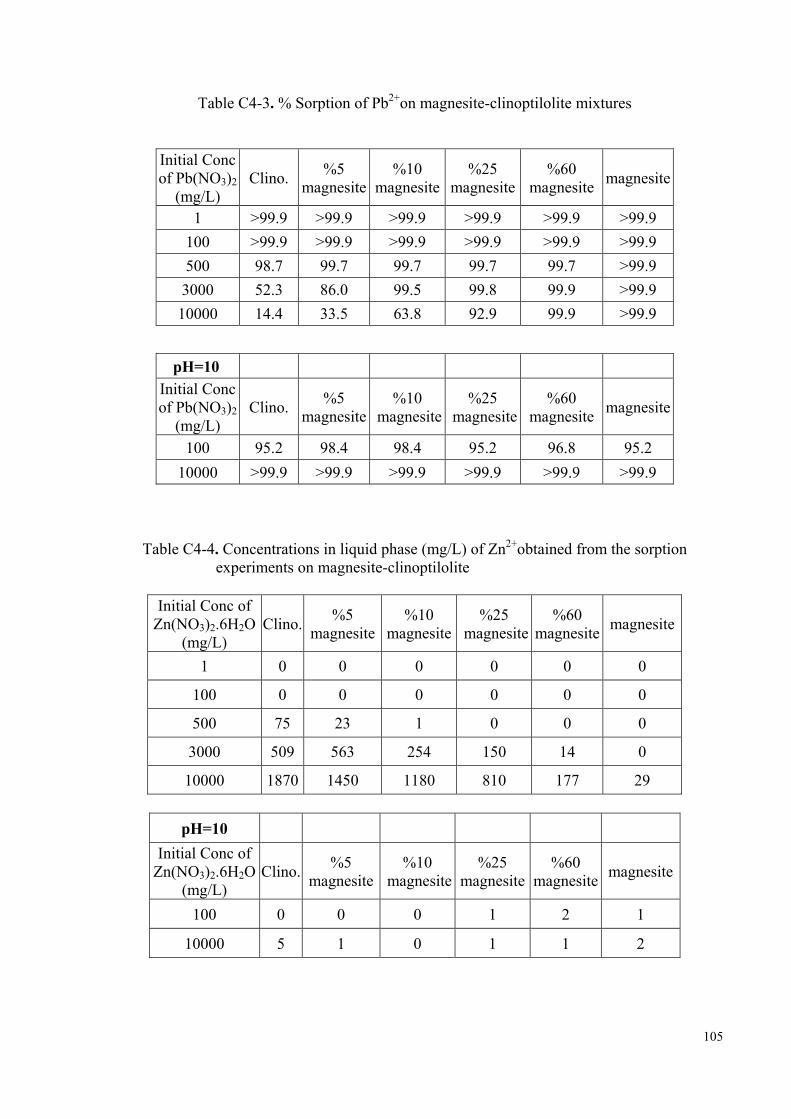
105
Table C4-3. % Sorption of Pb2+on magnesite-clinoptilolite mixtures
Initial Conc of Pb(NO3)2
(mg/L) Clino. %5
magnesite%10
magnesite%25
magnesite%60
magnesite magnesite
1 >99.9 >99.9 >99.9 >99.9 >99.9 >99.9 100 >99.9 >99.9 >99.9 >99.9 >99.9 >99.9 500 98.7 99.7 99.7 99.7 99.7 >99.9 3000 52.3 86.0 99.5 99.8 99.9 >99.9 10000 14.4 33.5 63.8 92.9 99.9 >99.9
pH=10 Initial Conc of Pb(NO3)2
(mg/L) Clino. %5
magnesite%10
magnesite%25
magnesite%60
magnesite magnesite
100 95.2 98.4 98.4 95.2 96.8 95.2 10000 >99.9 >99.9 >99.9 >99.9 >99.9 >99.9
Table C4-4. Concentrations in liquid phase (mg/L) of Zn2+obtained from the sorption experiments on magnesite-clinoptilolite
Initial Conc of Zn(NO3)2.6H2O
(mg/L) Clino. %5
magnesite%10
magnesite%25
magnesite%60
magnesite magnesite
1 0 0 0 0 0 0
100 0 0 0 0 0 0
500 75 23 1 0 0 0
3000 509 563 254 150 14 0
10000 1870 1450 1180 810 177 29
pH=10 Initial Conc of
Zn(NO3)2.6H2O (mg/L)
Clino. %5 magnesite
%10 magnesite
%25 magnesite
%60 magnesite magnesite
100 0 0 0 1 2 1
10000 5 1 0 1 1 2

106
Table C4-5. Concentrations in solid phase (mg/g) of Zn2+obtained from the sorption experiments on magnesite-clinoptilolite.
Initial Conc of Zn(NO3)2.6H2O
(mg/L) Clino %5
magnesite%10
magnesite%25
magnesite%60
magnesite magnesite
1 0.022 0.022 0.022 0.022 0.022 0.022 100 2.2 2.2 2.2 2.2 2.2 2.2 500 3.5 8.7 10.9 11 11 11 3000 15.1 9.7 40.6 51 64.6 66 10000 33 75 102 139 202.3 217.1
pH=10
Initial Conc of Zn(NO3)2.6H2O
(mg/L) Clino %5
magnesite%10
magnesite%25
magnesite%60
magnesite magnesite
100 2.2 2.2 2.2 2.1 2 2.1 10000 219.5 219.9 220 219.9 219.9 219.8
Table C4-6. % Sorption of Zn2+ on magnesite-clinoptilolite mixtures
Initial Conc of Zn(NO3)2.6H2O
(mg/L) Clino %5
magnesite%10
magnesite%25
magnesite%60
magnesite magnesite
1 >99.9 >99.9 >99.9 >99.9 >99.9 >99.9 100 >99.9 >99.9 >99.9 >99.9 >99.9 >99.9 500 31.8 79.1 99.1 >99.9 >99.9 >99.9 3000 22.9 14.7 61.5 77.3 97.9 >99.9 10000 15.0 34.1 46.4 63.2 92.0 98.7
pH=10 Initial Conc of
Zn(NO3)2.6H2O (mg/L)
Clino %5 magnesite
%10 magnesite
%25 magnesite
%60 magnesite magnesite
100 >99.9 >99.9 >99.9 95.5 90.9 95.5
10000 99.8 >99.9 >99.9 >99.9 >99.9 99.9

107
APPENDIX D
APPENDIX D1: The pH Values Obtained From Sorption Data of Lead Ion
Pb-Kaolinite
Initial Conc of Pb(NO3)2
(mg/l) 10 min 30 min 120 min 480 min 1440 min 2880 min
1 6.86-7.01 6.76-7.01 6.49-7.73 6.80-7.10 6.49-7.73 7.73-7.96 100 5.28-5.77 5.35-5.78 5.41-6.00 5.06-6.77 5.28-7.02 5.41-6.66 1000 4.13-4.25 3.63-4.04 5.4-6.64 5.73-4.96 6.50-6.82 5.82-4.82
Pb-Clinoptilolite
Initial Conc of Pb(NO3)2
(mg/L) 10 min 30 min 120 min 480 min 1440 min 2880 min
1 8.8-8.0 9.02-7.8 8.68-8.06 8.50-8.33 9.15-8.52 8.68-7.96 100 6.42-6.83 6.81-7.07 6.47-7.31 6.66-7.67 5.66-7.83 6.48-7.91 1000 4.17-4.15 3.85-4.46 4.88-4.15 5.16-5.11 5.50-7.14 5.30-4.80
Pb-Mixtures
Calcite-Kaolinite
Initial Conc of Pb(NO3)2
(mg/L) Kaolinite %5
calcite %10
calcite %25
calcite %60
calcite calcite
1 7.73-7.96 9.36-8.91 9.36-8.92 9.38-8.96 9.40-9.20 9.32-9.39 100 6.5-7.06 6.00-7.03 5.81-6.92 8.05-6.89 8.09-6.89 6.5-7.06 500 5.27-5.88 5.67-7.92 5.50-7.91 5.42-7.96 5.42-7.96 5.35-8.06
3000 4.77-5.35 5.7-6.20 5.53-6.25 5.08-7.62 4.91-7.79 4.84-7.75 10000 4.13-4.71 5.57-4.35 5.32-4.65 4.96-4.12 4.48-4.35 4.29-6.69 pH=10
Initial Conc of Pb(NO3)2
(mg/L) Kaolinite %5
calcite %10
calcite %25
calcite %60
calcite calcite
100 10.53 9.52 10.5 10.09 9.76 10.45 10000 9.88 10.08 10,86 11.00 11.08 11.02

108
Magnesite-Kaolinite
Initial Conc of Pb(NO3)2
(mg/L) Kaolinite %5
magnesite%10
magnesite%25
magnesite%60
magnesite magnesite 1 7.73-7.960 9.56-9.18 9.33-9.45 9.78-9.38 9.73-9.67 9.93-9.84
100 6.5-7.06 6.53-8.53 6.61-8.19 8.21-8.79 9.14-9.4 9.61-9.33 500 5.27-5.88 5.34-9.34 5.24-9.47 5.28-9.42 5.23-9.58 5.28-9.55 3000 4.77-5.35 5.0-5.58 5.00-6.62 4.92-8.65 4.90-8.88 4.90-9.00 10000 4.13-4.71 4.23-4.55 3.96-4.59 3.96-4.96 3.97-5.05 4.05-7.65 pH=10
Initial Conc of Pb(NO3)2
(mg/L) Kaolinite %5
magnesite%10
magnesite%25
magnesite%60
magnesite magnesite 100 10.53 9.75 9.73 9.99 10.04 10.07
10000 9.88 10.64 10.62 10.45 10.39 9.37
Calcite-Clinoptilolite Initial Conc of Pb(NO3)2
(mg/L) Clino %5
calcite %10
calcite %25
calcite %60 calcite calcite 1 8.68-7.96 9.23-8.91 9.34-8.94 9.30-8.81 9.48-9.14 9.32-9.39
100 6.48-7.91 8.8-6.86 9.11-7.25 8.62-7.30 8.69-7.14 8.09-6.89 500 6.32-7.55 6.56-8.30 6.56-8.37 6.32-8.39 6.34-8.49 5.35-8.06 3000 4.04-4.96 4.00-5.55 4.38-5.12 4.49-5.92 4.79-7.09 4.84-7.75 10000 3.91-4.36 4.05-4.65 4.10-4.81 4.14-5.03 4.02-7.07 4.48-4.35 pH=10
Initial Conc of Pb(NO3)2
(mg/L) Clino %5
calcite %10
calcite %25
calcite %60 calcite calcite 100 9.39 9.46 9.16 9.49 9.78 8.75
10000 7.86 10.72 10.91 10.96 10.90 11.02
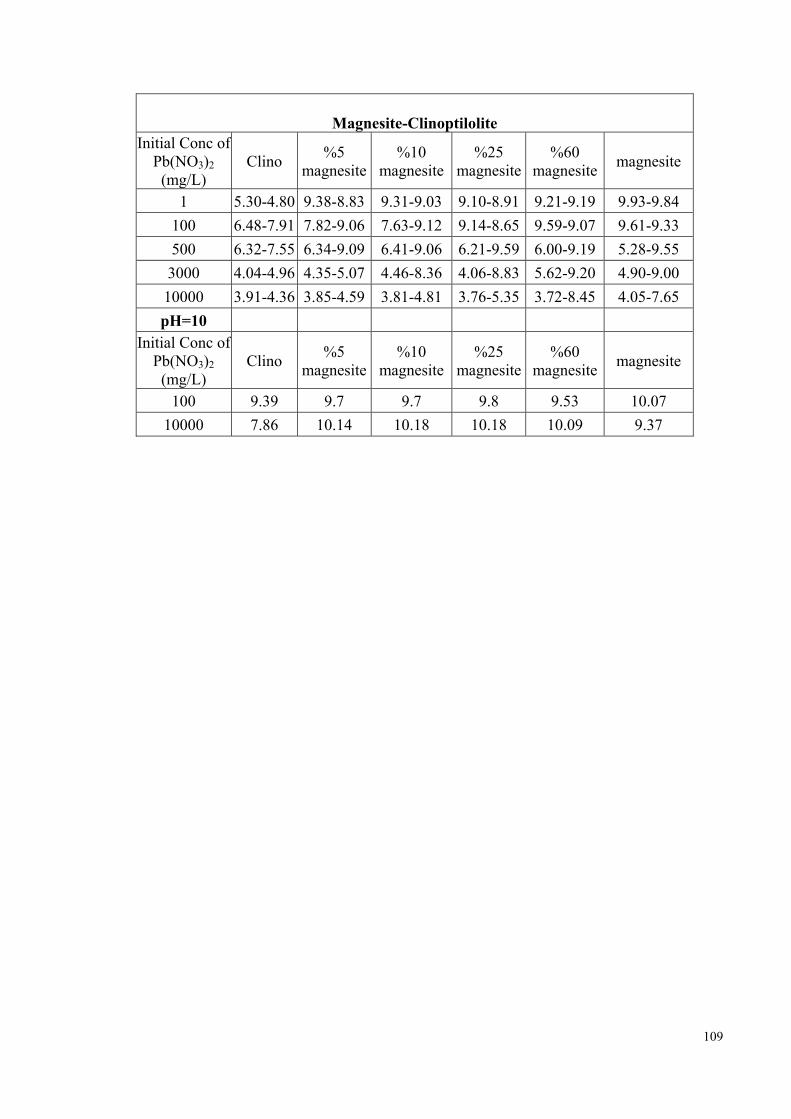
109
Magnesite-Clinoptilolite
Initial Conc of Pb(NO3)2
(mg/L) Clino %5
magnesite%10
magnesite%25
magnesite%60
magnesite magnesite
1 5.30-4.80 9.38-8.83 9.31-9.03 9.10-8.91 9.21-9.19 9.93-9.84 100 6.48-7.91 7.82-9.06 7.63-9.12 9.14-8.65 9.59-9.07 9.61-9.33 500 6.32-7.55 6.34-9.09 6.41-9.06 6.21-9.59 6.00-9.19 5.28-9.55 3000 4.04-4.96 4.35-5.07 4.46-8.36 4.06-8.83 5.62-9.20 4.90-9.00 10000 3.91-4.36 3.85-4.59 3.81-4.81 3.76-5.35 3.72-8.45 4.05-7.65 pH=10
Initial Conc of Pb(NO3)2
(mg/L) Clino %5
magnesite%10
magnesite%25
magnesite%60
magnesite magnesite
100 9.39 9.7 9.7 9.8 9.53 10.07 10000 7.86 10.14 10.18 10.18 10.09 9.37

110
APPENDIX D2: The pH Values Obtained From Sorption Data of Zinc Ion
Zn-Kaolinite Initial Conc of
Zn(NO3)2.6H2O (mg/L)
10 min 30 min 120 min 480 min 1440 min 2880 min
1 7.26-8.21 7.24-8.19 7.22-8.32 6.99-9.09 6.5-7.64 7.25-8.92 100 5.97-6.44 6.09-6.56 5.99-6.84 5.47-7.13 6.15-7.34 6.44-7.04 1000 4.64-5.19 5.28-5.63 5.28-5.52 5.76-5.88 5.84-6.84 5.30-4.80
Zn-Clinoptilolite Initial Conc of
Zn(NO3)2.6H2O (mg/L)
10 min 30 min 120 min 480 min 1440 min 2880 min
1 8.20-7.5 8.48-8.16 8.63-8.50 7.85-7.80 8.43-8.14 8.35-8.01 100 6.01-6.39 6.43-7.08 7.00-6.79 6.25-7.07 6.05-7.5 6.68-7.44 1000 4.84-5.43 5.10-5.92 6.29-5.73 6.44-6.04 6.02-6.90 5.94-6.75
Zn-Mixtures
Calcite -Kaolinite Initial Conc of
Zn(NO3)2.6H2O (mg/L) Kaolinite
%5 calcite
%10 calcite
%25 calcite
%60 calcite calcite
1 7.25-8.92 9.16-8.37 9.05-8.84 9.24-9.13 9.62-9.15 9.71-9.37 100 6.44-7.04 7.05-7.85 7.03-7.62 7.26-7.86 7.54-8.32 7.69-8.93 500 6.93-6.78 6.95-6.85 6.91-6.56 6.84-6.85 6.90-7.26 6.98-7.33 3000 6.48-6.79 5.92-5.94 6.00-6.01 6.13-6.32 6.26-6.46 6.3-6.46 10000 6.02-6.15 5.38-6.00 5.83-5.88 5.91-5.78 5.94-5.83 5.97-5.93 pH=10
Initial Conc of Zn(NO3)2.6H2O
(mg/L) Kaolinite %5
calcite %10
calcite %25
calcite %60
calcite calcite 100 10.29 10.1 9.45 9.84 9.92 8.08
10000 9.12 9.1 8.84 8.76 8.72 8.75
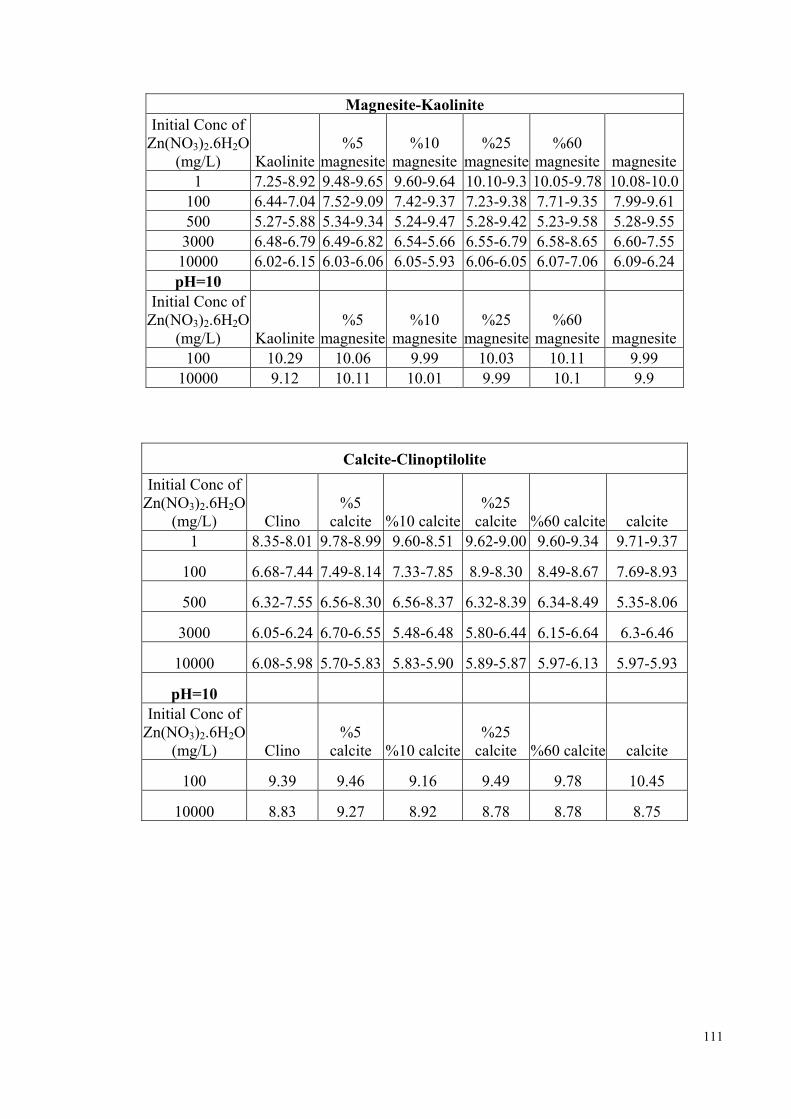
111
Magnesite-Kaolinite Initial Conc of
Zn(NO3)2.6H2O (mg/L) Kaolinite
%5 magnesite
%10 magnesite
%25 magnesite
%60 magnesite magnesite
1 7.25-8.92 9.48-9.65 9.60-9.64 10.10-9.3 10.05-9.78 10.08-10.0100 6.44-7.04 7.52-9.09 7.42-9.37 7.23-9.38 7.71-9.35 7.99-9.61 500 5.27-5.88 5.34-9.34 5.24-9.47 5.28-9.42 5.23-9.58 5.28-9.55 3000 6.48-6.79 6.49-6.82 6.54-5.66 6.55-6.79 6.58-8.65 6.60-7.55 10000 6.02-6.15 6.03-6.06 6.05-5.93 6.06-6.05 6.07-7.06 6.09-6.24 pH=10
Initial Conc of Zn(NO3)2.6H2O
(mg/L) Kaolinite %5
magnesite%10
magnesite%25
magnesite%60
magnesite magnesite100 10.29 10.06 9.99 10.03 10.11 9.99
10000 9.12 10.11 10.01 9.99 10.1 9.9
Calcite-Clinoptilolite Initial Conc of
Zn(NO3)2.6H2O (mg/L) Clino
%5 calcite %10 calcite
%25 calcite %60 calcite calcite
1 8.35-8.01 9.78-8.99 9.60-8.51 9.62-9.00 9.60-9.34 9.71-9.37
100 6.68-7.44 7.49-8.14 7.33-7.85 8.9-8.30 8.49-8.67 7.69-8.93
500 6.32-7.55 6.56-8.30 6.56-8.37 6.32-8.39 6.34-8.49 5.35-8.06
3000 6.05-6.24 6.70-6.55 5.48-6.48 5.80-6.44 6.15-6.64 6.3-6.46
10000 6.08-5.98 5.70-5.83 5.83-5.90 5.89-5.87 5.97-6.13 5.97-5.93
pH=10 Initial Conc of
Zn(NO3)2.6H2O (mg/L) Clino
%5 calcite %10 calcite
%25 calcite %60 calcite calcite
100 9.39 9.46 9.16 9.49 9.78 10.45
10000 8.83 9.27 8.92 8.78 8.78 8.75

112
Magnesite-Clinoptilolite
Initial Conc of Zn(NO3)2.6H2O
(mg/L) Clino %5
magnesite%10
magnesite%25
magnesite%60
magnesite magnesite
1 8.35-8.01 9.49-9.47 9.42-9.47 9.61-9.3 10.03-9.41 10.08-10.0
100 6.68-7.44 7.21-9.05 7.83-9.3 8.69-9.27 8.05-9.17 7.99-9.61
500 6.32-7.55 6.34-9.09 6.41-9.06 6.21-9.59 6.00-9.19 5.28-9.55
3000 6.05-6.24 6.36-6.34 6.36-6.63 6.34-8.25 6.32-8.29 6.60-7.55
10000 6.08-5.98 6.13-5.92 6.14-5.85 6.18-6.09 6.08-7.23 6.09-6.24
pH=10 Initial Conc of
Zn(NO3)2.6H2O (mg/L) Clino
%5 magnesite
%10 magnesite
%25 magnesite
%60 magnesite magnesite
100 9.69 9.87 9.7 9.72 9.57 9.99
10000 8.83 9.73 9.86 9.85 9.78 9.9
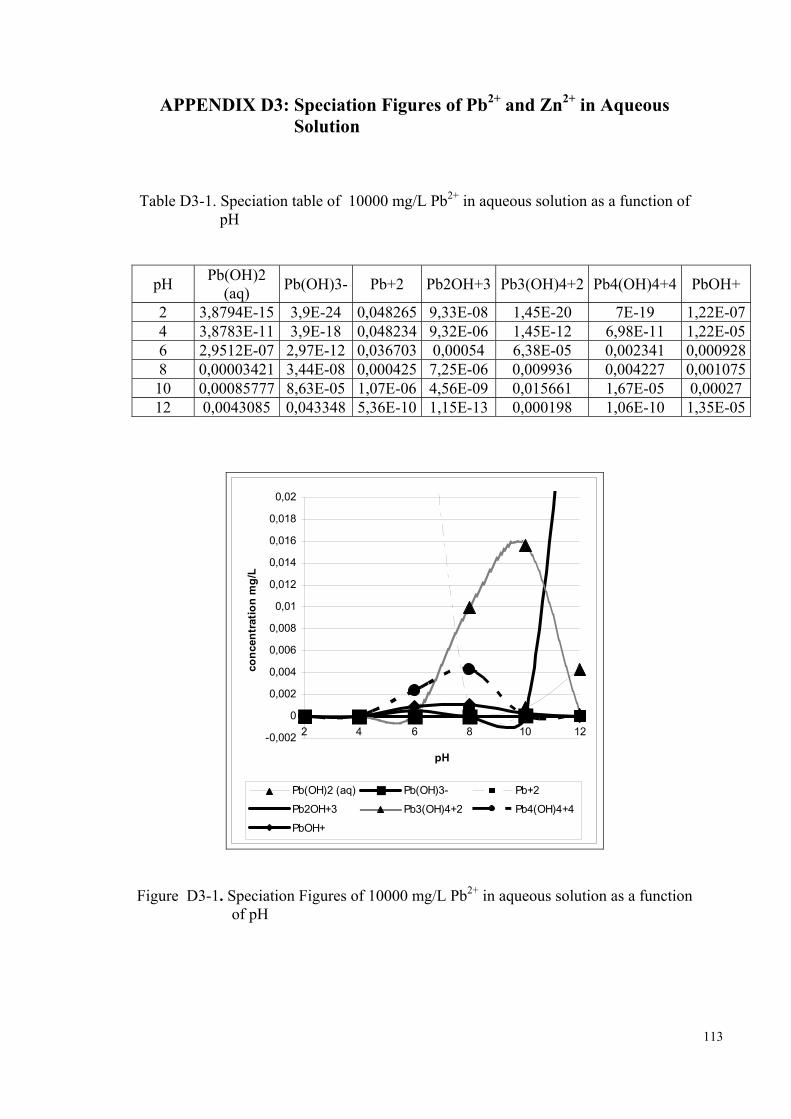
113
APPENDIX D3: Speciation Figures of Pb2+ and Zn2+ in Aqueous Solution
Table D3-1. Speciation table of 10000 mg/L Pb2+ in aqueous solution as a function of
pH
pH Pb(OH)2 (aq) Pb(OH)3- Pb+2 Pb2OH+3 Pb3(OH)4+2 Pb4(OH)4+4 PbOH+
2 3,8794E-15 3,9E-24 0,048265 9,33E-08 1,45E-20 7E-19 1,22E-074 3,8783E-11 3,9E-18 0,048234 9,32E-06 1,45E-12 6,98E-11 1,22E-056 2,9512E-07 2,97E-12 0,036703 0,00054 6,38E-05 0,002341 0,0009288 0,00003421 3,44E-08 0,000425 7,25E-06 0,009936 0,004227 0,00107510 0,00085777 8,63E-05 1,07E-06 4,56E-09 0,015661 1,67E-05 0,00027 12 0,0043085 0,043348 5,36E-10 1,15E-13 0,000198 1,06E-10 1,35E-05
-0,002
0
0,002
0,004
0,006
0,008
0,01
0,012
0,014
0,016
0,018
0,02
2 4 6 8 10 12
pH
conc
entr
atio
n m
g/L
Pb(OH)2 (aq) Pb(OH)3- Pb+2
Pb2OH+3 Pb3(OH)4+2 Pb4(OH)4+4
PbOH+
Figure D3-1. Speciation Figures of 10000 mg/L Pb2+ in aqueous solution as a function of pH

114
Table D3-2. Speciation table of 100 mg/L Pb2+ in aqueous solution as a function of pH
pH Pb(OH)2 (aq) Pb(OH)3- Pb+2 Pb2OH+3 Pb3(OH)4+2 Pb4(OH)4+4 PbOH+
2 3,89E-17 3,91E-26 0,000483 9,34E-12 1,45E-26 7,02E-27 1,22E-094 3,89E-13 3,91E-20 0,000483 9,33E-10 1,45E-18 7,01E-19 1,22E-076 3,79E-09 3,82E-14 0,000471 8,88E-08 1,35E-10 6,34E-11 1,19E-058 6,26E-06 6,31E-09 7,78E-05 2,42E-07 6,09E-05 4,73E-06 0,00019710 0,000153 1,54E-05 1,9E-07 1,45E-10 8,87E-05 1,68E-08 4,8E-05 12 4,36E-05 0,000439 5,41E-12 1,17E-17 2,05E-10 1,11E-18 1,37E-07
-0,0001
0
0,0001
0,0002
0,0003
0,0004
0,0005
0,0006
0 2 4 6 8 10 12 14
pH
Con
cent
ratio
n(m
g/L)
Pb(OH)2 (aq) Pb(OH)3- Pb+2Pb2OH+3 Pb3(OH)4+2 Pb4(OH)4+4PbOH+
Figure D3-2. Speciation figure of 100 mg/L Pb2+ in aqueous solution as a function of pH

115
Table D3-3. Speciation table of 10000 mg/L Zn2+ in aqueous solution as a function of pH
pH Zn(OH)2 (aq) Zn(OH)3- Zn(OH)4-2 Zn+2 Zn2OH+3 ZnOH+
2 1,94E-14 6,15E-24 9,78E-35 0,15298 2,35E-09 1,53E-084 1,94E-10 6,15E-18 9,79E-27 0,15297 2,35E-07 1,54E-066 1,94E-06 6,15E-12 9,77E-19 0,15277 2,34E-05 0,0001538 0,015494 4,92E-06 7,82E-11 0,12222 0,001499 0,01226410 0,14702 0,004666 7,42E-06 0,000116 1,35E-07 0,00116412 0,032701 0,10377 0,016504 2,58E-09 6,68E-15 2,59E-06
Figure D3-3. Speciation figure of 10000 mg/L Zn2+ in aqueous solution as a function
of pH
-0,02
0
0,02
0,04
0,06
0,08
0,1
0,12
0,14
0,16
0,18
0 2 4 6 8 10 12
pH
Co
nce
ntr
atio
n(m
g/L
)
Zn(OH)2 (aq) Zn(OH)3-Zn(OH)4-2 Zn+2Zn2OH+3 ZnOH+

116
Table D3-4. Speciation table of 100 mg/L Zn2+ in aqueous solution as a function of pH
-0,0002
0
0,0002
0,0004
0,0006
0,0008
0,001
0,0012
0,0014
0,0016
0 5 10 15pH
Con
cent
ratio
n(m
g/L)
Zn(OH)2 (aq) Zn(OH)3- Zn(OH)4-2Zn+2 Zn2OH+3 ZnOH+
Figure D3-4. Speciation figure of 100 mg/L Zn2+ in aqueous solution as a function of pH
pH Zn(OH)2 (aq) Zn(OH)3- Zn(OH)4-2 Zn+2 Zn2OH+3 ZnOH+ 2 1,95E-16 6,2E-26 9,88E-37 0,00153 2,354E-13 1,54E-104 1,95E-12 6,2E-20 9,89E-29 0,00153 2,3543E-11 1,54E-086 1,95E-08 6,2E-14 9,88E-21 0,001528 2,3496E-09 1,54E-068 0,000159 5,05E-08 8,05E-13 0,001245 1,5604E-07 0,00012510 0,00147 4,68E-05 7,46E-08 1,15E-06 1,3391E-11 1,16E-0512 0,000326 0,001038 0,000166 2,56E-11 6,5949E-19 2,58E-08