a methodology for automated pellet size distribution in a
TRANSCRIPT

A Methodology for Automated Pellet size Distribution
in a Pellet Mill
David James*, Mauro Innocente, John Cherry, David Carswell, Marc Holmes,
Steve Brown, Nick Lavery
College of Engineering, Swansea University, SA2 8PP, UK
Abstract
In this work the feasibility of pellet size distribution using images captured from the
operator’s sight glass of the moving pellet bed using a standard digital camera is
investigated. The pellet size distribution is determined using a bespoke circle
detection program which is able to fit circles to pellet edges, neural networks are
used to match predicted distributions to actual distributions and discrete element
modelling is used to create a large quantity of rendered images with known
distributions for network training. The results show that the circle detection
algorithm is able to find a high percentage of pellets in an image and find their
sizes. Neural networks are then able to use the predicted pellet size distributions to
give a good prediction of the actual distributions and are able to account for
segregation effects in the pellet beds. This demonstrates that an online pellet
sizing scheme is feasible in nickel pellet production.
1. Introduction
Nickel pellets are produced via the carbonyl process. Small seed pellets are added
to a reactor and grown to the required size before being removed. The behaviour
of the reactor is strongly dependent on the size distribution of the pellets within it.
The behaviour of the reactor can be controlled by adding pellets or purging pellets.
Currently these requirements are decided on by an operator who looks into the
pellet reactor through a viewing glass and then decides whether to add or purge
pellets based on experience. Clearly this is a less than ideal situation as the
operator is prone to factors such as illness or retirement. It is therefore desirable to
have a simple non-intrusive method to find the pellet size distribution of the bed at
any time. This can eventually be related to the seeding/ purging requirements. An
automated seeding/ purging system will lead to better process control and greater
efficiency. In this work the feasibility of using photographic images captured from
the operators sight glass to estimate the pellet size distribution in a pellet bed
(inside the reactor) is investigated. The recognition of features or shapes in images
is an important area of research and crosses over many scientific fields [1] [2].
KES Transactions on Sustainable Design and Manufacturing ISustainable Design and Manufacturing 2014 : pp.732-743 : Paper sdm14-108
InImpact: The Journal of Innovation Impact | ISSN 2051-6002 | http://www.inimpact.orgCopyright © 2014 Future Technology Press and the authors
732

Nickel pellet beds can be several pellets thick. The captured image will only show
the top of the bed. The pellet distribution of the image will not match the actual
distribution due to smaller pellets being hidden and segregating to the bottom of
the bed (see Figure 1). This is demonstrated from experiments using static piles of
pellets with known distributions. Nickel pellets are almost perfectly spherical in
shape. In a 2D photograph they appear circular. Therefore an image analysis
application has been developed to fit circles to the pellets that can be seen in the
image. Due to segregation of pellets the size distribution in the image will not
represent the true size distribution of the pellet bed [3]. The distribution will be
skewed towards larger pellet sizes as the smaller ones can move through gaps in
the bed and be hidden by the larger ones. Neural networks have been used to fit
the pellet size distribution detected by the circle detection algorithm from an image
to the actual distribution within the bed.
Figure 1 Only top layer of pellet bed seen by camera
Neural networks are a computer modelling technique based on the neural pathway
connections found in the brain. The network can ‘learn’ patterns and trends
between inputs and outputs within a data set and then be used to predict outputs
from data sets where the outputs are unknown [4]. A large quantity of data is
required to ‘train’ the neural. Generating such large data sets from physical
experiments is prohibitive. Neural networks require a broad range of input and
output parameters to be able to give a good general prediction. Pellets require
mixing and sieving to generate a sample of the pellet bed and to find the actual
size distribution which is time consuming. We have found that a maximum of three
samples could be made a day, whereas the neural network would require ~10000
A Methodology for Automated Pellet size Distribution in a Pellet MillDavid James, Mauro Innocente, John Cherry, Marc Holmes, Steve Brown, Nick Lavery
733

samples to give reasonable predictions. Therefore a method of generating virtual
samples using discrete element method DEM was investigated [5].
DEM with known pellet size distributions has been used to investigate whether
given enough experimental data if neural networks are an appropriate tool to find
the true pellet size distribution compared with the distribution given by the image
software. The results of the DEM model can be used to render almost photo-
realistic images of pellet locations. The circle finding algorithms can be used on the
virtual images and the distributions it predicts can be compared with the known
distributions.
Using the DEM simulations 10,000 data sets were generated with different pellet
distributions. From these DEM simulations images of the pellets were rendered
and the circle detecting application was applied to them. The distributions predicted
by the circle detecting application were used as the inputs of the networks and the
actual distributions as the outputs during training.
2. Image analysis
Several algorithms to detect circles in images have been investigated for this work,
such as the Circular Hough transform [6], but found to be not suitable for this
particular application. As such a bespoke image analysis application, written in
C++ and QT4, has been developed to fit circles to circular edges within images.
The application is able to fit to partial boundaries and can detect circles where part
of the edge is hidden. Figure 2 shows an image of a pile of coins with some hidden
edges. The red circles on the image show where the application has found a circle
[6]edge.
A Methodology for Automated Pellet size Distribution in a Pellet MillDavid James, Mauro Innocente, John Cherry, Marc Holmes, Steve Brown, Nick Lavery
734

Figure 2 Circle detection algorithm performed on pile of coins with some
hidden edges
The basic outline of how the application works is as follows:
1. The image is converted to greyscale
2. A Sobel filter is applied to the image. The Sobel filter approximates the
gradient of an image. At pellet edges the gradient is high.
3. Using the gradient information areas of gradient which are below a
threshold are discarded, leaving only the pellet edges.
4. Uniformly distributed circle centres are generated across the image.
5. From these centres circles grow by incrementally is radius approximately
one pixel at a time. The edges of the circles are then checked to see if any
portion of them is at the same location as a pellet edge. If they are close
the circle centre can move to try to get a better match.
6. The location of matching circle centres and their radius is stored and the
application moves onto the next circle growth routine.
7. If there are many matching circles of similar size these are averaged so
each match is only counted once.
The application returns a circle size distribution from the image. The application
has been applied to real images of nickel pellets. In general it finds the edges of
most of the pellets and fits a circle with the correct radius. This is shown in Figure 3
A Methodology for Automated Pellet size Distribution in a Pellet MillDavid James, Mauro Innocente, John Cherry, Marc Holmes, Steve Brown, Nick Lavery
735

Figure 3 Circle detection application on actual pellet images
3. Discrete element modeling and rendering
Discrete element modelling (DEM) is an explicit numerical technique where the
physical interactions between particles are modelled over a small time step first
implemented by Cundall and Strack [7]. In general DEM deals with spherical
particles and applies various frictions between them to deal with surface roughness
and irregular shapes. Since nickel pellets are relatively spherical in shape they
make an ideal case study for DEM work. DEM has previously been shown to give
good predictions of nickel pellet behaviour [8]. In a DEM simulation particle
boundaries are allowed to overlap slightly and the forces generated are calculated
based on the overlap and contact models. Accelerations and velocities can then be
calculated for the next time step. In this work a Hertz-Mindlin model is used for the
normal and shear forces [9] [10]. A leap frog integration scheme is used so pellet
positions and accelerations are calculated at time step tn and velocities at tn+1/2,
where n is an integer that indicates the current iteration.
In this work simulations of static piles of pellets were generated using the open
source DEM software YADE [11]. Spheres were generated randomly in a space
above a container before the simulation started. The simulation was then started
and the pellets allowed to fall into the container under gravity and settle. The
distribution of pellets sizes was Gaussian and divided into six bins spanning a
range of size values from 1mm to 14mm. The pellet distributions were generated
using a Latin hypercube method which ensures a good spread of data.
A Methodology for Automated Pellet size Distribution in a Pellet MillDavid James, Mauro Innocente, John Cherry, Marc Holmes, Steve Brown, Nick Lavery
736

Using open source rendering software (POVRAY) [12] almost photorealistic virtual
images can be generated as shown in Figure 4.
Figure 4 Image generated from a DEM simulation using POVRAY rendering
software
The virtual camera can be positioned to view any area of the scene. In order to
generate a training set of data for neural network analysis 10,000 images with
different particle distributions were generated from DEM simulations by having the
camera looking vertically down on the virtual pile of pellets. A typical image to be
analyzed is shown in Figure 5. Figure 4 shows a typical depth of pellets (note the
walls confining the pellets are set to be invisible in the rendering software).
Figure 5 Virtual image looking down on a static pile of virtual pellets
A Methodology for Automated Pellet size Distribution in a Pellet MillDavid James, Mauro Innocente, John Cherry, Marc Holmes, Steve Brown, Nick Lavery
737

Figure 6 shows the same image as Figure 5 after the circle detection algorithm has
been applied to it. In general it does a good job of locating the pellets and fitting
circles of the correct radius to them. The detected pellets are circled in red.
Figure 6 Circle finding algorithm performed on a virtual image (pellets are
circled by the application)
While these simulations are simple with further work DEM simulations should be
able to show a good representation of actual particle dynamics.
4. Neural network analysis
As mentioned in the introduction, the pellet distribution that can be seen from the
top surface is not the same as true distribution due to segregation effects. The
segregation will be dependent on the particle size distributions and not predictable.
Neural networks use weighted nodes with a bias and are capable of mapping
highly non-linear relationships between input and output parameters [4]. By
changing the weighting of the nodes and the bias during the training procedure
neural networks are able to pick out complicated patterns and trends within a data
set.
In this work the neural network analysis was conducted using the MATLAB neural
network package [13]. After studying different network architectures the network
was set up with a single hidden layer with nine nodes and was fully connected.
There were six different network inputs which correspond to the six pellet size bins.
The value entered is the ratio of the total number of pellets in each pellet bin (i.e.
sum of all bins = 1). The size bins (were based on the sieve sizes of the physical
experiment) and shown in the table below.
:
Bin 1 2 3 4 5 6
Sizes(mm) 1-4 4-6.3 6.3-8 8-10 10-11 11-14
A Methodology for Automated Pellet size Distribution in a Pellet MillDavid James, Mauro Innocente, John Cherry, Marc Holmes, Steve Brown, Nick Lavery
738

The network has six outputs which correspond to actual number of pellets in each
pellet bin. Tansig functions are used as the transfer function of the nodes in both
the hidden and output layers. The network architecture is shown in Figure 7.
Figure 7 Neural network architecture
For training the input data is divided into randomly three sets, 70% into a training
set, 15% into a validation set and 15% into a test set. For more information on
these sets the reader is referred to Haykins [4]. The network is trained using a
Levenberg-Marquardt back-propagation algorithm [14]. Training is stopped once
the mean square error of the validation set begins to increase, indicating over
fitting to the training set.
5. Results
Figure 8 shows the R2 plot of pellet distributions as predicted by the circle detection
application vs the actual distributions for all data sets. The R2 value of 0.080404
show that the predicted values of the pellet distribution are not matching the actual
values, as expected due to segregation. Figure 9 shows the R2 plot of all data sets
once the distributions predicted by the circle detection algorithm has been passed
through the trained neural network. The R2 value of 0.9885 shows that the outputs
of the distributions from the neural network and the actual distributions are well
correlated.
A Methodology for Automated Pellet size Distribution in a Pellet MillDavid James, Mauro Innocente, John Cherry, Marc Holmes, Steve Brown, Nick Lavery
739

Figure 8 R
2 of pellet distributions predicted by circle detection algorithm vs
actual distributions (number of pellets)
Figure 9 R2 of pellet distributions as predicted by neural networks from
circle detection algorithm inputs vs actual distributions (number of pellets)
Figure 10 shows plots of individual samples from the data set showing distribution
of pellets in each bin. The blue bars show the number predicted by the circle
A Methodology for Automated Pellet size Distribution in a Pellet MillDavid James, Mauro Innocente, John Cherry, Marc Holmes, Steve Brown, Nick Lavery
740
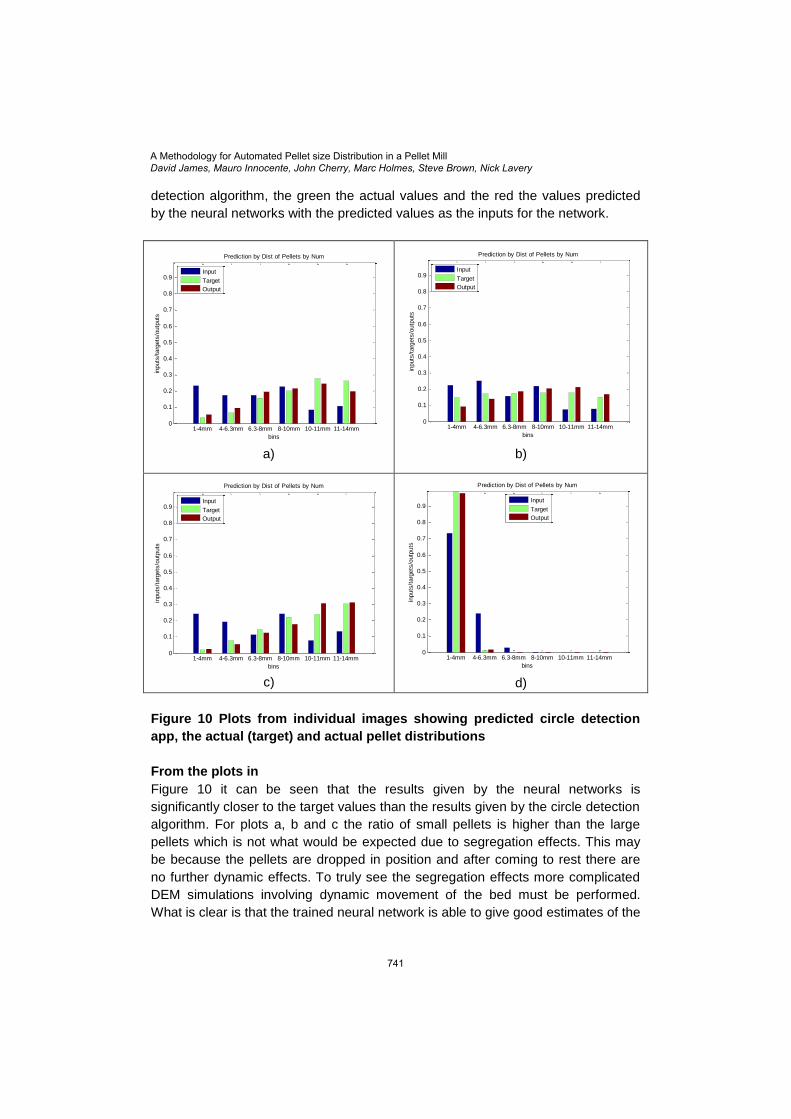
detection algorithm, the green the actual values and the red the values predicted
by the neural networks with the predicted values as the inputs for the network.
a)
b)
c)
d)
Figure 10 Plots from individual images showing predicted circle detection
app, the actual (target) and actual pellet distributions
From the plots in
Figure 10 it can be seen that the results given by the neural networks is
significantly closer to the target values than the results given by the circle detection
algorithm. For plots a, b and c the ratio of small pellets is higher than the large
pellets which is not what would be expected due to segregation effects. This may
be because the pellets are dropped in position and after coming to rest there are
no further dynamic effects. To truly see the segregation effects more complicated
DEM simulations involving dynamic movement of the bed must be performed.
What is clear is that the trained neural network is able to give good estimates of the
1-4mm 4-6.3mm 6.3-8mm 8-10mm 10-11mm 11-14mm0
50
100
150
200
250
300
350
400
450
500
bins
inputs
/targ
ets
/outp
uts
Prediction by Number Pellets
Input
Target
Output
1-4mm 4-6.3mm 6.3-8mm 8-10mm 10-11mm 11-14mm0
0.5
1
1.5
2
2.5
x 105
bins
inputs
/targ
ets
/outp
uts
Prediction by Volume Pellets
Input
Target
Output
1-4mm 4-6.3mm 6.3-8mm 8-10mm 10-11mm 11-14mm0
0.1
0.2
0.3
0.4
0.5
0.6
0.7
0.8
0.9
bins
inputs
/targ
ets
/outp
uts
Prediction by Dist of Pellets by Num
Input
Target
Output
1-4mm 4-6.3mm 6.3-8mm 8-10mm 10-11mm 11-14mm0
0.1
0.2
0.3
0.4
0.5
0.6
0.7
0.8
0.9
bins
inputs
/targ
ets
/outp
uts
Prediction by Dist of Pellets by Vol
Input
Target
Output
1-4mm 4-6.3mm 6.3-8mm 8-10mm 10-11mm 11-14mm0
2000
4000
6000
8000
10000
12000
bins
inputs
/targ
ets
/outp
uts
Prediction by Number Pellets
1-4mm 4-6.3mm 6.3-8mm 8-10mm 10-11mm 11-14mm0
0.5
1
1.5
2
2.5
x 105
bins
inputs
/targ
ets
/outp
uts
Prediction by Volume Pellets
Input
Target
Output
1-4mm 4-6.3mm 6.3-8mm 8-10mm 10-11mm 11-14mm0
0.1
0.2
0.3
0.4
0.5
0.6
0.7
0.8
0.9
bins
inputs
/targ
ets
/outp
uts
Prediction by Dist of Pellets by Num
1-4mm 4-6.3mm 6.3-8mm 8-10mm 10-11mm 11-14mm0
0.1
0.2
0.3
0.4
0.5
0.6
0.7
0.8
0.9
bins
inputs
/targ
ets
/outp
uts
Prediction by Dist of Pellets by Vol
Input
Target
Output
Input
Target
Output
Input
Target
Output
A Methodology for Automated Pellet size Distribution in a Pellet MillDavid James, Mauro Innocente, John Cherry, Marc Holmes, Steve Brown, Nick Lavery
741

actual pellet distributions based on the distributions found by the circle detection
application. There is a relationship between the actual distributions and those
found by the circle detection application which the neural network is able to find.
Unfortunately neural networks are a ‘black box’ technique so cannot be used to
find the statistical relationship.
6. Conclusions
In this paper an image analysis technique has been demonstrated to find the
edges of nickel pellets visible from a static image. The circle detection application
developed is able to find most pellets in the image, including partially hidden ones
and give a good estimate of their radius. Neural networks can be used as a method
to give a good prediction of the actual distributions when compared with those
predicted by the circle detection algorithm. The DEM modelling requires further
work to accurately describe the dynamics of a pellet bed, but shows good potential
and along with rendering techniques the images produced could be used to train
neural networks in the future. This work suggests that it would be feasible to have
an automated pellet sizing system on the sight glass of a pellet reactor.
Future work
There are several areas of further work which should be
Dynamic DEM simulations of pellets moving as they would in the reactor
so segregation effects can be seen clearly.
Neural networks with other inputs such as height of the bed (in this
simulation the height so of the static piles are approximately the same).
The height of the bed could have further impact on the segregation, i.e. a
deeper bed will result in greater segregation.
Acknowledgements
The work described in this paper was carried out as part of the Advanced
Sustainable Manufacturing Technologies (ASTUTE) project (ref. numb. 80380).
ASTUTE has been part-funded by the European Regional Development Fund
through the Welsh Government, and the authors would like to acknowledge this
funding.
The authors would also like to thank Vale Ltd for their help and support during the
work.
References
A Methodology for Automated Pellet size Distribution in a Pellet MillDavid James, Mauro Innocente, John Cherry, Marc Holmes, Steve Brown, Nick Lavery
742

7. Works Cited
[1] F. Nellros, M. J. Thurley, "Automated image analysis of iron-ore pellet
structure using optical microscopy," Image and Vision Computing, vol. 24, pp.
1525-1531, 2011.
[2] J. Calleja, O. Fuentes, "Machine learning anf iamge analysis for morphological
galaxy classification," Monthly Notices of the Royal Astronomical Society, vol.
349, no. 1, pp. 1025-1032, 2004.
[3] P.Moysey, V. Nadella, V.Rama Rao and M.Baird, "Size segregation of Nickel
Pellets Flowing into a Packed Bed," Canadian Journal of Chemical
Engineering, vol. 82, pp. 424-432, 2004.
[4] S. Haykin, Neural Networks: A Comprehensive Foundation, Prentice Hall,
1999.
[5] S. Luding, "Introduction to Discrete Element Methods," Discrete modelling of
geomaterials, vol. 12, pp. 785-826, 2008.
[6] P. Hough, "Method and means for recognizing complex patterns". US Patent
3069654, December 1963.
[7] P.A. Cundall, O.D.L. Strack, "A discrete numerical model for granular
assemblies," Geotechnique, vol. 29, pp. 47-65, 1979.
[8] P. Moysey, M. Baird, "Size segregation of spherical nickel pellets in the
surface flow of a packed bed:," Powder Technology, vol. 196, pp. 298-308,
2009.
[9] H. Hertz, "Über die Berührung fester elastischer Körper," J. reine und
angewandte Mathematik, vol. 92, pp. 156-171, 1882.
[10] R. D. Mindlin, "Compliance of Elastic Bodies in Contact," Journal of Applied
Mechanics, vol. 16, pp. 259-268, 1949.
[11] V. Šmilauer, E. Catalano, B. Chareyre, S. Dorofeenko, J. Duriez, A. Gladky, J.
Kozicki, C. Modenese, L. Scholtès, L. Sibille, J. Stránský, and K. Thoeni, Yade
Documentation, The Yade project: http://yade-dem.org/doc/., 2010.
[12] "Persistence of Vision (TM) Raytracer.," Persistence of Vision Pty. Ltd,
Williamstown, Victoria, Australia, http://www.povray.org/.
[13] "MATLAB, version 7.12," The Mathworks Inc, Massachusetts, 2011.
[14] P. J. Werbos, "Backpropagation through time: what it does and how to do it.,"
Proceedings of the IEEE, vol. 78, no. 10, pp. 1550-1560, 1990.
A Methodology for Automated Pellet size Distribution in a Pellet MillDavid James, Mauro Innocente, John Cherry, Marc Holmes, Steve Brown, Nick Lavery
743