a semi-automated tagging methodology for orthodox ...smc07.uoa.gr/smc07 proceedings/smc07 paper...
TRANSCRIPT

A semi-automated tagging methodology for Orthodox Ecclesiastic Chant Acoustic corpora
G. Chryssochoidis, D. Delviniotis and G. Kouroupetroglou University of Athens, Department of informatics and Telecommunications, Athens, Greece,
{G.Chrysochoidis, ddelvis, koupe}@di.uoa.gr
Abstract —This paper addresses the problem of using a semi automated process for tagging lyrics, notation and musical interval metadata of an Orthodox Ecclesiastic Chant (OEC) voice corpus. The recordings are post processed and segmented using the PRAAT software tool. Boundaries are placed, thus creating intervals where all tagging metadata will be embedded. The metadata are encoded and then inserted as labels in the segmented file. The methodology and processes involved in this tagging process are described along with its evaluation with the DAMASKINOS prototype Acoustic Corpus of Byzantine Ecclesiastic Chant Voices.
I. INTRODUCTION
The Orthodox Ecclesiastic Chant (OEC) or Byzantine Chant, as it is called, is the main music of the Eastern Orthodox Church. It has evolved over many centuries, since the era of the first Christian communities, into a music genre with special attributes, musicological, as well as acoustical ones.
Although musicologically, Orthodox Ecclesiastical Chant (OEC) has been systematically studied [1], its acoustical attributes have not been thoroughly examined [2][3][4][5]. The use of archival recordings, created under non-controlled recording conditions, is not suitable for analyzing acoustical properties and estimating the parameters used in phonetic modeling.
Thence the creation of a tagged corpus of OEC recordings, conducted under highly controlled conditions could become the basis from which many different studies could draw reliable data. The term “tagged” refers to a set of descriptive tags and coded information values, corresponding to a particular part of the recording, making possible to search within the recording more easily and accurately. First, the tagging parameters should be set according to the type of studies to be carried out, before the tagging process is initiated. Second, this material should be organized in a way that facilitates the extraction of phonetic and musical information. Phonemic data, in turn, could be analyzed via signal processing. Third, a systematic study of acoustical parameters and the estimation of attributes used in modeling the voice source and vocal filter, could lead in producing powerful models [14] for the identification and the automatic recognition of OEC, making it possible to conduct comparative studies with other vocal genres of music.
Based on these principles, the prototype tagged corpus DAMASKINOS was developed. The recordings derived from a well selected representative sample of twenty chanters, strictly under the same controlled conditions of digital recording, with parallel-synchronized recording of
electro-glottal graph (EGG), glottal flow and pressure of air [6].
Fig. 1. Byzantine chant notation example.
The characteristics attributes of OEC can be classified into three main categories: notation, intervals and expression. OEC uses a single line for laying out music symbols. These symbols can define pitch, time or quality of expression [7][8][9][10]. An example of OEC notation is presented in Fig. 1.
Pitch is defined by musical intervals related to the previous musical symbols, whereas time and quality symbols can affect it. Symbols defining time divisions and quality of expression can be written above, below or at the side of pitch symbols. The lyrics are written below the melodic line. Each syllable is positioned below the corresponding musical symbols. Another type of symbols can be found in the melodic line. Those are the testimonysymbols ( -martyries) which define the musical scale.
The intervals found in OEC are part of a 72-tone equal temperament system, namely the octave’s division into 72 equal musical ratios. Each of the 72 equal intervals is called morio ( ) (plural: moria). This fact results in pitches that do not exist in 12-tone equal temperament which are the most common pitches found today. According to this a western semitone and a whole tone equals to 6 and 12 Byzantine moria respectively. A OEC scale example is shown in Fig. 2. The musical pitches-intervals are determined by the particular mode, corresponding to the scale, the melody is written on. The total of 8 different modes, each one assigned to a different echos ( ), form the system of octoechos ( )(meaning the "Eight Modes"), which is the fundamental structure for classifying and describing modes (echoi) in Byzantine music.
The expression characteristics of OEC relate to a specific way of chant, derived from the Byzantine musical tradition, the geographic location, where it evolved, and the personal preferences of the chanter. OEC is a vocal
Proceedings SMC'07, 4th Sound and Music Computing Conference, 11-13 July 2007, Lefkada, Greece
126

music, in which the lyrics play the leading role, without any instrumental accompaniment. Furthermore a bass drone called ison ( ) is added to support the chanted mode-echos and to highlight the main melody.
Fig. 2. Scale example. The intervals values use the 72-tone (moria) equal temperament system.
II.
A.1)
2)
3)
TAGGING
Based on the characteristics described above, decisions should be made concerning the tagging specifications. The three main areas of concern were: the segmentation of the corpus, the tagging metadata and their encoding, and the software tool used throughout the procedure.
Tagging Specifications Segmentation
The decision to be made in this section was related to the units the recording would be segmented in. Since this religious music focuses on the lyrics, the choice was not so hard. The syllable-oriented approach was obvious. The recording would be tagged according to the syllables found in the printed text.
OEC incorporates many different styles of compositions from fast tempo ones ( )in which each syllable of lyrics corresponds to a musical symbol or a combination of musical symbols ( ) to slow and lengthy compositions ( ) where a syllable corresponds to a whole musical phrase [12]. In the second case, the syllable-oriented segmentation would not be effective, so a new approach was needed. The segmentation in these cases is implemented using the discrete musical phrases-gestures of minimum length, that are commonly used in OEC notation and are part of longer musical phrases, that constitute this musical form. Examples of fast and lengthy tempo compositions are shown in Fig. 3.
Tagging metadata The data inserted in line with the segmented pats of the
recording, are called tagging metadata. In the case of the OEC acoustic corpus, those data will consist of the syllables of the lyrics, the musical notation symbols and the musical intervals. Each of these types of data is on its own a tagging layer.
Apart from the three layers mentioned above (lyrics, notation, intervals) another 2 layers complete the layer set to be used for the tagging process. The last two layers are used to transcribe the melody in parts where the chanter, during its performance, overlooks the written score, by means of expression.
This sets the total tagging layers to 5, each one hosting a different type of data.
Encoding All the data incorporated in the tagging process of the
corpus should be encoded, in order to have a feasible tagged collection of data, in form of a searchable database. This includes notation symbols, as well as musical intervals. Word syllables do not need special encoding, since their length is suitable for insertion.
Fig. 3. Examples of fast tempo and slow tempo compositions. In fast tempo (a) each syllable of lyrics corresponds to a musical symbol or a combination of musical symbols ( ). In slow tempo (b) a syllable may expand in a complete musical phrase as shown by the blue lines
TABLE I. ENCODING EXAMPLES
MusicalSymbols Code Musical Intervals
in moria
P+12 Ascending 12
SKO+22 Ascending 22
OAK-20+20 Descending 20 then ascending 20
BOOI+06+00 Ascending 6 then repeating pitch
BIA+00-10
Repeatingprevious pitch
then descending 10
The encoding of symbols was based on their name using Latin characters (representable in ASCII code) [13].All encoding information can be organized in the form of a table containing all the different combinations of notation symbols, called encoding table. Musical intervals were encoded using the OEC 72 moria temperament system explained above. Extra symbols were used to represent ascending or descending movement of pitch (+,-). The basic rule for the encoding is: Code the notation symbols with their initial capital letters following the order in which they are positioned from the left to right, bottom-up. The numbers next to them represent the pitch change for each symbol.
Encoding examples for both symbols and intervals are presented in TABLE I. All the elementary notation symbols are exhibited in Appendix, TABLE II and TABLE III.
B. Software Tool In search of a reliable software package to use for
implementing the segmentation and tagging of the recordings, miscellaneous packages were considered and tested. The software chosen finally was the well known, in the area of phonetics analysis software, PRAAT [11]. It is developed by Paul Boersma and David Weenink at the University of Amsterdam. Among other features PRAAT gives many possibilities in analysis, editing, segmentation, tagging and most of all a powerful scripting language to automate processes.
Proceedings SMC'07, 4th Sound and Music Computing Conference, 11-13 July 2007, Lefkada, Greece
127
1)
2)
3)
III.
A.
PRAAT featuresPRAAT is a flexible software tool that can handle all
the widely used audio file formats. It can handle long sound files especially useful in this case since the recordings were long audio files. PRAAT recognizes the files it opens and every other it creates as objects. Apart from sound files, PRAAT can create tagging files in the form of layers called tiers. Tiers consist of boundaries and intervals between them. Labels can be added in these intervals making it easy to tag sound recordings. Many tiers together can form a TextGrid object.
Summarizing the main PRAAT features: Can manipulate, edit and analyze long sound files. Tagging in multiple layers (tiers) with ease of editing. Can use Greek letters by special sequences of Latin characters.Powerful scripting language for automating processes.Software constantly being updated. Open source software, versions for every operating system.
Tiers – Boundaries – TextGrid objectsMaking the connection between the tagging metadata
and the features PRAAT offers, each tagging layer corresponds to one tier and the set of 5 tiers constitute the TextGrid object. The boundaries in each tier mark the syllable limits and the intervals between them are used to insert the data. The first tier includes the syllables of the lyrics in Greek letters, the second one is used for the notation codes, the third layer for the musical intervals and fourth and fifth tiers for any inconsistencies in performing the written score.
PRAAT Scripting Language The most powerful feature of PRAAT is inevitably its
scripting language. This language includes variables, loops, jumps, formulas, procedures, arrays, etc… which give the flexibility to implement complex algorithms in combination with the ready-to-use analysis commands found in PRAAT.
THE TAGGING PROCESS
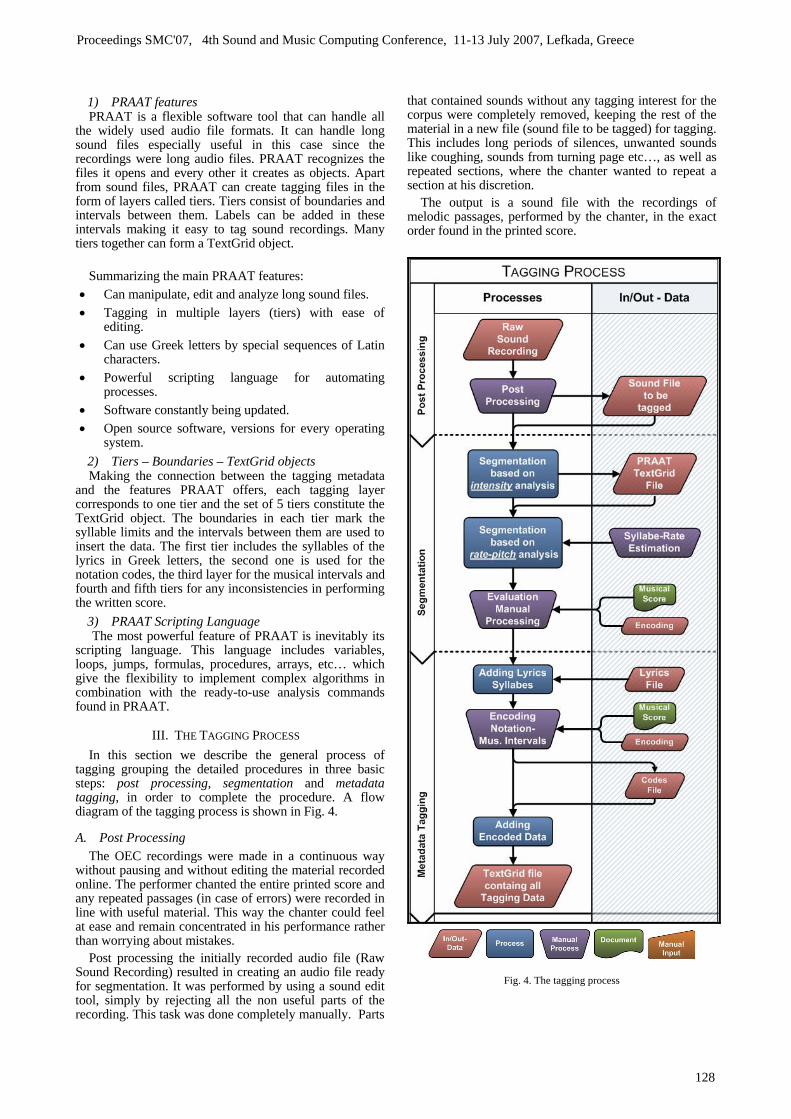
In this section we describe the general process of tagging grouping the detailed procedures in three basic steps: post processing, segmentation and metadata tagging, in order to complete the procedure. A flow diagram of the tagging process is shown in Fig. 4.
Post Processing The OEC recordings were made in a continuous way
without pausing and without editing the material recorded online. The performer chanted the entire printed score and any repeated passages (in case of errors) were recorded in line with useful material. This way the chanter could feel at ease and remain concentrated in his performance rather than worrying about mistakes.
Post processing the initially recorded audio file (Raw Sound Recording) resulted in creating an audio file ready for segmentation. It was performed by using a sound edit tool, simply by rejecting all the non useful parts of the recording. This task was done completely manually. Parts
that contained sounds without any tagging interest for the corpus were completely removed, keeping the rest of the material in a new file (sound file to be tagged) for tagging. This includes long periods of silences, unwanted sounds like coughing, sounds from turning page etc…, as well as repeated sections, where the chanter wanted to repeat a section at his discretion.
The output is a sound file with the recordings of melodic passages, performed by the chanter, in the exact order found in the printed score.
Fig. 4. The tagging process
Proceedings SMC'07, 4th Sound and Music Computing Conference, 11-13 July 2007, Lefkada, Greece
128

B.
1)
2)
Segmentation The segmentation part of the process is the core of the
entire tagging procedure. Segmentation, in a few words, is the correct placement of the boundaries that define the intervals to be labeled in the tiers. By using PRAAT scripting language and by correctly choosing the analysis parameters, the analysis parameters, this task was semi-automated, consisting of an automatic and a manual part.
Segmentation is the most complex procedure in terms of finding and implementing methods, for positioning efficiently the tagging boundaries. The segmentation procedure can be seen in Fig. 8.
The post processed sound file becomes the input for segmentation. The output is a data file that is created during the intensity analysis part of the segmentation. It is the TextGrid file where all the boundaries are placed.
Segmentation is divided into three parts: intensity analysis, rate/pitch analysis and manual processing.These three parts are related in a way that the preceding one feeds the next with its output, as seen in Fig. 8. They will be analyzed as different parts of the algorithm, in order to be able to get into the details of each one.
The initially created TextGrid file is processed by rate/pitch analysis and manual processing until the final TextGrid is produced. This file contains all the tagging metadata and the intervals between which all the metadata will be added.
Intensity Analysis Intensity analysis sub-process detects regions of the
recording where the intensity is below specified threshold and places boundaries according to the region’s duration. In this way consonants are detected throughout the recording. A flow chart of this sub-process is shown in Fig. 9.
Consonants can be separated from vowels by the fact that they have a lower intensity value. Based on this fact intensity analysis detects regions (unvoiced parts) of the recording, where the intensity level drops below a specified value (unvoiced parts threshold).
The process begins by creating a new TextGrid object. All boundaries created by intensity analysis will be placed in this file. Analyzing intensity of the sound file is the next step. This way a new Intensity object is created. It consists of frames, each one containing an intensity value.
The procedure, then, enters a loop which runs through all the frames of the intensity object, checking if the frame’s value is above the unvoiced threshold. A value below this threshold signals the existence of a pause.
The term “pause” is used here instead of unvoiced part(a consonant or a silence part). When a pause is detected, its duration is stored and updated, as long as the intensity values of the following frames are below threshold. This duration is constantly been checked for exceeding the silence duration value. If this is the case the interval is considered to be silence and it is marked with the symbol *, as soon as a voiced part appears. The intervals marked as silences will not be further analyzed or take part when adding the tagging metadata, at a later stage. The process ends when all frames are checked.
A critical part of the intensity analysis is Intensitythreshold estimation. It is performed in order to extract the Unvoiced Part Intensity Threshold parameter. It defines the level of intensity below which a part of the recording
would be considered as an unvoiced (consonant or silence, depending on duration).
Threshold is a crucial parameter for the correct placement of the boundaries. A mistakenly inputted higher value would result in creating many more boundaries than needed, even in voiced parts of the recording, while a lower value would result in missing unvoiced parts and thus require manual creation, at the manual processing stage.
The estimation process has been realized by manually extracting 5 parts of the recording, 10 seconds (s) each, randomly chosen, then analyzing separately each of them. Analyzing includes finding the mean intensity of all unvoiced parts of a single part and then the mean value for all 5 parts. This value is the intensity threshold parameter.
Rate/Pitch Analysis The rate/pitch analysis sub-process, shown in Fig. 10,
updates the TextGrid object created by intensity analysis, by placing extra boundaries where needed, based on the pitch contour. These boundaries segment parts of the recording, where the same or adjacent vowels expand, in a musical phrase, with variations in pitch, since each of these parts consist a different syllable. Intensity analysis, earlier, fails to include these cases, since there is no consonant between these vowels.
a) Description: This sub-process starts by analyzing the sound file’s pitch contour. We use a time step of 0.01s (100 pitch values per second), an analysis window of 0.04s long, with an oversampling of 4 pitch values between windows. Next the pitch contour is smoothened. Smoothening is implemented by low-pass filtering the curve. The smoothening parameter used is the bandwidth of the low pass filter. The default value is 2Hz, but this value can be readjusted for a specific chanter.
Smoothening is followed by quantizing pitch values in semitones. At this stage the PRAAT pitch object is created.It consists of frames, each one containing a pitch value in semitones. Semitones are calculated from a reference value, which in this case is re 1 Hz.
Looping through all object’s frames, checking the pitch of two consecutive frames, begins. In this case the algorithm seeks for sound intervals where pitch remains constant. If two adjacent frames have the same pitch (Previous Pitch = Current Pitch) in semitones, the duration of this interval is being measured.
A new parameter is inserted at this point, the syllable rate parameter. Syllable rate defines the tempo of the chanter, thus the period of time he uses to perform each lyrics syllable. It is measured in seconds. For example a syllable rate of 1s means that every 1 second a new syllable is performed. Syllable rate is inserted manually by the user. The estimation process is described in the next paragraph.
When two consecutive pitch values differ, the procedure checks if the duration being measured exceedsthe syllable rate. If this is the case, a new boundary is inserted in the TextGrid object, created earlier by the intensity analysis process. The process ends when all frames are checked.
b) Syllable Rate Estimation: This manual procedureis performed before pitch analysis has started. Its purpose
Proceedings SMC'07, 4th Sound and Music Computing Conference, 11-13 July 2007, Lefkada, Greece
129

is to extract the Syllable Rate Parameter used in the process.
The user extracts 5 parts of the recording, 10s each, randomly chosen, then analyzes separately each of them. Analyzing is done by observing the syllables durations and taking note of them, then calculating a mean duration value. This is the tempo of the chanter and therefore the syllable rate parameter. An example is presented in Fig. 5.
All intervals marked with red arrows in Fig. 10 are of approximately the same duration (mean value), which is 1.1s in this case. By using smoothing and rate parameters we minimize the likelihood of recognizing vibrato pitch movements as changes in pitch. This way no boundaries are created in places where the chanter performs a special expression or uses wide vibrato (exceeding one semitone).
C. Metadata Tagging Once the segmentation is completed, intervals are set
and waiting to be labeled by tagging metadata. Before continuing to the embedding of data a manual processing of the TextGrid file is performed, to make sure all boundaries are positioned correctly.
The user goes through the segmented file, observing the position of each boundary, while checking there are no boundary missing and removing the ones that have no use. The updated file is stored to save the changes. Manual processing is a tedious task, requiring time to be completed correctly.
During segmentation useful intervals are separated from silences, in a way to make adding data process straightforward. Lyrics data and encoded notation and interval data, are positioned in the corresponding segments, completing this way the entire tagging process and forming the final TextGrid file containing all the data. The tagging labels are prepared in the form of text files that are “inserted” into the segmentation tiers. The process of metadata tagging is presented in Fig. 6.
Fig. 5. Syllable rate estimation. Red arrows mark the syllable rate period. Green arrow shows a double beat syllable.
1)
2)
Input Apart from the TextGrid file that holds the
segmentation information and which will be filled with the data, there are two more input files. The Lyrics Labels File and the Codes Labels File.
PRAAT gives the possibility of using Greek letters by special sequences of Latin characters. A text file containing all lyrics syllables in Greek letters, one syllable in each line (Lyrics in Greek, Text File), is prepared. Then
this file is converted automatically in the Lyrics labels file, by replacing each Greek letter with the corresponding Latin characters sequence (Lyrics Encoding sub-process). More information on inputting Greek letters with PRAAT and a complete table, can be found in the manual pages of the software. Unlike lyrics encoding, Encoding Notation and Musical Intervals is done manually. The user reads the musical score while checking the encoding table to find the correct encoding, and then saves it in the Codes Labels file along with the musical interval represented in moria. Encoding examples are presented in Table I.
ProcessThe process loops through all the intervals of the
TextGrid file produced by segmentation and checks whether an interval is a Silence interval. If not, it reads a line from each file (lyrics and codes) and labels the interval in the corresponding tier. By the end of the loop three tiers have been completely labeled, tiers 1,2 and 3.
Fig. 6. Metadata Tagging
Upon loop completion, tiers 4 and 5 are formed by duplicating tiers 2 and 3. The last two tiers are used for marking any inconsistencies between the written score and the chanter’s performance. Locating these inconsistencies is a manual process. After creating tiers 4 and 5 the user must listen carefully to the recording while reading the musical score. When an inconsistency is found he checks the right encoding and updates the corresponding interval in tiers 4 and 5. This procedure must be done by an experienced user capable of understanding chanter’s
Proceedings SMC'07, 4th Sound and Music Computing Conference, 11-13 July 2007, Lefkada, Greece
130

intensions and writing them down. This last part is to be implemented in the near future.
3)
IV.
Output The output of the final step of tagging is the TextGrid
file containing all the segmentation and tagging metadata Fig. 7.
EVALUATION – CONCLUSION
The semi automated process described above can greatly reduce the tagging process duration of the OEC acoustic corpus. Segmentation plays the major role, seconded by the process of adding all the metadata. A picture of all the tiers used in tagging the OEC corpus DAMASKINOS Error! Reference source not found., as well as all the data, in their final form can be seen in Fig. 7.
In order to evaluate the process, we give an example of the time needed to tag a specific OEC recording manually,in contrast with the time needed to tag the same recording semi automatically. We limit our example in stating only the time differences of the segmentation process (not metadata tagging). Adding all metadata manually in
PRAAT, including Greek lyric syllables and coding would increase tagging duration greatly, making the goal of tagging the whole OEC corpus unrealizable.
Segmenting a 220s long OEC recording, with 300 boundaries, would take 1 hour and 15 minutes manually, but only 40 minutes (mostly for manually checking the correct placement of boundaries), which is 87,5% faster. Keeping in mind that OEC recordings can be almost 1 hour long, there is a great benefit in working time.
Concerning the accuracy of the procedure, 32% of these 300 boundaries were placed correctly (comparing to manual positioning), 46% were placed no further than 0.3s from the desired position, 15% needed repositioning, 5% were added manually and 2% were removed.
The above percentages are the average values (standard deviation of 5%) of a sample of 6 students of the department of Informatics and Telecommunications, University of Athens, Greece. The students were trained in the process described and practiced it in the same 220s long part of the recording.
Fig. 7. Short musical phrase, showing all tagging tiers completed
Proceedings SMC'07, 4th Sound and Music Computing Conference, 11-13 July 2007, Lefkada, Greece
131

APPENDIX I
Fig. 8. The Segmentation procedure
TABLE II. PITCH SYMBOLS
Symbol Name Code
ISON (Ίσον) I
OLIGON (Ολίγον) O
PETASTI (Πεταστή) P
KENTIMATA (Κεντήματα) K
YPSILI (Υψηλή) Y
APOSTROFOS (Απόστροφος) A
ELAFRON (Ελαφρόν) E
XAMILI (Χαμηλή) X
TABLE III. EXPRESSION SYMBOLS
Symbol Name Code
BAREIA (Βαρεία) B
PSIFISTON (Ψηφιστόν) S
OMALON (Ομαλόν) O
ANTIKENOMA (Αντικένωμα) A
ETERON (Έτερον) E
Fig. 9. Intensity analysis sub procedure
Proceedings SMC'07, 4th Sound and Music Computing Conference, 11-13 July 2007, Lefkada, Greece
132

Fig. 10. Rate/Pitch Analysis sub procedure
ACKNOWLEDGMENT
This work was co-funded by European Community Funds and Greek National resources under the project “AOIDOS” of the EPEAEK program.
REFERENCES
[1] G. Stathis (Ed.), Theory and Praxis of the Psaltic Art, Proceedings of the II International Congress of Byzantine Musicology and Psaltic Art, Athens, 15-19 October 2003, ISBN 9608835283.
[2] K. Tsiappoutas, G. E. Ioup, and J. W. Ioup, “Measurement and analysis of Byzantine chant frequencies and frequency intervals” JASA, vol.116, Issue 4, 2004, pp.2581.
[3] I. Zannos, A. Georgaki, D. Delviniotis and G. Kouroupetroglou, “Real-Time Control of Greek Chant Synthesis”, Proceedings of SMC06, Marseille , 18-20 May 2006, pp. 47-52.
[4] D. Delviniotis, "A classification of Byzantine singing voices", Proceedings of EUSIPCO-98, Rhodes, Sept. 1998, pp.129-132.
[5] D. Delviniotis, Byzantine music chant analysis by using signalprocessing techniques, PhD Dissertation, University of Athens, Department of Informatics and Telecommunications, 2001.
[6] G. Kouroupetroglou, D. Delviniotis, G. Chryssochoidis, “DAMASKINOS: The Prototype Tagged Acoustic Corpus of Byzantine Ecclesiastic Chant Voices”, Proc. of the ACOUSTICS Conference, Heraclio, Crete, 2006.
[7] S. I. Karas, Method of Greek Music-Theory, vol. A, Athens, 1982. [8] D. Panagiotopoulos, Theory and Practice of church Byzantine
music”, 5th edition, ΣΩΤΗΡ, Athens, 1991.
[9] D. Delviniotis, “AOIDOS: Musical Score and Exercises”, Technical Report, University of Athens, Department of Informatics and Telecommunications, 2006.
[10] G. Stathis, (Parechemata) Lectures on Byzantine Music, Athens, 1978.
[11] P. Boersma and D. Weenink, Praat: doing phonetics by computer,http://www.praat.org/ 2007.
[12] D. Delviniois, (Psaltic Voice and Expression) (in Greek), Mesolongi, 2002.
[13] D. Delviniotis, D. “AOIDOS: Byzantine Chant’s Notation and Music Intervals coding”, Technical Report, University of Athens, Department of Informatics and Telecommunications, 2006.
[14] P. Cook, D. Kamarotos, T. Diamantopoulos and G. Philippis, “IGDIS: A Modern Greek Text to Speech Singing Program for the SPASM/Singer Instrument", Proceedings of the International Computer Music Conference. Tokyo, 1993, pp. 387-389.
Proceedings SMC'07, 4th Sound and Music Computing Conference, 11-13 July 2007, Lefkada, Greece
133