a methodology and a framework for measuring and managing the
TRANSCRIPT
CICBS: A METHODOLOGY AND A FRAMEWORK FOR MEASURING AND MANAGING THE INTELLECTUAL CAPITAL OF CITIES - A PRACTICAL
APPLICATION IN THE CITY OF MATARÓ
José María Viedma
Department of Business Administration, Polytechnic University of Catalonia &
Intellectual Capital Management Systems, Barcelona, Spain
[email protected] [email protected]
Session L-3
Abstract
The governments of cities have to make important decisions on the future of their communities. In the past, the vision, objectives, and goals of cities have been determined mainly by considering tangible assets as the main factors of a city’s prosperity. However, in the knowledge economy, the role of intangible assets in wealth creation has become fundamental. As a result, an intangible framework of assets that allows navigation from the present reality to the future vision has become an urgent need for all cities. The paper has two well-defined parts. In the first part, the paper develops a specific methodology and framework for measuring and managing the intellectual capital of cities. In the second, the study deals with the practical application of this model of intellectual capital in cities to the specific case of the city of Mataró, providing some details of the first cities’ intellectual capital report. Keywords: city government, intellectual capital, benchmarking, strategic management, knowledge management.

Fifth European Conference on Organizational Knowledge, Learning and Capabilities
OKLC 2004 2-3 April 2004 at Congress Innsbruck.
CICBS CITIES’ INTELLECTUAL CAPITAL BENCHMARKING SYSTEM
A methodology and a framework for Measuring and Managing Intellectual Capital of Cities
A practical application in the city of Mataró.
Author. José María Viedma Marti.
Affiliation: Professor of Business Administration at the Polytechnic
University of Catalonia and President of Intellectual Capital Management Systems, Spain
Full address: Benedicto Mateo 33, 3º, 2ª 08034, Barcelona, Spain. Phone Number: (34) 93.203.53.59 Fax Number: (34) 93.204.71.95 Email address: [email protected]; [email protected] Web: http://gestiondelcapitalintelectual.com http://intellectualcapitalmanagementsystems.com Practitioner Contribution
CICBS: Cities’ Intellectual Capital Benchmarking System
© Josι Marνa Viedma Marti 1
CICBS: A Methodology and a Framework for Measuring and Managing the Intellectual Capital of Cities. A practical application
in the city of Mataró
José María Viedma Department of Business Administration Polytechnic University of Catalonia and
Intellectual Capital Management Systems Barcelona, Spain
[email protected]; [email protected]
Abstract
The governments of cities have to make important decisions on the future of their communities. In
the past, the vision, objectives, and goals of cities have been determined mainly by considering
tangible assets as the main factors of a city’s prosperity. However, in the knowledge economy, the
role of intangible assets in wealth creation has become fundamental. As a result, an intangible
framework of assets that allows navigation from the present reality to the future vision has become
an urgent need for all cities. The paper has two well-defined parts. In the first part, the paper
develops a specific methodology and framework for measuring and managing the intellectual
capital of cities. In the second, the study deals with the practical application of this model of
intellectual capital in cities to the specific case of the city of Mataró, providing some details of the
first cities’ intellectual capital report.
Keywords: city government, intellectual capital, benchmarking, strategic management, knowledge management Suggested track: K Intangible assets and social, intellectual, and cultural capital
The government of cities in the information society
Progress in new technology, especially in information and telecommunications technology,
has radically transformed the way people live and work in the information society. In this
respect, Edvinsson and Malone (1997, p. 190) have asserted:
In particular, the combination of powerful communications technologies with equally
powerful information technologies will make it possible for people to live and work
nearly anywhere and still enjoy most of the fruits of life in a big city or suburbia or the
country-side- from culture and arts to role-playing and simulated participation in
distant world events … These same technologies will also make work more and

CICBS: Cities’ Intellectual Capital Benchmarking System
© Josι Marνa Viedma Marti 2
more portable, shifting jobs from centralized work sites (office buildings and factories)
to virtual offices located at home or on the road or in neighbourhood centers.
Such changes in the way that people live and work, facilitated by the above-
mentioned technologies, inevitably prompt the question: “If we can live and work
anywhere, where shall we live and work?”. Moreover, these same changes pose important
questions for city governments, including the following:
• Which facilities must be offered by city governments if the city is to be the most
attractive place in which to live?
• How can innovative companies be attracted to the city?
• How to foster entrepreneurship?
• Which organisational structures are required?
• How the city be transformed to face new technological changes successfully?
These questions and many others of a similar nature transform the dynamic of
municipalities, create new challenges, and increase competition. City governments have to
make important decisions regarding the future of their communities.
Similar changes have occurred in the past. In the years before the American Civil
War of 1861–65, the factory towns of the north-eastern United States (such as Elisabeth,
Lowell, Paterson, and Manchester) had established a successful combination of physical
and intellectual capital in technology (looms), power (water wheels), employees (northern
European immigrants), infrastructure (interchangeable parts), and transportation (canals).
But the wealth and power brought by this successful formula did not last. By the beginning
of the 1890s, intellectual and financial capital in the form of talent and money had moved to
other towns (such as Chicago, St Louis, Pittsburgh, and Detroit) where a new recipe for
success was developed. This consisted of new technologies (steam and electricity), new
forms of transportation (railroads and, later, trucking), new sources of labour (eastern
European immigrants), and a different infrastructure (mass production and bureaucracies)
(Edvinsson & Malone 1997).
This historical example demonstrates that the recipe for success changes when
there are substantial technological breakthroughs. It is apparent that we are now in that
situation again. The equation is again being recast and the balance of forces are again
being reset. The new formula will combine new technologies (microprocessor-based
CICBS: Cities’ Intellectual Capital Benchmarking System
© Josι Marνa Viedma Marti 3
products), transportation (the Internet and broadband telecommunications), labour (the mix
of office-goers, telecommuters, ‘road warriors’, and ‘corporate gypsies’), and infrastructure
(virtual organisations) (Edvinsson & Malone 1997).
City governments have the difficult task of guiding the transition from the existing
formula to the requirements of the new equation. The purpose of this paper is to help these
governments in their planning for such a transition by providing them with a new model.
This new framework must be especially focused on the management of intangible assets
because intellectual capital is now the main source of future wealth, prosperity, and
growth.
Measurement and management of cities’ intellectual capital: the state of the art
Having established the case for a model to measure and manage the intellectual capital of
cities, the question that arises is whether there any proven models for the purpose. The
present author is not aware of any. In Intellectual Capital (1997, p. 192-193 ), specifically in
the section entitled “The intellectual capital of municipalities”, Edvinsson and Malone hinted
at the possibility of adapting the IC Navigator model for application in municipalities. The
authors note the nature of the IC Navigator:
… with its mix of the human factor (citizens), customers (the business that support or
employ these citizens, as well as those being recruited to come to town), and
process ( the municipality’s mix of city government, schools, police, fire department,
and so forth). There is also, of course, the financial factor, which combines the city’s
budget (including debt or surplus), tax base, and the combined local investment of
the area’s businesses. Tellingly, what is all but missing in most municipalities is the
renewal and development factor. This is due less to the fact that cities and towns
don’t fit the IC Navigator than that, complacent after a century of predictable change,
they have allowed programs to develop these indirect assets to atrophy.
The authors then go on to present a set of “process focus” indicators as a guide to
how the general IC Navigator model might be adapted to the specific case of cities.
Apart from this reference in Edvinsson and Malone (1997), the present author is not
aware of any significant contributions to the question of the management of the intellectual
capital of cities. In contrast, the similar subject of the management of the intellectual capital
of nations is in a somewhat more advanced stage of development. Nick Bontis (2002), in

CICBS: Cities’ Intellectual Capital Benchmarking System
© Josι Marνa Viedma Marti 4
his work entitled “National Intellectual Capital Index: Intellectual Capital Development in the
Arab Region”, asserts:
Although much of the history of intellectual capital literature spans only a decade, the
national view of this phenomenon is in its infancy. There have been only two
countries that have examined their intellectual capital development: Sweden (Rembe
1999) and Israel (Pasher 1999).
Bontis’ (2002) study of the Arab region can be added to this meagre list, and thus
represents the third attempt to make a meaningful examination of the intellectual capital
development of nations.
These three studies of nations (Rembe 1999; Pasher 1999; Bontis 2002) justify the
need to measure and manage the intellectual capital of cities in a similar way. Rembe
(1999, p. 4) reported that Sweden offers highly attractive and competitive intellectual
capital assets of superior value in the following way:
Just as corporate investment flows are increasingly determined by the potential of the
intellectual capital of companies, international investments will be increasingly
determined by the intellectual capital of nations. Traditional statistics are valid in
themselves for comparing nations. But today they are hardly enough. Investors must
also analyse country-specific “soft” investment data—the data that gives a clear
picture of a nation’s combined intellectual capital and how it can be utilized for future
growth and profits.
Similarly, Pasher (1999, p. 4), in “The Intellectual Capital of State of Israel”, made the
following observation:
The assets that have given Israel an advantage over other countries are the hidden
intellectual assets. Though Israel is a young country, it is blessed with many
intellectual assets. And despite the many political storms it continues to weather,
Israel has become a hothouse for some of the most profitable technological ideas. It
is well integrated into the international community of technological industries, and is
regarded as one of the most important and prominent countries in this field. The
country is an important R & D center for international hi-tech companies and has
more start-up companies than any other location with the exception of California’s
Silicon Valley. Since 1982, the number of hi-tech start-up companies in Israel has
grown from approximately 50 to over 2000!.
CICBS: Cities’ Intellectual Capital Benchmarking System
© Josι Marνa Viedma Marti 5
So far no one has formulated a document presenting Israel’s core competencies, key
success factors and hidden assets which provide it with comparative advantages and
high growth potential.
Similar arguments can be found in Bontis’ (2002) report on the Arab countries.
Furthermore, the three reports mentioned above all used the Skandia Navigator
model (IC Navigator model) that was initially conceived and applied by Edvinsson and
Malone (1997) in the Swedish insurance company Skandia. All three reports translated the
company IC model into a country IC model—but the main features of the framework still
remained after the translation.
Given that the measurement and management of the intellectual capital of cities has
great similarities to that of countries, and given that all three studies previously mentioned
used the IC Navigator adapted to countries, this model is discussed below.
Process Capital
Renewal & Development Capital
Financial Capital
Market CapitalHuman Capital
Past
Present
Future
Process Capital
Renewal & Development Capital
Financial Capital
Market CapitalHuman Capital
Past
Present
Future
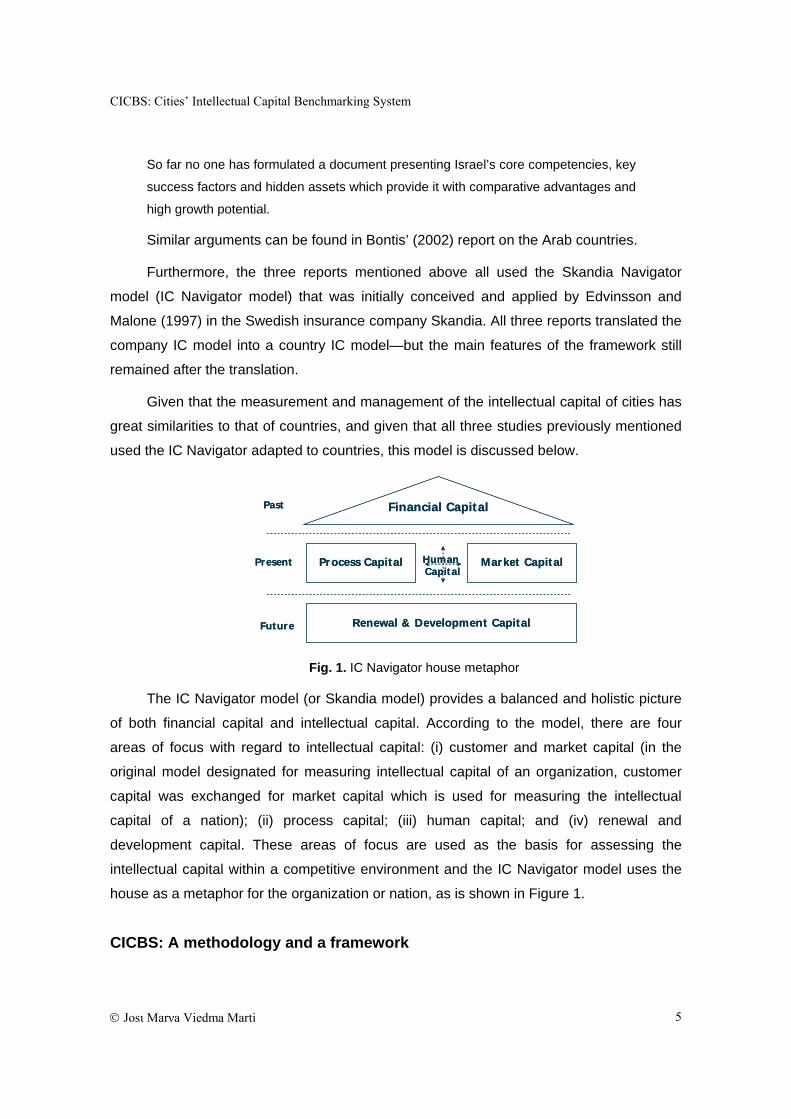
Fig. 1. IC Navigator house metaphor
The IC Navigator model (or Skandia model) provides a balanced and holistic picture
of both financial capital and intellectual capital. According to the model, there are four
areas of focus with regard to intellectual capital: (i) customer and market capital (in the
original model designated for measuring intellectual capital of an organization, customer
capital was exchanged for market capital which is used for measuring the intellectual
capital of a nation); (ii) process capital; (iii) human capital; and (iv) renewal and
development capital. These areas of focus are used as the basis for assessing the
intellectual capital within a competitive environment and the IC Navigator model uses the
house as a metaphor for the organization or nation, as is shown in Figure 1.
CICBS: A methodology and a framework
CICBS: Cities’ Intellectual Capital Benchmarking System
© Josι Marνa Viedma Marti 6
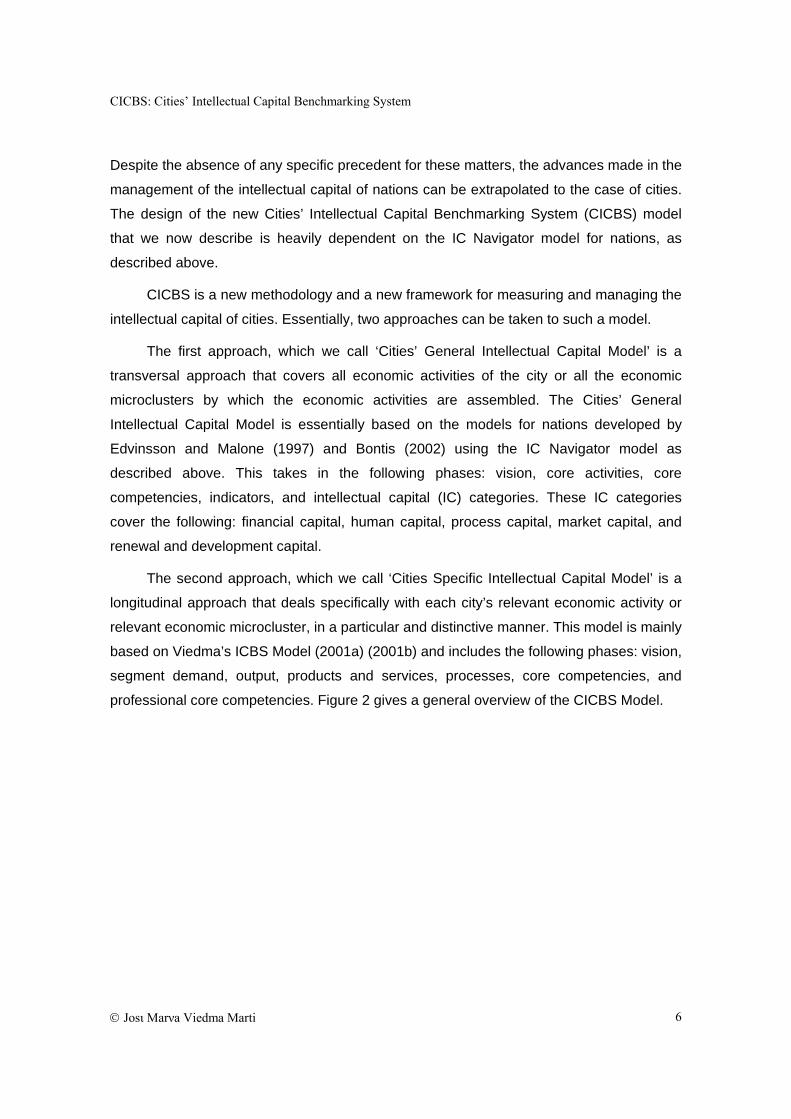
Despite the absence of any specific precedent for these matters, the advances made in the
management of the intellectual capital of nations can be extrapolated to the case of cities.
The design of the new Cities’ Intellectual Capital Benchmarking System (CICBS) model
that we now describe is heavily dependent on the IC Navigator model for nations, as
described above.
CICBS is a new methodology and a new framework for measuring and managing the
intellectual capital of cities. Essentially, two approaches can be taken to such a model.
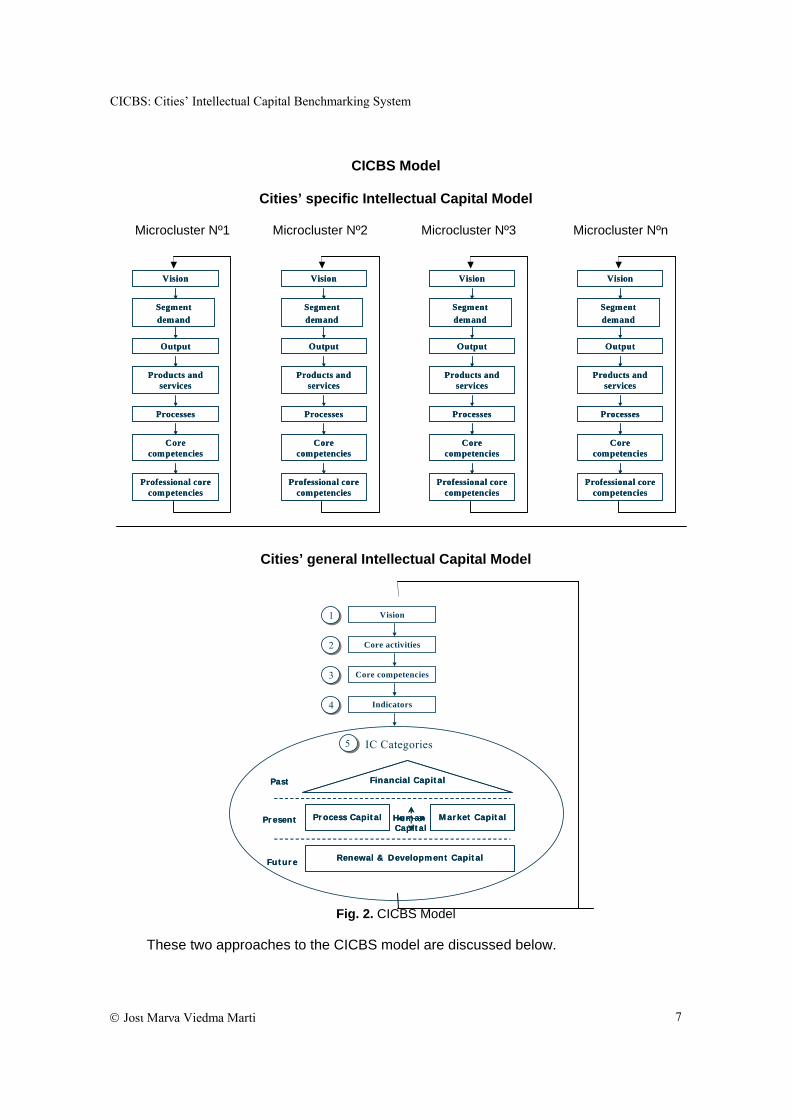
The first approach, which we call ‘Cities’ General Intellectual Capital Model’ is a
transversal approach that covers all economic activities of the city or all the economic
microclusters by which the economic activities are assembled. The Cities’ General
Intellectual Capital Model is essentially based on the models for nations developed by
Edvinsson and Malone (1997) and Bontis (2002) using the IC Navigator model as
described above. This takes in the following phases: vision, core activities, core
competencies, indicators, and intellectual capital (IC) categories. These IC categories
cover the following: financial capital, human capital, process capital, market capital, and
renewal and development capital.
The second approach, which we call ‘Cities Specific Intellectual Capital Model’ is a
longitudinal approach that deals specifically with each city’s relevant economic activity or
relevant economic microcluster, in a particular and distinctive manner. This model is mainly
based on Viedma’s ICBS Model (2001a) (2001b) and includes the following phases: vision,
segment demand, output, products and services, processes, core competencies, and
professional core competencies. Figure 2 gives a general overview of the CICBS Model.
CICBS: Cities’ Intellectual Capital Benchmarking System
© Josι Marνa Viedma Marti 7
CICBS Model
Cities’ specific Intellectual Capital Model
Microcluster Nº1 Microcluster Nº2 Microcluster Nº3 Microcluster Nºn
Cities’ general Intellectual Capital Model
Fig. 2. CICBS Model
These two approaches to the CICBS model are discussed below.
Segmentdemand
Output
Products and services
Processes
Core competencies
Professional core competencies
Vision
Segmentdemand
Output
Products and services
Processes
Core competencies
Professional core competencies
Vision
Segmentdemand
Output
Products and services
Processes
Core competencies
Professional core competencies
Vision
Segmentdemand
Output
Products and services
Processes
Core competencies
Professional core competencies
Vision
Segmentdemand
Output
Products and services
Processes
Core competencies
Professional core competencies
Vision
Segmentdemand
Output
Products and services
Processes
Core competencies
Professional core competencies
Vision
Segmentdemand
Output
Products and services
Processes
Core competencies
Professional core competencies
Vision
Segmentdemand
Output
Products and services
Processes
Core competencies
Professional core competencies
Vision
Core competencies
Vision
Pr ocess Capit al
Renewal & Developm ent Capit al
Financial Capit al
M ar ket Capit alHum an Capit al
Past
Pr esent
Fut ur e
Pr ocess Capit al
Renewal & Developm ent Capit al
Financial Capit al
M ar ket Capit alHum an Capit al
Past
Pr esent
Fut ur e
Core activities
Indicators
IC Categories
1
5
2
3
4
CICBS: Cities’ Intellectual Capital Benchmarking System
© Josι Marνa Viedma Marti 8
Cities’ General Intellectual Capital Model (CGICM)
CGICM is a general model for measuring and managing the intellectual capital of cities that
is essentially based on the measurement and management of the intangible assets a city
possesses. To develop a set of different economic activities these assets are assembled
into what are called microclusters according to certain criteria of homogeneity. It is
basically about managing the creation and development of a common and general
knowledge—an intellectual capital platform—that strengthens the existing microclusters of
a city and nurtures the building of new ones.
The process of managing a city’s general intellectual capital is based on five phases
(Rembe, 1999; Roos et al., 1997):
• Phase 1: Creating the vision
• Phase 2: Identifying the core activities needed to realize the vision
• Phase 3: Identifying the core competencies needed to realize the core activities
• Phase 4: Identifying the indicators for each core activity and each core
competence
• Phase 5: Assembling the indicators into different intellectual capital categories
Each phase can be considered as a constituent factor of the CGICM. A summary
description of the different phases is given below.
Phase 1: Creating the vision
The vision of a particular city, which we used as the starting point of the process, usually
crystallizes through brainstorming and interviews with leading figures in various fields in
the city—such as life sciences, social sciences, urban planning, accounting, business
management, and so on. It is also important to involve young people in the discussions
and ask them what they would like their city to look like in the future, and what would make
the city attractive for them. The first step in the process is therefore to understand what the
city is, and what the city wants to be. Clear objectives usually make the vision more
specific.
Phase 2: Identifying the core activities needed to realize the vision
CICBS: Cities’ Intellectual Capital Benchmarking System
© Josι Marνa Viedma Marti 9
Once the vision is established, the next step is to identify the actions, projects, and
activities that need to be put into practice to reach the vision and objectives previously
defined.
Phase 3: Identifying the core competencies needed to realize the core activities
The core activities defined in Phase 2 give way to the core competencies needed to realize
the core activities. We assume that core competencies are equivalent to core knowledge
and intellectual capital. Such core competencies can be understood as a bundle of
intangible assets (Andriessen, 2001).
Phase 4: Identifying the indicators for each core activity and each core competence
Core activities and core competencies are identified in strategic theory as key success
factors. As the term implies, key success factors indicate the vital criteria that the particular
strategy must meet if it is to succeed. The next logical step is to take the key success
factors identified in the previous steps, and identify the indicators that best reflect these key
success factors.
Phase 5: Assembling the indicators into different intellectual capital categories
In this phase we assemble the indicators that have been identified in Phase 4 into the
different intellectual capital categories of the IC Navigator model discussed previously.
The model for measuring intellectual capital uses the idea of a house as a metaphor
for the organization of a city. Financial capital constitutes the roof of the house and reflects
the city’s history and past achievements. However, it must be noted that these do not
necessarily enlighten us in terms of future achievements.
The supporting columns are process capital and market capital—the supports upon
which the present operations of the city are based. Renewal and development capital,
which is situated in the foundation of the house, measures how the city prepares for the
future. Human capital, which is found in the center of the house, interacts with all the
different focal points. Human capital is the heart of the city—that is, the capabilities,
expertise, and wisdom of the people. It is the role of the city to assist, guide, and support
its people towards the realization of their strategic goals.
The city can also be described as a tree. The various means by which the tangible
assets are expressed—the annual reports, catalogues, protocols, and others—are
represented by the leaves and branches of the tree. The wise investor who desires the fruit
CICBS: Cities’ Intellectual Capital Benchmarking System
© Josι Marνa Viedma Marti 10
of the tree will examine its roots to learn about its future. The roots of the tree (or the
foundation of the house, to mix the metaphor) reflect the renewal and development capital
of the city—the source of future growth and affluence.
Based on this essential structure, the diverse focal areas of capital from which the
indicators will be assembled, are as follows.
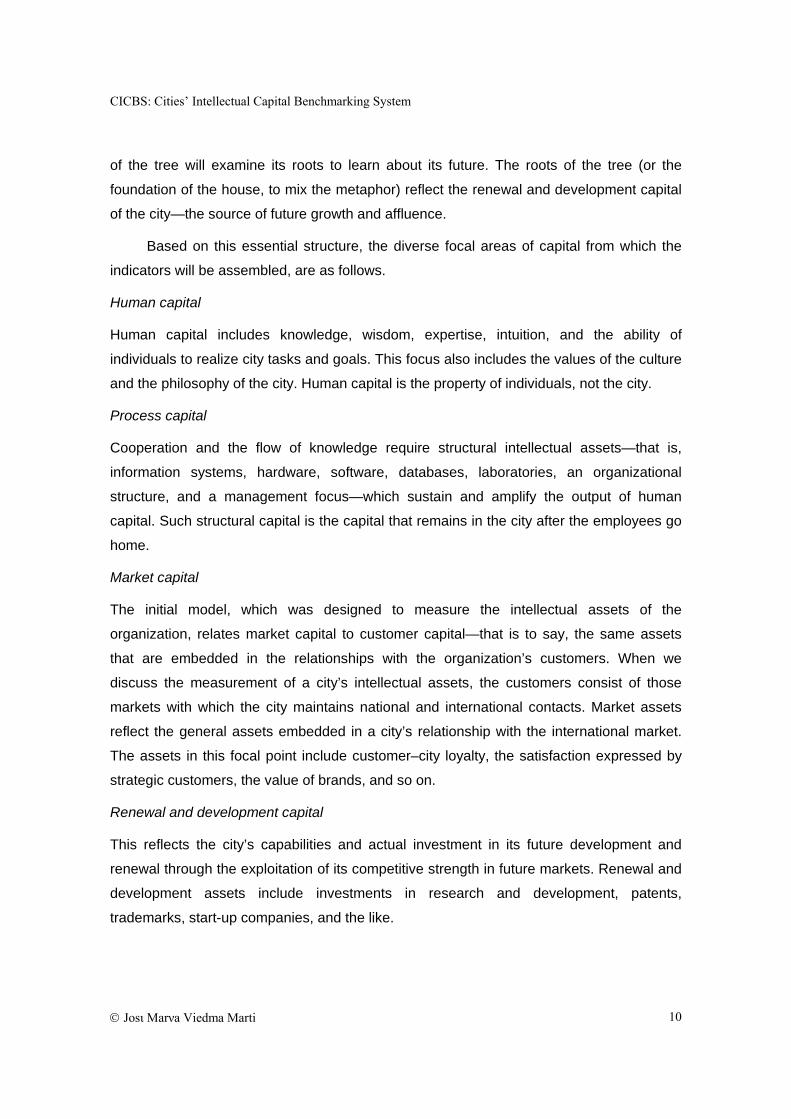
Human capital
Human capital includes knowledge, wisdom, expertise, intuition, and the ability of
individuals to realize city tasks and goals. This focus also includes the values of the culture
and the philosophy of the city. Human capital is the property of individuals, not the city.
Process capital
Cooperation and the flow of knowledge require structural intellectual assets—that is,
information systems, hardware, software, databases, laboratories, an organizational
structure, and a management focus—which sustain and amplify the output of human
capital. Such structural capital is the capital that remains in the city after the employees go
home.
Market capital
The initial model, which was designed to measure the intellectual assets of the
organization, relates market capital to customer capital—that is to say, the same assets
that are embedded in the relationships with the organization’s customers. When we
discuss the measurement of a city’s intellectual assets, the customers consist of those
markets with which the city maintains national and international contacts. Market assets
reflect the general assets embedded in a city’s relationship with the international market.
The assets in this focal point include customer–city loyalty, the satisfaction expressed by
strategic customers, the value of brands, and so on.
Renewal and development capital
This reflects the city’s capabilities and actual investment in its future development and
renewal through the exploitation of its competitive strength in future markets. Renewal and
development assets include investments in research and development, patents,
trademarks, start-up companies, and the like.
CICBS: Cities’ Intellectual Capital Benchmarking System
© Josι Marνa Viedma Marti 11
Benchmarking
City ACity B
Reference model
Core competencies
Vision
Process Capital
Renewal & Development Capital
Financial Capital
Market CapitalHuman Capital
Past
Present
Future
Core activities
Indicators
IC Categories
1
5
2
3
4
Core competencies
Vision
Process Capital
Renewal & Development Capital
Financial Capital
Market CapitalHuman Capital
Past
Present
Future
Core activities
Indicators
IC Categories
1
5
2
3
4
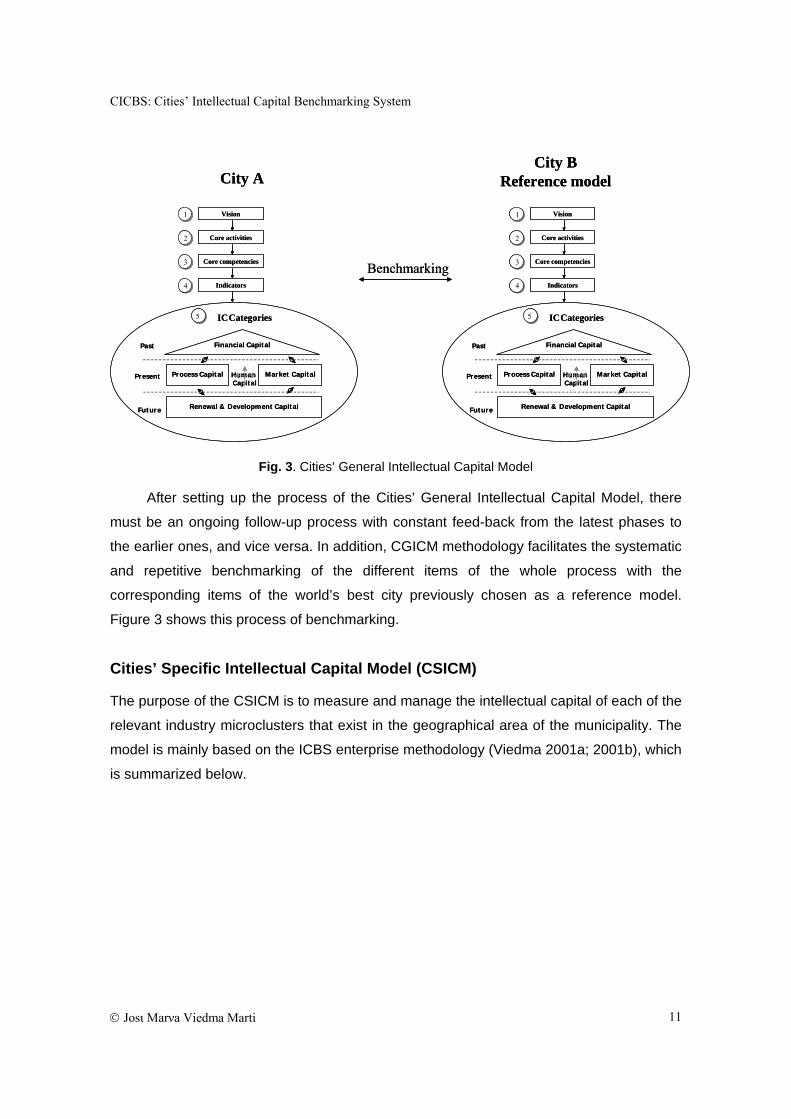
Fig. 3. Cities’ General Intellectual Capital Model
After setting up the process of the Cities’ General Intellectual Capital Model, there
must be an ongoing follow-up process with constant feed-back from the latest phases to
the earlier ones, and vice versa. In addition, CGICM methodology facilitates the systematic
and repetitive benchmarking of the different items of the whole process with the
corresponding items of the world’s best city previously chosen as a reference model.
Figure 3 shows this process of benchmarking.
Cities’ Specific Intellectual Capital Model (CSICM)
The purpose of the CSICM is to measure and manage the intellectual capital of each of the
relevant industry microclusters that exist in the geographical area of the municipality. The
model is mainly based on the ICBS enterprise methodology (Viedma 2001a; 2001b), which
is summarized below.
CICBS: Cities’ Intellectual Capital Benchmarking System
© Josι Marνa Viedma Marti 12
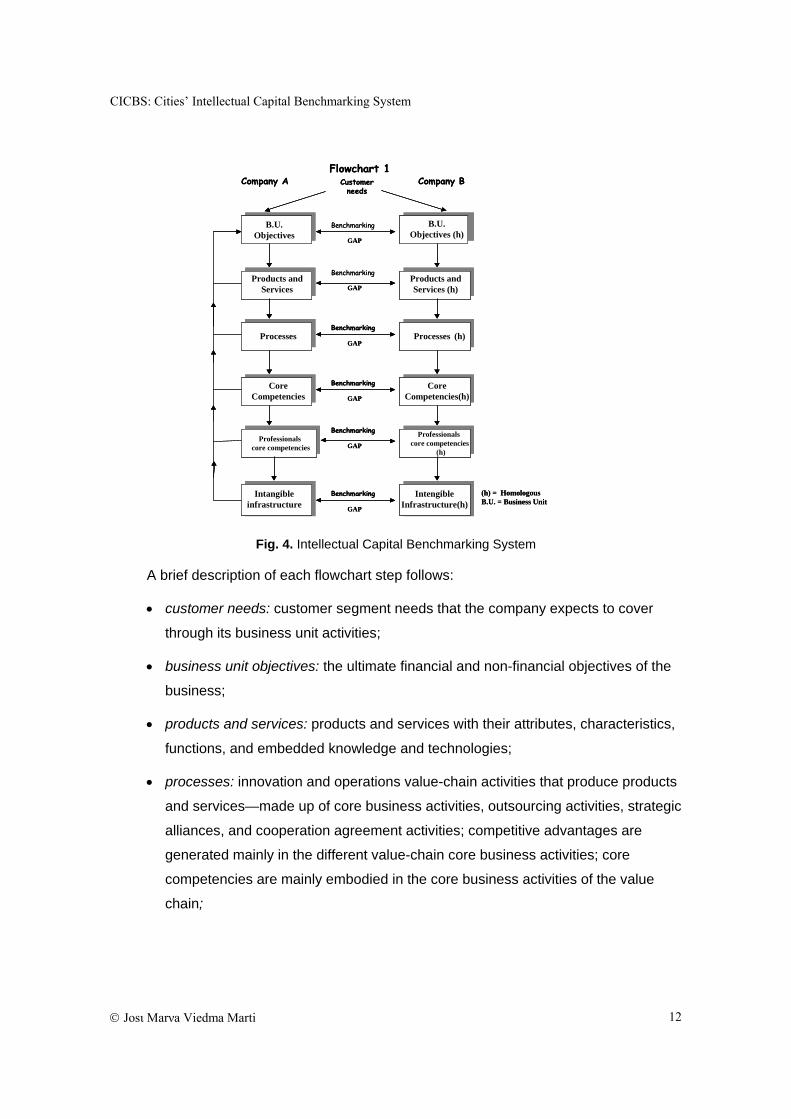
Fig. 4. Intellectual Capital Benchmarking System
A brief description of each flowchart step follows:
• customer needs: customer segment needs that the company expects to cover
through its business unit activities;
• business unit objectives: the ultimate financial and non-financial objectives of the
business;
• products and services: products and services with their attributes, characteristics,
functions, and embedded knowledge and technologies;
• processes: innovation and operations value-chain activities that produce products
and services—made up of core business activities, outsourcing activities, strategic
alliances, and cooperation agreement activities; competitive advantages are
generated mainly in the different value-chain core business activities; core
competencies are mainly embodied in the core business activities of the value
chain;
(h) = HomologousB.U. = Business Unit
Benchmarking
GAP
Benchmarking
GAP
Benchmarking
GAP
Benchmarking
GAP
Benchmarking
GAP
Benchmarking
GAP
B.U.Objectives
Products andServices
Processes Processes (h)
CoreCompetencies
Professionals core competencies (h)
Intangibleinfrastructure
B.U.Objectives (h)
Products andServices (h)
CoreCompetencies(h)
Professionals core competencies
IntengibleInfrastructure(h)
Company A Company BCustomerneeds
Flowchart 1
CICBS: Cities’ Intellectual Capital Benchmarking System
© Josι Marνa Viedma Marti 13
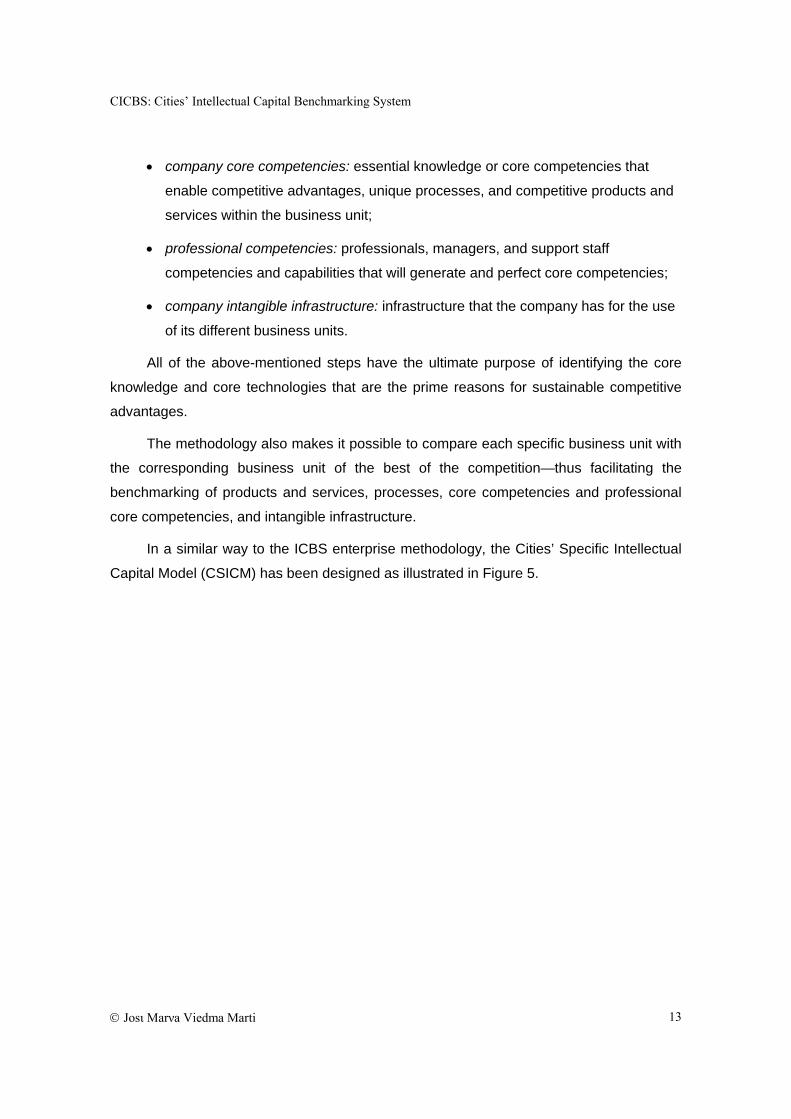
• company core competencies: essential knowledge or core competencies that
enable competitive advantages, unique processes, and competitive products and
services within the business unit;
• professional competencies: professionals, managers, and support staff
competencies and capabilities that will generate and perfect core competencies;
• company intangible infrastructure: infrastructure that the company has for the use
of its different business units.
All of the above-mentioned steps have the ultimate purpose of identifying the core
knowledge and core technologies that are the prime reasons for sustainable competitive
advantages.
The methodology also makes it possible to compare each specific business unit with
the corresponding business unit of the best of the competition—thus facilitating the
benchmarking of products and services, processes, core competencies and professional
core competencies, and intangible infrastructure.
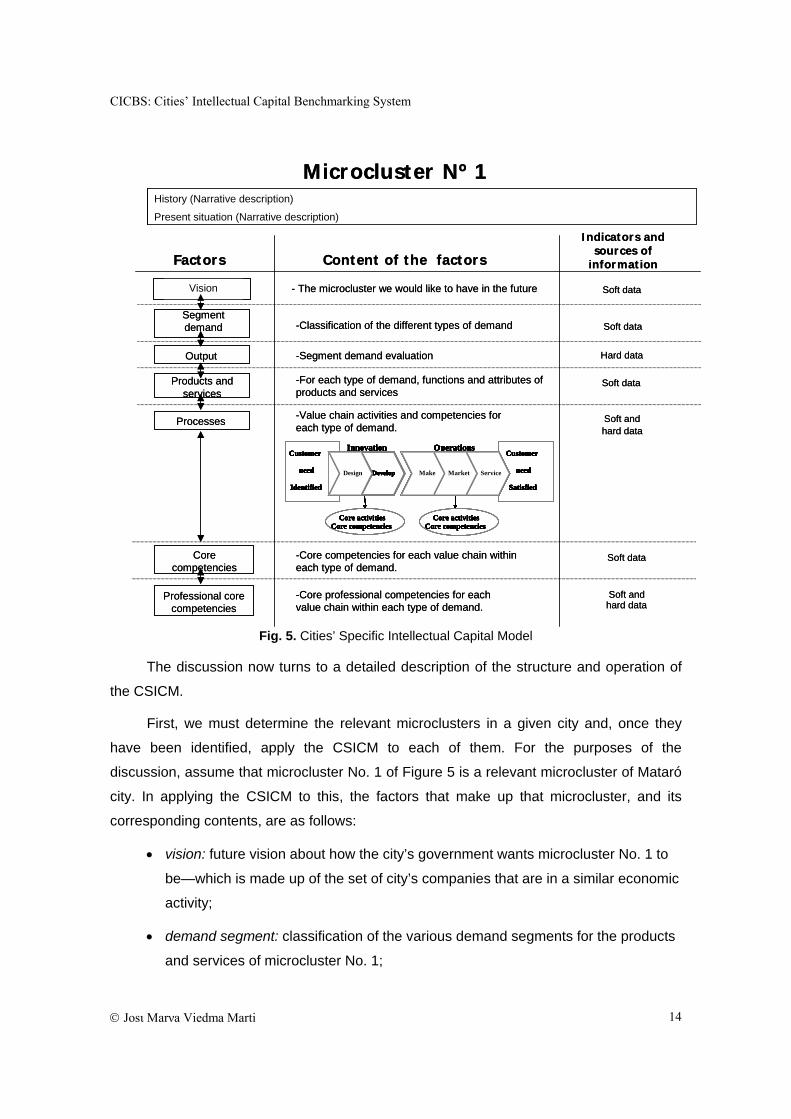
In a similar way to the ICBS enterprise methodology, the Cities’ Specific Intellectual
Capital Model (CSICM) has been designed as illustrated in Figure 5.
CICBS: Cities’ Intellectual Capital Benchmarking System
© Josι Marνa Viedma Marti 14
Fig. 5. Cities’ Specific Intellectual Capital Model
The discussion now turns to a detailed description of the structure and operation of
the CSICM.
First, we must determine the relevant microclusters in a given city and, once they
have been identified, apply the CSICM to each of them. For the purposes of the
discussion, assume that microcluster No. 1 of Figure 5 is a relevant microcluster of Mataró
city. In applying the CSICM to this, the factors that make up that microcluster, and its
corresponding contents, are as follows:
• vision: future vision about how the city’s government wants microcluster No. 1 to
be—which is made up of the set of city’s companies that are in a similar economic
activity;
• demand segment: classification of the various demand segments for the products
and services of microcluster No. 1;
Vision
History (Narrative description)
Present situation (Narrative description)
Microcluster Nº 1
Factors Content of the factorsIndicators and
sources of informat ion
-Classification of the different types of demand
-Segment demand evaluation
-For each type of demand, functions and attributes ofproducts and services
-Value chain activities and competencies for each type of demand.
-Core competencies for each value chain within each type of demand.
-Core professional competencies for each value chain within each type of demand.
- The microcluster we would like to have in the future
Professional corecompetencies
Segmentdemand
Output
Products andservices
Processes
Corecompetencies
Soft data
Hard data
Soft data
Soft data
Soft and
Soft and
Soft data
hard data
hard data
Customer
need
Identified
Customer
need
Satisfied
Innovation Operations
Core activitiesCore competencies
Core activitiesCore competencies
ServiceMarketMakeDevelopDesign
Customer
need
Identified
Customer
need
Satisfied
Innovation Operations
Core activitiesCore competencies
Core activitiesCore competencies
ServiceMarketMakeDevelopDesign
Customer
need
Identified
Customer
need
Satisfied
Innovation Operations
Core activitiesCore competencies
Core activitiesCore competencies
ServiceMarketMakeDevelopDesign
Customer
need
Identified
Customer
need
Satisfied
Innovation Operations
Core activitiesCore competencies
Core activitiesCore competencies
ServiceMarketMakeDevelopDesign
Vision
History (Narrative description)
Present situation (Narrative description)
History (Narrative description)
Present situation (Narrative description)
Microcluster Nº 1
Factors Content of the factorsIndicators and
sources of informat ion
-Classification of the different types of demand
-Segment demand evaluation
-For each type of demand, functions and attributes ofproducts and services
-Value chain activities and competencies for each type of demand.
-Core competencies for each value chain within each type of demand.
-Core professional competencies for each value chain within each type of demand.
- The microcluster we would like to have in the future
Professional corecompetencies
Segmentdemand
Output
Products andservices
Processes
Corecompetencies
Soft data
Hard data
Soft data
Soft data
Soft and
Soft and
Soft data
hard data
hard data
Customer
need
Identified
Customer
need
Satisfied
Innovation Operations
Core activitiesCore competencies
Core activitiesCore competencies
ServiceMarketMakeDevelopDesign
Customer
need
Identified
Customer
need
Satisfied
Innovation Operations
Core activitiesCore competencies
Core activitiesCore competencies
ServiceMarketMakeDevelopDesign
Customer
need
Identified
Customer
need
Satisfied
Innovation Operations
Core activitiesCore competencies
Core activitiesCore competencies
ServiceMarketMakeDevelopDesign
Customer
need
Identified
Customer
need
Satisfied
Innovation Operations
Core activitiesCore competencies
Core activitiesCore competencies
ServiceMarketMakeDevelopDesign
CICBS: Cities’ Intellectual Capital Benchmarking System
© Josι Marνa Viedma Marti 15
• output: appraisal of the different demand segments of the above factor;
• products and services: functions and attributes of products and services evaluated
for each corresponding demand segment;
• processes: operation and innovation value chains analyzed for each demand
segment to identify and value each of the value chains, the core activities, and the
competencies that support them;
• core competencies: consideration of the competencies that support the core
activities of both value chains—core competencies thus being determined for
each demand type and value chain through a process of synthesis;
• professional core competencies: identification and evaluation of each value chain
and demand type, including which professionals are required, and to what extent
they make the existence and development of the firm core competencies possible.
The identification of the factors in a specific microcluster is made through primary
and secondary information sources. Among the primary sources, questionnaires to the
microcluster’s firms and experts are especially relevant.
The indicators used to measure and manage the factors are obtained by choosing,
from the primary and secondary information sources, the ones that best describe the
factors content.
As was the case in the ICBS methodology, if the model is considered as a process,
all of the above-mentioned factors or steps also have the ultimate purpose of identifying
the core knowledge and core technologies that are the prime reason for the sustainable
competitive advantages of the microcluster.
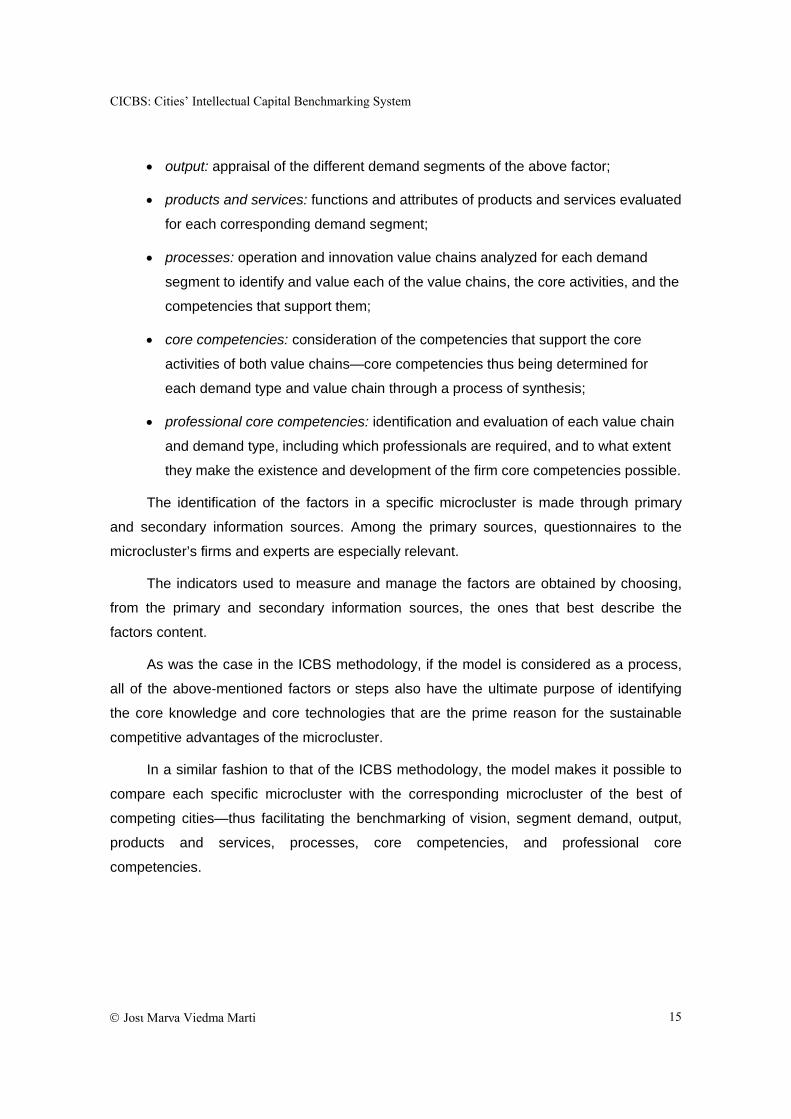
In a similar fashion to that of the ICBS methodology, the model makes it possible to
compare each specific microcluster with the corresponding microcluster of the best of
competing cities—thus facilitating the benchmarking of vision, segment demand, output,
products and services, processes, core competencies, and professional core
competencies.
CICBS: Cities’ Intellectual Capital Benchmarking System
© Josι Marνa Viedma Marti 16
Fig 6. Benchmarking the Specific Intellectual Capital of Cities’ Microclusters
Figure 6 depicts the benchmarking process of the specific intellectual capital of cities’
microclusters.
0 20 40 60 80 100
Reliability index
-3 -2 -1 0 1 2 3-3-3 -2-2 -1-1 00 11 22 33-3 -2 -1 0 1 2 3-3-3 -2-2 -1-1 00 11 22 33
1. Question “A”
15. Answer “Z”
> <n/c
Answer precision> <n/c
Answer precision>80%<50%
> <n/c
Answer precision> <n/c
Answer precision>80%<50%
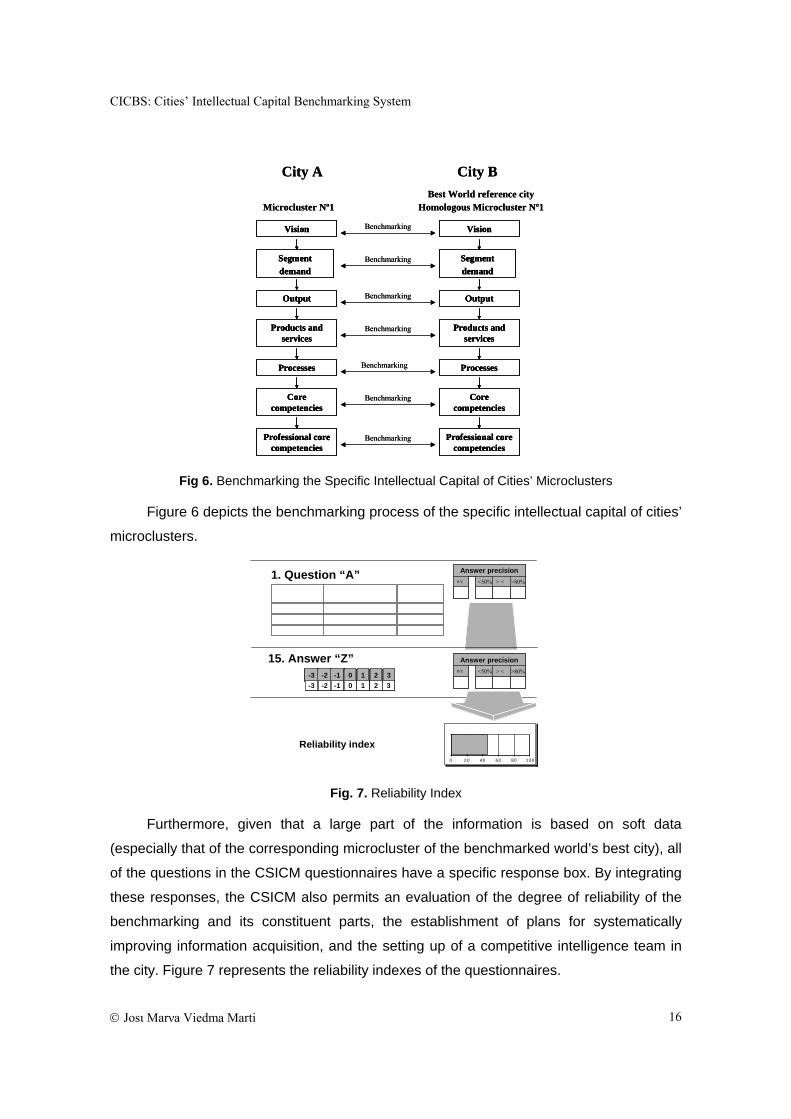
Fig. 7. Reliability Index
Furthermore, given that a large part of the information is based on soft data
(especially that of the corresponding microcluster of the benchmarked world’s best city), all
of the questions in the CSICM questionnaires have a specific response box. By integrating
these responses, the CSICM also permits an evaluation of the degree of reliability of the
benchmarking and its constituent parts, the establishment of plans for systematically
improving information acquisition, and the setting up of a competitive intelligence team in
the city. Figure 7 represents the reliability indexes of the questionnaires.
Segmentdemand
Output
Products and services
Processes
Core competencies
Professional core competencies
Vision
Segmentdemand
Output
Products and services
Processes
Core competencies
Professional core competencies
Vision
Microcluster Nº1 Homologous Microcluster Nº1Best World reference city
City A City B
Benchmarking
Benchmarking
Benchmarking
Benchmarking
Benchmarking
Benchmarking
Benchmarking
Segmentdemand
Output
Products and services
Processes
Core competencies
Professional core competencies
Vision
Segmentdemand
Output
Products and services
Processes
Core competencies
Professional core competencies
Vision
Segmentdemand
Output
Products and services
Processes
Core competencies
Professional core competencies
Vision
Segmentdemand
Output
Products and services
Processes
Core competencies
Professional core competencies
Vision
Microcluster Nº1 Homologous Microcluster Nº1Best World reference city
City A City B
Benchmarking
Benchmarking
Benchmarking
Benchmarking
Benchmarking
Benchmarking
Benchmarking
CICBS: Cities’ Intellectual Capital Benchmarking System
© Josι Marνa Viedma Marti 17
A practical application in the city of Mataró
The city of Mataró is located in the north-east of Spain or, more precisely, in the
autonomous community of Catalonia. It has 104,880 inhabitants in a territory of 22.6
square kilometres, and is situated on the coast, in the centre of the so called
‘Mediterranean arch’. Only 28 kilometres north of Barcelona, Mataró is part of the
metropolitan region of Barcelona, and is the capital of the Maresme region with a
population close to 300,000 and a territory of 397 square kilometres. Maresme is an area
of high economic and tourist development.
In recent years the government of Mataró has pioneered the development and
implementation of several initiatives to foster information and telecommunications
technologies in the city and to develop and share the most advanced knowledge in
technology and management. These initiatives are rooted in two macroprojects:
• “Master plan for the Information Society in Mataró 1999” (Ajuntament de Mataró,
1999); and
• “Mataró, Knowledge City, January 2002” (Tecnocampus Mataró, 2002).
To put these macroprojects into practice, new institutions have been created
(Tecnocampus Mataró), and others already in existence have been strengthened. These
latter have included Institut Municipal de Promoció Económica de Mataró (IMPEM),
Promoció Urbanistica de Mataró S.A. (PUMSA), Escola Universitaria Politécnica de Mataró
(EUPM), and Centre de Tecnologia Empresarial de Mataró-Maresme (CETEMMSA).
These macroprojects are the nearest antecedents of the ICMM project (Intellectual
Capital Management of the City of Mataró) that is described in this section.
Therefore, the primary objective of the ICMM project is to finalize and coordinate the
different initiatives of Mataró in orientating the city towards the information and knowledge
society. The intention is to achieve this through the conception, design, and
implementation of a methodology on the measurement and management of the city’s
intellectual capital. The ICMM project has two clear stages:
• the conception and design of the cities’ intellectual capital management model (as
described earlier in the present paper); and
CICBS: Cities’ Intellectual Capital Benchmarking System
© Josι Marνa Viedma Marti 18
• adaptation and implementation of that model to the specific characteristics of the
city of Mataró.
This second phase is described below. Before doing so, the present paper describes
the “Cities’ General Intellectual Capital Model”, and follows this with the “Cities’ Specific
Intellectual Capital Model”.
Cities’ General Intellectual Capital Model (CGICM)
For the initiation of the Intellectual Capital Platform, which is common to all the relevant
economic activities of Mataró city, the available information from the two previously
mentioned macroprojects was used, as well as data provided by:
• the observatory of Mataró’s information society;
• the Municipal Institute for Economic Promotion.
Taken together, these sources of information have allowed the determination of the
content of Phases 1 to 5 of the model. That is, the future vision of the city, the necessary
activities and projects to accomplish the vision, the necessary core competencies to carry
out the core activities, and the indicators to appraise the activities and competencies have
been determined. Then, the excellence of the intellectual capital general platform
constructed from the indicators of the city of Mataró are compared with those of cities
considered to be more advanced in terms of information and telecommunications
technologies and of shared knowledge management. In this specific case, Treviso was
chosen as the reference city for benchmarking.

CICBS: Cities’ Intellectual Capital Benchmarking System
© Josι Marνa Viedma Marti 19
Fig. 8. Mataró General Intellectual Capital Balance Sheet
The first abridged balance sheet obtained from “Mataró General Intellectual
Capital” is depicted in Figure 8.
Cities’ Specific Intellectual Capital Model
For the initiation of the Mataró intellectual capital management specific model, the relevant
“industry macroclusters” were first determined, as follows:
• textile (knitwear);
• construction;
• retail trade; and
• education and training.
The identification of the relevant microclusters took into account a large number of
indicators. However, special consideration was given to the extent of employment in each
case. Given that the textile microcluster turned out to be the most important (with 23% of
the working population), the balance of this article refers exclusively to it.
Evaluation of the CSIC model factors was thus made through ad hoc questionnaires
to experts and companies from the textile microcluster of Mataró city. These
questionnaires allowed an identification and evaluation of the factors content. The first
Mataró General Intellectual Capital Balance sheet PERIOD VALUE MEASURE UNIT
FINANCIAL CAPITALGDP (market prices) 1991 817,81 1996 1064,06 Millions of eurosHousehold's disposable income 1991 6.022,7 1996 8.550,6 euros per capitaGDP per capita 1991 8058 1996 10430 eurosHUMAN CAPITALUniversity/College + secondary studies 1991 17,14% 1996 22,1% PercentageHabitual internet users october-1998 11% september 2001 27,9% PercentagePercentage of qualified workers 1991 26,50% PercentageActivity rate 1991 56,98% 1996 55,67% PercentageGini Index 1989 0,387 1994 0,368 IndexPROCESS CAPITALService sector development PercentageSalaried workers in the high knowledge sector (%) 1st quater 2002 37,7% PercentagePercentage of firms with internet connection october-1998 24,1% september 2001 66,7% PercentageMARKET CAPITALSelf-containment 1991 79,53% 1996 72,28% PercentageSelf-sufficiency 1991 81,91% 1996 75,93% PercentageExports/imports ratio 2000 0,68 RatioRENOVATION CAPITALYouth rate 1996 16,99% 1 january 2002 14,21% PercentageNew firms registered for taxation 1997 1r quater 2002 3.382 Firms
PREVIOUS VALUE
PREVIOUS PERIOD DIVISIONS
CICBS
CICBS: Cities’ Intellectual Capital Benchmarking System
© Josι Marνa Viedma Marti 20
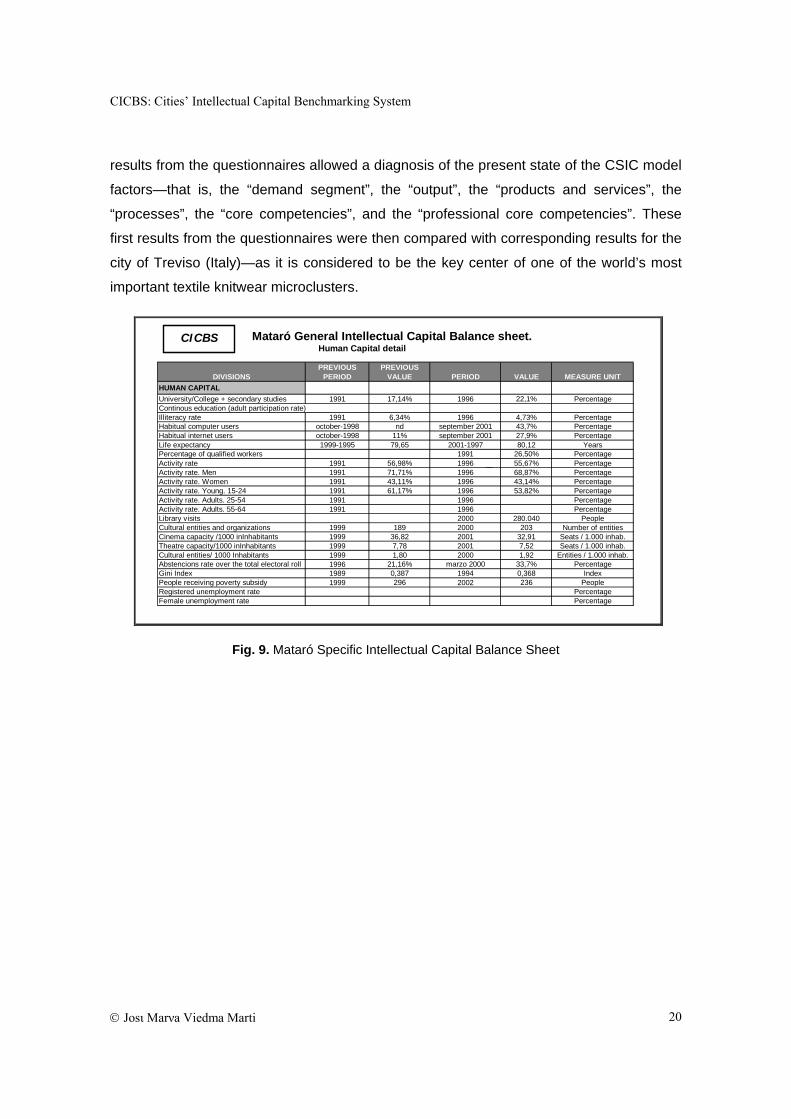
results from the questionnaires allowed a diagnosis of the present state of the CSIC model
factors—that is, the “demand segment”, the “output”, the “products and services”, the
“processes”, the “core competencies”, and the “professional core competencies”. These
first results from the questionnaires were then compared with corresponding results for the
city of Treviso (Italy)—as it is considered to be the key center of one of the world’s most
important textile knitwear microclusters.
Fig. 9. Mataró Specific Intellectual Capital Balance Sheet
Mataró General Intellectual Capital Balance sheet. Human Capital detail
HUMAN CAPITALUniversity/College + secondary studies 1991 17,14% 1996 22,1% PercentageContinous education (adult participation rate)Illiteracy rate 1991 6,34% 1996 4,73% PercentageHabitual computer users october-1998 nd september 2001 43,7% PercentageHabitual internet users october-1998 11% september 2001 27,9% PercentageLife expectancy 1999-1995 79,65 2001-1997 80,12 YearsPercentage of qualified workers 1991 26,50% PercentageActivity rate 1991 56,98% 1996 55,67% PercentageActivity rate. Men 1991 71,71% 1996 68,87% PercentageActivity rate. Women 1991 43,11% 1996 43,14% PercentageActivity rate. Young. 15-24 1991 61,17% 1996 53,82% PercentageActivity rate. Adults. 25-54 1991 1996 PercentageActivity rate. Adults. 55-64 1991 1996 PercentageLibrary visits 2000 280.040 PeopleCultural entities and organizations 1999 189 2000 203 Number of entitiesCinema capacity /1000 inInhabitants 1999 36,82 2001 32,91 Seats / 1.000 inhab.Theatre capacity/1000 inInhabitants 1999 7,78 2001 7,52 Seats / 1.000 inhab.Cultural entities/ 1000 Inhabitants 1999 1,80 2000 1,92 Entities / 1.000 inhab.Abstencions rate over the total electoral roll 1996 21,16% marzo 2000 33,7% PercentageGini Index 1989 0,387 1994 0,368 IndexPeople receiving poverty subsidy 1999 296 2002 236 PeopleRegistered unemployment rate PercentageFemale unemployment rate Percentage
PREVIOUS PERIOD PERIODDIVISIONS VALUE MEASURE UNIT
PREVIOUS VALUE
CICBS
CICBS: Cities’ Intellectual Capital Benchmarking System
© Josι Marνa Viedma Marti 21
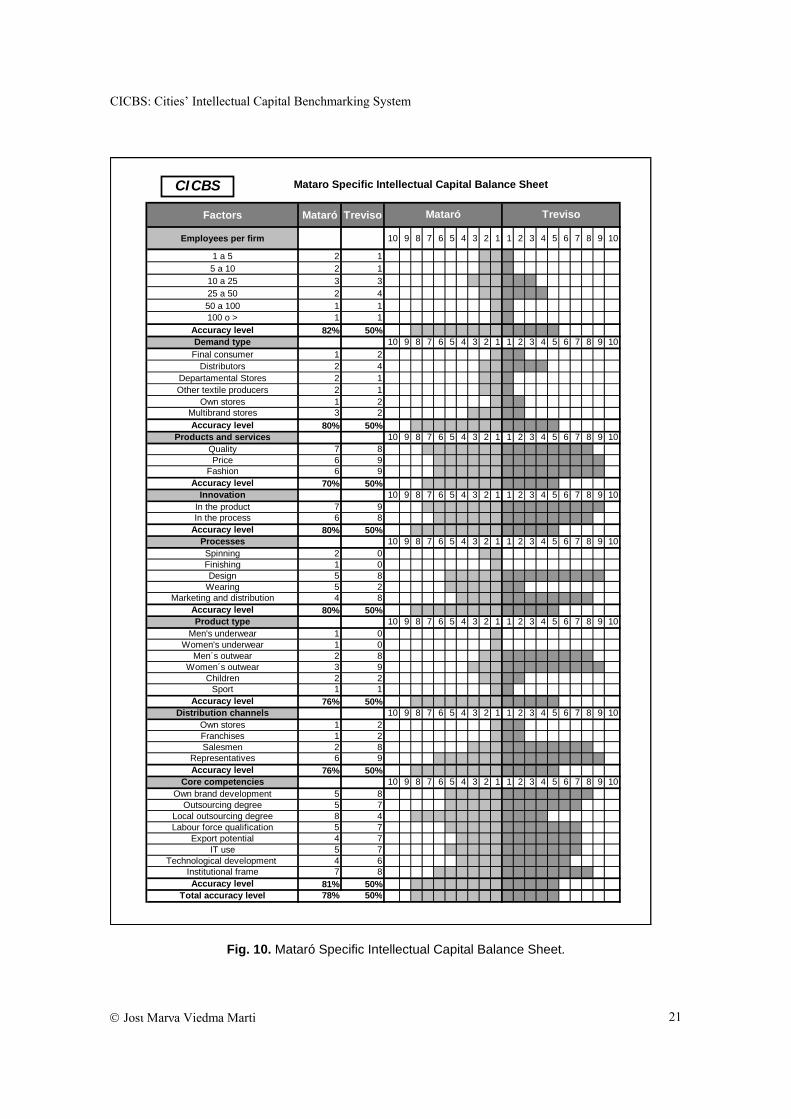
Fig. 10. Mataró Specific Intellectual Capital Balance Sheet.
Factors Mataró Treviso
Employees per firm 10 9 8 7 6 5 4 3 2 1 1 2 3 4 5 6 7 8 9 10
1 a 5 2 15 a 10 2 1
10 a 25 3 325 a 50 2 450 a 100 1 1100 o > 1 1
Accuracy level 82% 50%Demand type 10 9 8 7 6 5 4 3 2 1 1 2 3 4 5 6 7 8 9 10
Final consumer 1 2Distributors 2 4
Departamental Stores 2 1Other textile producers 2 1
Own stores 1 2Multibrand stores 3 2Accuracy level 80% 50%
Products and services 10 9 8 7 6 5 4 3 2 1 1 2 3 4 5 6 7 8 9 10Quality 7 8Price 6 9
Fashion 6 9Accuracy level 70% 50%
Innovation 10 9 8 7 6 5 4 3 2 1 1 2 3 4 5 6 7 8 9 10In the product 7 9In the process 6 8
Accuracy level 80% 50%Processes 10 9 8 7 6 5 4 3 2 1 1 2 3 4 5 6 7 8 9 10Spinning 2 0Finishing 1 0Design 5 8
Wearing 5 2Marketing and distribution 4 8
Accuracy level 80% 50%Product type 10 9 8 7 6 5 4 3 2 1 1 2 3 4 5 6 7 8 9 10
Men's underwear 1 0Women's underwear 1 0
Men´s outwear 2 8Women´s outwear 3 9
Children 2 2Sport 1 1
Accuracy level 76% 50%Distribution channels 10 9 8 7 6 5 4 3 2 1 1 2 3 4 5 6 7 8 9 10
Own stores 1 2Franchises 1 2Salesmen 2 8
Representatives 6 9Accuracy level 76% 50%
Core competencies 10 9 8 7 6 5 4 3 2 1 1 2 3 4 5 6 7 8 9 10Own brand development 5 8
Outsourcing degree 5 7Local outsourcing degree 8 4Labour force qualification 5 7
Export potential 4 7IT use 5 7
Technological development 4 6Institutional frame 7 8Accuracy level 81% 50%
Total accuracy level 78% 50%
Mataró Treviso
Mataro Specific Intellectual Capital Balance SheetCICBS
CICBS: Cities’ Intellectual Capital Benchmarking System
© Josι Marνa Viedma Marti 22
The first abridged balance sheet obtained from “Mataró Specific Intellectual Capital” is
depicted in Figure 9 and 10.
Conclusions
City governments have to make important decisions on the future of their communities. In
the past, the vision, objectives, and goals of cities have been determined mainly by
considering tangible assets as the main factors in determining prosperity. However, in the
knowledge economy, the role of intangible assets in wealth creation has become
fundamental. As a result, some local communities have initiated strategic plans to develop
new information technologies and collective knowledge.
However, these plans all lack coordination and continuity. More significantly, they
lack an intangible assets framework that allows navigation from the present situation to the
future vision of the city.
To fill this gap the present paper has presented a model and a framework especially
developed for measuring and managing the intellectual capital of cities. The theoretical
background and foundations of the model have been carefully explained. Essentially, the
City’s Intellectual Capital Model has two different approaches. The first approach—Cities’
General Intellectual Capital Model—is a transversal approach that covers all economic
activities of the city and is mainly based on the nations’ Navigator model of Edvinsson and
Malone (1997) and Bontis (2002). The second approach—Cities’ Specific Intellectual
Capital Model—is a longitudinal approach that deals specifically with each city’s relevant
economic activity or relevant economic microcluster. The Cities’ Specific Intellectual
Capital Model is mainly based on Viedma’s (2001a; 2001b) ICBS Model. Both approaches
use benchmarking techniques when building the future vision of the city, and the process
of benchmarking is carried out using the world’s best cities as reference models.
After the presentation of the models, the paper has dealt with the practical
application of the Cities’ Intellectual Capital Model to the city of Mataró, and has given the
broad lines of the main steps of the implementation process, together with details of the
first cities’ intellectual capital report.
In presenting this pioneering effort, it is hoped that new productive research on
managing intangibles in municipalities will be encouraged.
CICBS: Cities’ Intellectual Capital Benchmarking System
© Josι Marνa Viedma Marti 23
References
Ajuntament de Mataró (1999) “Plan director para la sociedad de la información en Mataró 1999”, <www.infomataro.net/sim>.
Andriessen, Daniel (2001), “Weightless Wealth”, paper for the 4th World Congress on the Management of Intellectual Capital, McMaster University. January 17–19, Hamilton, Ontario, Canada, pp. 1–10.
Bontis, Nick (2002), “National Intellectual Capital Index: Intellectual Capital Development in the Arab Region”, presented at the 5th World Congress on Intellectual Capital, McMaster University, Michael G. De Groote School of Business, Hamilton, Ontario, Canada,. January 10–12, 2002.
Edvinsson Leif and Malone Michael S. (1997), Intellectual Capital, Harper Business, New York, pp. 189–197.
Pasher, E. (1999), The Intellectual Capital of the State of Israel, Kal Press, Herzlia Pituach, Israel.
Rembe, A. (1999), Invest in Sweden: Report 1999, Halls Offset AB, Stockholm, Sweden.
Roos, Johan, Roos, Göran, Edvinson, Leif and Dragmetti, Nicola C. (1997), Intellectual Capital. Navigating in the New Business Landscape, MacMillan Press Ltd, pp. 59–78.
Tecnocampus Mataró (2002), “Mataró, ciudad del conocimiento. Enero 2002”, <www.tecnocampus.com>.
Viedma, J.M. (2001a), “ICBS Innovation Capability Benchmarking System”, in World Congress on Intellectual Capital Readings, Butterworth Heinemann, pp. 243–65.
Viedma, J.M. (2001b), “ICBS Intellectual Capital Benchmarking System”, Journal of Intellectual Capital, MCB University Press, England. pp. 148–64.