a market of over one billion dollars
TRANSCRIPT

a market of over oNe billioN dollarsstudy oN the behaviours aNd attitudes of people with a physical disability with respect to tourism, culture aNd traNsportatioN iN Québec ⁄ ⁄ ⁄ 2011 ⁄ ⁄ ⁄ study summary
2 study on the behaviours and attitudes of people with a physical disability ⁄ ⁄ ⁄ 2011
study coNducted bylouis-philippe barbeau, Senior Advisor, Marketing Research, in association with corine laberge and sylvain Masse of SOM Research & Surveys
kéroul would like to thaNk•for their financial support and expertise
› the office des personnes handicapées du Québec › the Ministère du tourisme du Québec › the Ministère des transports du Québec › the Ministère de la culture, des communications et de la condition féminine du Québec
•participating organizations › Moelle épinière et motricité Québec › confédération des organismes de personnes handicapées du Québec › regroupement des aveugles et amblyopes du Québec
•steering committee members and other contributors › thomas antil, Direction de l’évaluation et de l’analyse stratégique, Tourisme Québec › Jean-rené breton, Direction de la coordination des programmes, Ministère de la Culture, des Communications et de la Condition féminine du Québec
› sébastien Gagnon, Direction des statistiques économiques et du développement durable, Institut de la statistique du Québec › Marie-hélène lecourt, Office des personnes handicapées du Québec › Mireille Manavella, Regroupement des aveugles et amblyopes du Québec › lyne Ménard, Kéroul › Karine scrosati, Direction du transport terrestre des personnes, Transports Québec › anita vassiliou, Moelle épinière et motricité Québec
•and the 730 survey respondents
study summarypreparatioN aNd revisioN ⁄ ⁄ ⁄
•lyne Ménard•rené Kirouac
Graphic desiGN ⁄ ⁄ ⁄
•Krafix
a full version of the report is available at www.keroul.qc.ca
interested individuals and organizations may reproduce parts of the study provided the source is clearly cited.Kéroul, 2011. all rights reserved.

3STuDy SuMMARy ⁄ ⁄ ⁄ Kéroul
table of coNteNts iNtroductioN ⁄ ⁄ ⁄ . . . . . . . . . . . . . . . . . . . . . . . . . . . . . . . . . . . . . . . . . . . . . . . . . . . . . . . . . . . . . . . . . . . . . . . . . . . . . . . . . . . 5
1 . obJectives ⁄ ⁄ ⁄ . . . . . . . . . . . . . . . . . . . . . . . . . . . . . . . . . . . . . . . . . . . . . . . . . . . . . . . . . . . . . . . . . . . . . . . . . . . . . . . . . . 6
2 . methodoloGy ⁄ ⁄ ⁄ . . . . . . . . . . . . . . . . . . . . . . . . . . . . . . . . . . . . . . . . . . . . . . . . . . . . . . . . . . . . . . . . . . . . . . . . . . . . . . . . 7
3 . aNalysis of the results ⁄ ⁄ ⁄ . . . . . . . . . . . . . . . . . . . . . . . . . . . . . . . . . . . . . . . . . . . . . . . . . . . . . . . . . . . . . . . . . . . . . . 7
3 .1 respoNdeNt profiles ⁄ ⁄ ⁄ . . . . . . . . . . . . . . . . . . . . . . . . . . . . . . . . . . . . . . . . . . . . . . . . . . . . . . . . . . . . . . . . . . . . 7
3 .2 culture ⁄ ⁄ ⁄ . . . . . . . . . . . . . . . . . . . . . . . . . . . . . . . . . . . . . . . . . . . . . . . . . . . . . . . . . . . . . . . . . . . . . . . . . . . . . . . . 9
sites visited in respondents’ own city or municipality in the previous yearvisiting frequency for local sites/cultural activitiessatisfaction with accessibilitywith whom were these visits carried out?
3 .3 restauraNt iNdustry ⁄ ⁄ ⁄ . . . . . . . . . . . . . . . . . . . . . . . . . . . . . . . . . . . . . . . . . . . . . . . . . . . . . . . . . . . . . . . . . . . 10
local restaurant patronage rates in the past 12 monthsrestaurant patronage during the most recent trip
3 .4 traNsportatioN ⁄ ⁄ ⁄ . . . . . . . . . . . . . . . . . . . . . . . . . . . . . . . . . . . . . . . . . . . . . . . . . . . . . . . . . . . . . . . . . . . . . . . . 11
usage frequency of different modes of transportsatisfaction with the accessibility of different modes of transportparatransit: awareness and perceptionreasons for not using paratransitcompanion cardsintercity transport
3 .5 tourism ⁄ ⁄ ⁄ . . . . . . . . . . . . . . . . . . . . . . . . . . . . . . . . . . . . . . . . . . . . . . . . . . . . . . . . . . . . . . . . . . . . . . . . . . . . . . . 14
tourist tripsnumber of trips taken in the last 24 monthsregions visitedreasons for not having travelled in the last 12 monthsMost recent destination within Québeclength of stay of most recent tripprimary reason for travellingparticipation in activities during the triptravel companions, modes of transport and accommodationaccess to adapted servicesaccessibility and awareness of special servicesinformation sourcesvisitor satisfactionfuture travel plans
ecoNomic beNefits iN Québec ⁄ ⁄ ⁄ . . . . . . . . . . . . . . . . . . . . . . . . . . . . . . . . . . . . . . . . . . . . . . . . . . . . . . . . . . . . . . . . 17
total spending during most recent tripoverall economic figureseconomic impact for Québec
•travel within Québec•value added at market prices•figures to be multiplied by 2 and more•contributions from foreign visitors

4 study on the behaviours and attitudes of people with a physical disability ⁄ ⁄ ⁄ 2011

5STuDy SuMMARy ⁄ ⁄ ⁄ Kéroul
iNtroductioNa billioN dollar plus market
Québec has more than 800,000 persons with physical disabilities. and the number is growing, notably because of the ageing demographic, which is estimated to represent 10-15% of the population.
the findings of a study conducted by louis-philippe barbeau, in conjunction with the soM survey firm, have helped place an economic value on the tourism and cultural activities in which this vast pool of clients participates: more than one billion dollars a year!
the information compiled provides an indication of the impact on commercial accommodations, tourism and cultural establishments, events, regions and modes of transportation, to name but a few, thus providing a wealth of information for those who want to take advantage of such business opportunities.
projects are already in place to better serve persons with disabilities. the following is a non-exhaustive list:
•The Accessible Road, a joint project with more than 170 tourism and cultural establishments in 13 regions of Québec which have adapted their sites to ensure safe access for all. see http://www.larouteaccessible.com/en/.
•the interdepartmental round table on accessible tourism and culture for persons with disabilities, which brings together 18 government department representatives every two years.
during the presentation of a report published in conjunction with the world bank and unveiled in toronto in January 2012, world health organ-ization spokesperson tom shakespeare pointed out that “despite steps taken in canada to improve accessibility, there is still much work to be done.”
apart from the social factor, which in itself is a valid reason to take action, the study focuses on the economic interest for businesses and governments to adapt their products and services with a win-win perspective.
we invite you to read the findings of the study and to bear these in mind when carrying out your daily business activities and future plans.
isabelle ducharme andré leclercchairwoman, board of directors chief executive officerKéroul Kéroul

6 study on the behaviours and attitudes of people with a physical disability ⁄ ⁄ ⁄ 2011
1 . obJectivesin 2001, Kéroul published a study on the tourism market for people with a physical disability. ten years later, we’re back at it, this time broad-ening the spectrum as we examine not only tourism, but also culture and transportation. this study aims to:
•provide a detailed socio-economic profile of people with physical disabilities, taking into account the various forms and degrees of these disabilities;
•present a full and reliable report on the travels of people with physical disabilities in light of their socio-economic characteristics and degree of mobility;
•assess the perceptions and attitudes of people with physical disabilities with regard to: › their behaviours and views toward tourist sites and cultural activities in their own municipality or region; › their appreciation of accessibility and the available services in relation to their disability; › the modes of transport they use and to what degree they find these accessible; › their awareness of available paratransit services and how this may influence decisions to travel as well as choice of destination; › their experience in relation to transport, accommodation, restaurants, adapted services, etc.

7STuDy SuMMARy ⁄ ⁄ ⁄ Kéroul
2 . methodoloGytarGet populatioN ⁄ ⁄ ⁄
the target population was composed of persons aged 15 and up with physical disabilities. if subjects were unable to complete the telephone interview or web survey themselves, their primary caregivers replied for them.
this study, conducted in two parts, included four sample sources.
•telephone component . the sample was generated randomly from all valid telephone exchanges covering the study area, using soM’s contact software.
•internet component . three sources of samples were used in this section: › soM’s Gold panel › a panel from the firm research now › a sample of members of three associations for people with limited physical ability, i.e. Moelle épinière et motricité Québec, the confédération des organismes de personnes handicapées du Québec and the regroupement des aveugles et amblyopes du Montréal métropolitain
study sample ⁄ ⁄ ⁄
interviews completed
n telephone . . . . . . . . . . . . . . . . . . . . . . . . . . . . . . . . . . . . . . . 152 n soM panel. . . . . . . . . . . . . . . . . . . . . . . . . . . . . . . . . . . . . . . 210 n rn panel . . . . . . . . . . . . . . . . . . . . . . . . . . . . . . . . . . . . . . . . 210 n associations . . . . . . . . . . . . . . . . . . . . . . . . . . . . . . . . . . . . . 158 n total . . . . . . . . . . . . . . . . . . . . . . . . . . . . . . . . . . . . . . . . . . 730
with the exception of the associations, the survey was weighted by expanding the joint distribution of age and sex according to statistics canada’s 2006 Participation and Activity Limitation Survey (pals).
3 . aNalysis of the resultsIn the following pages, the results of each survey question are presented and discussed, taking into account the statistically significant differences between the various respondent sub-groups.
In some tables, percentages higher than the overall results are flagged with symbols, to quickly identify the sub-groups that stand out. Accordingly, the symbol >> indicates a relevant percentage that is significantly higher (at a 99% confidence level) than that observed in respondents overall. Conversely, a result marked << means the percentage for a given sub-group is significantly lower than the overall results. The symbols > and < indicate results that differ significantly from the overall findings, but at a lower confidence level (95%).
3 .1 respoNdeNt profiles
type of disability ⁄ ⁄ ⁄
hearing . . . . . . . . . . . . . . . . . . . . . . . . . . . . . . . . . . . . . . . . . .13.1% visual . . . . . . . . . . . . . . . . . . . . . . . . . . . . . . . . . . . . . . . . . . .10.6% Motor. . . . . . . . . . . . . . . . . . . . . . . . . . . . . . . . . . . . . . . . . . . .50.1% intellectual . . . . . . . . . . . . . . . . . . . . . . . . . . . . . . . . . . . . . . . . .4.8% arthritis . . . . . . . . . . . . . . . . . . . . . . . . . . . . . . . . . . . . . . . . . .23.2% obesity . . . . . . . . . . . . . . . . . . . . . . . . . . . . . . . . . . . . . . . . . .12.8% chronique fatigue. . . . . . . . . . . . . . . . . . . . . . . . . . . . . . . . . . .12.8% heart problems . . . . . . . . . . . . . . . . . . . . . . . . . . . . . . . . . . . .14.1% severe asthma . . . . . . . . . . . . . . . . . . . . . . . . . . . . . . . . . . . . . .5.9% other . . . . . . . . . . . . . . . . . . . . . . . . . . . . . . . . . . . . . . . . . . . .28.9% don’t know / no response . . . . . . . . . . . . . . . . . . . . . . . . . . . . .0.7%

8 study on the behaviours and attitudes of people with a physical disability ⁄ ⁄ ⁄ 2011
distributioN of the populatioN of people with physical disabilitiesBased on age and whether or not a technical device/aid is needed
overall aGe bracket
population 15-24 25-34 35-44 45-54 55-64 65 +
en (000) 731 34 56 80 170 199 189
reQuired to use a technical device or aid (%)
yes (%) 57 .2 54.2 51.1 56.9 47.2 < 51.3 64.8 >>No (%) 41 .6 45.8 48.9 40.4 51.2 > 48.1 + 34.0 <<No response 1 .2 — — 2.7 1.6 0.6 1.3
type of techNical device or aid ⁄ ⁄ ⁄(% included in the sample)
walking stick/cane . . . . . . . . . . . . . . . . . . . . . . . . . . . . . . . . .31.8% walker . . . . . . . . . . . . . . . . . . . . . . . . . . . . . . . . . . . . . . . . . .13.9% prosthetics, orthotics . . . . . . . . . . . . . . . . . . . . . . . . . . . . . . .13.4% Manually operated wheelchair . . . . . . . . . . . . . . . . . . . . . . . . .11.2% Motorized wheelchair . . . . . . . . . . . . . . . . . . . . . . . . . . . . . . . .4.9% three- or four-wheeled scooter . . . . . . . . . . . . . . . . . . . . . . . . .2.6% white cane . . . . . . . . . . . . . . . . . . . . . . . . . . . . . . . . . . . . . . . .2.5% assistance from another person . . . . . . . . . . . . . . . . . . . . . . . .1.7% crutches . . . . . . . . . . . . . . . . . . . . . . . . . . . . . . . . . . . . . . . . . .1.5% back support or leg brace . . . . . . . . . . . . . . . . . . . . . . . . . . . . .1.5% visual aid . . . . . . . . . . . . . . . . . . . . . . . . . . . . . . . . . . . . . . . . .0.7% Guide dog/service dog . . . . . . . . . . . . . . . . . . . . . . . . . . . . . . .0.6% other . . . . . . . . . . . . . . . . . . . . . . . . . . . . . . . . . . . . . . . . . . .12.3%
devices/aids used based oN aGe aNd sex ⁄ ⁄ ⁄ wheelchair motorized or Not, three- caNe/ wheeled overall crutches scooter walker other NoNe
(000) (%) (%) (%) (%) (%)
total 719 20 .9 11 8 .1 17 .6 42 .4
15-24 years 34 14.4 13.3 — 26.5 45.825-34 years 54 11.7 14.1 4.7 18.0 51.635-44 years 77 24.0 12.0 2.1 19.7 42.145-54 years 168 18.5 8.0 3.2 < 18.3 52.0 >55-64 years 198 23.9 8.5 5.2 14.0 48.465 years + 186 21.6 12.5 13.8 >> 17.6 34.6 <<
men 322 22.6 9.4 5.2 - 21.5 > 41.2women 397 19.5 12.3 10.5 + 14.5 < 43.3
ease or difficulty iN walkiNG, seeiNG or heariNG (%) ⁄ ⁄ ⁄
walkiNG
n very easy . . . . . . . . . . . . . . . . . . . . . . . . . . . . . . . . . . . . . . 9.4% n somewhat easy . . . . . . . . . . . . . . . . . . . . . . . . . . . . . . . . . .14.6% n somewhat difficult . . . . . . . . . . . . . . . . . . . . . . . . . . . . . . . .51.1% n very difficult. . . . . . . . . . . . . . . . . . . . . . . . . . . . . . . . . . . . .23.6% n dK / nr . . . . . . . . . . . . . . . . . . . . . . . . . . . . . . . . . . . . . . . . .1.2%

9STuDy SuMMARy ⁄ ⁄ ⁄ Kéroul
seeiNG
n very easy . . . . . . . . . . . . . . . . . . . . . . . . . . . . . . . . . . . . . 48.3% n somewhat easy . . . . . . . . . . . . . . . . . . . . . . . . . . . . . . . . . .29.0% n somewhat difficult . . . . . . . . . . . . . . . . . . . . . . . . . . . . . . . .13.3% n very difficult. . . . . . . . . . . . . . . . . . . . . . . . . . . . . . . . . . . . . .7.9% n dK / nr . . . . . . . . . . . . . . . . . . . . . . . . . . . . . . . . . . . . . . . . .1.6%
heariNG
n very easy . . . . . . . . . . . . . . . . . . . . . . . . . . . . . . . . . . . . . 51.9% n somewhat easy . . . . . . . . . . . . . . . . . . . . . . . . . . . . . . . . . .26.5% n somewhat difficult . . . . . . . . . . . . . . . . . . . . . . . . . . . . . . . .17.7% n very difficult. . . . . . . . . . . . . . . . . . . . . . . . . . . . . . . . . . . . . .2.3% n dK / nr . . . . . . . . . . . . . . . . . . . . . . . . . . . . . . . . . . . . . . . . .1.6%
3 .2 culture › participatioN iN specific local cultural activities iN the past 12 moNths
sites visited iN respoNdeNts’ home city or muNicipality iN the past 12 moNths (%) ⁄ ⁄ ⁄
cinema . . . . . . . . . . . . . . . . . . . . . . . . . . . . . . . . . . . . . . . . . . . 46% bookstore . . . . . . . . . . . . . . . . . . . . . . . . . . . . . . . . . . . . . . . . . 43% celebration of festival. . . . . . . . . . . . . . . . . . . . . . . . . . . . . . . . . 42% library (municipal, school or other) . . . . . . . . . . . . . . . . . . . . . . 39% performance hall (music, comedy). . . . . . . . . . . . . . . . . . . . . . . 37% theatre . . . . . . . . . . . . . . . . . . . . . . . . . . . . . . . . . . . . . . . . . . . 26% historical/heritage site . . . . . . . . . . . . . . . . . . . . . . . . . . . . . . . . 22% Museum . . . . . . . . . . . . . . . . . . . . . . . . . . . . . . . . . . . . . . . . . . 21% art or craft gallery . . . . . . . . . . . . . . . . . . . . . . . . . . . . . . . . . . . 18% book fair / craft fair . . . . . . . . . . . . . . . . . . . . . . . . . . . . . . . . . . 16% archive centre . . . . . . . . . . . . . . . . . . . . . . . . . . . . . . . . . . . . . . . 7%
see also “tourist trips” regarding participation in cultural activities during the most recent trip.
visitiNG freQueNcy for local sites/cultural activities ⁄ ⁄ ⁄
sites visited (%) Number of visits
0 1 2 3 to 5 6 + dK/nr
theatre 73.3 12.0 5.5 5.3 2.9 1.1cinema 53.4 11.5 9.1 14.7 10.7 0.7performance hall 62.3 15.0 9.6 8.8 3.4 1.0library 60.3 8.1 7.4 8.8 14.3 1.0art gallery 80.8 8.8 3.6 4.1 1.6 1.2book fair 83.2 9.3 4.0 2.0 0.5 1.0festival 59.4 18.1 11.0 6.6 3.6 1.4Museum 77.7 10.4 5.5 4.4 0.7 1.2historical site 76.4 11.3 5.2 4.1 1.3 1.6archive centre 90.3 2.8 1.7 1.5 0.7 2.9bookstore 56.4 8.3 10.6 14.4 9.3 1.0

10 study on the behaviours and attitudes of people with a physical disability ⁄ ⁄ ⁄ 2011
satisfactioN with accessibility ⁄ ⁄ ⁄Evaluation criteria for all places visited
site access facilitated by physical layout/techNical desiGN
n very satisfied . . . . . . . . . . . . . . . . . . . . . . . . . . . . . . . . . . . .35.4% n somewhat satisfied . . . . . . . . . . . . . . . . . . . . . . . . . . . . . . .47.7% n somewhat dissatisfied . . . . . . . . . . . . . . . . . . . . . . . . . . . . . . 10% n very dissatisfied . . . . . . . . . . . . . . . . . . . . . . . . . . . . . . . . . .2.9% n don’t know . . . . . . . . . . . . . . . . . . . . . . . . . . . . . . . . . . . . . .4.1%
availability of iNformatioN/commuNicatioN tools
n very satisfied . . . . . . . . . . . . . . . . . . . . . . . . . . . . . . . . . . . .33.6% n somewhat satisfied . . . . . . . . . . . . . . . . . . . . . . . . . . . . . . .45.6% n somewhat dissatisfied . . . . . . . . . . . . . . . . . . . . . . . . . . . . . .7.7% n very dissatisfied . . . . . . . . . . . . . . . . . . . . . . . . . . . . . . . . . .2.0% n don’t know . . . . . . . . . . . . . . . . . . . . . . . . . . . . . . . . . . . . .11.2%
availability of staff reGardiNG QuestioNs/special Needs
n very satisfied . . . . . . . . . . . . . . . . . . . . . . . . . . . . . . . . . . . .40.5% n somewhat satisfied . . . . . . . . . . . . . . . . . . . . . . . . . . . . . . .44.2% n somewhat dissatisfied . . . . . . . . . . . . . . . . . . . . . . . . . . . . . .5.3% n very dissatisfied . . . . . . . . . . . . . . . . . . . . . . . . . . . . . . . . . .2.4% n don’t know . . . . . . . . . . . . . . . . . . . . . . . . . . . . . . . . . . . . . .7.7%
with whom were these visits carried out?1 ⁄ ⁄ ⁄
n family member(s) . . . . . . . . . . . . . . . . . . . . . . . . . . . . . . . . . 52% n alone. . . . . . . . . . . . . . . . . . . . . . . . . . . . . . . . . . . . . . . . . . . 20% n caregiver . . . . . . . . . . . . . . . . . . . . . . . . . . . . . . . . . . . . . . . . 14% n organized group . . . . . . . . . . . . . . . . . . . . . . . . . . . . . . . . . . . 6% n friend . . . . . . . . . . . . . . . . . . . . . . . . . . . . . . . . . . . . . . . . . . . 4%
people with visual impairments are proportionally more likely to have been accompanied by a caregiver (21%), while nearly 30% of respondents who described themselves as obese reported having conducted the visits alone.
3 .3 restauraNt iNdustry › restauraNt patroNaGe
local restauraNt patroNaGe rates iN the past 12 moNths ⁄ ⁄ ⁄
87% of the survey population visited a restaurant at least once in the past year; half of this number had gone six times or more.
Number of visits . . . . . . . . . . . . . . . . . . . . . . . . . . . . . . . sample % n 0 . . . . . . . . . . . . . . . . . . . . . . . . . . . . . . . . . . . . . . . . . . . . . . 11% n 1 . . . . . . . . . . . . . . . . . . . . . . . . . . . . . . . . . . . . . . . . . . . . . . 8.1% n 2 . . . . . . . . . . . . . . . . . . . . . . . . . . . . . . . . . . . . . . . . . . . . . .9.2% n 3 to 5 . . . . . . . . . . . . . . . . . . . . . . . . . . . . . . . . . . . . . . . . .20.4% n 6+ . . . . . . . . . . . . . . . . . . . . . . . . . . . . . . . . . . . . . . . . . . .50.3% n dK. . . . . . . . . . . . . . . . . . . . . . . . . . . . . . . . . . . . . . . . . . . . .0.5%
restauraNt patroNaGe rates duriNG most receNt trip ⁄ ⁄ ⁄
overall . . . . . . . . . . . . . . . . . . . . . . . . . . . . . . . . . . . . . . . . . . . . 82%
1 this question also includes patronage of local restaurants.

11STuDy SuMMARy ⁄ ⁄ ⁄ Kéroul
restauraNt patroNaGe rates duriNG most receNt trip
Montréal . . . . . . . . . . . . . . . . . . . . . . . . . . . . . . . . . . . . . . . . 84.2% Québec (province) . . . . . . . . . . . . . . . . . . . . . . . . . . . . . . . . . . . 76% outside of Québec . . . . . . . . . . . . . . . . . . . . . . . . . . . . . . . . . . 93.1%
3 .4 traNsport › modes of traNsport used
usaGe freQueNcy of differeNt modes of traNsport (%) ⁄ ⁄ ⁄
car (as driver)
n regularly . . . . . . . . . . . . . . . . . . . . . . . . . . . . . . . . . . . . . . .42.6% n occasionally . . . . . . . . . . . . . . . . . . . . . . . . . . . . . . . . . . . .17.4% n never. . . . . . . . . . . . . . . . . . . . . . . . . . . . . . . . . . . . . . . . . .40.0%
car (as passeNGer)
n regularly . . . . . . . . . . . . . . . . . . . . . . . . . . . . . . . . . . . . . . .40.0% n occasionally . . . . . . . . . . . . . . . . . . . . . . . . . . . . . . . . . . . .50.4% n never. . . . . . . . . . . . . . . . . . . . . . . . . . . . . . . . . . . . . . . . . . .9.1%
city bus
n regularly . . . . . . . . . . . . . . . . . . . . . . . . . . . . . . . . . . . . . . .11.2% n occasionally . . . . . . . . . . . . . . . . . . . . . . . . . . . . . . . . . . . .17.2% n never. . . . . . . . . . . . . . . . . . . . . . . . . . . . . . . . . . . . . . . . . .71.6%
iNtercity bus
n regularly . . . . . . . . . . . . . . . . . . . . . . . . . . . . . . . . . . . . . . . .2.8% n occasionally . . . . . . . . . . . . . . . . . . . . . . . . . . . . . . . . . . . .12.0% n never. . . . . . . . . . . . . . . . . . . . . . . . . . . . . . . . . . . . . . . . . .85.2%
metro
n regularly . . . . . . . . . . . . . . . . . . . . . . . . . . . . . . . . . . . . . . . .7.3% n occasionally . . . . . . . . . . . . . . . . . . . . . . . . . . . . . . . . . . . .17.7% n never. . . . . . . . . . . . . . . . . . . . . . . . . . . . . . . . . . . . . . . . . .75.0%
taxi
n regularly . . . . . . . . . . . . . . . . . . . . . . . . . . . . . . . . . . . . . . .10.2% n occasionally . . . . . . . . . . . . . . . . . . . . . . . . . . . . . . . . . . . .31.7% n never. . . . . . . . . . . . . . . . . . . . . . . . . . . . . . . . . . . . . . . . . .58.2%
paratraNsit
n regularly . . . . . . . . . . . . . . . . . . . . . . . . . . . . . . . . . . . . . . . .8.7% n occasionally . . . . . . . . . . . . . . . . . . . . . . . . . . . . . . . . . . . . .9.9% n never. . . . . . . . . . . . . . . . . . . . . . . . . . . . . . . . . . . . . . . . . .81.4%
traiN
n regularly . . . . . . . . . . . . . . . . . . . . . . . . . . . . . . . . . . . . . . . .2.0% n occasionally . . . . . . . . . . . . . . . . . . . . . . . . . . . . . . . . . . . . .7.7% n never. . . . . . . . . . . . . . . . . . . . . . . . . . . . . . . . . . . . . . . . . .90.3%

12 study on the behaviours and attitudes of people with a physical disability ⁄ ⁄ ⁄ 2011
airplaNe
n regularly . . . . . . . . . . . . . . . . . . . . . . . . . . . . . . . . . . . . . . . .2.3% n occasionally . . . . . . . . . . . . . . . . . . . . . . . . . . . . . . . . . . . .20.0% n never. . . . . . . . . . . . . . . . . . . . . . . . . . . . . . . . . . . . . . . . . .77.7%
satisfactioN (%) with accessibility of differeNt modes of traNsport ⁄ ⁄ ⁄
city bus
n very easy . . . . . . . . . . . . . . . . . . . . . . . . . . . . . . . . . . . . . .16.3% n somewhat easy . . . . . . . . . . . . . . . . . . . . . . . . . . . . . . . . . .32.1% n somewhat difficult . . . . . . . . . . . . . . . . . . . . . . . . . . . . . . . .25.0% n very difficult. . . . . . . . . . . . . . . . . . . . . . . . . . . . . . . . . . . . .26.6%
iNtercity bus
n very easy . . . . . . . . . . . . . . . . . . . . . . . . . . . . . . . . . . . . . .16.0% n somewhat easy . . . . . . . . . . . . . . . . . . . . . . . . . . . . . . . . . .27.5% n somewhat difficult . . . . . . . . . . . . . . . . . . . . . . . . . . . . . . . .23.7% n very difficult. . . . . . . . . . . . . . . . . . . . . . . . . . . . . . . . . . . . .32.9%
metro
n very easy . . . . . . . . . . . . . . . . . . . . . . . . . . . . . . . . . . . . . .14.9% n somewhat easy . . . . . . . . . . . . . . . . . . . . . . . . . . . . . . . . . .25.0% n somewhat difficult . . . . . . . . . . . . . . . . . . . . . . . . . . . . . . . .22.2% n very difficult. . . . . . . . . . . . . . . . . . . . . . . . . . . . . . . . . . . . .37.9%
taxi
n very easy . . . . . . . . . . . . . . . . . . . . . . . . . . . . . . . . . . . . . .36.7% n somewhat easy . . . . . . . . . . . . . . . . . . . . . . . . . . . . . . . . . .44.1% n somewhat difficult . . . . . . . . . . . . . . . . . . . . . . . . . . . . . . . .11.5% n very difficult. . . . . . . . . . . . . . . . . . . . . . . . . . . . . . . . . . . . . .7.5%
paratraNsit
n very easy . . . . . . . . . . . . . . . . . . . . . . . . . . . . . . . . . . . . . .44.7% n somewhat easy . . . . . . . . . . . . . . . . . . . . . . . . . . . . . . . . . .37.7% n somewhat difficult . . . . . . . . . . . . . . . . . . . . . . . . . . . . . . . .10.0% n very difficult. . . . . . . . . . . . . . . . . . . . . . . . . . . . . . . . . . . . . .7.5%
traiN
n very easy . . . . . . . . . . . . . . . . . . . . . . . . . . . . . . . . . . . . . .21.9% n somewhat easy . . . . . . . . . . . . . . . . . . . . . . . . . . . . . . . . . .30.8% n somewhat difficult . . . . . . . . . . . . . . . . . . . . . . . . . . . . . . . .23.0% n very difficult. . . . . . . . . . . . . . . . . . . . . . . . . . . . . . . . . . . . .24.2%
airplaNe
n very easy . . . . . . . . . . . . . . . . . . . . . . . . . . . . . . . . . . . . . .25.5% n somewhat easy . . . . . . . . . . . . . . . . . . . . . . . . . . . . . . . . . .35.5% n somewhat difficult . . . . . . . . . . . . . . . . . . . . . . . . . . . . . . . .17.8% n very difficult. . . . . . . . . . . . . . . . . . . . . . . . . . . . . . . . . . . . .21.2%

13STuDy SuMMARy ⁄ ⁄ ⁄ Kéroul
paratraNsit: awareNess aNd perceptioN ⁄ ⁄ ⁄
•86% of respondents believed paratransit services to exist in their local area. this percentage was lowest (81%) in Montréal, and reached 96% in the Québec city region. awareness of the existence of paratransit services was 96% among wheelchair users and 82% among people who use a cane or crutches.
•among respondents who were aware of paratransit services (n=642), 36% believed they were eligible for such a service; 39% believed themselves ineligible; while one-quarter were unsure.
•nearly one-quarter of respondents who were aware of paratransit services had used them. of these users, 40% reported regular use, while one-third only used them occasionally. usage was rare among the remaining respondents.
reasoNs for Not usiNG paratraNsit (%) ⁄ ⁄ ⁄Among respondents who said they did not use paratransit services
n no need. . . . . . . . . . . . . . . . . . . . . . . . . . . . . . . . . . . . . . . .28.2% n access to car / is a driver . . . . . . . . . . . . . . . . . . . . . . . . . .20.1% n ineligible or believed to be ineligible . . . . . . . . . . . . . . . . . . .13.2% n assistance / access to another vehicle . . . . . . . . . . . . . . . . . .7.6% n impractical / inadequate service / poor schedule / long wait . .5.4% n uses public transport. . . . . . . . . . . . . . . . . . . . . . . . . . . . . . .2.0% n other . . . . . . . . . . . . . . . . . . . . . . . . . . . . . . . . . . . . . . . . . . .6.9% n dK / nr . . . . . . . . . . . . . . . . . . . . . . . . . . . . . . . . . . . . . . . .16.7%
compaNioN cards ⁄ ⁄ ⁄
respondents who were aware of paratransit services were asked the following question:
“In some municipalities, persons eligible for paratransit may obtain a free companion card. This allows the person accompanying you to travel for free on the bus and metro system. Have you ever heard of this card?”
•less than one-quarter of respondents (24%) reported having heard of it, a percentage that was comparable regardless of where they lived. the cards were relatively familiar to people with impaired vision or hearing (42% and 33% respectively), and somewhat familiar to people with restricted mobility (18%).
•of those aware of the card (n=196), 71% of them believed it to be available in their area; 7% believed it was not; and 22% did not know.
•among those aware of paratransit services, opinions are rather divided on the likelihood that they would use such a card if it were available in their community or region: 44% said it was very likely (20%) or somewhat likely (24%), while 51% said it would be somewhat unlikely (29%) or entirely unlikely (22%). 5% did not know.
iNtercity traNsport ⁄ ⁄ ⁄
•respondents who were aware of paratransit services in their city or region were asked about intercity transport. the majority (54%) did not know whether there existed in Québec accessible intercity bus services (on orléans express-type buses) suitable for people with disabilities. 21% of respondents knew of such services, while 25% believed that they were unavailable.
•only 10% of people who were aware of intercity services (n=175) reported having used them.
•a scant one out of 10 respondents claimed to have heard of a companion card that offered free public transport for attendants or helpers, one that entailed no extra charges or complicated procedures and was available across Québec’s intercity bus network.

14 study on the behaviours and attitudes of people with a physical disability ⁄ ⁄ ⁄ 2011
3 .5 tourism › behaviours aNd attitudes with reGard to tourist trips
tourist trips ⁄ ⁄ ⁄
•59% of respondents affirmed having travelled outside of their city or municipality at least once in the past 24 months, and for at least a one-night stay. this represents 430,572 people in total.
•the percentage of travellers varied by type of mobility restriction: › 67% among respondents who use a cane or crutches › 38% among respondents who use wheelchairs › 32% among respondents who use walkers
Number of trips takeN iN last 24 moNths (n=464) ⁄ ⁄ ⁄
n 1 . . . . . . . . . . . . . . . . . . . . . . . . . . . . . . . . . . . . . . . . . . . . .13.7% n 2 . . . . . . . . . . . . . . . . . . . . . . . . . . . . . . . . . . . . . . . . . . . . .24.0% n 3 to 5 . . . . . . . . . . . . . . . . . . . . . . . . . . . . . . . . . . . . . . . . .38.7% n 6 + . . . . . . . . . . . . . . . . . . . . . . . . . . . . . . . . . . . . . . . . . . .20.8% n dK. . . . . . . . . . . . . . . . . . . . . . . . . . . . . . . . . . . . . . . . . . . . .2.8%
the average number of trips taken in the last 24 months was 5.7.
reGioNs visited ⁄ ⁄ ⁄
while Québec is by far the most common destination for the most recent trip (65%) in the last 24 months, 83% of respondents travelled within Québec, 29% to the united states, 26% to ontario, 22% elsewhere in canada, 13% to the caribbean and 11% to europe.
reasoNs for Not haviNG travelled iN the last 12 moNths ⁄ ⁄ ⁄
unable to leave home due to incapacity . . . . . . . . . . . . . . . . . .45.4% accommodation too expensive. . . . . . . . . . . . . . . . . . . . . . . . .30.3% transportation too expensive . . . . . . . . . . . . . . . . . . . . . . . . . .28.1% does not like travelling . . . . . . . . . . . . . . . . . . . . . . . . . . . . . . .27.7% unavailability of accessible transport to destination . . . . . . . . .16.9% unable to find information about trips adapted to incapacity . . .16.0% unable to travel due to family obligations . . . . . . . . . . . . . . . . .15.8% unavailability of travelling companion . . . . . . . . . . . . . . . . . . . .15.8% bad experience in the past . . . . . . . . . . . . . . . . . . . . . . . . . . . .13.1%

15STuDy SuMMARy ⁄ ⁄ ⁄ Kéroul
most receNt destiNatioN withiN Québec ⁄ ⁄ ⁄Regions visited by respondents who travelled within Québec
destiNatioNs iN Québec (%) last 24 moNths most receNt trip
% %
Québec / charlevoix 38 28.9montréal / laval / montérégie 27 17.6laurentides 18 13.0mauricie / centre-du-Québec 17 7.8bas-saint-laurent / Gaspésie and/or Îles-de-la-madeleine 22 7.7eastern townships 17 6.8saguenay−lac-saint-Jean 13 3.9outaouais 11 3.3abitibi-témiscamingue 4 3.0chaudière-appalaches 9 2.5lanaudière 8 2.3côte-Nord / Northern Québec 6 1.8
leNGth of stay of most receNt trip ⁄ ⁄ ⁄
respondents reported varying lengths of stay on their most recent trips. short stays of one to two nights accounted for 40%, while stays of six or more days represented 34%. these figures varied considerably depending on whether or not the trips were within Québec. the average length of stay in Québec is four days, but rises to 11 days when travelling outside of Québec (all respondents/all destinations: 6.6. days)—in other words, of a longer duration when compared with findings regarding the general population.2
primary reasoN for travelliNG ⁄ ⁄ ⁄
with regard to the most recent trip, the most common primary reason for travelling was to visit family or friends (47%). this was followed by leisure and relaxation (23%), discovering a new place (8%), participating in cultural activities or events (6%), and participating in sports or outdoor activities (5%).
participatioN iN activities duriNG the trip ⁄ ⁄ ⁄Percentage of respondents who participated in events or activities during their most recent trip
attending a show or performance. . . . . . . . . . . . . . . . . . . . . . .15.1% attending a celebration or festival . . . . . . . . . . . . . . . . . . . . . . .19.5% visiting a historical/heritage site . . . . . . . . . . . . . . . . . . . . . . . .27.9% visiting a museum . . . . . . . . . . . . . . . . . . . . . . . . . . . . . . . . . .15.6% visiting a gallery. . . . . . . . . . . . . . . . . . . . . . . . . . . . . . . . . . . .13.5% dining out . . . . . . . . . . . . . . . . . . . . . . . . . . . . . . . . . . . . . . . .82.0%
travel compaNioNs, modes of traNsport aNd accommodatioN ⁄ ⁄ ⁄
with whom? Most respondents (64%) reported travelling with a spouse and/or family member. 19% said they travelled alone and 12% with friends, colleagues or in organized groups; such trips involved a great many more people than simply those with physical disabilities. of the people who did not travel alone (n=390), 18% reported that they were not the only ones on the trip with physical disabilities. in addition, 33% of these individuals (and 86% of people in wheelchairs) reported travelling with a caregiver companion, which in three out of four cases was a family member.
mode of transport . Most trips were made by car. 31% of respondents drove their own cars, while 39% travelled as passengers. the most common mode of transport after cars was air (14%), followed by bus (9%) and train (3%). one-quarter of respondents in wheelchairs drove their own cars and 45% travelled as a passenger.
accommodation . 46% of respondents (58% in the 65+ age bracket) reported staying with relatives or friends; 37% stayed in a hotel or motel. (48% of the 55–64 age bracket did the same). a further 5% stayed in a cottage, 4% in a b&b and 3% at a campground.
2 the 2010 tourisme Québec publication Le tourisme au Québec en bref reports that the average trip length for a visitor from Québec and travelling within the province was 2.5 days. these statistics do not take day trips into account, but only tourists from Québec who spent one or more nights at a destination within the province.

16 study on the behaviours and attitudes of people with a physical disability ⁄ ⁄ ⁄ 2011
access to adapted services ⁄ ⁄ ⁄
overall, 40% of respondents reported having had access to adapted services during their trip. travellers who had gone outside of Québec were more likely to report having had access to such services (49%) than those who had travelled in Québec (35%).
accessibility aNd awareNess of special services ⁄ ⁄ ⁄
commercial accommodation . 60% of respondents who had stayed in commercial accommodation (n=285) reported that their lodgings had been accessible to people with physical disabilities; this percentage rose to 73% among wheelchair users.
information prior to departure . Just over one-quarter (27%) of respondents reported having been aware, prior to departure, of the availability of adapted services at their destination; this percentage rises to 47% among wheelchair users. this percentage varied only slightly for travel within Québec (25%) and outside of the province (30%).
impact of the information . the majority (54%) of those with advance knowledge of adapted services reported that the information had greatly influenced (29%) or somewhat influenced (26%) their choice of destination and/or the activities they engaged in. these percentages were higher for those travelling outside of Québec (32% and 39% respectively), and somewhat lower for travellers who stayed in the province (27% and 19%).
iNformatioN sources ⁄ ⁄ ⁄
for many respondents, word-of-mouth (family or friends) was the primary source of information for trip planning, with the internet as the second most common source.
total ofiNformatioN sources 1st meNtioN 3 meNtioNs
(%) (%)
word-of-mouth—recommendations from family/friends 20.3 34.2web site other than bonjourquebec .com or keroul .qc .ca 13.8 19.7travel agent 7.9 17.4tourist guides and/or documentation 3 .4 16 .1tourisme Québec web site (bonjourquebec .com) 2.6 14.1tourist information centre or office 1.9 9.8association linked to the disability 1.8 7.5various media (newspapers, magazines, radio, television) 1.1 9.3keroul .qc .ca 0.2 4.3other 4.1 12.4None 24.8 38.5don’t know / No response 18.0 18.0
visitor satisfactioN ⁄ ⁄ ⁄
Generally speaking, once at their destination, the majority of respondents were satisfied with the adapted services available in terms of their reception and accommodation. however, opinions were much divided on other aspects, including accessibility to cultural sites and restaurants, prices paid for adapted services/equipment and adapted services overall.
concordantly with previous results, 56% of respondents reported that they were able to do whatever they wanted during their trip (wheelchair respondents: 46%). among those who reported not being able to do whatever they wanted (n=210), just over one-quarter (27%) believed that the lack of suitable equipment had limited their activities during their stay; this percentage rose to 65% among wheelchair users. these figures remain comparable across travellers both within and outside of Québec during their most recent trip.
17STuDy SuMMARy ⁄ ⁄ ⁄ Kéroul
future travel plaNs ⁄ ⁄ ⁄
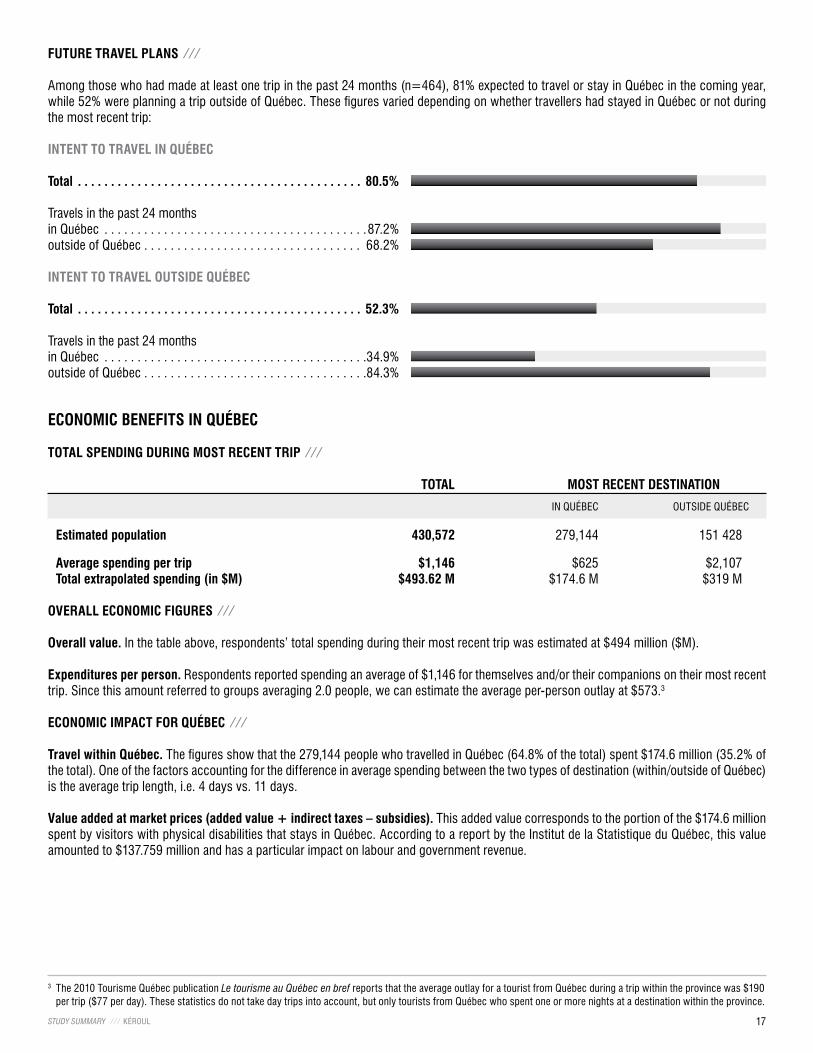
among those who had made at least one trip in the past 24 months (n=464), 81% expected to travel or stay in Québec in the coming year, while 52% were planning a trip outside of Québec. these figures varied depending on whether travellers had stayed in Québec or not during the most recent trip:
iNteNt to travel iN Québec
total . . . . . . . . . . . . . . . . . . . . . . . . . . . . . . . . . . . . . . . . . . . 80 .5%
travels in the past 24 months in Québec . . . . . . . . . . . . . . . . . . . . . . . . . . . . . . . . . . . . . . . .87.2% outside of Québec . . . . . . . . . . . . . . . . . . . . . . . . . . . . . . . . . 68.2%
iNteNt to travel outside Québec
total . . . . . . . . . . . . . . . . . . . . . . . . . . . . . . . . . . . . . . . . . . . 52 .3%
travels in the past 24 months in Québec . . . . . . . . . . . . . . . . . . . . . . . . . . . . . . . . . . . . . . . .34.9% outside of Québec . . . . . . . . . . . . . . . . . . . . . . . . . . . . . . . . . .84.3%
ecoNomic beNefits iN Québec
total speNdiNG duriNG most receNt trip ⁄ ⁄ ⁄
total most receNt destiNatioN
in Québec outside Québec
estimated population 430,572 279,144 151 428
average spending per trip $1,146 $625 $2,107total extrapolated spending (in $m) $493 .62 m $174.6 M $319 M
overall ecoNomic fiGures ⁄ ⁄ ⁄
overall value . in the table above, respondents’ total spending during their most recent trip was estimated at $494 million ($M).
expenditures per person . respondents reported spending an average of $1,146 for themselves and/or their companions on their most recent trip. since this amount referred to groups averaging 2.0 people, we can estimate the average per-person outlay at $573.3
ecoNomic impact for Québec ⁄ ⁄ ⁄
travel within Québec . the figures show that the 279,144 people who travelled in Québec (64.8% of the total) spent $174.6 million (35.2% of the total). one of the factors accounting for the difference in average spending between the two types of destination (within/outside of Québec) is the average trip length, i.e. 4 days vs. 11 days.
value added at market prices (added value + indirect taxes – subsidies) . this added value corresponds to the portion of the $174.6 million spent by visitors with physical disabilities that stays in Québec. according to a report by the institut de la statistique du Québec, this value amounted to $137.759 million and has a particular impact on labour and government revenue.
3 the 2010 tourisme Québec publication Le tourisme au Québec en bref reports that the average outlay for a tourist from Québec during a trip within the province was $190 per trip ($77 per day). these statistics do not take day trips into account, but only tourists from Québec who spent one or more nights at a destination within the province.

18 study on the behaviours and attitudes of people with a physical disability ⁄ ⁄ ⁄ 2011
•Impact on labour. “the reported value supports 2,497 person-years of employment for a payroll amount of $68.1 million, and 232 unpaid person-years in individual companies for net earnings of $5.7 million. the value added at basic prices would reach $122.5 million.”
•Impact on government income.
in Québec. “the $174.6 million in tourist spending also entails income for the Québec government, i.e. $3.5 million in taxes on wages and salaries, $13.3 million in sales tax (Qst) and $3.4 million in specific taxes”.
in canada. “similarly, tourist dollars from visitors with physical disabilities who travel in Québec provide the federal government with a total income of $1.8 million in taxes on wages and salaries, $6 million in sales tax (Gst) and $994,000 in excise taxes and duties.”
“provincial and federal parafiscal levies are respectively $11 million and $2.1 million.”
figures to be multiplied by 2 and more . it must be remembered that the reported figures cover only the most recent trips made by travellers in Québec, who have reported an average of 5.7 trips over the past two years, the majority of which (over 60%) occur in Québec. based on these figures, we can hypothesize that, in the past 12 months, Québecers with physical disabilities who had travelled within the province have made at least two trips. on this basis, we can conceivably double the isQ figures above to estimate the annual economic impact on Québec of travel within the province by visitors with physical disabilities (i.e. over $275 million).
without factoring in the contribution of foreign visitors . this study does not take into account the significant economic impact of visitors with physical disabilities who come from other canadian provinces or abroad. in 2009, Kéroul conducted a study on the behaviour and attitudes of people with physical disabilities in the ontario, Maritimes and new england markets. the main findings are posted on Kéroul’s web site. it notes in particular that the average expenditures incurred by these visitors (695 respondents) come to $1,414, which amounts to an average outlay per person of $642 for groups of 2.2 people.
aN estimated market of over oNe billioN dollars
with total spending during the most recent trip estimated at $493.62 million, and given respondents’ reported average of 5.7 trips in two years, we can forecast a theoretical figure for total expenditures in excess of $1 billion. that being said, it is important to remember that any survey must leave room for non-sampling error, particularly given that that data in question are subjective as opposed to factual.
accessible tourism for people with physical disabilities represents a market evaluated at
over one billion dollars

19STuDy SuMMARy ⁄ ⁄ ⁄ Kéroul
leveraGe kéroul’s expertise to access
a Growth market iN Québec!
to fiNd out aNd publicize your estab-lishmeNt’s level of accessibility, obtaiN kéroul’s certificatioN . ⁄ ⁄ ⁄
for over 32 years, Kéroul has assessed the accessibility of tourism and cultural attractions across Québec. Kéroul’s classification is the only one of its kind endorsed by the Ministère du tourisme du Québec. to date, over 7,000 tourist and cultural facilities have been inventoried by Kéroul and its partners.
to fiNd out how to make your site or establishmeNt accessible, call oN the expertise of kéroul’s research aNd developmeNt team . ⁄ ⁄ ⁄
we’ll help you identify your needs and, as needed, can visit your site to determine the obstacles to accessibility. we will then give you a detailed report containing our recommendations.
to Get your establishmeNt kNowN for its accessibility, coNNect to The Accessible RoAd . ⁄ ⁄ ⁄
The Accessible Road is a bilingual online resource designed to promote barrier-free travel. the site brings together some 170 cultural and tourism establishments in 13 regions of Québec which have adapted their sites to offer safe, universal accessibility. in 2011, the world tourism organization (unwto) recognized the value of this innovative network initiative by awarding it the prestigious ulysses award.
› visit www .theaccessibleroad .com
to make your staff more “accessible,” Give them kéroul’s Welcoming WAys traiNiNG . ⁄ ⁄ ⁄
accessibility is also a question of attitude and skill! your team’s ability to understand the needs of people with physical disabilities and respond accordingly will improve the quality of the service you provide. since 1983, Kéroul has offered “Welcoming Ways” training, a program lasting for three to ten hours. in addition to basic reception principles, participants develop a unique and cutting-edge specialization in the fields of tourism and culture.

tel.: 514-252-3104fax: 514-254-07664545, pierre-de coubertin avenueMontréal (Québec) h1v [email protected]