a heat wave characteristics in the eastern mediterranean
TRANSCRIPT

CLIMATE RESEARCHClim Res
Vol. 63: 99–113, 2015doi: 10.3354/cr01285
Published online April 15
1. INTRODUCTION
Heat waves have gained considerable scientificattention recently due to their potentially devastatingsocioeconomic effects. Large impacts are expectedwith respect to public health (Koppe et al. 2004),energy supply (IPCC 2007, Förster & Lilliestam2010), water availability (Koch & Vögele 2009), agri-culture (Ferris et al. 1998), forestry and ecosystems(Moriondo et al. 2006), among others. Understandingthese impacts is relevant not only for scientists, butalso for all components of society.
The Middle East spans several climates zones,where the eastern part is Mediterranean, the northernpart is considered to be subtropical while the ArabianPeninsula has a hyper-arid desert climate. Differentclimate zones are found in the various mountainareas. The region has among the hottest and driestconditions found in the world. Numerous heat recordswere broken in the Middle East in the summer of 2010with temperatures reaching 52.0°C in Jeddah (WMO2011). This heat wave caused un precedented demand
for electricity in Saudi Arabia, needed for air condi-tioning. As a result eight power plants in the countrywere forced to shut down, leaving several Saudi citieswithout power (Gulf News, June 22, 2010, ‘Heatwavein Middle East no cause for panic’). In Israel, the year2010 was the hottest on re cord, and average tempera-tures were 2–3°C higher than the average (Israel Meteorological Service 2011).
A large number of research papers focusing on ex-treme temperatures on global, regional and na tio nalscales have been published in the last 2 de cades. Sev-eral global studies have been conducted using indicesof climate extremes, provided by the Expert Team onClimate Change Detection and Indices (ETCCDI),mostly since the early works of Jones et al. (1999), Fol-land et al. (1999), Karl & Easterling (1999) and Frich etal. (2002). More recently, the global work on extremeclimatological variables, including temperature, hasbeen updated by Alexander et al. (2006). Further, im-plications of climate warming for hot extremes havebeen investigated globally (Tebaldi 2007, Orlowsky2011, Hansen et al. 2012, IPCC 2012) and regionally,
© Inter-Research 2015 · www.int-res.com*Corresponding author: [email protected]
Heat wave characteristics in the eastern Mediterranean and Middle East using extreme
value theory
M. Tanarhte1,*, P. Hadjinicolaou2, J. Lelieveld1,2
1Max Planck Institute for Chemistry, 55128 Mainz, Germany2The Cyprus Institute, 1645 Nicosia, Cyprus
ABSTRACT: Heat waves in the eastern Mediterranean and Middle East can have large socioeco-nomic impacts. We apply a newly developed statistical framework, based on the extreme valuetheory, to study the characteristics of heat waves in the region during the period 1973–2010 usingdata from 15 measurement stations across the region. The analysis shows increasing trends in thehighest daytime temperatures in the Persian Gulf region in summer. Increasing trends in the num-ber of heat waves are found at all stations, whereas the maximum temperature during heat wavesis found unchanged, implying no change in their intensity. Furthermore, no significant trends inthe heat wave duration are observed. Return levels are calculated for the individual hot days andfound to be very high in the Persian Gulf region.
KEY WORDS: Heat wave · Extreme value · Middle East · Mediterranean
Resale or republication not permitted without written consent of the publisher
FREEREE ACCESSCCESS

Clim Res 63: 99–113, 2015100
e.g. in Europe (Christen sen & Christensen 2007, Fis-cher & Schär 2010) and in the Mediterranean and theMiddle East (Diffenbaugh et al. 2007, Gao & Giorgi2008, Evans 2009, Önol & Semazzi 2009, Hertig et al.2010, Lelieveld et al. 2013).
Few studies related to heat waves in this regioncould be found in the literature, mostly due to dataunavailability. Trends of extreme temperatures in theeastern Mediterranean region have been evaluatedby Kostopoulou & Jones (2005), Kuglitsch et al. (2010)and Kostopoulou et al. (2014). Kostopoulou & Jones(2005) showed that the most significant temperaturetrends were found for summer, where both minimumand maximum temperature extremes show statisti-cally significant warming trends. Efthymiadis et al.(2011) used daily gridded data sets to detect trends inMediterranean temperature extremes since the mid-20th century. Their results show a decrease in cold ex-tremes and increase in hot extremes. Kuglitsch et al.(2010) have shown increases in the number, intensityand length of heat waves in the eastern Mediterran-ean. Tayanç et al. (2009) showed a significant warm-ing trend in southern and southeastern parts ofTurkey for the period 1950−2004. The only regionalwork with a focus on the Middle East is by Zhang etal. (2005), presenting changes in extreme temperatureand precipitation at 52 stations from 15 countries forthe period 1950−2003. Increasing trends have beenfound in the annual maximum of daily maximum andthe number of days where daily temperature has ex-ceeded its 90th percentile. Fewer studies on changesin climate extremes can be found for the Middle East,mainly due to the poor data network in Arab countriesand limited access to long daily data sets. Recently,Donat et al. (2014) examined the temporal changes inclimate extremes in the Arab region based on 60 sta-tions from Arab countries collected during a workshopheld in 2012. They found in creased frequencies ofwarm days and warm nights and higher extreme tem-perature values. Athar (2014) used observed dailytemperature and precipitation datasets from a total of19 stations from Saudi Arabia (SA) for a 30 yr period(1979−2008) to calculate climate indices. Athar (2014)shows that temperature extremes display more warm-ing in the summer season, with the southwest coastalstations displaying more warming as compared to theinland stations. Almazroui et al. (2014) show that thetemperature ex tremes in Saudi Arabia have signifi-cantly in creased with larger rates in the recent past(1996− 2010) compared to a previous period (1981−1995). Other variability analyses are reported for ex-treme climate indices in Iran and Turkey (e.g.Rahimzadeh et al. 2009, Erlat & Türkes 2012, 2013,
Kousari et al. 2013). Kousari et al. (2013) foundpositive trends of annual, seasonal and monthly maxi-mum temperature in the warm season of the period1960− 2005 for 32 stations in Iran with an increasingtrend after 1970. Erlat & Türkes (2013) show increas-ing trends in the annual number of summer and tropi-cal days of 97 meteorological stations of Turkey.
The descriptive indices developed by ETCCDIrefer to moderate extremes that typically occur sev-eral times per year. The extreme value theory (EVT)complements the descriptive indices in order to eval-uate the intensity and frequency of rare events. EVTprovides the statistical framework to estimate theprobability of occurrence of extreme or very rareevents (Klein Tank et al. 2009). EVT methods gener-ally use a subset of a large number of values from thedata sample to infer the extreme characteristics of theunderlying process that generate the phenomena(Coelho et al. 2008). Recently, several studies of cli-mate extremes by means of the EVT have been pub-lished (e.g. Kharin & Zwiers 2000, 2005, van denBrink et al. 2004, Fowler et al. 2005, Kharin et al.2005, Naveau et al. 2005). Most of these studies useonly one aspect of the EVT (the block maximaapproach) and do not address heat waves directly.Katz (2010) and Furrer et al. (2010) proposed an EVTframework suitable to study heat waves and hotspells using 2 approaches: the block maxima ap -proach and the peak-over-threshold (POT) approach.This study applies the proposed approaches to assessheat wave characteristics in the period 1973−2010.Our purpose is to apply the new EVT framework tostudy the frequency, intensity and duration of heatwaves and their trends in the region of the easternMediterranean and Middle East.
2. DATA AND METHODOLOGY
Daily station data in the Middle East are difficult toobtain from the local meteorological services, there-fore daily maximum temperature data extracted fromthe publicly available datasets are used in the study.Fifteen stations across the eastern Mediterranean andthe Middle East (Fig. 1) have been chosen ac cordingto the availability and quality of the meteorologicaldata for the historical period 1973−2010. The stationlocations represent the major climate zones in the re-gion, notably near populated areas. A small portion ofstations did not provide data for the complete period(see Table 1) or because of homogenization reasons,but still have been included. The data sources are theGlobal Summary Of The Day (GSOD: https: // data.

Tanarhte et al.: Heat wave characteristics in the Levant
noaa. gov/dataset/ global-surface- summary-of-the-day-gsod) and ECA&D (European Climate Assessment &Datasets: www. ecad.eu).
The GSOD data, produced by the National Cli-matic Data Center (NCDC), are derived from the syn-optic/ hourly observations contained in USAF DAT-SAV3 Surface data, a collection of worldwide surfaceweather observations from sources such as theGlobal Telecommunications System (GTS) and Auto-mated Weather Network (AWN). Historical data aregenerally available from 1973 to the present, withsome stations having data going back to before 1930.Generally, data from 1982 (beginning of current syn-optic code) to the present are the most complete. Inderiving the summary of the day data, a minimum of4 observations for the day must be available.
The new ECA&D dataset includes station series for9 daily climate variables. The dataset comprises dailytime series provided by the National MeteorologicalServices of countries in Europe, North Africa and theMiddle East, augmented with data from other insti-tutes and from earlier research projects (Klein Tank etal. 2002, Klok & Klein Tank 2009). The data are ex ten -sively quality-checked and tested for homogeneity.
2.1. Quality checks
No further quality checks are applied to theECA&D stations used in this study. Only stationsfrom GSOD are further quality-checked, although
the synoptic data are already extensively tested toeliminate many of the random errors found in theoriginal data. The RHtestV3 software (available fromwww.climdex.org, Wang 2008) has been used toeliminate possible additional errors. Less than 5% oferrors were found, and a few physically implausiblevalues have been set to missing; all stations have>90% of records available.
2.2. Homogenization
Data homogeneity is assessed only for GSOD datausing the RHtestV3 software, which uses a 2-phaseregression model applied to monthly data in order tocheck for multiple step change points that could existin a time series (Wang 2008). Significant changepoints (5% level) were identified in 4 stations(Table 1). Most of the change points occur at the endof 1999/ beginning of 1998, which concurs with simi-lar findings by Peterson et al. (1998) and Alexanderet al. (2006). These change points are apparentlylinked to hot weather events associated with the1997–98 El Niño. This might also apply to the changepoint found in Amman in 1993. Historical explana-tions for the cause of the change points, such as sta-tion relocation, are not provided by GSOD, and ourrequests to the national meteorological services ofthese stations remained unanswered. Therefore, noadjustment of the time series of these stations hasbeen possible.
2.3. Extreme value theory
The EVT is the area of statistics used specifically toanalyze extreme events. In this study, 2 methods de -rived from EVT are used to analyze heat waves andtheir characteristics (e.g. frequency and intensity).
2.3.1. The block maxima approach
The first approach, the block maxima approach isused to analyze data to be the maxima (or minima)over certain blocks of time. In this context, it is appro-priate to use the generalized extreme value (GEV)distribution, a distribution derived from EVT. In thisapproach the time series are constructed by deter-mining the maximum temperature for the summerseason (here taken from the first of June to first ofNovember), so the length of the series equals thenumber of years for which data is available.
101
25°E 30° 35° 40° 45° 50° 55°
20°
25°
30°
35°
40°
45°N
Aleppo
AmmanJerusalem
Cairo
DhahranDoha
Shiraz
Tabriz
Kuwait
Nicosia
Eilat
Kermanshah
VanIsparta
Istanbul
Fig. 1. The 15 stations across the eastern Mediterranean and the Middle East, used in this study
Clim Res 63: 99–113, 2015102
In this approach the model focuses on the statisticalbehavior of
(1)
where X1, X2, …, Xn is a sequence of independentrandom variables having a common distributionfunction F. In the context of this work, the Xi standsfor values of the daily extreme temperature processand Mn represents the maximum of the process overn time units of observation. For instance, if n is thenumber of observations over the summer season in ayear, then Mn is the annual summer maximum. Thedistribution function is:
(2)
As argued in Leadbetter et al. (1983), the distri -bution of the maximum of identically distributed random variables is well approximated by the GEVdistribution, with three parameters: a locationparameter μ, a scale parameter σ, and a shapeparameter ξ.
(3)
defined on , where –∞ < μ < ∞, σ >
0 and –∞ < ξ < ∞.The location parameter μ and the scale parameter σ
are respectively, proportional to the mean and thevariance of extremes, while the shape parameter ξdescribes the shape of the tail (ξ < 0 implies that itadmits a right bound zp = μ – σ/ξ, ξ > 0 describes a left
bounded tail, with the same bound, and ξ = 0 gilts foran unbounded tail, known as Gumbel distribution.
2.3.2. The peak-over-threshold approach
The POT approach provides a model for independ-ent exceedances above a large threshold. Assumingthat exceedances are independent, identically dis-tributed random variables, the distribution of ex -ceedances asymptotes to a limit distribution, the gen-eralized Pareto distribution (GPD). For more details,see Coles (2001), p. 76.
Thus, the GPD can be used to model exceedancesabove a given threshold. This distribution can bewritten in terms of a generic variable x as:
(4)
The GPD function is a so-called cumulative distri-bution function, so it can be expressed in terms ofprobabilities. Let X be an independent and identi-cally distributed random variable of the GPD func-tion. Then Eq. 4 can be rewritten as follows:
(5)
(6)
(7)
(8)
where ζu = Pr(X > u), i.e. ζu is the probability of theoccurrence of an exceedance of a high threshold, u.
= …M X X Xn nmax{ ; ; ; };1 2
≤ = ≤ ≤= ≤ × ≤ × × ≤
=
Pr M z Pr X z X z
Pr X z Pr X z Pr X z
F z
n n
n
n
{ } { , .., }
{ } { } .. { }
{ ( )}
1
1 2
F zz
, , , exp 11
( )( )μ σ ξ = − + ξ − μσ
⎡⎣
⎤⎦
⎧⎨⎩
⎫⎬⎭
− ξ
:1 0zz( ){ }+ ξ − μ
σ>
( ) 1 1 ( , 0)1
G xx
x u( )= − + ξ − μσ
⎡⎣
⎤⎦ > ξ ≠
− ξ
Pr( , ) ( )X x x u G x< > =
X x x u G xPr( , ) 1 ( )> > = −
X x Pr x u G xPr( ) ( ) [1 ( )]> = > −
X x ux
Pr( ) 11
( )> = ζ + ξ − μσ
⎡⎣
⎤⎦
− ξ
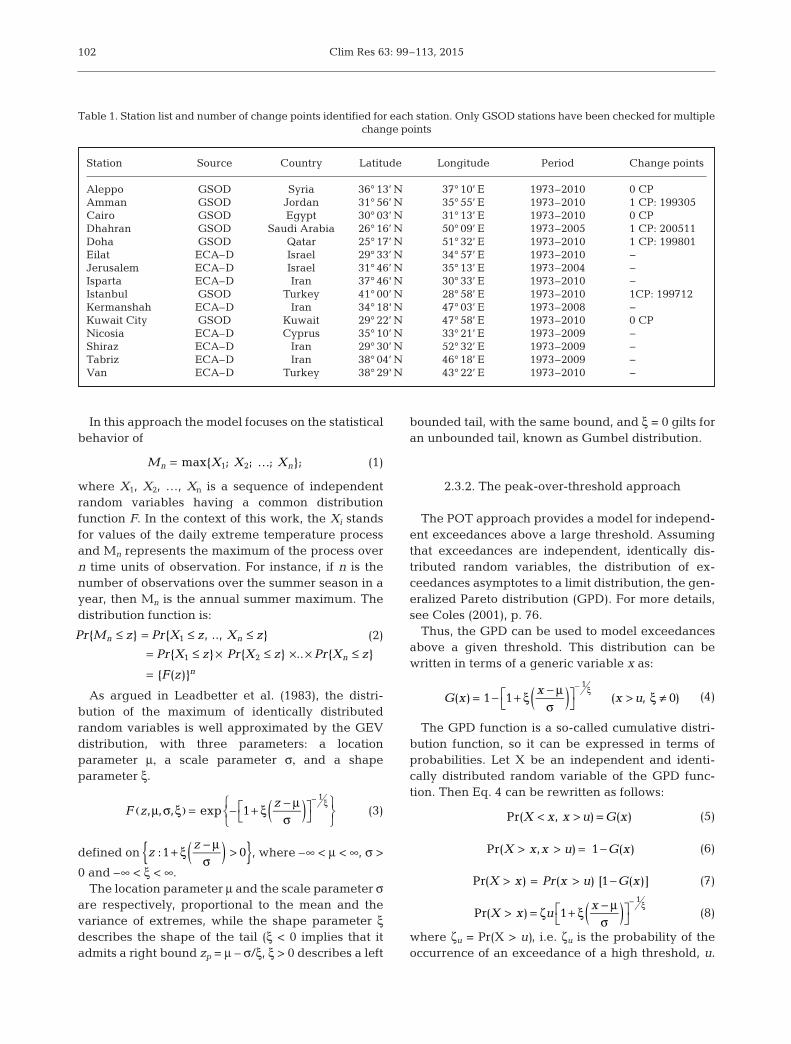
Station Source Country Latitude Longitude Period Change points
Aleppo GSOD Syria 36° 13’ N 37° 10’ E 1973–2010 0 CPAmman GSOD Jordan 31° 56’ N 35° 55’ E 1973–2010 1 CP: 199305Cairo GSOD Egypt 30° 03’ N 31° 13’ E 1973–2010 0 CPDhahran GSOD Saudi Arabia 26° 16’ N 50° 09’ E 1973–2005 1 CP: 200511Doha GSOD Qatar 25° 17’ N 51° 32’ E 1973–2010 1 CP: 199801Eilat ECA–D Israel 29° 33’ N 34° 57’ E 1973–2010 −Jerusalem ECA–D Israel 31° 46’ N 35° 13’ E 1973–2004 −Isparta ECA–D Iran 37° 46' N 30° 33’ E 1973–2010 −Istanbul GSOD Turkey 41° 00’ N 28° 58’ E 1973–2010 1CP: 199712Kermanshah ECA–D Iran 34° 18' N 47° 03’ E 1973–2008 −Kuwait City GSOD Kuwait 29° 22’ N 47° 58’ E 1973–2010 0 CPNicosia ECA–D Cyprus 35° 10’ N 33° 21’ E 1973–2009 −Shiraz ECA–D Iran 29° 30’ N 52° 32’ E 1973–2009 −Tabriz ECA–D Iran 38° 04’ N 46° 18’ E 1973–2009 −Van ECA–D Turkey 38° 29' N 43° 22’ E 1973–2010 −
Table 1. Station list and number of change points identified for each station. Only GSOD stations have been checked for multiple change points

Tanarhte et al.: Heat wave characteristics in the Levant
The GPD is characterized by two parameters, ξ theshape parameter and σ the scale parameter. Theshape parameter determines the tail behaviour: if ξ >0 then the maximum of the GPD is unbounded,whereas if ξ < 0 then the tail has a finite extent. If ξ =0, the GPD reduces to the exponential distributionand is also unbounded in the limit ξ → 0. As for thescale parameter, it measures the scale or ‘amplitude’of the distribution.
Under the framework of the second approach, thePOT approach, the extreme temperature series ismade up of the values above a threshold regardlessof the year in which they occurred. The selection of athreshold is not simply related to the spatial variabil-ity of the heat wave characteristics in our domain. Inthis study, the 95th percentile of the time series isselected as a temperature threshold that must becrossed to start and end a heat wave. The heat waveas defined here is not necessarily equivalent to theextremely hot weather event from the societal pointof view. This approach is used to study the frequencyof high temperature clusters and the maximum inten-sity within clusters, measured by the highest temper-ature observed in each cluster. The frequency of hightemperature clusters per year is analyzed and fittedusing a Poisson distribution (PD); the maximumintensity within a cluster for each city was analyzedand fitted to a GPD.
A likelihood-ratio test is a statistical test used tocompare the fit of 2 models, one of which (the nullmodel) is a special case of the other (the alternativemodel). The test is based on the likelihood ratio,which expresses how many times more likely thedata are under one model than the other. In this con-text, we will be comparing fitted distributions withand without trends.
For more details about the EVT approaches, seeColes (2001). Our analysis follows the methodologyrecommended by Furrer et al. (2010), Katz (2010) andWalter (2008), and uses the extRemes package in theopen source statistical programming language R(www.cran.r-project.org/web/packages/extRemes/)(Stephenson & Gilleland 2006).
3. RESULTS
3.1. General statistics
Table 2 shows some basic statistics for the timeseries of the maximum temperature in the summerseason. The highest temperatures are found inKuwait City, followed by Dhahran. Van and Isparta
have the relatively lowest temperatures, both situ-ated >1000 m above sea level. Only limited local vari-ability is observed, except for Aleppo and Istanbulwith a standard deviation of >2 and a large differ-ence between the minimum and the maximum value.
3.2. Block maxima approach
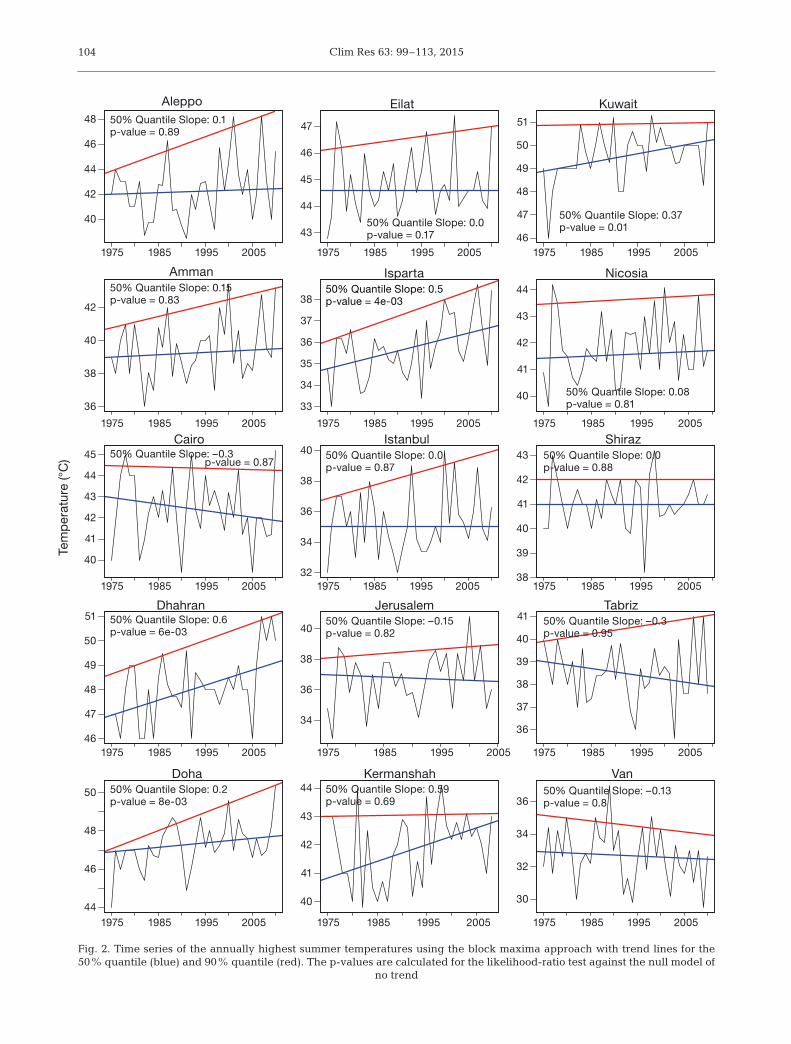
The block maxima approach is used to analyze theannually highest summer temperatures at all stations(see Fig. A1 in the Appendix). Fig. 2 shows the high-est summer temperatures with trend lines for the 50and 90% quantile. Quantile regression is the analysismethod estimating the regression slopes for the val-ues of any quantile from 0 to 1 of dependent variabledistributions (Koenker & Bassett 1978). Moreover, itprovides a detailed picture of the conditional distri-bution of the dependent variable (Tmax) given theindependent variable (Time) when both lower andupper or all quantiles are of interest; hence it is espe-cially useful in applications where extremes areimportant. Dhah ran, Doha, Isparta and Kuwait showsignificant tendencies for the 50% quantile trendwith an increase of respectively 0.6, 0.2, 0.5 and0.3°C per decade.
The likelihood-ratio test is performed to determinewhether a GEV model with a linear trend significantlyimproves the fit over a model that does not consider atrend. The p-values shown in Fig. 2 for each stationreflect no strong evidence that the highest maximumtemperatures vary over time for most of stations ex-cept for Dhahran, Doha, Isparta and Kuwait.
No significant trends were observed for the 90%quantile, despite large increases observed in Aleppo,
103
Station Mean Median Min Max STD
Aleppo 42.35 42.14 38.50 48.28 2.41Amman 39.49 39.25 36.00 43.40 1.77Cairo 42.42 42.10 39.40 45.20 1.52Dhahran 48.10 48.00 46.00 51.00 1.33Doha 47.26 47.11 44.00 50.39 1.22Eilat 44.84 32.00 42.80 47.40 1.12Jerusalem 36.66 36.75 32.80 40.80 1.79Isparta 35.73 35.60 33.00 38.70 1.38Istanbul 35.29 35.00 32.00 40.00 2.01Kermanshah 41.90 42.10 39.80 44.10 1.22Kuwait City 49.57 50.00 46.00 51.28 1.08Nicosia 41.81 41.60 39.60 44.20 1.17Shiraz 41.06 41.00 38.20 43.20 0.96Tabriz 38.48 38.40 35.60 41.00 1.24Van 32.69 32.60 29.50 37.00 1.67
Table 2. Basic statistics of Tmax for the 15 stations
Clim Res 63: 99–113, 2015104
40
42
44
46
48
36
38
40
42
40
41
42
43
44
45
46
47
48
49
50
51
1975 1985 1995 200544
46
48
50
43
44
45
46
47
33
34
35
36
37
38
32
34
36
38
40
34
36
38
40
1975 1985 1995 2005
40
41
42
43
44
46
47
48
49
50
51
40
41
42
43
44
38
39
40
41
42
43
36
37
38
39
40
41
1975 1985 1995 2005
1975 1985 1995 2005 1975 1985 1995 2005 1975 1985 1995 2005
1975 1985 1995 2005 1975 1985 1995 2005 1975 1985 1995 2005
1975 1985 1995 2005 1975 1985 1995 2005 1975 1985 1995 2005
1975 1985 1995 2005 1975 1985 1995 2005 1975 1985 1995 2005
30
32
34
36
Aleppo Eilat Kuwait
Amman Isparta Nicosia
Cairo
Tem
per
atur
e (°
C)
Istanbul
Dhahran Jerusalem
Shiraz
Tabriz
VanDoha Kermanshah
50% Quantile Slope: 0.15
50% Quantile Slope: 0.1p-value = 0.89
p-value = 0.83
50% Quantile Slope: 0.6
50% Quantile Slope: –0.3p-value = 0.87
50% Quantile Slope: 0.2
p-value = 6e-03
p-value = 8e-03
50% Quantile Slope: 0.0p-value = 0.17
50% Quantile Slope: 0.0
50% Quantile Slope: 0.5 p-value = 4e-03
50% Quantile Slope: 0.59
p-value = 0.87
50% Quantile Slope: –0.3
p-value = 0.69
50% Quantile Slope: –0.15p-value = 0.95
50% Quantile Slope: –0.13
p-value = 0.82
50% Quantile Slope: 0.0
p-value = 0.8
p-value = 0.88
50% Quantile Slope: 0.08p-value = 0.81
50% Quantile Slope: 0.37p-value = 0.01
Fig. 2. Time series of the annually highest summer temperatures using the block maxima approach with trend lines for the50% quantile (blue) and 90% quantile (red). The p-values are calculated for the likelihood-ratio test against the null model of
no trend

Tanarhte et al.: Heat wave characteristics in the Levant 105
Amman, Dhahran, Doha, Isparta and Istanbul. The 2quantiles tend to converge only in Kuwait, Kerman-shah and Van.
Although the trends in the annual highest summertemperature have been derived for individual excep-tionally hot days, they suggest that trends might existalso for heat waves, which motivates further investi-gation of the characteristics of the consecutive hotdays that may occur.
3.3. Peak-over-threshold approach
This approach is used to analyze the frequency ofthe high temperature clusters and the maximumintensity within clusters. In this study, a cluster isdefined by temperatures exceeding the threshold ofthe 95th percentile of the time series for one day, andthen falling below the threshold.
Fig. 3 shows the number of clusters per year fittedto a PD. Statistically significant trends were found forall cities except for Aleppo, Amman, Nicosia, Tabrizand Van. The likelihood-ratio test against the nullmodel of no trend performed for each station givesvery low p-values for significant trends, as seen inthe figure. Drastic increases in the mean number ofclusters over the course of 37 yr are observed in Cairo(from 4 to 9), Dhahran (from 1 to 10), Isparta (from 2to 6), Istanbul (from 2 to 8) and Kuwait (from 1 to 5).
Further, the severity of the heat waves is assessedusing the highest daily maximum temperature withina cluster in Fig. 4. The trends in the 2 quantiles (50and 75%) of the fitted GPD distributions (see Fig. A2)are shown with no significant trend using the likeli-hood-ratio test in most of the cities, with the excep-tion of Dhahran and Isparta. More apparent decreas-ing trends are found for the 75% quantile trend inCairo, Eilat, Istanbul, Kermanshah, Shiraz andTabriz. This indicates that the mean trend of themaximum temperature within a cluster may be influ-enced more by the upper than the lower quantiles.
Fig. 5 shows the duration of the heat waves as ob -served in all stations with quantile regressions for 50and 90% implying the trends. No significant trendscan be derived from the median quantile, as themean length of a heat wave in all stations varies be-tween 1 and 2 d. The 90% quantile shows an upwardtrend in Aleppo, Dhahran, Isparta, Istanbul, Kerman-shah and Shiraz and a downward trend for Kuwait,Tabriz and Van. The 90% quantile trend implies thatextended heat waves have increased or de creased innumber over the time period considered, althoughthe median values remained the same.
3.4. Return levels
Fig. A1 in the Appendix shows the histograms forthe highest maximum temperatures in summer andtheir GEV distributions. Although deviations fromthe estimated probability function are apparent, thegeneral shape of the histograms does not contradictthe GEV assumption.
Table 3 shows maximum likelihood estimates ofthe GEV parameters at all stations, which includesstandard errors for all estimates. Return values areestimated from the GEV distribution fitted for eachtime series, which enables the evaluation of rareevents, such as the maximum temperatures that areexceeded on average every 10, 20 and 50 yr, i.e.return level at 10, 20 and 50 yr. Due to the relativelyshort time series, return levels for very long returnlyperiods are prone to errors (Kharin et al. 2007).
The high temperature of 50°C is expected to beexceeded every 20 yr in Dhahran, and every 10 yr inKuwait, 48°C every 10 yr in Doha and 46°C every10 yr in Eilat. It should be noted that the confidenceintervals are comparatively wider for certain stationssuch as Aleppo and Amman for RL20 and RL50.
4. DISCUSSION AND CONCLUSIONS
This study applies different concepts of EVT tocharacterize heat waves in the region of the easternMediterranean and Middle East. Due to the scarcityof reliable and available data, only 15 stations havebeen used to explore these characteristics, focusingon main urbanized areas. They span several climatezones, and different definitions of heat waves canbe applied, which make these locations interestingto study. Moreover, in the absence of metadataavailable for the 3 GSOD stations presenting signifi-cant change points (see Table 1), we assumed thatthese change points could be attributed to climaticevents. This might be equally related to the accu-racy of measurement for each station in differenttime periods or other non-climatic factors affectingthe data quality. Despite the inhomogeneities foundin these stations, they were kept in the analysisbecause of the lack of gaps and the relatively goodquality of the time series. These inhomogeneitiesmight have affected the final results. Our datasources do not guarantee the best quality for thedata provided, and no correction of inhomogeneitiesis possible without metadata. More meteorologicaldata at stations throughout the region with betterquality are needed for a full assessment of heat

Clim Res 63: 99–113, 2015106
0
1
2
3
4
5
0
1
2
3
4
5
6
7
0
1
2
3
4
5
6
7
0
1
2
3
4
5
6
0
1
2
3
4
5
6
7
0
2
4
8
6
0
2
4
8
6
0
2
4
8
6
0
2
4
8
6
0
2
4
8
6
0
2
4
8
6
0
2
4
8
10
12
6
0
2
4
8
10
12
6
0
2
4
8
10
12
6
0
2
4
8
10
6
Hea
t w
aves
(yr–1
)
1975 1985 1995 2005 1975 1985 1995 2005 1975 1985 1995 2005
1975 1985 1995 2005 1975 1985 1995 2005 1975 1985 1995 2005
1975 1985 1995 2005 1975 1985 1995 2005 1975 1985 1995 2005
1975 1985 1995 2005 1975 1985 1995 2005 1975 1985 1995 2005
1975 1985 1995 2005 1975 1985 1995 2005 1975 1985 1995 2005
Aleppo Eilat Kuwait
Amman Isparta Nicosia
Cairo Istanbul
Dhahran Jerusalem
Shiraz
Tabriz
VanDoha Kermanshah
Fig. 3. Number of clusters (heat waves) per year. The red line depicts the trend in clusters based on a threshold of 95th per-centile, using the locally weighted scatterplot smoothing curve (LOWESS). P-values are produced from the likelihood-ratio
test against the null model of no trend

Tanarhte et al.: Heat wave characteristics in the Levant 107
40
42
44
46
48
37
39
41
43
38
40
42
44
47
48
49
50
51
45
46
47
48
49
50
43
44
45
46
47
35
36
37
38
32
34
36
38
40
34
36
38
40
40
41
42
43
44
48.5
49.5
50.5
40
41
42
43
44
40.5
41.5
42.5
38
39
40
41
31
32
33
34
35
36
37
Max
imum
tem
per
atur
e (°
C)
1975 1985 1995 2005 1975 1985 1995 2005 1975 1985 1995 2005
1975 1985 1995 2005 1975 1985 1995 2005 1975 1985 1995 2005
1975 1985 1995 2005 1975 1985 1995 2005 1980 1990 2000 2010
1975 1985 1995 2005 1975 1985 1995 2005 1975 1985 1995 2005
1975 1985 1995 2005 1975 1985 1995 2005 1975 1985 1995 2005
Aleppo Eilat Kuwait
Amman Isparta Nicosia
Cairo Istanbul
Dhahran Jerusalem
Shiraz
Tabriz
VanDoha Kermanshah
Fig. 4. Maximum temperature within clusters with trend lines for the 50% quantile (blue) and 75% quantile (red)

Clim Res 63: 99–113, 2015108
0
2
4
6
8
10
0
2
4
6
8
10
12
0
1
2
3
4
5
6
7
0
1
2
3
4
5
6
7
0
2
4
8
10
6
0
2
4
8
10
6
0
2
4
8
6
0
2
4
8
10
6
Hea
t w
ave
dur
atio
n (d
)
0
1
2
3
4
5
6
0
1
2
3
4
5
6
7
0
1
2
3
4
5
6
7
0
1
2
3
4
5
6
7
0
2
4
6
8
10
12
0
1
2
3
4
5
6
7
0
2
4
8
6
1975 1985 1995 2005 1975 1985 1995 2005 1975 1985 1995 2005
1975 1985 1995 2005 1975 1985 1995 2005 1975 1985 1995 2005
1975 1985 1995 2005 1975 1985 1995 2005 1975 1985 1995 2005
1975 1985 1995 2005 1975 1985 1995 2005 1975 1985 1995 2005
1975 1985 1995 2005 1975 1985 1995 2005 1975 1985 1995 2005
Aleppo Eilat Kuwait
Amman Isparta Nicosia
Cairo Istanbul
Dhahran Jerusalem
Shiraz
Tabriz
VanDoha Kermanshah
Fig. 5. Heat wave duration in days for all stations with trend lines for the 50% quantile (blue) and 90% quantile (red)

Tanarhte et al.: Heat wave characteristics in the Levant
waves, especially in the desert areas such as inSaudi Arabia.
EVT distributions have been used to model the fre-quency and cluster maxima of heat waves and trendshave been detected. Other characteristics of heatwaves e.g. cluster duration and maximum tempera-tures within clusters have been explored. We foundthat the highest temperature in the summer season(as defined in this study) is increasing in Dhahran,Doha, Kuwait and Isparta, and for the other stationsno significant changes could be detected. On theother hand, we found that the number of heat waves,defined as clusters, increased drastically over the lastfour decades at most stations, whereas the intensityand the duration of the heat waves did not change.The return levels of the highest maximum tempera-tures could be quantified using GEV distribution.
The comparison of our results to similar studiesusing ETCDDI indices shows discrepancies becauseof the different methodology and definitions of sum-mer and heat waves applied here. For example,Kostopoulo et al. (2005) found a significant positivetrend in the Tx90 index (which is defined as ‘dayswith Tmax > 90th percentile of daily Tmax of thebase period’) across the eastern Mediterranean indi-cating an increase in the very warm days. This couldnot be generalized for this region in our analysis. Aclear trend in the highest maximum temperatureshas been observed only in the Middle East stations.Similarly, Kuglitsch et al. (2010) used modifiedETCDDI indices to quantify the trends in heat waveintensity, heat wave length and heat wave number inthe eastern Mediterranean, with a high station den-
sity in Turkey and for the period 1960−2006. Theyfound a large increase in the mean intensity, lengthand number over this period. This could not be con-firmed in our analysis, in which only the cluster num-ber increased. On the other hand, our results are con-sistent with the results of Zhang et al. (2005) for theMiddle East region, Donat et al. (2014) for the Arabregion and Almazroui et al. (2014) for Saudi Arabia,in which significant, increasing trends have beenfound in the annual maximum of daily maximumtemperature.
The focus of this study is to explore new methodsand approaches to statistically characterize heatwaves in a region very concerned with heat waves.The methodology allows us to understand severalaspects of heat waves using robust statistical meth-ods. EVT offers a broad range of tools to analyze heatwaves and their characteristics.
This study includes several assumptions related tothe definition of a heat wave. The studied stationdata span several climate zones, and the descriptionof heat waves is based on different methods. Usingthe EVT methods allows an ‘objective’ definition,based only on statistical criteria. Nevertheless, thechoice of the threshold above which a heat wave isdefined can be crucial. The fitting to the GPD of thetemperature anomalies is possible only if the chosenthreshold is high enough so that the assumption ofexceeding a sufficiently high threshold is valid. Thechoice of the 95% quantile threshold needs to beexamined carefully in case it is high enough to satisfythis assumption. Similarly, the ‘summer’ season hasbeen defined based on the data in this study, and the
109
Station GEV parameters RL10 RL20 RL50 Location μ Scale σ Shape ζ
Aleppo 41.50 ± 0.32 1.72 ± 0.24 0.009 ± 0.13 45.50 (44.09 – 46.91) 46.68 (44.55 – 48.81) 48.34 (44.92 – 51.77)Amman 38.78 ± 0.29 1.58 ± 0.21 0.15 ± 0.12 41.79 (40.89 – 42.70) 42.55 (41.37 – 43.73) 43.42 (41.72 – 45.12)Cairo 41.94 ± 0.28 1.54 ± 0.21 0.35 ± 0.13 44.32 (43.77 – 44.86) 44.75 (44.13 – 45.37) 45.17(44.35 – 45.99)Dhahran 47.60 ± 0.23 1.28 ± 0.16 0.23 ± 0.11 49.84 (49.24 – 50.43) 50.33 (49.62 – 51.04) 50.86 (49.91 – 51.81)Doha 46.82 ± 0.22 1.24 ± 0.14 0.26 ± 0.07 48.92 (48.41 – 49.44) 49.37 (48.79 – 49.94) 49.83 (49.15 – 50.51)Eilat 44.35 ± 0.17 0.91 ± 0.12 0.049 ± 0.13 46.30 (45.62 – 46.97) 46.88 (45.93 – 47.82) 47.60 (46.14 – 49.06)Jerusalem 36.04 ± 0.35 1.77 ± 0.24 0.28 ± 0.10 38.99 (38.19 – 39.78) 39.60 (38.71 – 40.48) 40.22 (39.14 – 39.14)Isparta 35.22 ± 0.24 1.32 ± 0.17 0.24 ± 0.12 37.51 (36.90 – 38.12) 38.01 (37.27 – 38.75) 38.55 (37.53 – 39.56)Istanbul 34.42 ± 0.31 1.68 ± 0.23 0.074 ± 0.13 37.90 (36.73 – 39.08) 38.90 (38.90 – 40.54) 40.11 (37.60 – 42.63)Kermanshah 41.55 ± 0.24 1.26 ± 0.18 0.40 ± 0.13 43.40 (43.00 – 43.81) 43.72 (43.29 – 44.14) 44.01 (43.48 – 44.53)Kuwait City 49.34 ± 0.21 1.17 ± 0.16 0.56 ± 0.11 50.84 (50.59 – 51.10) 51.04 (50.81 – 51.27) 51.20 (50.96 – 51.45)Nicosia 41.33 ± 0.20 1.03 ± 0.14 0.14 ± 0.149 43.31 (42.69 – 43.94) 43.83 (42.97 – 44.69) 44.42 (43.13 – 45.72)Shiraz 40.74 ± 0.18 0.99 ± 0.12 0.32 ± 0.085 42.33 (41.96 – 42.70) 42.64 (42.24 – 43.04) 42.95 (42.48 – 43.41)Tabriz 38.06 ± 0.23 1.24 ± 0.16 0.30 ± 0.10 39.58 (39.58 – 40.56) 40.47 (39.92 – 41.03) 40.88 (40.18 – 41.57)Van 32.06 ± 0.29 1.60 ± 1.60 0.22 ± 0.09 34.90 (34.14 – 35.65) 35.54 (34.65 – 36.43) 36.24 (35.09 – 37.39)
Table 3. Estimates of the generalized extreme value (GEV) parameters with their standard errors, and return level (RL) values at 10, 20 and 50 yr with their 95% confidence intervals (in parentheses) for all stations (°C)
Clim Res 63: 99–113, 2015
fact that the probability of the temperature exceed-ing the threshold is high enough to be considered.This explains the length of the season considered.These choices can influence the results.
The use of EVT helps to quantify the return levelsof severe heat waves, with a robust assessment oftheir characteristics and their trends. Future investi-gation of 21st century projections of heat waves byclimate models would provide an improved under-standing and better tools for policy makers, e.g. inview of adaptation in the energy and water sectors inthis region.
LITERATURE CITED
Alexander LV, Zhang X, Peterson TC, Caesar J and others(2006) Global observed changes in daily climate extremesof temperature and precipitation. J Geophys Res Atmos111: D05109, doi: 10.1029/ 2005 JD 006290
Almazroui M, Nazrul Islam M, Dambul R, Jones PD (2014)Trends of temperature extremes in Saudi Arabia. Int JClimatol 34: 808−826
Athar H (2014) Trends in observed extreme climate indicesin Saudi Arabia during 1979−2008. Int J Climatol 34: 1561−1574.
Christensen JH, Christensen OB (2007) A summary of thePRUDENCE model projections of changes in Europeanclimate by the end of this century. Clim Change81(Suppl1): 7−30
Coelho CAS, Ferro CAT, Stephenson DB, Steinskog DJ(2008) Methods for exploring spatial and temporal vari-ability of extreme events in climate data. J Clim 21: 2072−2092
Coles S (2001) An introduction to statistical modeling ofextreme values. Springer, London
Diffenbaugh NS, Pal JS, Giorgi F, Gao X (2007) Heat stressintensification in the Mediterranean climate changehotspot. Geophys Res Lett 34: L11706, doi: 10.1029/ 2007GL030000
Donat MG, Peterson TC, Brunet M, King AD and others(2014) Changes in extreme temperature and precipita-tion in the Arab region: long-term trends and variabilityrelated to ENSO and NAO. Int J Climatol 34: 581−592
Efthymiadis D, Goodess CM, Jones PD (2011) Trends inMediterranean gridded temperature extremes and large-scale circulation influences. Nat Hazards Earth Syst Sci11: 2199−2214.
Erlat E, Türkes M (2012) Analysis of observed variability andtrends in numbers of frost days in Turkey for the period1950−2010. Int J Climatol 32: 1889−1898
Erlat E, Türkes M (2013) Observed changes and trends innumbers of summer and tropical days, and the 2010 hotsummer in Turkey. Int J Climatol 33: 1898−1908
Evans JP (2009) 21st century climate change in the MiddleEast. Clim Change 92: 417−432
Ferris R, Ellis RH, Wheeler TR, Hadley P (1998) Effect of hightemperature stress at anthesis on grain yield and biomassof field grown crops of wheat. Ann Bot 82: 631−639
Fischer EM, Schär C (2010) Consistent geographical pat-terns of changes in high-impact European heatwaves.Nat Geosci 3: 398−403
Folland CK, Miller C, Bader D, Crowe M and others (1999)Workshop on indices and indicators for climate extremes,Asheville, NC, USA, 3−6 June 1999: Breakout Group C: temperature indices for climate extremes. Clim Change42: 31−43
Förster H, Lilliestam J (2010) Modeling thermoelectricpower generation in view of climate change. Reg Envi-ron Change 10: 327−338
Fowler HJ, Ekström M, Kilsby CG, Jones PD (2005) Newestimates of future changes in extreme rainfall across theUK using regional climate model integrations. 1. Assess-ment of control climate. J Hydrol (Amst) 300: 212−233
Frich P, Alexander LV, Della-Marta P, Gleason B, HaylockM, Klein Tank AMG, Peterson T (2002) Observed coher-ent changes in climatic extremes during the second halfof the twentieth century. Clim Res 19: 193−212
Furrer EM, Katz RW, Walter MD, Furrer R (2010) Statisticalmodeling of hot spells and heat waves. Clim Res 43: 191−205
Gao X, Giorgi F (2008) Increased aridity in the Mediterran-ean region under greenhouse forcing estimated fromhigh-resolution simulations with a regional climatemodel. Global Planet Change 62: 195−209
Hansen J, Sato M, Ruedy R (2012) Perception of climatechange. Proc Natl Acad Sci USA 109: E2415−E2423
Hertig E, Seubert S, Jacobeit J (2010) Temperature extremesin the Mediterranean area: trends in the past and assess-ments for the future. Nat Hazards Earth Syst Sci 10: 2039−2050.
IPCC (Intergovernmental Panel on Climate Change) (2007)Climate change 2007: impacts, adaptation and vulnera-bility. Summary for policymakers. Contribution of Work-ing Group II to the Fourth Assessment Report of theIntergovernmental Panel on Climate Change. Cam-bridge University Press, Cambridge
IPCC (Intergovernmental Panel on Climate Change) (2012)Managing the risks of extreme events and disasters toadvance climate change adaptation. A Special Reportof Working Groups I and II of the IntergovernmentalPanel on Climate Change. Cambridge University Press,Cambridge
Jones PD, Horton EB, Folland CK, Hulme M, Parker DE,Basnett TA (1999) The use of indices to identify changesin climatic extremes. Clim Change 42: 131−149
Karl TR, Easterling DR (1999) Climate extremes: selectedreview and future research directions. Clim Change 42: 309−325
Katz RW (2010) Statistics of extremes in climate change.Clim Change 100: 71−76
Kharin VV, Zwiers FW (2000) Changes in the extremes in anensemble of transient climate simulations with a coupledatmosphere−ocean GCM. J Clim 13: 3760−3788
Kharin VV, Zwiers FW (2005) Estimating extremes in tran-sient climate change simulations. J Clim 18: 1156−1173
Kharin VV, Zwiers FW, Zhang X (2005) Intercomparison ofnear-surface temperature and precipitation extremes inAMIP-2 simulations, reanalyses, and observations.J Clim 18: 5201−5223
Kharin VV, Zwiers FW, Zhang X, Hegerl GC (2007) Changesin temperature and precipitation extremes in the IPCCensemble of global coupled model simulations. J Clim20: 1419–1444
Klein Tank AMG, Wijngaard JB, Können GP, Böhm R andothers (2002) Daily dataset of 20th-century surface airtemperature and precipitation series for the European
110

Tanarhte et al.: Heat wave characteristics in the Levant
Climate Assessment. Int J Climatol 22: 1441−1453Klein Tank AMG, Zwiers FW, Zhang X (2009) Guidelines on
analysis of extremes in a changing climate in support ofinformed decisions for adaptation. WMO-TD No. 1500,WMO, Geneva
Klok EJ, Klein Tank AMG (2009) Updated and extendedEuropean dataset of daily climate observations. Int J Cli-matol 29: 1182−1191
Koch H, Vögele S (2009) Dynamic modelling of waterdemand, water availability and adaptation strategies forpower plants to global change. Ecol Econ 68: 2031−2039
Koenker R, Bassett G Jr (1978) Regression quantiles. Econo-metrica J Econometric Soc 46: 33–50
Koppe C, Kovats RS, Jendritzky G, Menne B (2004) Heat-waves: risks and responses. Health and Global Environ-mental Change Series, Vol. 2, WHO Regional Office forEurope, Geneva
Kostopoulou E, Jones PD (2005) Assessment of climate ex -tremes in the Eastern Mediterranean. Meteorol AtmosPhys 89: 69−85
Kostopoulou E, Giannakopoulos C, Hatzaki M, Karali A,Hadjinicolaou P, Lelieveld J, Lange MA (2014) Spatio-temporal patterns of recent and future climate extremesin the eastern Mediterranean and Middle East region.Nat Hazards Earth Syst Sci 14: 1565−1577.
Kousari MR, Ahani H, Hendi-zadeh R (2013) Temporal andspatial trend detection of maximum air temperature inIran during 1960−2005. Global Planet Change 111: 97−110
Kuglitsch FG, Toreti A, Xoplaki E, Della-Marta PM, ZerefosCS, Türkes M, Luterbacher J (2010) Heat wave changesin the eastern Mediterranean since 1960. Geophys ResLett 37: L04802, doi: 10.1029/ 2009 GL041841
Leadbetter MR, Lindgren G, Rootzén H (1983) Extremes andrelated properties of random sequences and processes.Springer, New York, NY
Lelieveld J, Hadjinicolaou P, Kostopoulou E, Giannakopou-los C, Pozzer A, Tanarhte M, Tyrlis E (2013) Model pro-jected heat extremes and air pollution in the easternMediterranean and Middle East in the twenty-first cen-tury. Reg Environ Change 14: 1937−1949
Moriondo M, Good P, Durao R, Bindi M, Giannakopoulos C,Corte-Real J (2006) Potential impact of climate change
on fire risk in the Mediterranean area. Clim Res 31: 85−95Naveau P, Nogaj M, Ammann C, Yiou P, Cooley D, Jomelli V
(2005) Statistical methods for the analysis of climateextremes. CR Geosci 337: 1013−1022
Önol B, Semazzi FHM (2009) Regionalization of climatechange simulations over the eastern Mediterranean.J Clim 22: 1944−1961
Orlowsky B, Seneviratne SI (2011) Global changes inextremes events: regional and seasonal dimension. ClimChange 110: 669–696
Peterson TC, Easterling DR, Karl TR, Groisman P and others(1998) Homogeneity adjustments of in situ atmosphericclimate data: a review. Int J Climatol 18: 1493−1517
Rahimzadeh F, Asgari A, Fattahi E (2009) Variability ofextreme temperature and precipitation in Iran duringrecent decades. Int J Climatol 29: 329−343
Stephenson A, Gilleland E (2006) Software for the analysisof extreme events: the current state and future direc-tions. Extremes 8: 87−109
Tayanç M, Im U, Dogruel M, Karaca M (2009) Climatechange in Turkey for the last half century. Clim Change94: 483−502
Tebaldi C, Knutti R (2007) The use of the multi-modelensemble in probabilistic climate projections. PhilosTrans R Soc Lond A 365: 2053−2075
van den Brink HW, Können GP, Opsteegh JD (2004) Statis-tics of extreme synoptic-scale wind speeds in ensemblesimulations of current and future climate. J Clim 17: 4564−4574
Walter MD (2008) Application of the statistical theory ofextreme values to heat waves. www.isse.ucar.edu/extremevalues/MDWFinalPaper.pdf
Wang XL (2008) Penalized maximal F-test for detectingundocumented mean-shifts without trend-change.J Atmos Ocean Technol 25: 368−384
WMO (2011) World’s 10th warmest year, warmest year withLa Niña event, lowest Arctic sea ice volume. Pressrelease no. 935, WMO, Geneva
Zhang X, Aguilar E, Sensoy S, Melkonyan H and others(2005) Trends in Middle East climate extreme indicesfrom 1950 to 2003. J Geophys Res 110: D22104, doi: 10.1029/ 2005JD006181
111

Clim Res 63: 99–113, 2015112
Aleppo Eilat Kuwait
Amman Isparta Nicosia
Cairo Istanbul
Dhahran Jerusalem
Shiraz
Tabriz
VanDoha Kermanshah
Fig. A1. Histograms and estimated generalized extreme value (GEV) probability functions for the highest summer maximum temperature at the 15 stations
Appendix

Tanarhte et al.: Heat wave characteristics in the Levant 113
Aleppo Eilat Kuwait
Amman Isparta Nicosia
Cairo Istanbul
Dhahran Jerusalem
Shiraz
Tabriz
VanDoha Kermanshah
Fig. A2. Q-Q plots for the cluster maximum excess under the generalized Pareto (GP) distribution at the 15 stations
Editorial responsibility: Filippo Giorgi, Trieste, Italy
Submitted: May 13, 2014; Accepted: January 8, 2015Proofs received from author(s): March 30, 2015, 2015