a gap analysis of employee training needs jessica … · a gap analysis of employee training needs...
TRANSCRIPT

1
A GAP ANALYSIS OF EMPLOYEE TRAINING NEEDS
IN SUPPLY CHAIN MANAGEMENT
JESSICA FRASER
Submitted in fulfilment of the requirements for the degree:
DOCTOR OF COMMERCE (BUSINESS MANAGEMENT)
in the
DEPARTMENT OF BUSINESS MANAGEMENT
FACULTY OF ECONOMIC AND MANAGEMENT SCIENCES
at the
UNIVERSITY OF PRETORIA
SUPERVISOR: Dr. C. E. Eresia-Eke
CO-SUPERVISOR: Prof. J. J. Van Vuuren
NOVEMBER 2013
©© UUnniivveerrssiittyy ooff PPrreettoorriiaa
2
DECLARATION
I hereby declare that:
A GAP ANALYSIS OF EMPLOYEE TRAINING NEEDS
IN SUPPLY CHAIN MANAGEMENT
I, the undersigned, declare that the work contained in this thesis is original
work, that all the sources used or quoted have been indicated and
acknowledged by means of complete references and that this thesis has not
been previously in its entirety or in part been submitted at another university
for a degree.
…………………..
Jessica Fraser
November, 2013
©© UUnniivveerrssiittyy ooff PPrreettoorriiaa

3
ACKNOWLEDGEMENTS
I hereby extend my heartfelt appreciation to the following:
The Creator of All The realisation of the success of all projects is pre-
- ordained.
My husband, William For helping me stay focused
Friends and family For their unwavering support
My supervisor Dr. C. E. Eresia-Eke for his dedication to the
success of this project and his thorough editing
practices
My co-supervisor Prof. J.J. van Vuuren for his patience and
guidance in the statistical analysis phase of the
research
My statistical support Mrs. R. Owen for a second round of data input and
analysis although she retired during the process
My copy editor Mrs. E. A. Pearse for being willing to tackle the
process at short notice
Colleagues For setting the example and helping when I
needed various forms of assistance
Professional bodies For access to membership and respondents
All examiners For their time and effort despite facing many
deadlines
©© UUnniivveerrssiittyy ooff PPrreettoorriiaa

4
ABSTRACT
A GAP ANALYSIS OF EMPLOYEE TRAINING NEEDS
IN SUPPLY CHAIN MANAGEMENT
by Jessica Fraser
Supervisor: Dr. C. E. Eresia-Eke
Co-supervisor: Prof. J. J. van Vuuren
Department: Business Management
Degree: Doctor Commercii
Training is often delivered before training needs analyses were completed for
affected employees. The overall purpose of the study was to identify gaps in
the perceived training needs between managers and employees. The first
gap found that managers differ in how they perceived employees’ training
needs. The second gap was found amongst employees about their own
training needs. The managers responded through an electronic questionnaire
and a conference, while employees completed their questionnaires at their
business premises. The unique approach to this study lies in the fact that the
employees were involved in the research while it is more common only to
allow managers to complete questionnaires.
Globally there is a shortage of supply chain management skills. Following the
2008 global recession, well-trained staff could allow businesses to recover
economically. However the literature revealed that a lack of existing
qualifications rendered employees vulnerable to lay-offs. For decades,
governments, businesses and tertiary institutions have been mismatched in
meeting their existing/future skills requirements. The research outcomes
could help to prevent wasting resources required to train employees.
The goal was accomplished by testing nine hypotheses against empirical
evidence gathered in supply chain industries. The findings confirmed that
managers and employees do not always share the same perceptions.
Hypotheses testing on the following variables: the types of training, the format
©© UUnniivveerrssiittyy ooff PPrreettoorriiaa

5
of training, motivating/demotivating variables for attending training, revealed
differences. Other variables include respondents’ existing educational
qualifications, their gender, age and career tenure. The respondents were
questioned about signing contracts before being sent on training programs.
This thesis reported and analysed the findings of three questionnaires. The
study was in-field for four months in 2011. By using supply chain professional
associations to target respondents the study yielded a more credible reflection
of industry phenomena.
The research contribution lies in the fact that it is a multi-disciplinary study
trying to identify whether gaps exist in perceived training needs amongst
respondents and why. It integrates theory from the disciplines of human
resources, training and businesses management in structured supply chain
networks. Future training programs can thus be tailored towards meeting
actual employee training needs to align organisational with personal
objectives. This study can help alleviate the skills shortage by emphasizing
training needs analyses before the commencement of training programs.
©© UUnniivveerrssiittyy ooff PPrreettoorriiaa

6
TABLE OF CONTENTS
PAGE
LIST OF FIGURES 9
LIST OF TABLES 10
CHAPTER ONE INTRODUCTION 14
1.1. INTRODUCTION 14 1.2. PROBLEM STATEMENT 14 1.3. RESEARCH QUESTIONS 17 1.4. RESEARCH OBJECTIVES 18 1.5. RESEARCH HYPOTHESES 19 1.6. IMPORTANCE AND BENEFITS OF THE STUDY 21 1.7. RESEARCH DESIGN AND METHODOLOGY 22 1.7.1. DESCRIPTION OF OVERALL RESEARCH DESIGN 22 1.7.2. SAMPLING 24 1.7.3. THE RESPONDENTS’ PROFILES 26 1.7.4. DATA COLLECTION 27 SURVEY METHOD 27 MEASUREMENT 28 QUESTIONNAIRE DESIGN 28 PRE-TESTING 28 1.8. DATA ANALYSIS 29 1.9. ASSESSING VALIDITY AND RELIABILITY 30 1.10. DELIMITATIONS AND ASSUMPTIONS 31 1.11. RESEARCH ETHICS 32 1.12. CHAPTER OUTLINE 33 1.13. CONCLUSION 34 CHAPTER TWO EDUCATION, TRAINING AND DEVELOPMENT (ETD) 35 2.1. INTRODUCTION 36 2.2. EDUCATION 37 2.3. HISTORY OF SOUTH AFRICAN EDUCATION 45 2.4. TRAINING 53 2.5. DEVELOPMENT 59 2.6. REASONS TO FOCUS ON TRAINING 60 2.7. CONCLUSION 65 CHAPTER THREE TRAINING NEEDS ANALYSIS 67
3.1. INTRODUCTION 68 3.2 TRAINING NEEDS ANALYSIS 68 3.2.1. The need for training needs analyses 71 3.2.2. Responsibility to conduct TNA 76 3.3 MODELS OF TRAINING NEEDS ANALYSIS 79 3.3.1. Boydell’s Systems Model of TNA 80 3.3.2. Mager and Pipe’s Human Performance Model of TNA 81 3.3.3. The Zemke and Kramlinger Model of TNA 83 3.4. REASONS TO FOCUS ON TRAINING NEEDS ANALYSIS 88 3.4.1 The importance of quality training 88 3.4.2 The aging future workforce 89 3.5 CONCLUSION 93
©© UUnniivveerrssiittyy ooff PPrreettoorriiaa

7
CHAPTER FOUR SUPPLY CHAIN MANAGEMENT AND TRAINING 93
4.1. INTRODUCTION 95 4.2. SUPPLY CHAIN MANAGEMENT (SCM) 96 4.2.1. ORIGINS AND EVOLUTION OF SUPPLY CHAIN MANAGEMENT 97 4.2.2. SCM AS PHILOSOPHY 100 4.2.3. ACADEMICS’ AND INDUSTRY’S SEARCH FOR THE SCM DEFINITION 102 4.3. DEMAND FOR SCM TALENT IN CHANGING MARKETS 110 4.3.1. THE CHALLENGES OF UNMET SKILLS IN SCM 111 4.3.2. WOMEN AND SKILLS DEVELOPMENT IN SCM 116 4.3.3. ADDRESSING FUTURE SKILLS GAPS 126 4.4. SOUTH AFRICAN SCM TRAINING NEEDS 135 4.5. FUTURE SCM RESEARCH TRENDS 136 4.6. CONCLUSION 138
CHAPTER FIVE RESEARCH METHODOLOGY 138
5.1. INTRODUCTION 140 5.2. RESEARCH PROBLEM 140 5.3. RESEARCH OBJECTIVES AND HYPOTHESES 141 5.4. RESEARCH DESIGN 144 5.5. THE SAMPLING PROCESS 146 5.5.1. The sampling process and sampling error 146 5.5.2. Sample population definition 147 5.5.3. Sampling frame 148 5.5.4. Sample size 148 5.5.5. Sampling method 150 5.6. THE DATA COLLECTION PROCESS 153 5.6.1. Questionnaire design 153 5.6.2. Research Intervention 155 5.6.3 Data collection steps 157 5.6.4. Pre-testing of the questionnaire 159 5.6.5. Data collection and questionnaire reliability and validity 160 5.7. DATA ANALYSIS PROCEDURE 163 5.7.1. Data capture and data editing 163 5.7.2. Data analysis focus 164 Descriptive data analysis 164 Comparative data analysis 165 5.7.3. Shortcomings and sources of error 168 5.8. CONCLUSION 169 CHAPTER SIX RESEARCH FINDINGS 169
6.1. INTRODUCTION 170 6.2. DESCRIPTIVE STATISTICAL FINDINGS 171 6.2.1. DEMOGRAPHIC FINDINGS –MANAGERS 172 6.2.2. DEMOGRAPHIC FINDINGS –EMPLOYEES 177 6.3. HYPOTHESES AND INFERENTIAL STATISTICS 179 6.3.1. SECTION ONE: TESTS OF PROPORTION 181 6.3.2. SECTION TWO: TESTS OF BOTH INDEPENDENT AND DEPENDENT GROUPS ON 3+MEASURES
189
6.3.3. SECTION THREE: COMPARATIVE TESTS BETWEEN TWO EMPLOYEE GROUPS (TNA2 AND TNA3) AND THE MANAGERS (TNA1)
213
6.3.4. SECTION FOUR: COMPARING THREE GROUPS’ DEMOTIVATING REASONS
225
6.3.5. SECTION FIVE: TEST OF ASSOCIATION 234
©© UUnniivveerrssiittyy ooff PPrreettoorriiaa

8
6.3.6. SECTION SIX: TEST OF PROPORTION 237 6.3.7. SECTION SEVEN: MEASURE OF PROPORTION & ASSOCIATION 239 6.3.8. SECTION EIGHT: MEASURE OF PROPORTION AND ASSOCIATION 242 6.3.9. SECTION NINE: TEST OF PROPORTION 244 6.4. SUMMARY OF FINDINGS IN TRAINING NEEDS 246 6.4.1. HYPOTHESIS 1 246 6.4.2. HYPOTHESIS 2 246 6.4.3. HYPOTHESIS 3 251 6.4.4. HYPOTHESIS 4 252 6.4.5. HYPOTHESIS 5 254 6.4.6. HYPOTHESIS 6 254 6.4.7. HYPOTHESIS 7 255 6.4.8. HYPOTHESIS 8 255 6.4.9. HYPOTHESIS 9 256 6.5. CONCLUSION 257 CHAPTER SEVEN CONCLUSIONS AND RECOMMENDATIONS 261
7.1. INTRODUCTION 262 7.2. THEORY VERSUS FINDINGS 265 7.2.1. THEORY VERSUS FINDINGS FOR HYPOTHESIS ONE 265 7.2.2. THEORY VERSUS FINDINGS FOR HYPOTHESIS TWO 268 ON-THE-JOB TRAINING 268 IN-HOUSE TRAINING 269 SEMINAR/CONFERENCE TRAINING 269 SHORT-COURSE TRAINING 270 PRODUCT TRAINING WITH SUPPLIERS 271 DISTANCE EDUCATION TRAINING 272 SELF-TRAINING 272 ONLINE/WEB TRAINING 273 7.2.3 THEORY VERSUS FINDINGS FOR HYPOTHESIS THREE 273 7.2.4. THEORY VERSUS FINDINGS FOR HYPOTHESIS FOUR 274 7.2.5. THEORY VERSUS FINDINGS FOR HYPOTHESIS FIVE 275 7.2.6. THEORY VERSUS FINDINGS FOR HYPOTHESIS SIX 277 7.2.7. THEORY VERSUS FINDINGS FOR HYPOTHESIS SEVEN 277 7.2.8. THEORY VERSUS FINDINGS FOR HYPOTHESIS EIGHT 278 7.2.9. THEORY VERSUS FINDINGS FOR HYPOTHESIS NINE 279 7.3 RESEARCH CONTRIBUTION 281 7.3.1 VALUE OF RESEARCH ACROSS DISCIPLINES 282 7.3.2 VISIBILITY OF TRAINING NEEDS ANALYSES 282 7.3.3 IMPROVING THE MOTIVATION FOR TRAINING 283 7.3.4 ADDRESSING THE GAP BETWEEN MANAGERS AND EMPLOYEES 284 7.3.5 ADDRESSING THE GAP BETWEEN TRAINERS AND TRAINEES 285 7.3.6. MORE TRAINING MEANS MORE LEVIES RECLAIMED 285 7.4. LIMITATIONS OF THE STUDY 286 7.5. RECOMMENDATIONS FOR FURTHER RESEARCH 286 7.6. CONCLUSION 287 REFERENCES 289 ANNEXURES 302
©© UUnniivveerrssiittyy ooff PPrreettoorriiaa

9
LIST OF FIGURES
PAGE Figure 1.1. The research onion 22 Figure 1.2. The research model 34 Figure 2.1. The national structures for ETD and skills development in South Africa.
48
Figure 3.1. The five stages of the training cycle 70 Figure 3.2. Job Analysis as a human resource management tool 77 Figure 3.3. Boydell’s system model of training needs analysis 81 Figure 3.4. The Zemke and Kramlinger Model of training needs analysis
84
Figure 3.5. The three ovals where the three TNA questions must overlap
86
Figure 4.1. The typical supply chain diagram 96 Figure 4.2. Results from the 2008 AMR study on SC skills available versus those prioritised in 2010.
114
Figure 4.3. An illustration of the research question by Myers, Griffith, Daugherty and Lusch (2004: 213).
130
Figure 5.1. Making comparisons using different statistical techniques
166
Figure 6.1. The business level at which managers’ function in their organisations
173
Figure 6.2. The industrial sector in which managers’ placed their organisations
174
Figure 6.3. Employment frequencies of “less than 10 years” for employees before the intervention (TNA2).
179
Figure 6.4. Types of hypotheses testing 180 Figure 6.5. Conclusion of tests for Hypotheses One variables 188 Figure 6.6. The Simple Kappa Statistics for the eight variables compared between employees samples (TNA2-TNA3) only.
210
Figure 7.1. The research model with the gaps identified from the completed research study
264
©© UUnniivveerrssiittyy ooff PPrreettoorriiaa

10
LIST OF TABLES PAGE
Table 2.1. The three new ETD related Acts and their main objectives 47 Table 2.2. The South African Sector Education Training Authorities (SETA) 51 Table 2.3. Age grouping of the South African employed citizens 61
Table 2.4. Highest level of education of the employed in South Africa 61 Table 2.5. The Cappelli principles to decide whether to make-or-buy human resource talent
63
Table 3.1. Questions from Mager and Pipe’s Human Performance Model 82 Table 4.1. Various supply chain management definitions 99 Table 4.2. Brief findings about the demand for human resources in supply chain management
110
Table 4.3. Brief findings about the 2007 CSCMP Career patterns of women in logistics study.
118
Table 4.4. Summary of knowledge and skills gaps highlighted in the 2009 CSCMP career patterns of women in logistics study.
123
Table 4.5. Brief findings about the 2012 CSCMP study: Career patterns of women in logistics.
125
Table 4.6. Brief findings about human resources training and skills in supply chain management
127
Table 5.1. Research design types and characteristics 145 Table 5.2. Example of sample size determination 149 Table 5.3. Advantages and disadvantages of alternative probability and non- probability sampling methods
151
Table 5.4. Link between research objectives and variables 156 Table 5.5. The research design and questionnaire credibility criteria 160 Table 5.6. Explanations of the non-parametric inferential statistics 167 Table 6.1. The size of organisations according to employee numbers reported by the management group TNA1.
175
Table 6.2. Length of employment with current organisations for managers 176 Table 6.3. Length of employment with current organisations for employees 178 Table 6.4. The training received by the managers in the 12 months preceding the survey.
181
Table 6.5. The training received by employees in the 12 months preceding the survey.
183
Table 6.6. Contingency table between TNA1 and TNA 2 on hard,soft and combination of both training skills
184
Table 6.7. Contingency table between TNA1 and TNA3 on hard, soft and combination of both training skills
185
Table 6.8. Contingency table between TNA2 and TNA3 on hard, soft and combination of both training skills
187
Table 6.9: Frequencies for the format of training “on-the-job” 190 Table 6.10: Correlation between TNA1 and TNA2 on the format of training “on-the-job”
191
Table 6.11. Correlation between TNA1 and TNA3 on the format of training “on-the-job”
192
Table 6.12. Simple Kappa Test between “employees before (TNA2) and employees after (TNA3)” with their preference for “on-the-job” training
193
Table 6.13. Frequencies for the format of training: “In-house” 193 Table 6.14. Frequencies for the correlation on format of training: “in house training” for TNA1-TNA2
194
Table 6.15. Correlation on format of training: “in-house” for TNA1-TNA3 194 Table 6.16. Correlation between employees before (TNA2) and employees fter (TNA3) on the format of “in-house” training
195
Table 6.17. Frequencies for the format of training: “seminar/ conference” 195 Table 6.18. Frequencies for the format of training “seminar/ conference training”
196
©© UUnniivveerrssiittyy ooff PPrreettoorriiaa
11
Table 6.19. Frequencies for the format of training: “seminar/ conference” 197 Table 6.20. Simple Kappa Test between the “employees before (TNA2) and employees after (TNA3)” in their preference for “seminar/conference” training
197
Table 6.21. Frequencies for the format of training: “short course training” 198 Table 6.22. Format of training “short course training” Fisher’s Exact Test for TNA2-TNA1
198
Table 6.23. Fisher’s Exact Test for TNA3-TNA1 for the format of training: “short course training”
199
Table 6.24. Contingency table for employees before (TNA2) and employees after (TNA3) preference for “short course” training
199
Table 6.25. Frequency comparison on format of training “product training with suppliers”
200
Table 6.26. Fisher’s Exact Test between TNA2-TNA1 for the format of training: “product training with suppliers”
200
Table 6.27. Fisher’s Exact Test between TNA3-TNA1 for the format of training: “product training with suppliers”
201
Table 6.28. Contingency table for employees before (TNA2) and employees after (TNA3) preference for “product training with suppliers”
201
Table 6.29. Frequencies for the format of training “distance education where employees study after hours by themselves”
202
Table 6.30: Fisher’s Exact Test between TNA2-TNA1 for the format of training “Distance education where employees study after- hours by themselves”
203
Table 6.31. Fisher’s Exact Test between TNA3-TNA1 for the format of training “Distance education where employees study after hours by themselves”
203
Table 6.32. Contingency table for employees before (TNA2) and employees after (TNA3) preference for “distance education”
204
Table 6.33. Frequencies of the format of training “self-training using books, journals and magazines”
204
Table 6.34: Fisher’s Exact Test between TNA2-TNA1 for the format of training: “self-training using books, journals and magazines”
205
Table 6.35. Fisher’s Exact Test between TNA3-TNA1 for the format of training “Self-training using books, journals and magazine
206
Table 6.36. Format of training: “Self-training using books, journals and magazines” Simple Kappa Statistic between TNA2-TNA3
206
Table 6.37. Frequencies for the format of training: “online/web courses” 207 Table 6.38: Fisher’s Exact Test between TNA2-TNA1 for the format of training: “Online/web courses”
207
Table 6.39. Fisher’s Exact Test between TNA 3-TNA1 for the format of training: “Online/web courses”
208
Table 6.40. Simple Kappa Statistics between TNA2-TNA3 for the format of training: “online/ web courses”
209
Table 6.41. Summary of the format of training (H2) hypotheses for managers (TNA1) versus employees (TNA2 and TNA3)
211
Table 6.42. Frequencies regarding training attendance motivated by prospects for promotion
212
Table 6.43. Frequencies regarding training attendance motivated by the need to stay informed
213
Table 6.44. Frequencies regarding training attendance motivated by the training being for free
214
Table 6.45 Frequencies regarding training attendance motivated by time off from work
215
Table 6.46. Frequencies regarding training attendance motivated by supervisors’ insistence that employees attend training
216
Table 6.47 Highest qualifications of employees (TNA2) and whether they agree with reasons to attend training
218
Table 6.48. Kruskal-Wallis test to determine if employees (TNA2) with 218
©© UUnniivveerrssiittyy ooff PPrreettoorriiaa

12
existing qualifications are keen to attend training “for promotion prospects” Table 6.49. Kruskal-Wallis test for “employees (TNA2) with existing qualifications” to see if they are keen to attend training “to learn something new”:
219
Table 6.50. Kruskal-Wallis test for employees with existing qualifications to determine if they are “keen to attend training when it is free”
220
Table 6.51. Kruskal-Wallis test for employees with existing qualifications to determine if they attend training “to get time off work”
220
Table 6.52. Kruskal-Wallis test to determine if Employees with existing qualifications attend training “when their bosses insist”
221
Table 6.53. Summary of ‘hypothesis three’ reasons motivating (TNA2) employees to attend training
221
Table 6.54. Summary of H3 reasons motivating employees to attend training (a paired sample t-test between TNA2-TNA3)
222
Table 6.55. Frequencies about being “too busy at work to attend training” 224 Table 6.56. Frequencies about “waiting for seniors to attend training first” 226 Table 6.57 (i). Frequencies for managers (TNA1) where tests and exams are the demotivating reason not to attend training’
227
Table 6.57 (ii). Frequencies for employees (TNA2 and TNA3) where tests and exams are a demotivating reason not to attend training’
228
Table 6.57 (iii). Paired sample test for employees on the de-motivating variable of having tests/exams involved with the training.
229
Table 6.58. Frequencies about the ”lack of relevance as a reason not to attend training”
229
Table 6.59 (i). Summary of variables demotivating employees from attending training compared to managers’ perceptions
231
Table 6.59 (ii). Summary of variables demotivating employees from attending training for TNA2-TNA3
231
Table 6.60. Highest qualifications reported by TNA 1 managers and TNA2 and TNA3 employees
234
Table 6.61 (i). Frequencies of staff with existing qualifications and their urgency to attend further training
234
Table 6.61 (ii). Summary of H5 employee respondent views about existing qualifications and urgency to attend training (a paired sample t- test between TNA2-TNA3)
235
Table 6.62. Frequencies for the variable that tests whether ‘female employees receive more training than male employees’
236
Table 6.63. Male versus female comparison on whether female employees receive more training than male employees for TNA2.
237
Table 6.64. Frequency of responses by employees in both TNA2 and TNA3. 238 Table 6.65. Frequency of responses by TNA1 managers about their employees’ age and their willingness to attend/not attend training.
239
Table 6.66. Statistics of location for late career stage (>45years old) employees for TNA2 and age
240
Table 6.67. The Pearson Correlation Coefficient for late career stage (>45years old) employees for TNA2 and employee age.
240
Table 6.68. Frequencies about long tenure employees and their willingness to attend training.
241
Table 6.69. Statistics of location for long tenure career stage employees for TNA2 and Number of years employed by the same organisation
242
Table 6.70. The Pearson Correlation Coefficient for long tenure where employee is employed for >10 years for TNA2 versus the number of years employed by the same organisation.
242
Table 6.71. Frequencies about employees’ willingness to attend training when employers insist they first sign a contract
243
Table 6.72. Managers’ frequencies about employee refusal to sign a contract to pay back before attending training
244
©© UUnniivveerrssiittyy ooff PPrreettoorriiaa

13
GLOSSARY OF ABBREVIATIONS
Abbreviation Meaning
B2B Business-to-business
CSCMP Council of Supply Chain Management Professionals
CAT Credit Accumulation Transfer
CSIR Council for Scientific Industrial Research
ETD Education, training and development
ETQA Education and Training Quality Authority
HEQC Higher Education Quality Council
HR Human resources
HRD Human resources development
HRM Human resource management
NQF National Qualifications Framework
NSA National Skills Authority
NSB National Standards Body
OBE Outcomes-based Education
OL Organisational learning
QCTO Quality Council for Trade and Occupations
SAQA South African Qualifications Authority
SC Supply chain
SCL Supply chain learning
SCM Supply chain management
SDA Skills Development Act
SDF Skills development facilitator
SETA Sector education training authority
SGB Standards Generating Body
SMMEs Small, medium, micro enterprises
TNA Training needs analysis
WSDP Workplace skills development plan
©© UUnniivveerrssiittyy ooff PPrreettoorriiaa

14
CHAPTER ONE INTRODUCTION
1.1. INTRODUCTION
1.2. PROBLEM STATEMENT
1.3. RESEARCH QUESTIONS
1.4. RESEARCH OBJECTIVES
1.5. RESEARCH HYPOTHESES
1.6. IMPORTANCE AND BENEFITS OF THE STUDY
1.7. RESEARCH DESIGN AND METHODOLOGY
1.8. DATA ANALYSIS
1.9. ASSESSING VALIDITY AND RELIABILITY
1.10. DELIMITATIONS AND ASSUMPTIONS
1.11. RESEARCH ETHICS
1.12. CHAPTER OUTLINE
1.13. CONCLUSION
©© UUnniivveerrssiittyy ooff PPrreettoorriiaa

15
1.1. INTRODUCTION
Skills shortages amongst South African supply chain (SC) organisations
appear to be one of the top five challenges facing the industry
(SupplyChainForesight, 2008: 2). This is a multidisciplinary study that
combines supply chain management (SCM), adult education, human resource
management and training. Far too few research studies currently focus on
the SCM training needs of industries despite the need for supply chain skills
and capabilities. The research intent is to use a research questionnaire to
test the perceptions of training needs held by supply chain managers and
non-managerial employees. The outcome would provide a means of
addressing any identified gaps in training needs analysis. Deductions made
from the literature review can best be presented in the form of the problem
statement below.
1.2. PROBLEM STATEMENT
The 2008 Barloworld-University of Stellenbosch study concluded that one of
the top five challenges facing industry is the existing lack of skills and
capabilities of SC staff (SupplyChainForesight, 2008: 14). The Council for
Scientific and Industrial Research (CSIR) follow-up study stated that the
previous labour training programs have been less than successful. The CSIR
recommendations urged that future training needs be analysed by placing
more emphasis on assessing training requirements (Logistics News Case
Study Annual, 2009: 11; Bushney & Meyer, 2008: 19). The CSIR study
shows that South African practitioners worry that their current SCM skills
shortage will hamper economic development and progress, if not addressed
as a matter of urgency.
In the South African marketplace the current gap between skills demand and
supply is due to many factors, which include:
� Confusion as to whether skills are scarce, critical or both. The resultant
demand estimates for certain skills are therefore not very certain
(Erasmus, J. 2009:2).
©© UUnniivveerrssiittyy ooff PPrreettoorriiaa

16
� Skills migration on the demand side: skilled staff have been attracted
by overseas companies (Sydhagen & Cunningham, 2007:129).
� Production of newly qualified graduates with skills irrelevant to the
needs of industry (Letseka, 2009: 89).
� The preponderance of under-qualified Apartheid legacy staff (on the
supply side) that need to be upskilled to equip them for existing jobs.
This is a slow process since 81% of the 12.8 million currently employed
have secondary and less-than-secondary levels of education
(Erasmus, et al., 2007: 125).
� South Africa’s preparations to host the 2010 FIFA World Cup football
tournament placed strain on the SCM system, thereby highlighting the
serious skills shortages more than ever (King, 2007: 10).
Training alone cannot instantaneously eradicate both demand and supply side
skills shortages. Although by itself, training is a useful intervention, it has
nevertheless been encumbered by problems. Some of these problems relate
to the following:
� For decades, managers have been slow to send staff on training
courses (Opperman & Meyer, 2008: 3)
� When employees were allowed to go on training, they struggled to
transfer skills and apply the new knowledge to their workplace. This
increased employers’ reluctance to send other employees on
subsequent training (Opperman & Meyer, 2008: 3)
� While some sectors of the economy train parts of their workforce, this
does not necessarily include everyone who has training needs
(McGrath & Patterson, 2008: 305)
� Many employees are sent for low-level National Qualifications
Framework (NQF1) training, which is not necessarily the training that
business entities need (McGrath & Patterson, 2008: 302)
� South African human resources (HR) practitioners pride themselves on
spending 3% of their budget on training, although this translates to only
R3613 on average per employee per annum (Bushney & Meyer,
2008:16)
©© UUnniivveerrssiittyy ooff PPrreettoorriiaa

17
� Training is done for administrative and legal compliance purposes, not
necessarily for what the training needs are (Bushney & Meyer,
2008:16)
As a result of the problems mentioned above, Sector Education Training
Authorities (SETAs) for all sectors of the economy confirm that many skills
development levies are not claimed back since business enterprises are not
training enough employees. During 2001/2002 only 21% of the 120225 firms
who had paid their skills development levies claimed back the funds for
training they had completed (Human Sciences Research Council, 2004).
This research aims to measure whether gaps exist between the training
needs as perceived by SC managers and training needs as perceived by
lower level, non-managerial staff. In the training context, a need is defined as
a gap between a perceived state of training (the current situation) and the
perceived future situation. Opperman and Meyer (2008: 3) state that
inadequate training needs analysis (TNA) is done before and after actual
training. Clearly this mismatch of SC training priorities will not be solved
easily. This research will not identify training need gaps to foster the
development of better training courses. By taking stock of relevant supply
chain (SC) training need perceptions, the researcher hopes that the research
will contribute to understanding the urgent national training requirements
better.
1.3. RESEARCH QUESTIONS
In the light of the macro-environment described for supply chain personnel,
the research questions are derived.
THE PRIMARY RESEARCH QUESTION IS STATED AS FOLLOWS:
Which gaps exist and why do they exist between the perceptions of training
needs held by management and employees within the supply chain
management (SCM) environment?
©© UUnniivveerrssiittyy ooff PPrreettoorriiaa
18
TH SECONDARY RESEARCH QUESTIONS ARE:
1.3.1. Which variables influence the perceptions of training needs held by
South African SCM managers and employees respectively?
The constructs under investigation include the types of training, which refer to
computer software training, contract management, financial management,
negotiation skills, new product training, occupational health and safety, people
skills, stress management, supervisory skills, time management, transport,
distribution and warehousing skills. The research constructs also included
existing educational qualifications, gender, the respondents’ career stages,
the duration of their current job tenure, signing a contract before training
considerations, a list of demotivating elements and a list of motivating
elements.
1.3.2. Which variables influence the perceptions of employees contrasted
against the perceptions of managers? I need to explain why I wanted to
investigate this aspect. The constructs under investigation will be the
same as stated above, which include the types of training, existing
educational qualifications, gender, the respondents’ career stages, the
duration of their current job tenure, signing a contract before training
considerations, a list of de-motivating elements and a list of motivating
elements.
1.3.3. How does the training content on previous courses that respondents
have already attended differ from what they perceive to be future
training content requirements? It is important to note that these
sections were open-ended questions. The answers were reported only
to their respective business organisations and are confidential. This
was a requirement that the researcher had to adhere to, in return for
having access to employee groups in the second phase of the research
project.
1.4. RESEARCH OBJECTIVES
©© UUnniivveerrssiittyy ooff PPrreettoorriiaa

19
The research questions are translated into the following nine research
objectives, namely to:
� determine whether there is a difference between managers' and
employees' types of training that were attended in the 12 months prior
to the study.
� determine which format of training is preferred by respondents
� determine the extent to which identified reasons motivate employees to
attend training
� determine the extent to which identified reasons demotivate employees
from attending training
� assess whether existing educational qualifications have any
relationship with respondents’ demand urgency for training
� test the perception whether females are offered more training
opportunities than males
� determine if late-career-stage employees (older than 45 years of age)
are less likely to request training than earlier career entrants
� establish the relationship, if any, between current job tenure (i.e. the
duration with the same organisation) and the willingness to attend
training
� ascertain whether employers’ insistence that employees sign a contract
will deter them from requesting more training
1.5. RESEARCH HYPOTHESES
For the sake of continuity and overview, the nine hypotheses that were
derived from the literature search are stated here. Note that the theory on
which the nine hypotheses are based will be highlighted as the reader
progresses through the historical scholarly views. The hypotheses will appear
in the condensed literature review chapters on Education, Training and
Development (Hypotheses 2, 5, 6,7, 8 and 9); Training needs analysis
(Hypotheses 1,3,7,8, and 9) and Supply chain management (Hypotheses 1-
9).
©© UUnniivveerrssiittyy ooff PPrreettoorriiaa

20
Derived from the literature review and the aforementioned research
questions and objectives, the research hypotheses (denoted H1 to H9)
are as follows:
H10: There is no significant difference in the training received by managers
and employees in the preceding 12 months.
H1A: There is a significant difference in the training received by managers
and employees in the preceding 12 months.
H20: There is no significant difference in the opinion of managers and
employees with regard to the preferred formats of training for
employees
H2A: There is a significant difference in the opinion of managers and
employees with regard to the preferred formats of training for
employees
H30: There is no significant difference between managers’ and employees’
perceptions regarding the reasons motivating employees to attend
training
H3A: There is a significant difference between managers’ and employees’
perceptions regarding the reasons motivating employees to attend
training
H40: There is no significant difference between perceived reasons
demotivating managers and employees from attending training
H4A: There is a significant difference between perceived reasons
demotivating managers and employees from attending training
©© UUnniivveerrssiittyy ooff PPrreettoorriiaa

21
H50 There is no relationship between existing educational qualifications and
urgency for employee training
H5 A: There is a relationship between existing educational qualifications and
urgency for employee training
H60: There is no gender-based difference in the perception that female
employees receive more training than males
H6 A: There is a gender-based difference in the perception that female
employees receive more training than males
H70: There is no difference in the frequency of training requests between
late-career-stage employees (older than 45 years) and others
H7A: There is a difference in the frequency of training requests between late-
career-stage employees (older than 45 years) and others
H80: There is no significant difference in the willingness to attend training
between long-tenure employees (employed >10 years) in the same
organisation and new recruits
H8 A: There is a significant difference in the willingness to attend training
between long-tenure employees (employed >10 years) in the same
organisation and new recruits
H90: Employees are not likely to request more training when employers
insist on a repayment contract
H9A: Employees are likely to request more training when employers insist on
a repayment contract
The nine hypotheses were tested, using more than one variable to describe
the constructs in the three questionnaires. Chapter five contains more
©© UUnniivveerrssiittyy ooff PPrreettoorriiaa

22
information about the questionnaire design, while the research findings on
each hypothesis are located in chapter six.
1.6. IMPORTANCE AND BENEFITS OF THE STUDY
The importance and benefits to be derived from this research study must be
seen in the light of the existence of the Labour Department’s scarce-skills
listing. In the last five-year cycle (2004-2009), the list has become more
comprehensive, indicating that training programs are not achieving the
desired effect. Currently, there is a gap between trained employees
demanded and those supplied, which is a normal economic phenomenon.
However, while training is being done, evidence that TNA are done before
sending employees on training courses, is not substantial (CIPD, 2008:1).
Due to this omission, there is the risk of wasting resources (time and money)
that arises from the misalignment of training programs. Training needs
analysis is the first step towards designing effective SCM training programs in
the future (beyond 2012), yet performance appraisals currently tend towards
informal discussions on training (CIPD, 2008: 2). This could lead to possible
demotivation of employees and lack of economic growth in the long run.
The world economies are currently trying to deal with repercussions from the
2008 recession and literature points out that training should be provided now
to anticipate the later upswing in the economy (Marlborough, 2003:20). South
African firms are also under a legal obligation through the National
Qualifications Framework to train or re-skill employees before deciding to
retrench them. Therefore TNA is imperative to guide training programs to be
implemented. The research study design and methodology follows based on
the important assumptions of recovery from recession and NQF adherence.
1.7. RESEARCH DESIGN AND METHODOLOGY
©© UUnniivveerrssiittyy ooff PPrreettoorriiaa

23
This section discusses the different parts of the research methodology and
the plan to collect the empirical data required for analysis. The in-depth
discussion on design and methodology appears in chapter five.
1.7.1. DESCRIPTION OF OVERALL RESEARCH DESIGN
This section describes the overall research design, which is the general
approach to the data collection and data analysis in order to attain the
research objectives mentioned above. By using the “onion” of research
approach as illustrated by Saunders, Lewis and Thornhill (2007:132), the
discussion starts at the core of the onion and proceeds outwards as shown in
Figure 1.1 below:
In Figure 1.1 the legend explains that levels 1-5 of the research onion refer to
the time horizon of the research study, the methods to be used, the research
strategy to be used, the approach between inductive and deductive reasoning
and finally the research philosophy respectively.
Figure 1.1. The research onion
Source: Adapted from Saunders, Lewis and Thornhill (2007:132)
From level 1, the time horizon of the research study will be cross-sectional,
not longitudinal, since empirical data will be collected at a particular point in
LEGEND: Levels(numbers) = Explanations 1. Time horizon of the
research study 2. The research method 3. The research strategy 4. The research approach
being either inductive or deductive reasoning
5. The research philosophy
Research design 1
2
3
4
5
©© UUnniivveerrssiittyy ooff PPrreettoorriiaa

24
time (Saunders, et al., 2007: 146, Leedy & Ormrod, 2005: 142). Cross-
sectional studies apply when using a questionnaire for data collection since it
reduces the amount of time to be physically spent in the business
organisations that form part of the research sample.
At level 2, the mixed method of research will be followed. This method uses
quantitative and qualitative data in parallel data collection and analyses
without changing the data (Saunders, et al., 2007: 145). This decision is
based on the purpose of the research, which is to provide both descriptive
and explanatory answers to the research questions. Mixed methods are not
to be confused with mixed model research since the research intention is not
to take quantitative data to turn them into qualitative data nor to take
qualitative data and turn it into a quantitative data approach (Saunders, et al,
2007: 146). Exploring the academic literature available on the topic made it
clear that gaps exist in the knowledge and context of the South African SC
organisations. Since the focus is on using the findings to establish
relationships between variables both qualitative and quantitative data may
prove useful (Saunders, et al. 2007: 134).
Level three of the research onion involves deciding on the research strategy
from the choices of experimental design, surveys, case studies, action
research, grounded theory, ethnography and archival research according to
Saunders, et al. (2007:135). Data findings cannot be extrapolated from case
studies. This proposed study will apply both the survey method and a
comparative strategy for the empirical data collection (Leedy & Ormrod,
2005:108). Time and cost implications also prohibit the use of too much
qualitative data, which would result from an ethnographic approach.
Therefore the proposed study will use the survey research strategy that allows
a contribution to be made to the existing literature with the most efficient use
of limited resources.
Surveys are popular research designs since they allow for the collection of
large volumes of data from the population without a commensurate financial
expense. The method is not without its associated difficulties since the
©© UUnniivveerrssiittyy ooff PPrreettoorriiaa

25
researcher is dependent on the goodwill of others for the completion of the
questionnaires. Data capturing and the subsequent analysis involved in the
survey method also consume considerable time. The literature reviewed,
indicates that leading SC researchers such as Gattorna used the survey
method with great success (Gattorna & Clarke, 2003). Grant (2001: 574) in
his training courses also applied “before and after” questionnaires. Although
telephonic surveys were used in some research studies, the proposed study
will electronically distribute questionnaires (TNA1) in phase 1 in order to reach
the maximum possible number of respondents. More is said about
distribution of questionnaires in the section on sampling below.
Level four of the research onion, is concerned with the choice between a
deductive and an inductive research approach. This study uses the deductive
approach since conclusions will be made after the literature is reviewed and
the empirical results have been analysed. In the proposed study, the contents
of the e-mailed survey and the data collection conducted on the premises of
respondents will be based on information collected from the literature findings.
The research philosophy followed for this data collection, which is the fifth
layer of the research onion, falls into the realm of epistemological critical
realism since it is a multilevel study including the levels of individual
respondents, their groups and their organisations. No data collected can be
completely objective in order to achieve direct realism. The researcher should
therefore steer away from personal values to avoid judging respondents
according to the discussion by Saunders, et al. (2007:104-110).
The overall research design can briefly be summed up as being empirical,
applied, evaluative, cross-sectional and comparative. Survey methods are
used for the purposes of collecting primary data from respondents that will be
both numeric/quantitative and non-numeric/qualitative in nature. All the
choices made in levels 1- to 5 in the research onion approach, will require
further discussion of the sampling techniques and data collection method to
be followed. This section is delineated next.
©© UUnniivveerrssiittyy ooff PPrreettoorriiaa

26
1.7.2. SAMPLING
A sample is selected since the research study cannot elicit a response from
every supply chain member or employee in the entire South African
population. The units of analysis are people employed in any organisation
with a supply chain structure connection or who are members of the
associations listed below. The sampling procedure was divided into two
phases:
Phase 1: An electronic questionnaire will be distributed via the
databases of the participating SC professional associations:
� the Chartered Institute of Purchasing and Supply Southern Africa
(CIPS)
� the Chartered Institute of Logistics and Transportation Southern Africa
(CILTSA)
� the Association for Operations Management of Southern Africa
(SAPICS)
� Commerce Edge (Pty) Ltd, a procurement solutions company
These professional bodies form a purposive sample, given that some of them
may have participated in a previous research study and have a professional
sense of goodwill towards academic research. They are also representative
of the South African supply chain practitioners, and this provides credibility to
the proposed research study. The sample size will depend on the number of
questions contained in TNA1 and must satisfy inferential statistics
requirements.
Phase 2 : On-site sessions were arranged where groups of between 20 and
30 respondents were exposed to the generic training pitch on introductory
SCM concepts. Respondents were requested to complete before-and-after
questionnaires (TNA2 and TNA3). This phase of the research study
represents a comparative design since it is not completely random in its
selection of target respondents (Leedy & Ormrod, 2005:108, Cooper &
Schindler, 2003: 428)
©© UUnniivveerrssiittyy ooff PPrreettoorriiaa

27
The reason for using phase 2 for the intervention can be explained by Denyer
& Tranfield, (2003: 682). The new approach to question formulation states
that context is important for understanding what my results are worth.
Interventions in my study context will impact on the following contextual
layers:
a. the individual employee
b. their relationships
c. the organisations where they work
d. wider systems
My intervention of Interest is focused on training from the past to determine
where respondents are at. A training intervention about the necessity of
training, moving up management hierarchies in order to make decisions one
day about one’s own work/life balance.
1.7.3. THE RESPONDENTS’ PROFILES
The respondent profile differs for each phase:
Phase 1 : These respondents are most likely to be SC practitioners who are in
a managerial or supervisory function (within procurement, production,
warehousing, distribution or customer service). Membership of a trade
association such as CIPS, CILTSA or SAPICS, must be ascertained from
TNA1. Trade union managers and SETA managing members who happen to
belong to these associations are included here.
Phase 2 : These respondents are more heterogeneous since they can be
drawn from all levels of business organisations (i.e. non-managerial levels
included).
In both instances it is irrelevant how long the respondents have been with the
professional associations or employed in their current jobs. It is more
©© UUnniivveerrssiittyy ooff PPrreettoorriiaa

28
important that they have an equal chance of selection in either phase of the
sample selection.
The reason for holding training sessions on the business organisations’
premises (in any of the 9 provinces of South Africa) arises from time
constraints involved in trying to relocate all respondents to the University of
Pretoria for example. Most full-time or part-time employed respondents’ view
on training is that they can afford a week’s vacation to go on a training course,
but that anything longer in duration will prove to be inconvenient (Grant,
2001:583). This necessitates that TNA 2 and TNA 3 should take place in the
same week but not on the same day for each organisation.
Letters of informed consent accompanied the questionnaires to ensure
respondents agree to participate in the research project. This is intended to
minimise the risk of unwilling participant complications from an ethical point of
view.
1.7.4. DATA COLLECTION
The data collection plan includes more specifics about how to complete the
survey and the premises that underlie the questionnaire design.
SURVEY METHOD
In order to gain access to the organisations of respondents, in line with
Saunders, et al., (2007: 174) surveys do have associated difficulties and
therefore the entry strategy involves the following practical measures:
� Arranging for this proposal to be reviewed by an Ethics Committee
towards the end of May 2011, allowed sufficient time to negotiate
access with decision makers in subsequent months.
� Using existing contacts (from the researcher’s 2007 completed Masters
level research study) and developing new contacts in order to gain
access.
� Providing a clear and concise explanation of the purpose of the
research and what is expected of the participating respondent.
©© UUnniivveerrssiittyy ooff PPrreettoorriiaa

29
� Overcoming organisational concerns through dialogue and telephonic
communication and/or using electronic mail facilities.
� Developing access incrementally, that is, understanding that the entire
research sample will not agree to participate in one single day of
asking for access, but over a number of weeks.
If all efforts failed to set up meetings with respondent organisations, a process
of self-selection could have been used by advertising the research study in
appropriate trade journals to allow respondents to volunteer themselves for
participation. Fortunately this last resort was not required.
MEASUREMENT
The respondents were asked generic demographic information such as their
main area of business responsibility, how long they have worked for their
organisation and whether they rank as supervisors, managers or neither. If
the questions are about gender, for example, the two-answer option makes it
a dichotomous scale that will only yield nominal data.
Information regarding their individual exposure to training courses and
programs was requested to compare the levels of learning amongst
respondents. Thereafter respondents’ perceptions regarding training provided
were measured with a five-point Likert scale. The Likert scale is one variation
of the summated rating scale where respondents can express a favourable
(score of 5) or unfavourable attitude (score of 1) in response to statements
about certain aspects of SCM training (Cooper & Schindler, 2003: 253).
Since data types are classified into four categories (nominal, ordinal, interval
and ratio) they influence the methods whereby respondents’ views can be
statistically analysed (Cooper & Schindler, 2003: 223; Diamantopoulos &
Schlegelmilch, 2002: 67). More of this will be discussed in the following
section on questionnaire design.
QUESTIONNAIRE DESIGN
©© UUnniivveerrssiittyy ooff PPrreettoorriiaa

30
The research questionnaires TNA1 and TNA2 are in the Annexure section.
They are based on the sections described above and incorporate questions
raised by the literature reviewed. Each questionnaire also has the informed
consent letter as cover page.
PRE-TESTING
In order to improve the reliability of the questionnaire, it was tested and re-
tested amongst certain supply chain participants to see if they consistently
answered questions in the same way (Saunders, et al. 2007: 367). Internal
consistency was checked by correlating questions within the questionnaire
with questions rephrased elsewhere in the questionnaire.
In order to assess both content and sampling validity the pilot study had to
discover any problematic questions by using the respondent group that
closely resembles the targeted sample group (Diamantopoulos &
Schlegelmilch, 2002:34). Any feedback received served as input into refining
the research instrument before administration in field (Saunders, et al., 2007:
387). More will be said about validity and reliability in the research
methodology section (chapter five) which follows in due course.
1.8. DATA ANALYSIS
The coding of the research questionnaire answers was done in consultation
with the data analysts in the Department of Statistics at the University of
Pretoria. Data were captured on Excel spreadsheets to yield matrices about
specific variables. The data were stored electronically after being printed out
in paper format and coded. Only questionnaires that were completed in full
were used for data analysis to prevent having to set rules for incompleteness.
The sequence of events involved in the data analysis process, are divided into
stages as follows:
Data Analysis Stage 1
• Cleaning input and processing TNA1 responses obtained from
organisations and arranging new times and dates to run the SCM
training pitch.
©© UUnniivveerrssiittyy ooff PPrreettoorriiaa
31
Data Analysis Stage 2
• Applying TNA2 on site and amongst ordinary workers, before
implementing the SCM training pitch.
• Applying TNA 3 after a few days to allow reflection and processing
completed questionnaires to identify and measure all training gaps.
Statistics of location and variability will help to describe the data in terms of
the mean (average) and the standard deviations from the mean. Factor
analysis will be used to test the face validity of the questionnaire by detecting
underlying dimensions that explain relations between multiple variables
(Statsoft, 2008). Measures of relationships or correlation between variables
can indicate whether the relationship is positive or negative and whether it
demonstrates strong or weak correlations. A score of +1 or –1 would indicate
a perfect correlation, which means that knowing the value of one variable can
allow the other to be predicted (Leedy & Ormrod, 2005:265, Cooper &
Schindler, 2003: 578).
While it is relatively straightforward to compare the results of two variables
such as the level of training with the level of satisfaction about the training
(using Chi-square tests of two variables) the decisions to conduct test of
relationships require proof of non-correlation between variables. Multivariate
techniques such as regression analysis can therefore be applied to the
dataset at a later stage. Hypotheses tests will be conducted at between 95
and 99% levels of confidence to find statistically significant relationships.
These data analysis techniques are also closely linked to the size of the
sample of respondents. If the data set is too small, only non-parametric tests
can be conducted (Statsoft, 2008).
©© UUnniivveerrssiittyy ooff PPrreettoorriiaa

32
1.9. ASSESSING VALIDITY AND RELIABILITY
This study proposes the use of a research questionnaire that was derived
from literature reviewed and adapted for the purposes of reaching the set
objectives. There is therefore a need to assess the reliability and validity of
the questionnaire before trying to recommend any new approach to TNA after
the empirical data have been analysed.
Reliability refers to the extent to which the data techniques and analysis
procedures are able to yield consistent results (Saunders, et al.: 2007: 149).
There are four threats to the reliability of research findings that include
subject/participant’s error, respondent bias, and observer error and observer
bias. Relationships between variables and any instance of predictability, can
only be assessed when dependencies have been established and the
reliability and validity of the data have been verified in a factor analysis
(Cooper & Schindler, 2003: 234).
Validity forms can be external or internal according to Cooper & Schindler
(2003: 231). The external validity of research findings refers to the data’s
ability to be generalised across persons, settings and times. Internal validity
is limited in this study to the ability of the research instrument to measure
what it thinks it is measuring.
In order to improve the likelihood that the research study is actually measuring
what it thinks it is measuring (i.e. that the questionnaire is valid) it is important
to distinguish between the various validity assessment approaches. The
validity approaches deal with content validity, criterion validity and construct
validity of which the latter is the one that must be proved before the research
will be able to contribute to the supply chain management (SCM) literature
and communities. Construct validity is an indication of how the research
findings can be generalised from the sample to the rest of the business
population (Saunders, et al., 2007: 51). Pre-testing of the questionnaire was
done to ascertain construct validity before in-field testing took place.
©© UUnniivveerrssiittyy ooff PPrreettoorriiaa

33
1.10. DELIMITATIONS AND ASSUMPTIONS
This research is based on the foundation of business management,
specifically SCM as the main underlying discipline. The findings of the
research are not intended to become a prescription for further and higher
education and training, or of HR management in the South African
marketplace.
The proposed research is not aimed at small medium and micro enterprises’
(SMME) sole proprietorships since it targets organisations with more than 10
employees. This delimitation in focus is supported by findings that training
initiatives are implemented after training needs analysis (TNA) of entire
businesses. Smaller concerns have been found not to have formal training
programs in place and therefore request less formalised training (Frazis,
Gittleman & Joyce, 2000: 444; Barcala, Martin & Gutierez, 2000: 244).
Although we assume that emigration or brain drain out of South Africa
aggravates skills shortages, its causes cannot be ascertained through this
particular research project. Reasons for emigration have been speculated to
include high crime levels, worsening public service delivery and expensive
living conditions. There is however no proven direct link between brain drain
and supply chain practices. Thus this research study similarly does not aim to
prevent future brain drain through its findings on training needs perceptions
(Human Sciences Research Council, 2004).
This research study further assumes that:
� respondents participate out of informed consent
� research respondents may remain anonymous even after the research
is completed
� all information will be provided in good faith
� all measures must be put in place to ensure confidentiality of incidental
findings about participating business organisations
©© UUnniivveerrssiittyy ooff PPrreettoorriiaa

34
Based on the delimitations and assumptions above, the research ethics are
expounded on in the following section.
1.11. RESEARCH ETHICS
The general ethical issues that apply to respondents at the data collection
stage, involve obtaining their informed consent; keeping their identities private
and their answers confidential (Saunders, et al., 2007: 180). The researcher
will not offer any incentives for participation and no respondent will
be targeted under the age of 18. The contact details of respondents for
Phase 1 of the survey will remain at the discretion of the relevant professional
associations and not be accessible to the researcher at any given time. Any
organisation willing to proceed to Phase 2 of the research will remain
anonymous towards their competitors.
The signed letters of consent will be kept on file for a period of two years after
the study is completed and subsequently disposed of responsibly. A copy of
the letter of informed consent is included in the Annexure. No respondents
will in any way be embarrassed during the data collection or coerced into not
changing their mind at any time during the course of the research data
collection.
The application for ethical clearance was presented to the Ethics Committee
of the University of Pretoria for approval before distributing the questionnaire
into the field.
Since the approval was granted, the chapter outline highlights what to expect
for the rest of this report.
1.12. CHAPTER OUTLINE
The outline of the chapters of the research report is as follows:
Chapter 1: Introduction
This chapter served as a synopsis and overview of the entire research project.
©© UUnniivveerrssiittyy ooff PPrreettoorriiaa

35
Chapter 2: Education, training and development (ETD)
This chapter explains why the research focused on the training aspects of the
supply chain industry, as opposed to government supplied education. Since
development is also long term in duration, the shorter training aspects
matched the cross-sectional nature of the study. The South African ETD
environment is briefly touched on.
Chapter 3: Training needs analysis (TNA)
The concept of training needs analyses and its business staff context is
discussed in this chapter.
Chapter 4: Supply chain management and training
The supply chain management history and its subsequent need for
continuous training are explained. This is accompanied by a global business
context.
Chapter 5: Research design and methodology
This chapter contains more specific reasons why the research design,
methodology and analyses were followed.
Chapter 6: Research findings
This chapter provides descriptive information about the respondents and
evidence linked to each of the nine hypotheses.
Chapter 7: Conclusion and recommendations
This chapter revisits the original deductions made about the study and
recommends future research directions.
©© UUnniivveerrssiittyy ooff PPrreettoorriiaa

36
Figure 1.2. summarises the logic of the research study where the aim is to
identify gaps between the respondent groups.
Figure 1.2. The research model
1.13. CONCLUSION
This chapter introduced the reasons that motivated the research to be
conducted. Training needs analysis is merely the forerunner towards
designing training programs in organisations. The respondents were asked to
provide information based on theory underlying the hypotheses tested by the
questionnaire design and analysis, thus the literature review follows in
subsequent chapters.
Managers
TNA1
Employees
TNA2
Employees TNA3
Are there gaps?
Are there gaps? Gap analysis
©© UUnniivveerrssiittyy ooff PPrreettoorriiaa

37
CHAPTER TWO EDUCATION, TRAINING AND DEVELOPMENT (ETD)
2.1. INTRODUCTION
2.2. EDUCATION
2.3. HISTORY OF SOUTH AFRICAN EDUCATION
2.4. TRAINING
2.5. DEVELOPMENT
2.6. REASONS TO FOCUS ON TRAINING
2.7. CONCLUSION
©© UUnniivveerrssiittyy ooff PPrreettoorriiaa

38
2.1. INTRODUCTION
“A nation at work for a better life for all”
(Erasmus, Loedolff, Mda & Nel, 2007: 61).
This quotation represents the vision of the national human resource
development (HRD) strategy and states that the South African government
considers its people to be the most valuable economic resource. It stems
from the strategic point of view that relevant legislation will create institutions
to support this vision to realise maximised HR potential. By acquiring
knowledge and skills, South Africans are supposed to compete productively in
a global economy whilst enjoying a rising quality of life for all (Erasmus, et al.,
2007: 61).
This chapter delves into the issues surrounding education, training and
development (ETD) in the South African and global context. The chapter’s
point of departure is that individual ETD adds to business learning and will
ultimately impact collectively on business and supply chain (SC) practices.
Erasmus, et al. (2007:3) believe education to be generally long term and that
it should be provided by the government. Training is seen as short term and
is provided to an individual employee according to business objectives.
Development is seen as presenting opportunities collectively to enable an
entire workforce to grow according to specific business strategies (Erasmus,
et al., 2007: 3).
Functions of ETD are seen as the predominant responsibilities of the human
resources (HR) practitioner who implements organisational strategies
according to Botha and Coetzee (2007: 48). This HR responsibility applies to
private, public, for profit and nonprofit organisations alike. Having the right
talent, in the right place, at the right time is what the ETD and labour market
should strive to implement. However, before “getting it right”, talented
individual HR arrive at organisations with some basic educational background
and negotiate with employers to receive further training. Over time, employed
HR can develop into useful, effective and efficient resources in their
organisation’s business practice. Ideally, all employees’ personal training
©© UUnniivveerrssiittyy ooff PPrreettoorriiaa

39
needs will also be met. Each component of ETD will be discussed separately
in the following sections, together with the South African ETD context. The
ETD requirements for SC will be included later.
2.2. EDUCATION
“ … in the developing world, education is widely viewed as being the key
to individual and collective success” (Smith & Yolisa Ngoma-Maema,
2003: 345).
South Africa and many nations in Africa are still considered as ‘developing’,
and not “developed” worlds. In contrast to the quote above, the developed
United Kingdom (UK), consisting of England, Wales, Scotland and Ireland; do
not perceive themselves to be above other ETD requirements. The UK saw a
need for “something more” in their 2010 education research report. The UK
government is calling for a pervasive culture of learning. This means that all
sections of the UK society should see ongoing learning as part of their lives,
not just something that has to end with compulsory education (McQuaid,
Lindsay & Johnson, 2010: 9). Needless to say, the views about education will
differ from one country to the next, depending on the broader economic
scenarios existing everywhere. The ETD literature review that constitutes this
chapter, includes findings from both developing and developed countries’
perspectives in order to remain objective.
Education is seen as the process of acquiring the skills, knowledge and
attitudes that humans need in order to function in their normal way of life,
according to Erasmus, et al., (2007: 2-3). The Oxford University Press
defined education as an intellectual and moral training act (Hornby, Cowen &
Gimson, 1986: 276). Further back in time, in 1952, there was a debate on the
issue of “what education is?” between Harold Benjamin and Robert Hutchins,
renowned scholars of that time. According to Benjamin, education is an
organised and conscious effort to change human behaviour (Benjamin &
Hutchins, 1952: 28). However, Hutchins was convinced that education has
the distinct objective to teach people or help them to learn, to think for
themselves (Benjamin & Hutchins, 1952: 31).
©© UUnniivveerrssiittyy ooff PPrreettoorriiaa

40
While Hutchins perceives the entire educational system as being there to help
people learn to think, Benjamin sees educational concerns as searching for
instruments, activities and tasks to establish the required behaviour change in
learners (Benjamin & Hutchins, 1952: 28). Although each learner in
education is unique, the teacher has to fit the activities and tasks to each
learner as well as matching it with the relevant societal requirements. This
complicates the decision since people have to decide what changes they want
to see in society and how much freedom they can allow individuals to have in
furthering their own personal goals (Benjamin & Hutchins, 1952: 29).
The next question to be answered by Benjamin and Hutchins (1952: 29) was
how best to encourage education. Benjamin thought all education should be
self-operated in order to be effective. The role of the teacher was therefore to
arrange experiences in which individual learners could learn to be or do
something different from what they were – or had been doing. The teacher
must clearly understand then, why the change is required and what changes
they wish to effect (Benjamin & Hutchins, 1952: 23). However, Hutchins was
convinced that change in learners should also be in the direction of their own
ideals. If however, the learner could not reach the point of making that
decision, that person will not be envisaged as receiving any education of any
kind (Benjamin & Hutchins, 1952: 30). In this way, Hutchins concluded the
debate by noting that the teacher should not take on any obligations other
than to teach the learners to think for themselves (Benjamin & Hutchins, 1952:
32).
The question of whether education decisions lie with the learner/employee or
with someone else remains. On this note, the Canadians pondered whether
previous education played a part in the decision to attend further training. The
adult education and training survey in Canada showed that on average more
than 52% of the Canadian respondent staff took part in formal, job-related
training around 2004. The Canadian survey found that if staff members
already had a higher level of education (primary, secondary and post-
secondary school levels), they were more likely to participate in training
©© UUnniivveerrssiittyy ooff PPrreettoorriiaa

41
courses and training programs in the workplace (Peters, 2004: 9, McQuaid,
Lindsay & Johnson, 2010: 4). This view is supported by another UK survey in
which McCracken and Winterton called the phenomenon the Matthias
Principle. This focused principle on education states that “to those that hath
shall be given” and therefore in contrast, those without education will receive
less (McCracken & Winterton, 2006: 56). The two authors were concerned
that the UK human resource development (HRD) policy contradicted its own
goals. The UK planned lifelong learning to be widely practiced but, to the
contrary, their skills development targeted specific occupations in which to
address skills gaps and shortages in (McCracken & Winterton, 2006: 56).
The UK research investigated barriers faced by mid-career managers that
prevented them from pursuing further education and training opportunities.
The scrutinised variables included age, gender, qualifications, career history
and family circumstances (McCracken & Winterton, 2006: 60). These
variables were compared to emotional, cognitive, motivational and perceptual
factors in order to determine whether intrinsic or extrinsic factors prevented
managers from continuously seeking out management development.
McCracken and Winterton found that the female respondents blamed
corporate culture as the extrinsic barrier to their learning (2006: 63). The
Pearson Chi-square test yielded significant differences in means at the 5%
level (the means were 2.39 and 1.88 respectively). The authors found this to
underline the sentiment that females were more aware of the need for
continuous learning in a male dominated corporate environment (McCracken
& Winterton, 2006:63). This UK study also concluded that mid-career
managers, who stayed at the same company for their entire careers, were
less likely to seek opportunities for formal training programs (McCracken &
Winterton, 2006:63).
McCracken and Winterton strongly suggest that the experienced manager
knew best that personal development would not, by default, be a means to
rewards at their respective workplaces. Instead the job-based or task-based
achievements could be perceived as being more worthy of reward than
personal achievements (McCracken & Winterton, 2006:63). Although both
©© UUnniivveerrssiittyy ooff PPrreettoorriiaa

42
intrinsic and extrinsic barriers to learning were identified, the extrinsic factors
such as poor corporate culture and reward structures as well as time
pressures proved more likely to be managers’ barriers. McCracken and
Winterton advise organisations to improve their learning environments, make
reward structures fair and introduce secondment and mentoring to eliminate
barriers to managers’ learning (McCracken & Winterton, 2006: 64). Since the
McCracken and Winterton study involved only 61 managers within the UK life
insurance industry, subsequent research should be conducted amongst a
larger, more diverse group of companies.
The deductions that can be made from the aforementioned studies yielded the
following hypotheses to be examined:
H50 There is no relationship between existing educational qualifications and
urgency for employee training
H5 A: There is a relationship between existing educational qualifications and
urgency for employee training
H60: There is no gender-based difference in the perception that female employees
receive more training than males
H6 A: There is a gender-based difference in the perception that female employees
receive more training than males
H70: There is no difference in the frequency of training requests between late-
career-stage employees (older than 45 years) and others
H7A: There is a difference in the frequency of training requests between late-
career-stage employees (older than 45 years) and others
H80: There is no significant difference in the willingness to attend training between
long-tenure employees (employed >10 years) in the same organisation and
new recruits
H8 A: There is a significant difference in the willingness to attend training between
long-tenure employees (employed >10 years) in the same organisation and
new recruits
©© UUnniivveerrssiittyy ooff PPrreettoorriiaa

43
After questioning a total of 397 Turkish hotel service employees, it was
thought that differences in education levels alone could explain gender wage
differences. Yet it appears that the traditional societal role of women can also
undermine their education and wage levels. In Turkey, society (and females
themselves) perceives women in a traditional role of child caregivers.
Females themselves therefore anticipate lower wages. It is likely that the
reason for this expectation is acceptance of lower wages in exchange for
receiving hotel accommodation and even for having the employment (Kara &
Murrmann, 2011: 4). The Turkish investigation also enquired about
respondent experience levels, age and marital status. All these variables
together influence the wage differences. An additional conclusion drawn was
that female (lesser educated) employees are also less job satisfied than their
male colleagues (Kara & Murrmann, 2011: 4).
It appears that not only less developed countries can be influenced by
educational qualifications. The importance of education cannot be
underestimated since the Swedish study showed the real consequences of
having less education than one’s fellow employees. A longitudinal study
conducted between 1986 and 2002 in Sweden demonstrated the effects of
being educated or not, during the period when Sweden experienced an
economic downturn at the start of the 1990s. Analysis of secondary data
obtained from the Swedish Labour Market Policy Evaluation, Statistics
Sweden and the Employment Register, was used to monitor job flows or
worker transfers. The respondent establishments needed to have at least five
employees (on average) consistently over the 17-year-long research period
(Gartell, Jans & Persson, 2010: 207). The data of 3 million employees could
be derived from the 110 000 Swedish establishments combined. For the
period 1986 to 1989, the employee ages ranged between 16 and 64.
Between 1990 and 2002, the ages ranged between 16 and 65 years (Gartell,
et al., 2010: 208). The authors found that not only were fewer jobs created for
those with the least education but more jobs at the lower level were also
destroyed during the period 1986 to 2002. This meant that, during
recessions, fewer jobs were destroyed at more highly educated staff levels,
©© UUnniivveerrssiittyy ooff PPrreettoorriiaa
44
than at lower levels of education (Gartell, et al., 2010: 212). This finding must
be understood within the employment protection legislation context that
makes it costly for a Swedish firm to randomly fire employees (Gartell, et al.,
2010: 206). It appears that higher educational qualifications prevented job
losses for the employees during the Swedish recession. This obviously
places employees with less education at risk of being laid off first during
recessions.
The influence of education on employment brings government’s role in
monitoring education and training under the spotlight. A 2003 study in the
People’s Republic of China showed that businesses with enough financial
resources select highly educated new staff and continue to develop them
further. Chinese businesses who cannot select the same type of candidates
are usually also unable to provide the employees they do select with high
quality training thereafter (Venter, 2003: 186). This means that those
employees are in need of their government structures to educate them even
after they gained employment.
The role of the government in education was challenged when the World
Bank report of 1993 designated governments as the sole source of skills
formation. The role of the government as the exclusive provider of ETD, was
challenged by Ashton, Green, Sung & James (2002: 5). Ashton et al.,
emphasized that a range of strategies they used linked up with the
government focus. Their strategic research study shows that eight Asian
countries accelerated their skills development in one generation of their
population whereas industrialised countries usually took three generations
(Ashton, et al., 2002: 5). Amongst the eight countries, those rich in natural
resources included Indonesia and Malaysia. The commercially dominant, free
port service countries are Hong Kong and Singapore. The countries
renowned for interventionist export-led economies include Japan, South
Korea and Taiwan (Ashton, et al., 2002: 7). The authors neglected to place
Thailand in a specific category. Consequently the seven countries are divided
into three types, according to their key characteristics.
©© UUnniivveerrssiittyy ooff PPrreettoorriiaa
45
Ashton, et al., 2002: 7 found that although Singapore, Taiwan and South
Korea, accelerated their pace of skills formation impressively, their holistic
industrialisation strategies inspired their distinctive education and training
needs (Ashton, et al., 2002: 6). These emerging economies experienced
economic growth without skills shortages, since their governments co-
ordinated the supply of skills (Ashton, et al., 2002: 5). The abundance of
unskilled labour is a competitive advantage only when the country is not trying
to enter world markets via their labour force’s technological capabilities
(Ashton, et al., 2002: 11).
Singapore, Taiwan and South Korea centralised control over their educational
systems as a form of nation building in the late 1990s already. Curriculum
control and moral education motivated public investments in education in
order to help it deliver appropriate skills types and skill levels as industries
required (Ashton, et al., 2002: 12). By closing the loop, industries in these
countries informed the educational systems despite Singapore having a
smaller labour force than South Africa to educate (Singapore = 1.7 million).
Having to move away from a strong agricultural base (like Taiwan), industries
similar to South Africa included the three countries’ governments successfully
addressing skills shortages in steel, petrochemicals, electronics, chemicals,
banking and finance (Ashton, et al., 2002: 13). For the three countries,
however the task of managing capital through borrowing instead of depending
only on foreign direct investment started as early as the 1960s. State-owned
enterprises in these countries led the way for industrialisation and some were
privatised in later years. Unlike South Africa, emphasis was also placed on
investing downstream in supply chains earlier (Ashton, et al., 2002: 14). In
conclusion therefore, it is not advisable for developing countries, by
themselves, to seek to emulate the Asian countries’ success in dealing with
educational skills gaps. Instead countries, like South Africa should combine
industrial and business strategies to allow marketplaces to signal the
educational requirements more clearly.
All the same, elsewhere the role of providing education is still seen as being
government policy and should therefore be the public sector’s responsibility.
©© UUnniivveerrssiittyy ooff PPrreettoorriiaa

46
In the United Kingdom (UK), the public sector educational structures were
meant to provide education until scholars started working and then pass on
the responsibility for subsequent educational programs to employers
(Roodhouse & Mumford, 2010: 325). Since 2006, the UK governments
discovered that their approach alone was not working. They wanted to
include higher and further educational institutions in providing employed
professionals with further education. However the inclusive partnering was
not working, due to employee perception that higher education institutions are
out of touch, unresponsive to employer needs and impractical (Roodhouse &
Mumford, 2010: 321).
The general consensus is that universities and employers do not speak the
same language when it comes to education. There is however a positive
finding from the UK study. The longitudinal UK study between 2008-2010
highlighted a new role in education for universities and institutions of higher
learning. The new role is derived from the gap between employees who want
accredited training to be provided and their employers who want unaccredited
training. Fortunately, universities are the only institutions allowed to accredit
other organisations to deliver their educational programs. Therefore the call
to action persists for universities to help meet the educational needs of
employees (Roodhouse & Mumford, 2010: 324).
Besides the archaic views of universities held by UK employees, there are
other barriers to further education for employed people according to McQuaid,
et al., (2010: 8). Negative influences from peers and colleagues, early age
educational disappointments, limited access to guidance, information and
finance are barriers that prevent UK people from taking up opportunities to
further their education (McQuaid, et al., 2010: 8). The employers’ attitude
towards education can also determine how much will be transferred to the
workplace by the person being educated or trained (McQuaid, et al., 2010: 8,
More, 2004: 38). Although the UK government removed the barriers by
organising funding schemes, there are other societal influences that do not
change overnight.
©© UUnniivveerrssiittyy ooff PPrreettoorriiaa

47
Collectively it seems we cannot divorce education from the financial ability to
pay, age and gender. Besides gender discrepancies in the workplace, there
are other variables that impact on educational policy and indirectly on
employment opportunities and job tenure. For a better understanding of the
South African context, before the research project is discussed, the following
section summarises sections of the educational history in South Africa.
2.3 HISTORY OF SOUTH AFRICAN EDUCATION
Currently South Africa has 11 official languages. Before 1994, only Afrikaans
and English were officially recognised and used as the languages of
instruction at basic education level (Walters, 1999: 223). Historically South
Africans have been and currently still are, divided along lines of race. South
Africans were previously mainly classified according to the colour
(pigmentation levels) of their skin. Black people or natively born Africans now
form the largest section of the population. Historically adult education in
South Africa included the society, the state and the economy as the main
actors (Walters, 1999: 220). Societal structures included trade unions,
political organisations, religious groups, community-based organisations and
tertiary education institutions. For thirty years, between the 1950s and the
1980s, government barred black adults access to education, going as far as
opposing literacy education offered by nongovernmental and missionary
groups (Walters, 1999: 221).
Basic education is offered at formal schools for learners between the ages of
6 and 17. This constitutes at least 12 years of education. Since education is
considered first and foremost as a public good and in the interests of growth
The aforementioned studies on whether education is the responsibility of a country’s government, the organisation or for the individual, led to the following hypothesis: H90: Employees are not likely to request more training when employers insist
on a repayment contract
H9A: Employees are likely to request more training when employers insist on a repayment contract
©© UUnniivveerrssiittyy ooff PPrreettoorriiaa

48
for all, it is a legal requirement for all South African children to attend school.
Since 1910, government invested minimal amounts in adult education since
they could source immigrants from Europe with the necessary education
(Walters, 1999: 221). In 1999, it was discovered that 50% of Black women
only received seven years of schooling before starting to work as menial
labourers in residential homes or factory environments (Walters, 1999: 220).
Further education (for technical skills) and tertiary education (for graduate
education) had also been fragmented under the Department of Education
across racially discriminating lines. According to Walters (1999: 218) the
initial education that a person receives will influence the cumulative pattern of
education throughout adulthood. One repercussion of the preceding
Apartheid policy provisioning of poor quality basic education for some racial
groups; is that some adults are not active learners later in life (Walters, 1999:
220).
Since the 1990s, when Nelson Mandela was released from prison and the
African National Congress (ANC) political party was unbanned, the political
landscape changed. New legislation was brought in by the Departments of
Labour and Education to support the new HRD strategy vision and mission.
These Acts appear in Table 2.1.
Table 2.1. The three ETD-related Acts and their main objectives
ETD-related legislation Main ETD objective
South African Qualifications
Authority (SAQA) Act No 58
(passed on 4 October 1995)
� to establish the SAQA institution
� to implement the National Qualifications
Framework (NQF).
Skills Development Act 97 of
1998
� focused on assisting the SAQA Act and
establishing Sector Education Training
Authorities (SETAs).
Skills Development Levies Act
9 of 1999
� Introducing a compulsory levy to be paid
to fund HR skills development in South
Africa
©© UUnniivveerrssiittyy ooff PPrreettoorriiaa

49
Source: Adapted from Erasmus et al., (2007: 68) and Van der Schyff (2003:
69).
The SAQA institution focuses mainly on the quality control of education and
training through the NQF and setting national standards through the
Standards Generating Bodies (Erasmus et al., 2007: 72). The SAQA Board
inclusively consists of trade union representatives, industry representatives,
EDT service providers and non-governmental organisations (NGOs). The
Skills Development Act (SDA) tries to integrate education and training with
employment opportunities (Meyer, et al. 2003: 69). It established the National
Skills Authority (NSA), National Skills Fund (NSF), SETAs, labour centers,
Skills Development Unit (SDU) and allowed levy collection for grant-funding
schemes (Meyer, et al. 2003: 77). The NSA advises the Minister of Labour
on national skills development policies to support the national skills
development strategy (NSDS). From Figure 2.1 it should be clear that ETD
takes place within organisations, industries and at national levels.
©© UUnniivveerrssiittyy ooff PPrreettoorriiaa

50
Figure 2.1. The national structures for ETD and skills development in
South Africa.
Source: Adapted from Van Der Schyff (2003: 68).
Within the framework of Figure 2.1, the 1994 first democratic elected
government tried to eradicate the unequal opportunities for education. Since
1996, the new Constitution allows all South Africans access to free public
school basic education and within reason, access to further education
(Walters, 1999: 222). The SAQA and NQF were brought in to prevent the
continuation of elitist practices in education (Walters & Daniels, 2009: 64).
This means that higher education, schooling at all levels and vocational
Industry sector level
Standards Generating Body (SGB)
South African Qualifications Authority (SAQA)
National Standards Body (NSB) and NQF
Department of Education = SAQA Act
National Skills Authority (NSA)
ETD and Skills Strategy is developed by the following enterprise level structures: � Skills Development Facilitators
(SDF) � Workplace Skills Plans (WSP) � Training committees
Department of Labour = Skills Development Act (SDA)
National level
Sector Education Training Authorities (SETAs)
Organisational level
Sector planning process
Education Training Quality Assurer (ETQA)
Quality assessment, moderation & assessment
Education provided by: * Schools=Basic education * Universities and technology institutes =Higher education * Colleges and private training providers =Further education
©© UUnniivveerrssiittyy ooff PPrreettoorriiaa

51
training should now be included in one transparent and equally accessible
system (Walters & Daniels, 2009: 64).
Currently, since 2009, the NQF has changed from eight levels to ten levels to
allow more differentiation in higher education. Since the SAQA Act was
signed into power 14 years ago, more adaptive changes meant that three
Quality Councils have been formed. NQF levels 1 to 4 fall under the Quality
Council for General and Further Education (called UMALUSI). Umalusi
governs the quality in basic education (for a person’s 13 years of education)
and technical qualifications, under further education. The Higher Education
Quality Council (HEQC) governs NQF level 5 to 10 in graduate degree
programs. The Quality Council for Trades and Occupations governs the
same NQF 5 to 10 levels for occupational qualifications (Walters & Daniels,
2009: 65). Every level of education is therefore accounted for.
The aims of the NQF will be discussed in greater detail in the section on
development of skills. However according to Erasmus, et al., (2007: 72) the
principles underlying the NQF are as follows:
� Integration : Integration would ensure HR development leads to
nationally acceptable qualifications
� Relevance: Nationally speaking, industry and individuals have needs
that must be met through the NQF, while at the same time the
advancement of knowledge, science and technology should be
emphasized.
� Credibility : Local socio-economic priorities should not negate the fact
that all ETD qualifications should have international credibility.
� Coherent flexibility : Coherent flexibility is required in order to meet the
needs of industry, service sectors, service providers and trainees.
� Guidance for learners : Educators/trainers should be qualified to guide
trainees
� Recognition of Prior Leaning (RPL): An example of RPL is that it
would open the way for factory staff to become executives of their
business organizations over time.
©© UUnniivveerrssiittyy ooff PPrreettoorriiaa

52
� Portability : At present this is not possible in South Africa. It refers to the
way that trainees can transfer between academic institutions without
losing credits
� Progression : Progression makes it possible for trainees to grow through
the different levels of the NQF
� Articulation : Trainees should be able to migrate, on successful
completion, to other levels in the system that join up to form a clear
holistic training program.
� Legitimacy : All stakeholders should have a say in ETD program
planning.
� Standards : The framework and outcomes should be agreed upon by all
nationally and internationally.
� Access : In order to progress from one level to the next, everyone should
have equal access to everything relating to ETD.
Conclusively the NQF is to provide a mechanism to ensure the following:
i. Certify workers’ existing competencies
ii. Allow qualifications to count towards further qualifications
iii. Allow for matching (benchmarking) of qualifications obtained from
different training service providers
iv. Allow workers to work towards qualifications, in periods of time (which
can also be counted in unit standards)
The NQF works together with SETA subdivisions and serves to classify
agricultural qualifications separately from management studies, law or health,
for example. The implication for educational institutions and training service
providers is that outcomes of courses must be clearly stipulated. They should
use unit standards and specific outcomes to allow national comparison of
qualifications and skills attained by workers.
The standardized way of recognising the educational qualifications of millions
of South Africans is done via industry specific SETAs. These institutions
focus on industry specific skills development and are described in Table 2.2.
©© UUnniivveerrssiittyy ooff PPrreettoorriiaa

53
Table 2.2. The South African Sector Education Training Authorities
(SETA)
Abbreviation of the
SETA name
Explanation of acronyms
1. FASSET Financial and Accounting Services Sector Education and Training
Authority
2. BANKSETA Banking Sector Education and Training Authority
3. CHIETA Chemical Industries Sector Education and Training Authority
4. ETDP Education, Training and Development Practices
5. FOODBEV Food and Beverages Manufacturing Industry Sector Education and
Training Authority
6. HWSETA Health and Welfare Sector Education and Training Authority
7. INSETA Insurance Sector Education and Training Authority
8. MQA Mining Qualifications Authority
9. AGRISETA Agriculture Sector Education and Training Authority
10. PSETA Public Service Sector Education and Training Authority
11. SERVICES SETA Services Sector Education and Training Authority
12. TETA Transport Education and Training Authority
13. CETA Construction Sector Education and Training Authority
14. ESETA Energy Sector Education and Training Authority
15. LGSETA Local Government Sector Education and Training Authority
16. SASSETA Safety and Security Sector Education and Training Authority
17. W&RSETA Wholesale and Retail Sector Education and Training Authority
18. MERSETA Manufacturing, Engineering and Related Services Sector Education
and Training Authority
19. ISETTSETA Information Systems, Electronics and Telecommunication
Technologies Sector Education and Training Authority
20. THETA Tourism Hospitality and Sport Education and Training Authority
21. FPMSETA
Where:
MAPPSETA
CTFLSETA
FIETA
Fibre Processing Manufacturing Sector Education and Training
Authority
[This is an amalgamation of the previous MAPPSETA, CTFLSETA
and FIETA]
Media, Advertising, Publishing, Printing and Packaging…
Clothing, Textiles, Footwear and Leather - SETA
Forest Industries Education and Training Authority
Source: South African Qualifications Authority (2011.)
©© UUnniivveerrssiittyy ooff PPrreettoorriiaa

54
There are currently 21 SETA that use a percentage of the compulsory skills
development levies for unemployed people’s skills development. The SETA
reimburses organisations that report on their delivery of skills training and
development for their staff. Through the National Qualifications Framework
(NQF), the SETA is able to measure and compare employees for the
purposes of performance management.
For easier qualification comparisons to be made and for ETD return on
investment (ROI) calculations, the SAQA has also listed generic Critical
Cross-field Outcomes (CCFO). Regardless of industry, HR should possess
the following CCFO:
� problem identification and resolution skills
� team and community skills
� locus of control
� communication skills
� responsible citizen skills
� understanding of how world systems relate
� ability to explore, learn and be entrepreneurial (Lancaster, 2001: 88,
Meyer, et al., 2003:36).
In the South African context, skills development is currently in a state of
constant evolution. The first National Skills Development Strategy (NSDS)
ran between 2004 and 2010 with a view to bringing about sustainable growth,
development and equity (Erasmus, et al., 2007: 62). The second NSDS
began to run from 1 April 2011. The goal is to continue the alignment of skills
development programmes with national growth strategies and to encourage
lifelong learning for its citizens (Erasmus, et al., 2007: 63).
Suffice it to conclude that the previous unequal access form of education is
being addressed and the South African government is currently trying to
integrate ETD concepts into one system. Since adults from the unequal
access to education era are currently older and in employment, the following
©© UUnniivveerrssiittyy ooff PPrreettoorriiaa

55
discussion takes a closer look at the definition of training (Meyer & Mokoele,
2003: 13).
2.4. TRAINING
Training is defined as the process of systematically altering the knowledge,
skills and behaviour of employees to allow the workplace to achieve its
objectives (Erasmus, et al., 2007: 2). That means a change in the educational
status of the employed people, since education refers to growth in skills,
behaviour and attitudes above. Although education is supposed to be
“provided for all”, training is seen as a deliberate, exclusive intervention by an
employer on behalf of a particular employee (Meyer & Mokoele, 2003: 14).
Classroom training, industrial theatre, outdoor training and computer-based
training methods and techniques are all used for training purposes (Meyer &
Mokoele, 2003: 4). Education is considered more long term in duration than
training. Training has specific focus areas and narrows the subject matter
down to skills required for specific business needs (Meyer & Mokoele, 2003:
14). Business training can be practiced on either new staff recruits or older
staff. Training is also provided at various functional levels. It can vary from
specialist staff, adults who need literacy training to managers who need
further training for promotion requirements (Erasmus, et al., 2007: 12).
The training process follows certain procedures that can include the following
business practices (Erasmus, et al., 2007: 11):
� An employer must have a documented training policy
� Job descriptions must include training responsibilities
� Training needs are to be regularly defined and redefined
� Training plans are to be drawn up and adapted
� Training resources should be provided
� Training plans must be executed
� Training results must be assessed after the training has taken place
©© UUnniivveerrssiittyy ooff PPrreettoorriiaa
56
Training programs must integrate with the business strategies, HR policies
and overall direction of the organisation instigating the training (Erasmus, et
al., 2007: 20). Long term competitiveness, industrial turbulence and global
SC dynamics require staff training to add to the overall corporate strategies
and direction (Erasmus, et al., 2007: 22). Yet, there are still misguided beliefs
or myths about the place of training programs.
Training content and delivery mechanisms are under scrutiny due to some
mythical notions, as set out by Hannum (2009: 27). These training myths
state that:
� If employees are not performing well, they need training.
� Training and work should have separate spaces and times.
� Everything taught during training will be used on-the-job.
� More learning means better employee performance .
Hannum (2009:27) refutes these training myths in the following way. The real
reasons for employee poor performance may include unclear expectations
and lack of equipment/tools; not just training myths. Employees may struggle
to connect what training provides with what they need on the job. For these
reasons off-site training may not always be best. Since training programs
cannot match work conditions exactly, employees struggle to transfer the
training to practice. The best trainees will not automatically translate into the
best job performers according to Hannum (2009: 27). He also highlights
myths about training content:
� One size (training program!) fits all.
� Teach as much as possible about expert content.
� Great performers know what training to present.
� More training means more performance.
©© UUnniivveerrssiittyy ooff PPrreettoorriiaa

57
Hannum (2009: 28): refutes the training content myths by stating the
following:
� Employees must be tested for what they know and then trained
accordingly
� Excess content will not trigger an employee to perform excessively well
� Star performers have intuition to perform well that may not have been
transferred through training program development.
� There cannot be a proportional response to training: sometimes less
performance can result from too much training.
Hannum (2009: 29) concludes that many training programs suffer from
content bloatedness, where unnecessary content overwhelms employees.
The danger of relying on training myths is that training programs are too long,
cost too much and deliver none of the results anticipated. Besides training
myths, some issues of diversity can also influence the joy derived by
employees from job training.
A diversity study targeting 552 technical and customer service personnel in
Canada and the United State of America (USA), yielded 302 respondents
(Schmidt, 2009: 304). The Schmidt study wanted to assess how
demographics and diversity of staff influence their satisfaction with training.
The survey was responded to online (43%) and via printed copy (57%).
Some of the sample descriptors were:
Female: 182 respondents =62%
Caucasian: 198 respondents = 69%
The preceding arguments led to devising hypothesis two:
H20: There is no significant difference in the format of training preferred by
managers compared to employees.
H2A: There is a significant difference in the format of training preferred by
managers compared to employees.
©© UUnniivveerrssiittyy ooff PPrreettoorriiaa

58
Between the ages of 20 and 35 years old: 171 = 57%
Completed college without a degree: 170 respondents = 57%
Permanent employees: 249 = 84%
The Schmidt study findings were analysed in response to two main research
questions (Schmidt, 2009: 306). Question one asked if demographic
variables (education, job tenure, age, gender and race/ethnicity) were related
to job training satisfaction (JTS). It was found that employees employed at
the organisation for less than a year were more satisfied and received an
average of 10 days more training. Older employees averaged 9 to 13 days’
worth of training and new recruits about 19 days. There were no significant
correlations found between job training satisfaction and the other
demographic variables. Question two examined job type in relation to JTS.
The distinction was made between technical service representatives and
customer service representatives. For customer service staff, their JTS
decreased to about 12 years of job tenure and was thereafter revitalised. The
JTS of technical service staff fluctuated between lows (4th to 6th year), highs
(between 7th and 9th years) and lows (at the 10th year) according to Schmidt
(2009:306).
The third research question found that temporary employees were
significantly more satisfied with the same amount of training than their
permanent counterparts (Schmidt, 2009: 307). The researcher deduces that
his results are inconclusive since, furthermore, temporary staff were only
employed in their first year of job tenure and therefore would obviously be
Apart from the other hypotheses dealing with age and gender, the Schmidt study is
linked to the following hypothesis:
H80: There is no significant difference in the willingness to attend training
between long-tenure employees (employed >10 years) in the same
organisation and new recruits
H8 A: There is a significant difference in the willingness to attend training between
long-tenure employees (employed >10 years) in the same organisation and
new recruits
©© UUnniivveerrssiittyy ooff PPrreettoorriiaa

59
more satisfied. Schmidt advises HR professionals to develop training
programs allowing for job type and tenure rather than for demographics.
Furthermore, he argues that organisations should be aware that since the
training needs of older employees may differ from those of new recruits,
training should build on their existing knowledge and experience (Schmidt,
2009: 310). Schmidt recommends, however, that researchers continue
investigating the relationship between demographic variables and JTS,
especially in other industries (Schmidt, 2009: 310). While the value of the
study cannot be discounted, one limitation that must be acknowledged would
be that respondents included mainly 20 to 35 year olds. In the current SCM
study, SC personnel may be generally older. Another limitation would be the
fact that only two job types were reviewed and this small number could be
misleading and overly simplistic in the SCM research study.
Training programs and interventions are not always evaluated for any positive
returns on the training money invested (Pineda, 2010: 673, Meyer, Opperman
& Dyrbye, 2003: 8). Besides the need to learn and unlearn skills, training is
meant to help achieve the business objectives of the organisation. Evaluation
of training entails gathering information about the outcomes set under a
strategic perspective (Pineda, 2010: 674). The Kirkpatrick model of training
evaluation consisted of four levels (Pineda, 2010: 676, Meyer, et al., 2003: 2):
i. Reaction: measuring trainee enjoyment, value of the training and overall
experience.
ii. Learning: testing the knowledge gained by the trainee
iii. Behaviour: evaluating whether trainees change their behaviour in
practice after the training
iv. Results: investigating the overall impact on the organisation after the
training
Of these four levels, reaction is tested most often, especially directly after
training has been completed. Level two is evaluated with tests to see whether
trainees understood important concepts. Level three looks at the practical
application of what was presented during the training. Level four checks to
©© UUnniivveerrssiittyy ooff PPrreettoorriiaa

60
see if, for example, more sales occur after the sales training (Meyer, et al.,
2003: 3). Although the Kirkpatrick model has been criticised by many, most
agree that a pre-training and post-training evaluation procedure would
produce the most accurate answers to any levels 1 to 4 questions. Pineda
(2010: 677-678) prefers to ask five questions when designing a training
evaluation program. Basically the questions are the following (Pineda, 2010:
677-678):
i. Who will be evaluated?
ii. What aspects of the training should be evaluated?
iii. Who will be doing the evaluation?
iv. Which part of the training will be evaluated? (Is it the part before
training, during training, at the end of training or some time thereafter?)
v. How will the measurement be made?
The Pineda model allows for training and its outputs to be evaluated in the
context of the organisation. Pineda looked mainly at Spanish doctors’ use of
medicine in order to determine what the training return on investment (ROI)
was for the health sector. The study contributes valuable insight since it ran
over a period of eight months of training interventions for doctors. It showed
improved professional use of medicines after doctors underwent the training
(Pineda, 2010: 690).
In conclusion, this section on training briefly summarised the definition of
training as being a systematic attempt to alter employee skills, knowledge and
behaviour as discussed in the ROI study. Training follows a process with
programs to be implemented. Training myths should be eradicated since
training cannot fix all the problems an employee experiences at the
workplace. The call has been made to continue research links between
demographics and job training satisfaction. In order to understand the ROI
focus, the methodology chapter will discuss how research must precede and
follow training needs analyses. The third part of the ETD equation, dealing
with development will be discussed in the following section.
©© UUnniivveerrssiittyy ooff PPrreettoorriiaa

61
2.5. DEVELOPMENT
Employee development is viewed as being wider in context than employee
training (Erasmus, et al., 2007: 3, Meyer & Mokoele, 2003: 14). While training
has been customised to each individual in a personal context, development is
seen as a series of interactions that includes coaching, mentoring and
apprenticeships amongst others (D’Abate, Eddy & Tannenbaum, 2003: 360).
Although employees attend many short–term training sessions, development
is more focused on career advancement (D’Abate, et al., 2003: 366). Mangan
and Christopher concentrate on long-term development by juxtaposing the
supply chains of the future with the type of managers required to run them.
They contrasted managers of the future with managers they observed in 2005
and called for development programs to fill the gaps in competencies
(Mangan & Christopher, 2005: 181). Management development is said to
contain elements of both education and training according to Erasmus, et al.,
(2007: 3).
On the other hand, some authors still characterise development as being
short term in duration. Lawson describes it as a structured process to
enhance the knowledge, skills and attitudes of the learners (Lawson, 2008:
233). This agrees with the view held by Barbazette who thinks an employee
should have a development plan when a skills deficiency has been identified
and a goal has been set (Barbazette, 2006: 161). The implication is that
changes will be visible in the trainee at least by their next performance review.
While some authors revert back to training interventions as part of employee
development, the South African context includes a unit standard of ETD
measurement as being inclusive of knowledge, skills and behavioural
attitudes (Meyer, Opperman & Dyrbye, 2003: 68): Unit standards are desired
outcomes of ETD and their assessment criteria allow all stakeholders to
compare ETD programs (Meyer, et al., 2003: 68). This means that, in this
research study, development is referred to as being related to long-term skills
development as opposed to short-term training interventions.
©© UUnniivveerrssiittyy ooff PPrreettoorriiaa

62
Dealing with skills development, for the purposes of the research project, is
seen as a gradual process of growth. Skills development can take place at
any time when opportunities are used in either the individual’s lifecycle or the
outer sphere (Garavan, 1997: 42). People do not have to be enrolled in a
formal development program in order to learn something new. Research into
social and observational learning found that people also learn by observing
others and imitating their actions (Botha & Coetzee, 2007: 59, Erasmus, et al.,
2007: 108). Skills development is not confined to the classroom or coaching
situation according to Garavan (1997:42). Skills development can differ from
informal learning in terms of the focus of activities used in the process, the
clarity of objectives being set, the time scale, values, content, evaluation
methods and outcomes.
It is important to note that ETD of individuals will collectively add to their
organisations’ ETD practices. The scope of this research project will be
unable to assess organisational ETD within the constrained time frame. To
summarise, this section characterised development as being more long term
than training. It briefly explained the SETA concept for the South African ETD
context and explained the functions of the NQF. The main motivations for
focusing on training, as opposed to education and/or development will be
explained in the next section.
2.6. REASONS TO FOCUS ON TRAINING
The Department of Labour defines the entire labour force as consisting of all
persons employed and unemployed. In South Africa the employed are
between the ages of 15 and 64 years and those who worked for at least ONE
The Garavan study relates to the following hypothesis:
H20: There is no significant difference in the format of training preferred
by managers compared to employees.
H2A: There is a significant difference in the format of training preferred
by managers compared to employees.
©© UUnniivveerrssiittyy ooff PPrreettoorriiaa

63
hour during the reference week of the survey are included in the data that
follows (StatsSa, 2009: xvi). According to the census taken, the September,
2005 approximations of employed HR are listed in Table 2.3.
Table 2.3. Age grouping of the South African employed citizens Age grouping (years) Approximate
number Approximate Total
Less than 24 1.3 million 25-34 4.3 million 35-44 3.5 million 45-54 2.5 million 55-64 1.0 million
Total 12.6 million employed Source: Adapted from the Labour Force Survey (2009: 17).
The industry sectors where the human resources are employed, according to
Table 2.3, include mining, manufacturing, utilities, construction, trade,
transport, finance, community and social services. Another survey looked at
the types of educational qualifications reported by the 12.6 million employed
HR reflected in Table 2.3. Data from the Quarter from July to September,
2009, are summarised in Table 2.4. Note that the total of employed workers
in Table 2.4 does not correspond to the total listed in Table 2.3.
Table 2.4. Highest level of education of the employed in South Africa
Highest education level attained
Number of employed workers (Jul-Sep 2009)
No schooling 455 000 Less than primary school completed 1 162 000 Primary completed (7 years of school) 646 000 Secondary not completed (including leaving school with junior certification)
4 178 000
Secondary completed (12 years) 3 820 000 Tertiary education completed 2 454 000 Other qualifications 168 000 Total 12 885 000
Source: Adapted from Quarterly Labour Force Survey (2009: 17)
From data in Table 2.4, the surprising deduction that can be made is that only
19% (that is 2 454 000 people) of the employed labour force currently has
tertiary education. This leaves an estimated 81% who have either no notable
©© UUnniivveerrssiittyy ooff PPrreettoorriiaa

64
education or up to only secondary education (Grade 12) completed (Labour
Quarterly, 2009: 17). The implications are that all stakeholders have future
training initiatives to offer and complete amongst the 10 million HR that work
daily in this economy. The question that remains is to ascertain what training
exactly is needed where?
Of course, the other side of the labour force coin is the unemployed. The
South African government has made a commitment to halve unemployment
by the year 2014, when the population is estimated to be about 48,7 million
(Erasmus, et al., 2007:48). These policies and strategies entail the provision
of training and the re-skilling of workers in order to make them employable in
the current economic climate. A compelling argument for talent management
is as follows: pro-actively manage the talents/skills or qualifications of the
employed and source those with potential to be employed.
The heart of the matter in any country should be to anticipate the need for HR
and set out a plan to meet the need (Cappelli, 2008:74). Talent management
programs in the USA have been mainly dysfunctional, oscillating between
surpluses and shortfalls of talent. The old way(s) of meeting HR demand
was/were to do no planning and to react to the demand by using outside HR
sourcing companies to find talent. Problems arose when surplus talent had
been eroded! The other approach to meeting talent demand used legacy
systems from the 1950s that forecast and planned for talent during predictable
business conditions. The current practice in a talent-on-demand framework is
that business organisations borrow from SCM, since they then have to allow
for the uncertain market environments (Cappelli, 2008:74).
The risks associated with HR in SCM are that well-trained talent can become
expensive inventory when sitting on the bench. This can occur even when
existing employees fail to use their newly acquired skills after having been
sent on training programs. The talented HR skills base is also posing the risk
of walking out the door and being lost to the organisation (Cappelli, 2008:78).
Businesses and other organisations are therefore faced with the dilemma of
©© UUnniivveerrssiittyy ooff PPrreettoorriiaa

65
making (i.e. training) their HR talent or buying (hiring) already trained HR from
outside their own organisations.
Cappelli, (2008: 81) describes the four principles that he thinks organisations
should follow when making a make-or-buy HR talent decision. These
principles are first briefly summarised in Table 2.5 and discussed in greater
detail thereafter.
Table 2.5. The Cappelli principles for deciding whether to make or buy
HR talent
Principle
number
HR talent “make-or-buy” decision
Principle 1: Firms must manage risk.
The investment in training does not equal entitlement:-
organisations should rather train too little HR than to have
trained staff that can be poached by competitors.
Principle2 Adapt to the uncertainty in demand.
Firms rather train for 18 months on general management,
and are not keen on 3-year-long programs:
They prefer allowing employees to return to their normal
work functions to learn specialist skills.
Principle 3: Improve the ROI in developing employees.
Firms can ask HR to pay for some of their training/ do
stretch assignments on own time/ or maintain friendship to
the point of letting HR return after leaving.
Principle 4: Preserve the investment by balancing employee-employer
interests.
Firms should let HR share in advancement decisions or
else watch them leave for better opportunities.
Source: Adapted from Cappelli (2008: 78)
©© UUnniivveerrssiittyy ooff PPrreettoorriiaa

66
Findings from the Cappelli study include the following: When deciding
whether to make or buy, that is, to train HR talent or not, one has to consider
the following issues based on Cappelli Principle 1:
� The longer the HR talent is needed in the entity, the more inclined
organisations will be to invest in training the talent.
� When there is uncertainty about the long-term forecast, trained HR will
simply be poached.
� Functional areas present room for training without spending too much
money on them, that is, on-the-job learning is beneficial.
� HR talent will not be hired from outside if the corporate culture is to be
maintained at a status quo.
� Undershooting the HR talent forecast is not difficult to remedy when
dealing with low-level skills but may cost a premium when HR agencies
are used for higher-level skills. It worsens when HR agencies are
required to absorb the associated risk such as misfit employees (Capelli,
2008: 77-79)
When deciding whether to train HR talent or not, one has to consider the
following issues in Cappelli Principle 2:
� The time horizon on sourcing talent can be shortened by rotating new
hires every three months instead of taking in only one batch per year.
� Training programs can also be subdivided into discrete parts dealing with
general management, interpersonal skills and some functional
knowledge and not take as long
� Diversify. Instead of relying on one source/supply of skills, rather train
employees with generic interchangeable skills, enabling one employee to
do a range of jobs. This will help HR management to specialise into
roles as and when required to close any gaps in knowledge required
(Cappelli, 2008: 79-80).
When deciding whether to train HR talent or not, one has to consider the
following issues based on Cappelli Principle 3:
� Ask employees to sign contracts to continue work after they have been
given expensive training. In the USA, it is common for about 20% of
©© UUnniivveerrssiittyy ooff PPrreettoorriiaa

67
employers to expect repayment of the investment if employees decide to
leave before that agreed time (Cappelli, 2008: 80).
When deciding whether to train HR talent or not, one has to consider the
following issues in Cappelli Principle 4 (Cappelli, 2008: 81):
� Firms need to balance employer-employee interests
� In the past, it would be considered a career-limiting move to disagree
when managers and executives have identified certain “opportunities”
that match the skills of the employee. Matching individuals to jobs was
common practice – which would have encouraged employees to leave.
Current practice suggests that internal job boards be used, in order to
retain the HR skills inside the organisation, which allows employees
more freedom in managing their careers (Capelli, 2008: 81).
� In the USA 50% of new employers do not require the permission of the
existing employer to allow employees to move to new positions/posts.
� Conflict exists where employees want promotional opportunities,
employers demand affordable HR skills in the form they require and
national interest generally lies in higher-level skilled employees (Capelli,
2008: 81).
Cappelli (2008: 81) concludes the study with a call to move away from the old
engineering type models used for HR talent management. The call is to use
market-related, operations-based tools that can be better applied to the
challenge of uncertainty. All countries, including South Africa need to
proactively manage HR talent make-or-buy decisions from a strategic
perspective. In doing this, it is however important to question how much
training had previously taken place, who provided the training and who
received it; similar to the way the USA dealt with their critical skills gaps that
existed many years ago (Frazis, Gittleman & Joyce, 2000: 443).
2.7. CONCLUSION
This chapter briefly distinguished between all three components of ETD and
motivated why training is important to alleviate labour force shortcomings.
©© UUnniivveerrssiittyy ooff PPrreettoorriiaa

68
The South African historical context in education was also briefly discussed
together with the changes in legislation that took place after the 1994
elections. The SAQA is also highlighted in this chapter as being the standard
setter and the custodian of quality of training. The NQF is also mentioned as
being the mechanism to compare the HR educational qualifications and to
know that training is globally recognised.
It is becoming more imperative for business concerns in South Africa to build
a larger skills reservoir. HR training and skills development should ideally be
aligned to stimulus plans for specific industries and sectors of the economy
(Mayer & Altman, 2005: 52). The policies are in place for ETD practice to
take place in South Africa. Chapter three contains research findings from
other countries on TNA that will demonstrate that much work still needs to be
done in ETD. Chapter three will also look at specific barriers to HR training
and identify variables that will be measured in the empirical TNA research
study.
©© UUnniivveerrssiittyy ooff PPrreettoorriiaa

69
CHAPTER THREE TRAINING NEEDS ANALYSIS 3.1. INTRODUCTION
3.2. TRAINING NEEDS ANALYSIS
3.3. MODELS OF TRAINING NEEDS ANALYSIS
3.4. REASONS TO FOCUS ON TRAINING NEEDS ANALYSIS
3.5. CONCLUSION
©© UUnniivveerrssiittyy ooff PPrreettoorriiaa
70
3.1. INTRODUCTION Since the importance of ETD was discussed in the preceding chapter, it must
be emphasised that successful training interventions are most probably
initiated by conducting training needs analysis (TNA). This chapter defines
the what, who, why and how of TNA and briefly states how it differs from
training needs assessment. It attempts to demonstrate the value of
conducting TNA in organisations. This chapter further supports the inclusion
of some research objectives in the South African supply chain management
(SCM) context.
The use of training models provides a clear indication of where employees
require training. It also helps analysts provide focused answers and lends a
framework to the TNA (O’Brien & Hall, 2004: 935, HRD Department of the
Institute of Personnel Management, 1994:1). Different training models will be
briefly contrasted in order to select suitable tools for the SCM TNA study.
Although the research study problem statement signals the current mismatch
of employee SCM skills demanded and supplied, 2004 researchers still noted
the non-existence of a well-defined formal method of implementing a TNA
(O’Brien & Hall, 2004: 936). Common TNA methods involve ratings done by
managers to which employees either agree or disagree (O’Brien & Hall,
2004:936). Although training is not the cure for all ailments in HR, it helps to
eliminate obvious skills requirements while other mechanisms address
remaining HR needs.
3.2. TRAINING NEEDS ANALYSIS
In the training context, a need is defined as a gap between a current situation
and a future situation where a discrepancy exists between “ what is” (which is
the present state) and “what should be”, the desired state (Witkin & Altschuld,
1995: 4, Swist, 2001: 1). A need is not to be confused with a wish (Witkin &
Altschuld, 1995: 8) since most wishes remain unfulfilled. If training needs
could not be distinguished from wishes, the human unlimited wish-list effect
©© UUnniivveerrssiittyy ooff PPrreettoorriiaa

71
could possibly be a glaringly obvious explanation for the unfilled gaps in
training needs. As such, it is as important for managers to participate in TNA
as it is for their employees. Managers provide both qualitative and
quantitative feedback on TNA. The TNA feedback can be used as inputs by
human resource managers to facilitate future training program content and
operational level changes (Swist, 2001: 3).
A training need should not be confused with a want, which is something that
an employee would like to have irrespective of the fact that it will not
contribute to any long term learning or performance goals (Swist, 2001: 1).
Consequently addressing training needs is seen as contributing to business
long-term goals (Gupta, Sleezer & Russ-Eft, 2007:30). Berwick preceded the
long term perspective of Gupta, et al. in 1989, by positing that the perception
of a need, comes from what one believes to be educationally worthwhile.
Berwick (in Tajino, James & Kijima, 2004: 8) emphasized that needs are not
simply out there, waiting to be measured or counted, but should evolve
towards meeting the learning or performance goals of the individual or the
organisation (Tajino, et al., 2004: 8).
Another approach to defining TNA, considers it as the first step in the training
cycle and the first stage of needs assessment. The creation of a training plan
is what makes a needs analysis turn into a needs assessment in the training
context. The training cycle stages are depicted in Figure 3.1.
©© UUnniivveerrssiittyy ooff PPrreettoorriiaa

72
Figure 3.1. The five stages of the training cycle
Source: Adapted from Truman in Coetzee (ed), (2007:214)
The training cycle depicted in Figure 3.1. is clarified through each stage:
� Stage 1: During the ETD needs analysis
� Stage 2: When busy with learning program design
� Stage 3: Training delivery is where actual programs are implemented
� Stage 4: Any form of training is usually accompanied by the assessment
and moderation of learner achievements.
� Stage 5: For the training cycle to be complete, there should be an
evaluation of the program effectiveness.
If individuals are to have tailor-made training programs it is vital to survey the
worker demographics, job classification and prior training (Harrison, Davis,
MacDonald, Alexander, Cline, Alexander, Rothney, Rybka & Stevens, 2005:
29). The Harrison et al., (2005: 28) study conducted a TNA amongst public
health employees in North Carolina, United States of America, that
demonstrated the importance of TNA in designing appropriate training
Stage 4: Assessment and moderation of learner achievements
Stage 1: ETD needs analysis
Stage 2: Learning program design
Stage 3: Training delivery
Stage 5: Evaluation of program effectiveness.
©© UUnniivveerrssiittyy ooff PPrreettoorriiaa

73
programs. About 150 public health-care job classifications were found, within
one state in the USA.
Core competency was surveyed in the first phase and a link between
competence, job classifications and actual employees was part of phase two
of the study. Harrison et al., (2005: 30) included barriers-and-facilitating
factors in their survey of health employees. Barriers to participating in the
TNA survey, included the time taken to complete the questionnaires (30-40
minutes) together with limited computer literacy and access since the TNA
questionnaire was accessed online. Another barrier to TNA is the
accompanying fear that employees who receive training will want to change
their places of work soon thereafter (Harrison et al., 2005: 32). Facilitative
factors were the incentives that participating organisations would receive
grant funding towards training in bio-terrorism responses. The fear of
employees leaving the company was addressed in chapter two in the Cappelli
Principle 3. It features a discussion of how, in the USA, it is common for
about 20% of employers to expect repayment of the investment if employees
decide to leave before their agreed time (Cappeli, 2008: 80).
Harrison et al., (2005: 33) concluded that it was essential to pursue both
individual and organisational training plans. They concluded that TNA results
should be directly linked to applicable training programs.
3.2.1. The need for training needs analyses
The TNA survey could distinguish four levels of training within organisations.
These levels (1-4) are as follows:
This is a quick reminder of the hypothesis that is linked to the Harrison et al., study:
H90: Employees are not likely to request more training when employers insist on a
repayment contract
H9A: Employees are likely to request more training when employers insist on a
repayment contract
©© UUnniivveerrssiittyy ooff PPrreettoorriiaa

74
1. General training for all employees such as health and safety, for example
are at level one.
2. Hierarchical level training is at level two. This level gives employees
access to training programs if they are on the required rank/position
within the organisation.
3. Level three, means that specific job functions automatically qualify for
certain types of training. For example, accountants should receive tax
training.
4. At level four, role specific training can delve deeper into job functions,
indicating, for example, that HR managers should know how to manage
employee leave requests.
O’Brien and Hall (2004: 937) agree that the four-level structure of a TNA can
only be successful if general questions to be answered by employee
respondents can be targeted and successfully answered at each level
(O’Brien & Hall, 2004: 937). According to O’Brien and Hall (2004: 937), TNA
is the first step towards structured design of training programs. Their ultimate
goal was to design electronic learning training programs to prevent small and
medium enterprises from lagging behind in training their employees (O’Brien
& Hall, 2004: 937). They are adamant that TNA is a vital first step towards
designing successful e-learning content and training programs (Swist, 2001:
1, O’Brien & Hall, 2004: 937, Harrison, et al., 2005: 33). The nature of such a
comprehensive approach to TNA would probably require a longitudinal
research approach, which is beyond the scope of this research survey.
All organisations have strategic and operational business needs which must
be linked to training programs (O’Brien & Hall, 2004: 938). Within these two
levels there are also individual performance needs and individual learning
needs (Gupta, et al., 2007: 31). The following factors listed by Brown (2002:
571) were seen to signal possible training or development needs of
employees:
� Development of employee or management skills to fill a current need
such as reduction in workforce, employee reassignments and promotions
� Employee relations or problematic organisational problems
©© UUnniivveerrssiittyy ooff PPrreettoorriiaa

75
� The changing skill required when new technologies are being introduced,
when equipment is modernised or business regulations change
� Career development at employee request or career enhancement plans
It is worth noting that the factors listed by Brown are possible signals. They
should not therefore, of themselves, be assumed to be training needs. Brown
stresses the need to have ongoing needs analyses processes in place in a
business environment (Brown, 2002: 569). Seven years prior to Brown,
MacDuffie and Kochan were testing the assumption that USA automotive
manufacturers were investing less in HR than were the rest of the world
(MacDuffie & Kochan, 1995: 147). The answer was affirmative: that the USA
did spend less money on their HR training. MacDuffie and Kochan suggested
four alternative reasons why USA firms under-invested in training their
employees, which included:
� The USA needed to focus on quality since they were not a low-wage
economy, nor could they rely on well-educated Americans from a faulty
education system (MacDuffie & Kochan, 1995: 148). With this reasoning
they were trying to clarify the point that highly industrialised countries
should actually spend more than developing countries on employees’
further education and training.
The hypotheses that are applicable to the theory above include:
H30: There is no significant difference in reasons motivating employees to attend
training
H3A: There is a significant difference in reasons motivating employees to attend
training
H70: There is no difference in the frequency of training requests between late-career-
stage employees (older than 45 years) and others
H7A: There is a difference in the frequency of training requests between late-career-
stage employees (older than 45 years) and others
©© UUnniivveerrssiittyy ooff PPrreettoorriiaa

76
� MacDuffie and Kochan, stated that cultural differences ensure that other
countries spend more; for example, when Japan offers workers lifetime
employment, it also means they invest more in training over time
(MacDuffie & Kochan, 1995: 148).
� Their results on whether new technology requires more knowledgeable
workers or actually displaces workers were inconclusive. This led to the
MacDuffie and Kochan deciding that training should be part of an
organisation’s strategic concerns instead (MacDuffie & Kochan, 1995:
148).
� The fourth justification for not doing so much training is that overall
business strategy should dictate training requirements and not external
macro-economic challenges (MacDuffie & Kochan, 1995: 149). .
MacDuffie and Kochan discovered that newly hired staff received more
training per annum than the workers already experienced in production
techniques. One shortcoming that they acknowledge is that “more training”
did not inform them about the topics and methods used for training (MacDuffie
& Kochan, 1995: 155). The European and Japanese firms trained their staff
more, according to the MacDuffie and Kochan study, due to their production
strategies being flexible rather than espousing mass production (MacDuffie &
Kochan, 1995: 164). The parent firm’s strategy, rather than a decentralised
production facility’s scale, the mix of products or complexity of its parts is what
determines the HR training strategy (MacDuffie & Kochan, 1995: 164).
The hypothesis that is deduced from the question of MacDuffie and Kochan’s experience
versus youth concern is:
H80: There is no significant difference in the willingness to attend training between
long-tenure employees (employed >10 years) in the same organisation and
new recruits
H8 A: There is a significant difference in the willingness to attend training between
long-tenure employees (employed >10 years) in the same organisation and
new recruits
©© UUnniivveerrssiittyy ooff PPrreettoorriiaa

77
While the MacDuffie and Kochan empirical results did not lead them to the
exact conclusions, they did conclude some pointers that would also apply to
the South African research study context. MacDuffie and Kochan submitted
that training instituted by national policy would focus more on technical skills.
The reasons behind this statement, stem from the mobility of technical skills to
transfer in-between jobs and industries (MacDuffie & Kochan, 1995: 166).
The need to verify or certify the level of skills also puts pressure on national
bodies to maintain certain standards. A mix of general skills, such as problem
solving is also important, since reading, mathematics and reasoning are all
required in today’s business organisations. Already in 1995, the USA
companies were concerned about retiring employees and the possibility of
skills shortages, which now constitute the reality of the year 2012 (MacDuffie
& Kochan, 1995: 166).
Training has been lacking since industries changed around World War II,
according to Lee and Lancaster (1971: 4). After 1945, manufacturing started
using continuous processes that required technical maintenance of machines
and equipment. Blue-collar maintenance staff grew in numbers without the
required growth in training programs to accompany the shift from physical
strength maintenance to knowledge/analytical strength maintenance (Lee &
Lancaster, 1971: 46-48). The resultant gap in training was not going to be
remedied overnight, nor was it going to be cheap to implement (Lee &
Lancaster, 1971: 48). Lee and Lancaster raised the call for more investment
in training, continuous training and empirical research to be conducted on
maintenance-work relationships (Lee & Lancaster, 1971: 48).
Lee and Lancaster (1971: 49) predicted that a skilled master craftsman would
no longer be the norm and that workers’ opportunities would lie in knowing
more than their own supervisors about technological developments and
processes. Contrary to how employee working life and industries ran before
the war, Lee and Lancaster also predicted that even master craftsmen would
need continuous learning because employees could change their jobs at least
©© UUnniivveerrssiittyy ooff PPrreettoorriiaa

78
three times in their lifetimes (Lee & Lancaster, 1971: 49, Harrison et al., 2005:
33).
3.2.2. Responsibility to conduct TNA
Training itself has been criticised for the fact that employees hardly know how
to implement the training they have received (Vermeulen, 2002: 366).
Transfer of training is seen as successful when it can overcome time, space
and contextual differentials (Vermeulen, 2002: 366). The author suggested
that role–play is an essential technique to help employees transfer their newly
acquired knowledge on their return to the office. Role-play, which makes it
necessary to revisit the roles of the HR manager, is probably not the number-
one priority of HR professionals. One view of a starting point for HR is to use
Job Analysis as a human resource management tool, for understanding first
where TNA fits into the overall picture.
©© UUnniivveerrssiittyy ooff PPrreettoorriiaa

79
Figure 3.2. Job Analysis as a human resource management tool Source: Adapted from Grobler, Wärnich, Carrell, Elbert and Hatfield (2009: 156). In terms of Figure 3.2. a job analysis consists of looking at a job description
and a job specification. This is part of the normal HR management functions.
The scope of this research is limited to section “B” which refers to “employee
knowledge, skills and abilities”. The research also limits the scope to the
subsection numbered “4“ in Figure 3.2. Subsection number four refers to ETD
programs, TNA and how these may build on employee knowledge, skills and
abilities.
TNA can be done via different techniques including holistic strategic plan
analysis, analysis of the HR plan, interviews, questionnaires, observations
and the routine performance review process (HRD Department of the Institute
of Personnel Management, 1994: 12). In industrial practice, however, it is
A. Tasks, responsibilities and
duties
B. Knowledge, skills and abilities
Job descriptions
1.Employment Programs: How to recruit and select HR
2.Evaluation Programs: How to establish job worth and salary levels
3.Job Design Programs: How to enrich jobs and alternative schedules
4.ETD Programs: TNA and formal and informal meeting of needs
5.Appraisal Programs: How to measure and reward performance
Job specifications
JOB ANALYSIS
©© UUnniivveerrssiittyy ooff PPrreettoorriiaa

80
possible for HR training plans to have been drawn up independently of what
the real training needs are.
In contrast to TNA that forms part of the training cycle, Gupta et al. see
training needs assessment (sometimes also abbreviated as TNA) as a
diagnostic process. Training needs assessment includes data collection,
collaboration and negotiation to identify and understand gaps in learning,
performance and future training actions. Needs assessment differs from TNA
in that it uses more than one type of analysis and a three-phase process to
collect, analyse information and create a training plan (Barbazette, 2006:5,
Witkin & Altschuld, 1995: 14). According to Barbazette, the needs analysis
can take many forms, which include the following:
� Feasibility analysis
� Needs versus wants survey
� Goal analysis
� Task analysis
� Target population analysis
� Contextual analysis (Barbazette, 2006: 8)
Barbazette sees the use of TNA as finding gaps in an individual employee’s
performance that may be caused by either personal, information-related or
environmentally related barriers to performance (Barbazette, 2006: 24).
These barriers have been more closely investigated by Barbazette by using 5-
point rating scales within organisations, similar to what will be used for this
research project (Barbazette, 2006: 47). Note that Barbazette is quick to add
that non-training solutions may also be applied to addressing gaps in training
(Barbazette, 2006: 35). In any organisation, it is possible that employees may
be referring to the same training need but everyone calls it by a different
name (Barbazette, 2006: 75). In such instances, it becomes the responsibility
of HR, skills development facilitators and managers to discuss TNA survey
findings and reach consensus on the training programs to be implemented.
Barbazette emphasises the point that success in TNA is improved when HR
can link training needs to business needs in order to convince higher level
management to support training initiatives. (Barbazette, 2006: 110).
©© UUnniivveerrssiittyy ooff PPrreettoorriiaa

81
The mere collection of training need information should not be viewed
independently from other company information on employees. Homer (2001:
59) suggested that the lack of information about skills that employees already
have, can lead to delays in filling vacant positions within organisations. He
also suggests that a competency management system would allow managers
to search their current employees’ skills profiles and save the recruitment
costs (Homer, 2001: 60). Referring to the employee side, Homer comments
on a Whitman-Hart Institute for Strategic Education (WHISE) career
management system that helps employees identify their own skills gaps and
shows them how to close those gaps (Homer, 2001: 60). The notion of
having a skills library is probably not equally common in all organisations
otherwise they would not have complained about shortfalls and skills gaps.
The author stresses the use of skills management systems to the point of
identifying so-called soft skills (for example presentation skills) and attributing
these skills to individual employees to benefit the business in the long run
(Homer, 2001: 62).
The TNA to be investigated will henceforth pertain only to training needs
analysis and not training needs assessments. From the collaborative
research of scholars three often-cited models that have been applied to
conducting TNA are explained in the following section.
3.3. MODELS OF TRAINING NEEDS ANALYSIS A realistic TNA is reliant on insider information about the real situation to
figure out the gaps that need to be filled (Gupta, et al., 2007: 1). Thus the
A reminder that the theory of Homer refers to the types of skills (such as soft skills) is
the following:
H10: There is no significant difference in the training received by managers and
employees in the preceding 12 months
H1A: There is a significant difference in the training received by managers and
employees in the preceding 12 months
©© UUnniivveerrssiittyy ooff PPrreettoorriiaa

82
research methodology included two phases and going onsite to use current
business employees as the respondents. It must be duly noted that Sharan
Merriam, an expert in adult education wisely stated that no single theory,
model or set of principles will ever be able to explain the complexity of adult
learning (Zemke, 2002: 87). Therefore, in this section, a few TNA models are
described, to illustrate the reasons for selecting a hybrid model for this TNA
study.
3.3.1. Boydell’s Systems Model of TNA
In 1977 Boydell identified three levels where training needs can be identified
(HRD Department of the Institute of Personnel Management, 1994: 7). These
are the organisational level, the occupational level and the Individual level. At
the organisational level, corporate strategy and HR plans can be effective to
determine training needs. However these training needs must always be
interpreted according to the interdependencies between training and the
macro-environment.
The generally accepted view that an organisation is made up of systems (or
main functions) with inputs and outputs is depicted in Figure 3.3. The
occupational level deals with specific functions taking place in an
organisation. These functions of an organisation, for example the Financial
System, form their own unique systems. Systems that are interdependent
include Financial, Social, Information and Technological. Each of these
systems has human aspects (perceptions, skills, culture) and some aspects of
technology (equipment, methods, processes). The individual level is found as
a subsystem within a particular organisational function or system. Individual
level information can only be obtained by conducting performance appraisals.
©© UUnniivveerrssiittyy ooff PPrreettoorriiaa
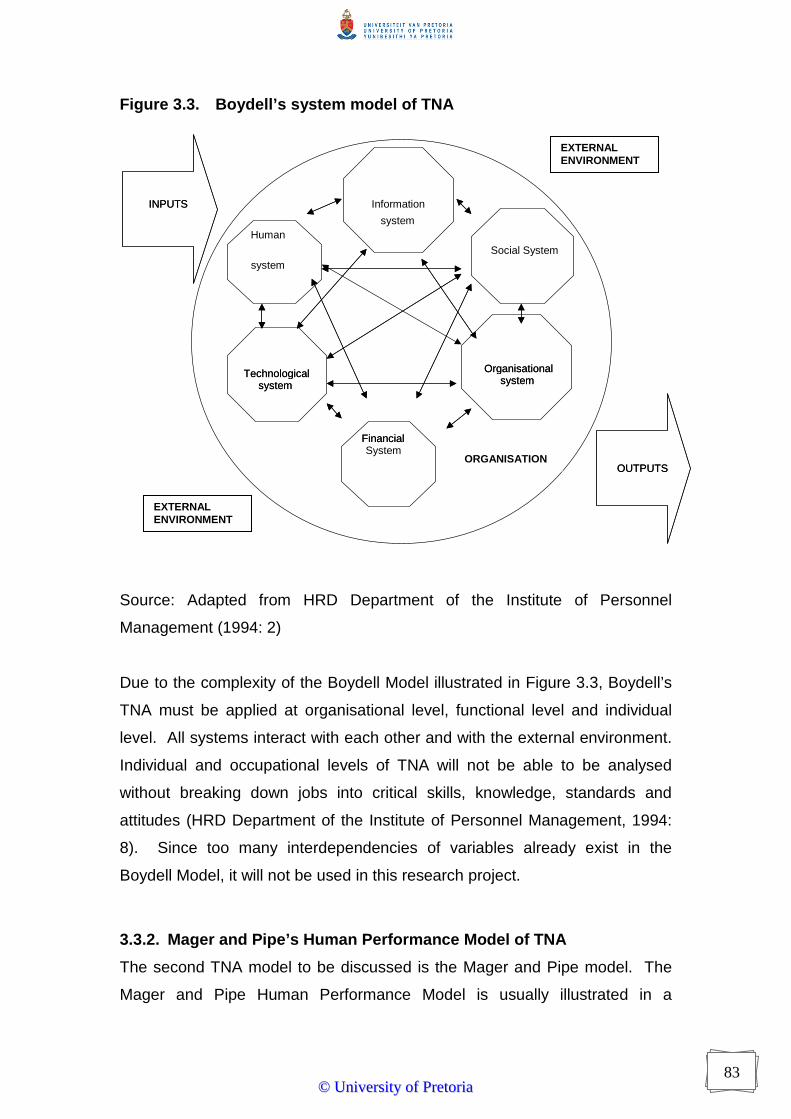
83
Figure 3.3. Boydell’s system model of TNA Source: Adapted from HRD Department of the Institute of Personnel
Management (1994: 2)
Due to the complexity of the Boydell Model illustrated in Figure 3.3, Boydell’s
TNA must be applied at organisational level, functional level and individual
level. All systems interact with each other and with the external environment.
Individual and occupational levels of TNA will not be able to be analysed
without breaking down jobs into critical skills, knowledge, standards and
attitudes (HRD Department of the Institute of Personnel Management, 1994:
8). Since too many interdependencies of variables already exist in the
Boydell Model, it will not be used in this research project.
3.3.2. Mager and Pipe’s Human Performance Model of TNA
The second TNA model to be discussed is the Mager and Pipe model. The
Mager and Pipe Human Performance Model is usually illustrated in a
system
Organisational system
Financial System
Technological system
Human
system
OUTPUTS
INPUTS Information
Organisational system
Financial
Technological
OUTPUTS
Social System
system
INPUTS
ORGANISATION
EXTERNAL ENVIRONMENT
EXTERNAL ENVIRONMENT
©© UUnniivveerrssiittyy ooff PPrreettoorriiaa

84
flowchart diagram (Zemke & Kramlinger, 1982: 18-21). The model suggests
that a manager can easily identify training needs by asking twelve questions.
Table 3.2. lists the 12 key questions and their respective subsets of questions
that will allow any manager to determine the training needs of his or her
employees.
Table 3.1. Questions from Mager and Pipe’s Human Performance Model Main Question Respective sub-set of questions 1. What is the performance
discrepancy?
� What is the difference between what is expected of the
employee and what is being delivered?
� What evidence supports the answer above?
� How reliable is that evidence?
2. Is the difference
important?
� Why is the difference important?
� What will happen if we do nothing at this point?
� Is it worthwhile to actually do something?
3. Is the employee lacking
a specific skill?
� Could the employee do the job if it really mattered to
him/her?
� Are the present skills levels at least meeting minimum
standards?
If it is definately a skill or knowledge deficiency, the following questions are asked:
4. Was the employee able
to perform on the job in the
past?
� Have the employees forgotten how to do it?
� Do they know it is still expected of them?
5. Is the necessary skill
used often?
� How often is it being used?
� Does the employee receive enough feedback on how well
he/she is using that skill?
6. How simple is the
solution to fix the problem?
� Should the employee be trained?
� Should the job be adapted?
� Can the employee be rotated elsewhere?
7. Does the employee have
what it takes to do the job?
� Is there physical/mental potential inherent in the employee?
� Could the employee possibly be overqualified for the job at
hand?
If it is definately NOT a skill or knowledge deficiency, the following questions are asked
8. If it is not a skill/
knowledge deficiency, is
the desired performance
being punished?
� Does doing the desired performance lead to punishment for
the employee? (which means it acts as a disincentive)
� Is there some pressure NOT to perform?
9. Is non-performance
being rewarded?
� What does the employee get for not performing?
©© UUnniivveerrssiittyy ooff PPrreettoorriiaa

85
10. Does doing the job
correctly really matter to
the employee?
� What kind of reward/self-pride/status is associated with doing
the job?
� What is associated with NOT doing the job?
11. Are there obstacles
that hinder performing on
the job?
� Does the employee know what is expected?
� Does he or she know when it is expected?
� Are there many other competing demands for the employee’s
time?
� Does tradition/policy/ego create obstacles?
� Is the job physically a “mess”?
12. What are the
limitations to possible
solutions?
� Which solutions may not be accepted by the organisation?
� Are the possible solutions beyond the financial and time
resources of the organisation?
Source: Adapted from: Zemke & Kramlinger, (1982: 18-21), HRD Department
of the Institute of Personnel Management (1994: 3-4).
An important constraint in the use of the Mager and Pipe Model, requires the
line manager of an employee to take responsibility for the training when the
needs are identified. Since respondent managers cannot be held accountable
to conduct training after the research findings are disclosed, this responsibility
requirement therefore eliminates the use of this model as a TNA tool for this
research study. While the Mager and Pipe Model has been adapted by many
trainer analysts since it was first published, the important aspect to keep in
mind is that the model should be effective in asking specific questions that
help with TNA.
3.3.3. The Zemke and Kramlinger Model of TNA
The Zemke and Kramlinger Model that follows claims to have its derivation
from the Mager and Pipe Model (Zemke & Kramlinger, 1982: 22). Figure 3.4.
depicts how Zemke and Kramlinger have summarised and incorporated the
12 questions from Mager and Pipe into their own model.
©© UUnniivveerrssiittyy ooff PPrreettoorriiaa

86
Figure 3.4. The Zemke and Kramlinger Model of TNA v Source: Adapted from Zemke and Kramlinger (1982: 22)
Zemke and Kramlinger strongly believe in the six categories of variables that
could help an HR manager or trainer to conduct a successful TNA (shown on
the right hand side of Figure 3.4). The authors caution that they would
seldom look for all six categories of variables in the same study. Zemke and
Kramlinger recommend starting as high up in the organisation as possible and
working one’s way down in order to find out how problems are perceived at
the organisational level, the operational level and the individual level (1982:
9). Thus it is important to review the literature to reveal studies completed
since then, before adapting the TNA to an SCM environment.
Zemke (2002: 86) later criticised himself by stating that “training is about
creating expertise, not only about pouring knowledge into people”. He further
stated that adult learners require training objectives, content, activities and
assessment opportunities to be aligned with each other, before they will really
learn something from training programs (Thiagarajan in Zemke, 2002: 89).
Organisational:
� History � Strategy � Mission � Goals � Tactics � Plans
Employee: with (1.) skills, knowledge and abilities has training needs: He/she is influenced by:
(2). Objectives (3). Expectations (4). Rewards versus Punishment (5). Regular feedback (6). Management Support
©© UUnniivveerrssiittyy ooff PPrreettoorriiaa

87
The fourth model of TNA discussed in this chapter is attributed to Fairbairns.
In her research study Fairbairns (1991: 45) expands on the work of the
preceding TNA models. In her three-circle model of TNA, Fairbairns argues
that the two “good” traditional questions that are asked in a TNA are missing a
third question about the “cultural dimension” (Fairbains, 1991: 45). The usual
and traditional questions that are being asked are:
(a) What skills/ knowledge/ attributes are important in your job? This is
testing perceptions about relevance.
(b) In which of these are you in need of training? This is testing for the
respondents’ learning priorities and their readiness for it.
According to Figure 3.3, the Fairbairns’ recommendation is that a third
question be asked, namely: What skills/ knowledge/ attitudes are likely to be
recognised or rewarded after completion of training programs within your
current organisation? The recommendation is to stop doing TNA if it is
intended only to decide which training and development programs to run.
Instead the tactical overlap of the three questions should be found. The
Fairbairns’ three-question tactical overlap is represented by ovals in Figure
3.5. The goal of Fairbairns is to analyse the kind of reception
(hostile/receptive) any learning intervention is likely to receive.
©© UUnniivveerrssiittyy ooff PPrreettoorriiaa

88
Figure 3.5. The three ovals where the three TNA questions must
overlap
Source: Adapted from Fairbairns (1991: 44)
Fairbairns advises training analysts and researchers to find the overlap area
between the following:
I = Importance of the training (to the industry)
T= Individual training needs
R= Likelihood of recognition or reward for undergoing the
training (can be intrinsic or extrinsic) (Fairbairns, 1991: 45)
In Figure 3.5. there are overlapping areas in the parts labelled 1,2,3 and 4.
The all-inclusive overlap is at number 3, where the employee will know that
the training is important, needed and likely to be rewarded. It is therefore
advisable to adapt a TNA for the SCM environment with the links between
individual training, industry needs and rewards attached to training.
1 2 3 4
In need of training
“T”
Important in my job
“I”
Legend: 1 = Important and in need of training but not likely to be rewarded 2 = Important and likely to be rewarded but not in need of training 3= The sweet spot. This is exactly where the trainee would like to be when in TNA. 4 = In need of training and likely to be rewarded, but not important in my job.
4 = Not important but will be rewarded
“R”
3
4
©© UUnniivveerrssiittyy ooff PPrreettoorriiaa

89
The question remains as to how one is supposed to conduct a TNA.
According to Sally Sparhawk, the High Impact model is an effective tool for
measuring TNA (Sparhawk, 1995: 102). A fifth model of TNA is that of Sally
Sparhawk called the High IMPACT model. The six phase process focuses on
TNA as a methodological start for a subsequent training process (Sparhawk,
1994: 13). Sparhawk says that the information captured should be sub-
divided by groups and then measured in terms of the skills, knowledge,
attitudes and other factors that exist and/or are desired by the respondents.
This will allow the training practitioner to quantify and qualify the suspected
training needs identified. This means that questions must be phrased for
categorisation later (Sparhawk, 1995: 102). The High Impact Training model
has six phases:
I = Identify training needs,
M = Map the approach,
P = Produce learning tools
A = Apply training techniques
C = Calculate measurable results
T = Track ongoing follow-through
Step “I” has six underlying steps: (1995: 1). This has some similarities to the
general research process: (1) assess the current situation (2) envision future
goals (3) gather information (4) sort the information (5) share results (6)
decide on way forward. Noteworthy again is that, because of time and
funding constraints, this research project must be limited to phase one of
Sparhawk’s High Impact TNA model.
3.4. REASONS TO FOCUS ON TRAINING NEEDS ANALYSIS
3.4.1 The importance of quality of training
In trying to simplify HR matters, TNA is usually the result of performance
evaluation meetings between employees and their supervisors. Any training
needs identified would require training programs to be planned and
implemented to meet those needs. However when the planning part is
completed, best practice dictates that Planning must be followed by Doing,
©© UUnniivveerrssiittyy ooff PPrreettoorriiaa

90
Checking and Acting (Olian, Durham, Kristof, Brown, Pierce, & Kunder, 1998:
22). The doing component stresses the need to analyse the content of the
training and development initiative, since employees’ education and learning
requires quality content. Bradley and Oliver agree that it is important for adult
learners to understand why the content of what they are learning is relevant.
They believe that it will allow future problem solving and perhaps even
motivate the trainees through the perceived benefits of quality training content
(Bradley & Oliver, 2002: 38).
In 1997, David Stamps coined the phrase “communities of learning” after
dissuading his managers from embarking on a year long program to train
customer service staff (Stamps, 1997: 35). Instead of forcing employees to
spend time in classroom training, David suggested that the company (Xerox)
organise employees in groups/cells so that teamwork could be involved in
solving customer problems on the phone (Stamps, 1997: 36). The criticism
levelled against training professionals in this case, was that they devised
training programs that were far removed from the reality of the customer
service employees. The outcome of starting a community of employees, was
the continuous learning from the “more social” environment of training each
other (Stamps, 1997: 36).
3.4.2 The aging future workforce
Another important reason to start TNA is that workers stay at work legally for
longer, but at the same time, the entire workforce is aging (Dychtwald &
Baxter, 2007: 325, Guthrie & Schwoerer, 2001: 59). Dychtwald and Baxter
classify the time between 1946 and 1964 as that of the baby boomer
generation (2007: 325). They predict that between the years 2000 and 2020,
the baby boomer generation will increase the numbers of workers aged 55
and more, while those aged 35 and 54 would be categorised in the “no-
population-growth” era. Dychtwald and Baxter attribute the American brain
drain to older workers exiting the labour force and foresee about 35 million by
the year 2030 constituting an American shortfall in “young-enough” skills
(2007: 326). From an SCM perspective, older workers who retire take with
©© UUnniivveerrssiittyy ooff PPrreettoorriiaa

91
them the good relationships with business partners, suppliers and customers
which organisations relied on (Dychtwald & Baxter, 2007:326).
The solution to their own identified problem, according to Dychtwald and
Baxter (2007: 327), includes the following:
� Treat an aging workforce possibility as a business risk and forecast the
number of workers aging and retiring
� Be flexible in planning retirement packages
� Make sure company recruitment policy can accommodate older
employees
� Plan how to manage and motivate employees of all ages simultaneously
The Dychtwald and Baxter proposed solution to the aging workforce implies a
need to encourage and commit financial resources to continuous training for
all employees. This view is in contrast to a study by Patton and Pratt (2002:
480) whose focus groups discouraged management training to be made
available to managers near to retiring. Taking into account a potential training
program of 300 hours to be implemented over 2 years, they suggest that only
new or potential managers should be trained. In 2002, they were already
sensitive to the cost of training. Idaho State in the USA, offered one day of
training at $100 per day (about R800.00). Comparing costs in 2012, shows
that they have escalated since then and, even in the South African context,
the costs of training will be an issue to resolve before anyone will be trained
(Patton & Pratt, 2002: 481). The costs of training in South Africa average
about R5000 for 3 days, which is double that of R800.00 per day ten years
before.
The hypothesis deduced from the age variable is:
H70: There is no difference in the frequency of training requests between late-
career-stage employees (older than 45 years) and others
H7A: There is a difference in the frequency of training requests between late-
career-stage employees (older than 45 years) and others
©© UUnniivveerrssiittyy ooff PPrreettoorriiaa

92
The TNA research study by Guthrie and Schwoerer was based on answering
two research questions to determine the following:
� Does a direct relationship exist between career stage and the reported
need for training?
� Does employee career stage bear any relationship to training self-
efficacy, training utility (usefulness) and managerial support (Guthrie &
Schwoerer, 2001:60)?
The research study found that if the older generation (i.e. late-career-stage
employees) believe that they are less confident to pass courses, they declare
that they have no need for training courses. If older employees do not feel
supported by management on the subject of training, they may become
prematurely obsolete. (Guthrie & Schwoerer, 2001:60). It must be noted that
this study focused on “general management training”- not necessarily function
specific training as is the case in SCM (Guthrie & Schwoerer, 2001:61).
Possible research variables that originate from the Guthrie and Schwoerer
study include managerial support and training utility/usefulness. The current
research project is also cautioned not to have stereotypes about how capable
older people are when they are in training. Older employees are often
disadvantaged by being viewed by managers and trainers as being less
capable of learning. Older employees are also seen to be less desirable as
candidates for training according to Rosen and Jerdee (in Guthrie &
Schwoerer, 2001:60). Another caution regarding training utility when
conducting the South African SCM TNA, is that if employees are negative
towards training, they may under-report their training needs. In this sense
Another hypothesis that examined the response includes: H80: There is no significant difference in the willingness to attend training between
long-tenure employees (employed >10 years) in the same organisation and
new recruits.
H8 A: There is a significant difference in the willingness to attend training between
long-tenure employees (employed >10 years) in the same organisation and
new recruits.
©© UUnniivveerrssiittyy ooff PPrreettoorriiaa

93
older employees may experience less learning and prevent skills transfer to
the work environment
Perhaps in the context of the current global recession, workers may be
inclined to continue working beyond normal retirement age of 65. Not only do
human resources retire later in life; they are also living longer and need more
finance for their long term survival. Since chronological age alone is
conceptually inadequate to explain work experiences, (Guthrie & Schwoerer,
2001:60), previous work experience, not age will be more indicative of HR
chronology. However, age is the most common indicator of career stage.
The Guthrie and Schwoerer study involved 380 employees out of 715 public
sector employees in Midwestern USA. With a 53% response rate, they found
the average age to be 43 years. Employees were also employed for longer
than six years in their current positions. The researchers classified employees
aged 35 years and younger as being in the early career stage. The next
section classified 36-49 year olds as being in mid-career stage. Employees
above 50 years were considered late career stage (Guthrie & Schwoerer,
2001: 64).
The Guthrie and Schwoerer study is relevant since their questionnaire
contained 30 managerial skills items. These items were reduced in factor
analysis to basic management skills (13 items), with a Cronbach –Alpha (CA)
of 0.96. The second factor was termed HR management skills (12 items),
with CA of 0.96. Thirdly, they found the factor technical/communication skills
(5 items) and CA of 0.85. It is noteworthy that these three factors together
accounted for 69% of the variance in responses. One limitation of the Guthrie
and Schwoerer study is that respondents were drawn exclusively from the
public sector and this excluded the private sector respondents required for the
SCM TNA study (Guthrie & Schwoerer, 2001: 59).
The industry studies still stick to simplistic approaches to TNA as shown by
Gupta, et al. Any attempts to address the learning needs of managers or
other staff through training programs, must include identifying gaps in the
current versus desired conditions relating to knowledge and skills (Gupta, et
©© UUnniivveerrssiittyy ooff PPrreettoorriiaa

94
al. 2007:31). The pulse that measures knowledge and skills must be taken in
the following circumstances (Gupta, et al. 2007:79), all of which are highly
relevant to the current South African scenarios:
� when organisations undergo downsizing
� when existing training programs must be updated or revised
� when new business opportunities arise
� when jobs must be upgraded
� when new responsibilities must be assumed by people
3.5. CONCLUSION
This chapter delved into the concept of TNA by explaining that it is only the
first step in the training cycle. By investigating what skills, knowledge and
attributes an employee possesses, any gap can be identified to help them fill
job specifications. The older TNA models from the 1980s and 1990s were
briefly explained and the constrained areas of investigation for this research
study were restated. By questioning individuals themselves, TNA can find
motivations to attend/request training. It is however important to contextualize
these training needs within organisational cultures, structures and strategies.
Training needs can be expressed as the gap between the current state and
the desired state of employee ETD. It is necessary in the next chapter to
review which TNA studies have been conducted already within SCM, in order
to contribute to South African TNA.
©© UUnniivveerrssiittyy ooff PPrreettoorriiaa

95
CHAPTER FOUR SUPPLY CHAIN MANAGEMENT AND TRAINING
4.1. INTRODUCTION
4.2. SUPPLY CHAIN MANAGEMENT (SCM)
4.3. DEMAND FOR SCM TALENT IN CHANGING MARKETS
4.4. SOUTH AFRICAN SCM TRAINING NEEDS
4.5. FUTURE SCM RESEARCH TRENDS
4.6. CONCLUSION
©© UUnniivveerrssiittyy ooff PPrreettoorriiaa
96
4.1. INTRODUCTION
In the last 3 decades (1980-2010) supply chain management (SCM) had to
evolve from its narrow functional focus on purchasing, manufacturing and
logistics to become more process optimised. This means that organisations
had to learn to share information and collaborate with their business partners
for the current business environment (Rossetti & Dooley, 2010: 43 Gattorna,
2003:6).
The objective of the research study is to address the HR training needs for a
changing SCM environment. Before this can be done, the chapter has to
determine how SCM is defined by organisations. Their definition of SCM will
in turn affect how they utilise their scarce human resources. In due course, a
few SCM definitions are highlighted in this chapter. These definitions allude
to whether SCM principles or SCM processes are the main drivers in
response to change. The need to define SCM is currently important due to
the lack of consensus that exists between academic researchers and industry
practitioners.
In Figure 4.1 below, the traditional silo-based functional view of a supply chain
is drawn (Sherman, 2013: 55, Gattorna & Clarke, 2003: 632). Figure 4.1.
assumes that the main direction of flow is from left to right, by moving from
one business to the next in the chain link structure. This is intended to allow
value to be added by each link in the chain to ultimately serve the customers’
needs. Customers are made up of businesses, not individual members. Left
to right is also called “primary flow” or movement “downstream”. Customers
are located at the end of the supply chain, and receive goods and services in
a business-to-business contracted relationship. Mangan and Christopher
criticise this view since they require their supply chain view to include
relationship management between a wider network of customers and
suppliers, not merely a linked chain scenario (2005: 1).
©© UUnniivveerrssiittyy ooff PPrreettoorriiaa

97
Figure 4.1. The typical supply chain diagram
Source: Author’s original design
Figure 4.1 depicts the three traditional main flows that constitute a generic
supply chain. The three primary flows are generally accepted to include
products/services, information and payments. Information flow is captured on
the original source documents that accompany goods and services and that
are used by bookkeepers to write up monthly and annual financial statements
However, since 1961, the concept of SCM had been fleetingly introduced by
Forrester as information, manpower, capital equipment and materials that flow
and interact for the progress of industrial organisations (Giunipero, Hooker,
Joseph-Matthews, Yoon & Brudvig, 2008:67). This valuable insight about
SCM was forgotten between 1961 and 1981 and 20 years passed before it
reappeared as a formal term of SCM during the 1980s. Perhaps the following
overview of the SCM definition could help us to define SCM more clearly.
4.2. SUPPLY CHAIN MANAGEMENT (SCM)
This section will trace the origins of the supply chain concept, comment on
academic research written up about it and lead to how SCM links up with the
training research problem.
©© UUnniivveerrssiittyy ooff PPrreettoorriiaa
98
4.2.1. ORIGINS AND EVOLUTION OF SUPPLY CHAIN MANAGEMENT
It is thought that the term SCM, was introduced by business consultants
during the 1980s, but it was not widely used until the 1990s (Rossetti &
Dooley, 2010: 41, Lambert & Cooper, 2000:66). Different names existed
previously to explain the practice of SCM. For example it was linked to either
the areas of operations research or logistics. This implied that SCM was seen
as a manufacturing or a transportation concern.
Perhaps SCM does not have one definition since it does not qualify as a
regulated profession yet. Taken overall the SCM reviewed literature covering
the period between 2006 and 2011 supports the fact that SCM is not yet
singularly defined, nor regulated as a profession (Guinipero, et al., 2008:78,
Burgess, Singh & Koroglu, 2006: 703). Professionals such as accountants,
lawyers, architects or medical doctors do not experience the same vagueness
about the work that they do. These professions are characterised by strict
rules and regulations, codes of conduct and standards to adhere to. Industry
practitioners who work in marketing, material management, warehousing,
transport or manufacturing all have their distinct definition of SCM (Frazelle,
2002: 5). By having so many definitions, the practice of SCM amounts to
each functional business area speaking a different language while
simultaneously trying to have the same conversation.
Despite the SCM body of knowledge being about 30 years young, there is a
gap between academic research and business practice. On the one hand,
research in academic circles needs to be scientific and objective, otherwise it
is not rewarded with funding (Dess & Markoczy, 2008: 57). On the other
hand, while academics stress the analysis of SCM research, managers are
drowning in real-life complexity. This widens the gap between academia and
industrial practice, and the latter judges SCM academic research to be neither
practically useful nor relevant (Dess & Markoczy, 2008: 57).
©© UUnniivveerrssiittyy ooff PPrreettoorriiaa

99
Although the SCM definition from an influential industry association such as
the Council of Supply Chain Management Professionals (CSCMP) is quoted
in many literature reviews, it is still not to be regarded exclusively as the only
correct definition of SCM (Gibson, Mentzer & Cook, 2005:23). The CSCMP
definition posted on their website is as follows:
“Supply chain management encompasses the planning and
management of all activities involved in sourcing and procurement,
conversion, and all logistics management activities. Importantly, it
also includes coordination and collaboration with channel partners,
which can be suppliers, intermediaries, third party service providers,
and customers. In essence, supply chain management integrates
supply and demand management within and across companies.”
(Source: Council for Supply Chain Management Professionals)
Although SCM cannot currently be discussed in universally accepted
terminology, the literature published in academic journals still had to be
reviewed for commonality. SCM definitions and concepts, despite being
practically understood and workable, still lack even academic consensus!
The following sections reconsider some of the defining academic
conversations around SCM in the light of the international best practice way of
defining SCM. In Table 4.1, some SCM definitions are listed with their
sources. There is currently also no consensus amongst researchers about
which functions and processes to include as SCM perfect standards of
reference (Giunipero, et al., 2008:81).
©© UUnniivveerrssiittyy ooff PPrreettoorriiaa

100
Table 4.1. Various supply chain management definitions
Authors’ references
(in chronological order)
Supply chain management (SCM) definitions
Lambert & Cooper, (2000:
69), and quoted in
Guinipero, et al.,
(2008:81).
SCM is the flow of processes, information and goods from the
originating supplier to the terminating customers. SCM consists
of three interrelated elements namely the supply chain network
structure, business processes and management components.
Mentzer, DeWitt, Keebler,
Min, Nix, Smith & Zacharia
(2001:4)
SCM is the strategic and systematic business function and
tactics’ co-ordination within an organisation and across
organisations. In the structure of a supply chain (SC), the main
purpose will be to improve long-term performance of all firms
involved. A supply chain consists of three or more firms
involved in moving finance, information, products and services
both downstream and upstream from sources to and from
customers.
Chen & Paulraj, (2004,
134)
SCM places emphasis on all aspects of products and services
being delivered to customers.
Gibson, Mentzer & Cook
(2005: 19).
SCM is not portrayed consistently since some definitions focus
only on strategy while others focus on activities, processes or a
combination of strategy, activities and processes.
Christopher, M.
(2005:5)
SCM is managing upstream and downstream supplier and
customer relationships such that higher customer value is
created, but at less cost to the supply chain as a whole. In
1992, Christopher defined a SC as a network of organisations
that produce value (Mentzer, et al., 2001: 3, Christopher, 2005:
5).
Burgess, Singh and
Koroglu (2006:703)
SCM is multidisciplinary and must use the Lakatosian program
(core theory + other SCM theories) to expand the existing
theory base.
Guinipero, et al., (2008:
66)
SCM is a melting pot of purchasing, logistics, transport,
operations and information technology. It involves the
management of both materials and distribution.
Simchi-Levi, D., Kaminsky,
P. & Simchi-Levi, E.
(2008:1)
A set of approaches used to integrate suppliers, manufacturers
and warehouses to satisfy customers’ need for the right goods
and services, at the right price, delivered to the right locations
within the right time. This integration should minimise costs
efficiently.
Carter & Ellram (2009: 7) SCM consists of triadic, not mere dyadic business relationships.
Stock, Boyer, & Harmon, Since 1980s, the definition of SCM has changed many times
©© UUnniivveerrssiittyy ooff PPrreettoorriiaa

101
(2010: 32). but 166 selected articles define it in terms of three main themes,
which include SCM activities, benefits and constituent
components.
Rosetti & Dooley (2010:
40)
SCM has two job functions that include firstly being the
functional integrator and secondly also being the process
manager.
Source: Own compilation of individual source references.
The SCM definitions listed in Table 4.1. are briefly discussed in the following
paragraphs in a non-rigid chronological order. Mentzer, DeWitt, Keebler, Min,
Nix, Smith & Zacharia, (2001:4) claim that despite the fact that SCM became
popular to both practitioners and academics as a buzzword term, much
confusion exists regarding its meaning. Mentzer et al., state that the market
demanded error-free, fast delivery of quality products in a global context as
the new standard, and not as a competitive advantage. During the 1990s
when SCM grew in popularity, Mentzer et al., wanted to maintain a very
definite distinction between supply chain (SC) that existed in business (similar
to distribution channels) and the management of those supply chains (2001:
2). Mentzer et al., see that the possibility exists for any organisation to be part
of numerous supply chains (2001:4) and that supply chains can exist even if
no one is managing them!
4.2.2. SCM AS PHILOSOPHY
In the light of the confusion that surrounded the term SCM in the 1990s,
Mentzer et al., assert that three categories of SCM theories exist namely SCM
philosophy, the implementation of the management philosophy and a set of
management processes (2001:5). In the first category of SCM as a
management philosophy the following attributes apply:
� Approach the supply chain as a system where the total goods flow is
managed from supplier to end customer.
� Use strategies to integrate within and among firms’ operations
� Create unique sources of value to satisfy customers
©© UUnniivveerrssiittyy ooff PPrreettoorriiaa

102
In the second category of SCM defined by Mentzer et al., they underscore the
importance of implementation of the management philosophy. Mentzer et al.
say it can be done when combining all previous research into seven
meaningful SCM activities (2001: 8).
These activities are:
(a) integrated behaviour between firms’ customer needs and suppliers’
behaviour
(b) the mutual sharing of information between SC members
(c) the mutual sharing of risks/rewards
(d) cooperation between firms to complement and co-ordinate
(e) a common goal and focus in serving customers
(f) process integration
(g) building and keeping partner relations in the long term (Mentzer et al.,
2001: 8).
It is my view that Mentzer et al., are describing a futuristic utopia through
these activities. No matter how expertly their management philosophy tries to
manage their version of SCM, there are usually many contractual obligations
that would be necessary to underline integration, co-operation and especially
mutual risk responsibility.
In the third category of their understanding of SCM, Mentzer et al., discuss a
set of management processes. They move the focus away from the
aforementioned SCM activities that take place. Mentzer et al encourage all
participants to synchronise their activities according to specific times and
places, making clear where the start, finish, inputs and outputs are (Mentzer
et al., 2001: 10). This implies that functions of SCM should be re-organised
into a set of processes in order to satisfy relevant customers. For example,
the functions that deal with the order fulfilment process must enhance the
customer relationship management (CRM) process. In this way, Mentzer et
al., conclude SCM can be understood not only as a philosophy but as
something that requires action to be practiced successfully. They believe this
sheds more light on the previously confused definition of SCM.
©© UUnniivveerrssiittyy ooff PPrreettoorriiaa

103
Four years later, Mentzer would team up with two different authors and reflect
in retrospect that previous authors had tried to define two distinct concepts
with one SCM definition (Gibson, Mentzer & Cook, 2005:23, Mentzer et al.,
2001: 11). Together with Gibson and Cook, Mentzer concluded that the
Mentzer et al., 2001 SCM category of management philosophy, should rather
be termed supply chain orientation (SCO) and that the category of
implementation of the set of business processes should be known as SCM.
Organisations wanting to implement SCM should first have an SCO. Also, an
organisation with SCO by itself cannot implement SCM unless many firms in
the same SC are co-ordinated and united in their strategies. These two
concepts SCO and SCM should have antecedent trust and commitment for
example, or else they cannot eventually have successful consequences of
lowering overall costs or improving customer service. According to Mentzer et
al., in 2001, they defined SCM as listed in Table 4.1 above (2001:18), but in
2005, the new trio insist that academia and practitioners should both continue
to play a role in evolving the SCM definition towards consensus. (Gibson, et
al., 2005:22).
4.2.3. ACADEMICS’ AND INDUSTRY’S SEARCH FOR THE SCM
DEFINITION
The gaps in the SCM definition and knowledge base motivated the Burgess,
Singh and Koroglu study to use the 10000 articles in the ABI/INFORM
electronic platform database. Burgess, Singh and Koroglu narrow articles
down to include only peer-reviewed ones and then randomly selected 100
usable articles. For 90 % confidence, they needed only 61, but instead used
100 to diminish the Type II statistical error (Burgess, et al., 2006: 705). The
definition of SCM still proved elusive and was complicated by the many
researcher backgrounds found by Burgess, et al. (2006: 715). The
recommendations made by Burgess, et al., include that SCM should be
referred to as a network, not merely a chain of business partners (Burgess, et
al., 2006: 716, Christopher, 2005: 5). They also recommend that social
©© UUnniivveerrssiittyy ooff PPrreettoorriiaa
104
aspects such as trust and collaboration have been neglected, which would
indicate a need for more psycho-sociological research (Burgess, et al.,
2006:716).
Burgess, et al., think that original theories of SCM do not yet exist, since
competitive advantage and cost economics appeared to dominate prior
research (Burgess, et al., 2006: 717). Although SCM is multidisciplinary, they
found that experimental and mixed methods of research are lacking.
Therefore Burgess, et al., (2006: 719) call for a research program in SCM, not
an SCM theory only. This would take future research efforts back to the 1974
Lakatos program where the core SCM theory is surrounded by other theories
in a belt of shifts in SCM knowledge and research methodologies (Burgess, et
al., 2006:720). It is hoped that a new future research program approach may
also enhance the narrow views of SCM beyond those of operations
management and consumer goods (Burgess, et al., 2006:721).
In my opinion the study by Burgess, et al., had already criticised other
authors’ research methods and focus areas successfully. In the light of the
modern millennium dilemmas of ethics and corruption, it would take many
more decades of research to investigate trust and collaboration in SCM.
Although people would be the subjects of the research direction proposed by
Burgess, et al., it is my view that people’s decisions cannot be removed from
either from their contextual circumstances or prevailing business conditions.
As a result, I do not anticipate major changes in SCM literature any time soon.
Guinipero, Hooker, Joseph-Matthews, Yoon and Brudvig describe SCM as a
melting pot of functions and disciplines but note that existing research
investigates mainly one link in the supply chain (2008: 66). Guinipero et al.,
comment that SCM literature reviews have thus far been fragmented and
found them either purely descriptive or normative (2008: 67). The three-part
goal of their research yielded firstly, a summary of previous SCM studies,
©© UUnniivveerrssiittyy ooff PPrreettoorriiaa

105
secondly gap identification for future analyses and thirdly some futuristic
research recommendations (Guinipero et al., 2008:67).
By using nine academic journals Guinipero et al., divided 405 articles into
subjects for content analysis. The nine journals were, in no particular order:
� The Journal of Supply Chain Management
� International Journal of Physical Distribution and Logistics
Management
� Journal of Operations Management
� International Journal of Logistics Management
� Journal of Business Logistics
� International Journal of Operations and Production Management
� Industrial Marketing Management
� Management Science
� The Decision Sciences Journal
From these nine journals Guinipero, et al., systematically review and
briefly critique other preceding authors’ SCM research (2008:67-69).
The Guinipero, et al. critique is meant to illustrate how far the SCM literature
has come since its tentative beginnings by specifically commenting on the
research methods used. For example, Guinipero, et al. reviewed the efforts of
Rungtusanatham, Choi, Hollingworth, Wu and Forza who used six operations
management journals to analyse 285 survey articles. In 2003,
Rungtusanatham, et al., discovered that research units of analyses, measures
of reliability and validity were not present in many studies.
When Guinipero, et al., reviewed the work done by Carter and Ellram during
2003, they found mail surveys for exploratory and descriptive research to be
often used. Although means testing, factor analysis and regression were
done, hypothesis testing was infrequent. Carter and Ellram, however,
confined themselves to 774 articles found in the Journal of Supply Chain
Management, published in the 35 year period between 1965 and 1999.
©© UUnniivveerrssiittyy ooff PPrreettoorriiaa

106
Guinipero, et al., noted that the Journal of Supply Chain Management
published more SCM articles after 1990, which are fortunately included in the
1980 to 2000 time period they had investigated. Following up on their own
research from 2003, Carter and Ellram became the editors of the Journal of
Supply Chain Management. By using a literature review process to map
future research approaches, together with Kaufmann in 2008, Carter and
Ellram stressed the need for SCM research to have managerial relevance
(Carter, Ellram & Kaufmann, 2008: 7). The Carter et al. recommendations for
future research are highlighted in the section on future SCM research trends,
which follows towards the end of this chapter.
Through their own research effort, Guinipero, et al., tried to overcome any
shortcomings from past studies. They noted that in the literature they studied,
previous units of analyses consisted of either surveys of, or interviews with
respondents. They record that currently SCM must be studied as an
accepted part of central corporate strategic planning (Guinipero, et al.,
2008:70). They found that SCM strategy, frameworks for trends and business
relationships are the three top areas in which research has lately been
published. The Guinipero, et al., (2008:76) future research recommendations
include a further division of the partner relationships section into arm’s length,
transactional and integrative types of business relationships. They concluded
this by stating that power, risk and commitment may vary between business
partners.
Guinipero, et al., (2008:78) opine further that past research methodology used
only basic data analyses such as description, testing means, analysing
content and correlations. They suggest that future data analyses should
include factor analysis, analysis of variance, the modelling of structural
equations plus cluster analysis (Guinipero, et al., 2008:78). Unexpectedly, the
call is also made for social network analysis to be conducted when
researchers and practitioners attempt to answer more complex research
questions in future (Guinipero, et al., 2008:79).
©© UUnniivveerrssiittyy ooff PPrreettoorriiaa

107
Besides the need to evolve their traditional SCM focus, the changing business
environment also necessitated SCM growth. This entailed growing beyond
traditional business practice such as shown in the linked chain in Figure 4.1.
This change was influenced by technological advancement in SCM and the
drive to increase global competitiveness. The business environment
experienced lower costs of production and reduced product life cycles. The
latter was in part due to mass customisation prompted by more demanding
customers. Businesses were also subjected to more pressure to survive
since a virtual world made demand and supply information travel much faster
than before (Gattorna, 2003:6). Organisations who did not adopt the
technological integration with business partners slowed themselves down as
the market environment changed (Gattorna, 2003: 7).
The complexity of research questions is probably dependent on the
complexity of the SCM definition in the first instance. Simchi-Levi, Kaminsky
and Simchi-Levi (2008:1) define SCM as a set of approaches used to
integrate suppliers, manufacturers and warehouses to satisfy customers. The
latter need the right goods and services, at the right price, delivered to the
right locations, within the right time. This integration should minimise costs
efficiently which concurs with the costs theory postulated by Carter, Ellram
and Kaufmann (2008:5). Since 1989 the CSCMP has compared the total
costs of logistics and inventory as a percentage of the United States gross
domestic product, to determine whether costs are efficient (Simchi-Levi, et al,
2008:7). This encouraged other researchers to track costs as a performance
indicator in the SCM field, in the light of the integrated view of SCM as defined
by Simchi-Levi, et al. (2008:7).
In another qualitative study, Stock, Boyer and Harmon agreed on three main
SCM themes as a definition. They identified the themes from the qualitative
analyses of the ABI/INFORM electronic platform database research articles
(2010:32). Amidst thousands of articles and books sifted, the three common
themes were derived through the authors’ content analysis of the 166
©© UUnniivveerrssiittyy ooff PPrreettoorriiaa

108
uniquely defined SCM articles (Stock, et al., 2010:33). Stock, et al., included
SCM activities, benefits and constituent components as their three common
themes of a SCM definition (2010: 35). The authors see activities firstly, as
including the two-directional flow of goods/services and information. This two-
way flow is based on internal and external relationships between members of
the same supply chain. Secondly, SCM benefits are the results of correctly
implemented SC strategies. Benefits derived from the SCM implementation
include value being added to products and services. This has a spin-off effect
of creating efficiencies from limited resources and increasing customer
satisfaction as the ultimate benefit of SCM (Stock, et al., 2010:34).
The third theme, constituent components, cannot be left out since any supply
chain consists of business functions that constitute part of business partners’
systems and operations (Stock, et al., 2010: 35). By and large, the Stock, et
al., meta-analysis appears to be a synopsis of every aspect that is involved in
SCM. However, they do not perceive their research to have been conclusive.
Judging from their research findings, Stock et al., recommend a variety of
future research areas derived from the three common themes they arrived at.
One of their main recommendations is for future research questions to find out
which services, if implemented successfully, add more to SCM success than
others (Stock et al., 2010: 35). Another main recommendation will be
discussed together with that of Rossetti and Dooley, which follows.
The Stock, et al., authors used a qualitative software program named NVivo,
to search through the ABI/INFORM electronic platform database for unique
SCM definitions published between 1980 and 2004. A similar form of
electronic content analysis was also followed in the research study by
Rossetti and Dooley, who investigated 546 SCM job descriptions in seven
months of 2007, in order to understand SCM better (2010:44). Rossetti and
Dooley concluded with three main job categories, which are sourcing,
operations consulting and information management. This is similar to the
third theme put forward by Stock, et al., where SCM is defined in terms of
constituent components such as systems and operations (Stock, et al., 2010:
35).
©© UUnniivveerrssiittyy ooff PPrreettoorriiaa
109
Rossetti and Dooley further summarise their findings as a dual definition of
SCM where a business organisation is either functional integration focused or
process improvement focused (Rossetti & Dooley, 2010: 44). The emphasis
they placed on job descriptions led them to believe that supply chains
constantly evolve and that an SCM job description differs from one business
partner to the next. They warn future researchers never to address research
instruments to particular job titles since SCM jobs are neither defined nor
constant in practice (Rossetti & Dooley, 2010: 53).
The Stock et al., study further found that so-called strategic partnerships or
alliances amongst business partners consisted of research done between
only two business partners. They therefore warn that for future SCM research
to be valid, business relationships should be seen as a network of more than
two partners (Rossetti & Dooley, 2010: 53, Stock et al., 2010: 35).
Researchers Rossetti, Dooley and Stock et al., all recommend that activities
between multiple business partners should be examined in future studies as
well (Rossetti & Dooley, 2010: 53, Stock et al., 2010: 35). This request for
multiplicity concurs with Carter and Ellram who asserted that triadic, in
preference to dyadic business relationships should be included in future
research (2009:6). This was also previously mentioned by Guinipero, et al.
(2008: 73), who noted that supply chain networks, not the relationships
between a few partners, should be studied. The Guinipero, et al, levels of
analysis were in ascending order: the one firm level, the dyadic level, the
chain level and the network level (Guinipero, et al, 2008: 73). They do
acknowledge that the network level of analysis is challenging to most
researchers who are constrained by time and funding at any given time
(Guinipero, et al: 2008: 73).
In summary of this section, we confirm that most authors agree that there is
no consensus on the SCM definition amongst academia and practitioners.
They do however agree that business organisations should offer their
customers benefits in exchange for products, services and information
required in a complex market environment. More than two business entities
©© UUnniivveerrssiittyy ooff PPrreettoorriiaa

110
must be acknowledged from a networked supply chain, in order for results to
be more meaningful in future. While SCM can have a philosophical supply
chain orientation, on the hand, it must be practically implemented through
business processes and activities. Furthermore since the SCM arena is
constantly evolving, researchers should not be rigid in their job descriptions.
Under no circumstances should anyone claim that any SCM definition is the
only usable and correct one.
In conclusion: the research studies discussed thus far, focus only on the
definition of SCM and the research studies that took place whilst the SCM
definition was still in a state of flux. The next part of the discussion takes into
account how SCM itself has grown along with socio-economic and industrial
practice changes.
Since SCM consists of people running business organisations, the next
specific area for investigation zooms in on HR skills and abilities, which they
apply with a view to the success of their employers. The following section on
demand for SCM talent also delineates the South African environment in
relation to the rest of the world in order to place the human resources (HR)
training needs into context.
Although Table 4.1. highlighted some viewpoints on SCM, the
definition that will be used for this research project will be the
expanded conclusion of some of the preceding views.
For the purposes of this research study SCM is defined as a
network of business partners interdependent on strategically
related activities and processes to serve customer needs.
©© UUnniivveerrssiittyy ooff PPrreettoorriiaa

111
4.3. DEMAND FOR SCM TALENT IN CHANGING MARKETS
This section summarises the findings of research related to the demand and
supply of SCM talent. Employers need human resources (HR) on the
demand side of the economy. The human resources with related skills are
provided by labour and this constitutes the supply side of the economy. The
discrepancy or gap between the numbers of HR members required and
provided, can be labelled a skills surplus (supply >demand) or a skills
shortage (demand > supply).
Table 4.2. briefly lists the authors who will be discussed in this section on
demand for HR in SCM in chronological order.
Table 4.2. Brief findings about the demand for human resources in supply chain management Author(s) and year
of publication
Main finding(s)
Frazelle (2002: 3) Supply side lacking: the employed human resources do not have the
necessary SCM skills and yet management has to train staff in order
to retain them.
Melnyk & Sandor
(2008:6)
Supply side lacking: the lack of talent hinders post 2010 SC success
Othman & Ghani
(2008:260)
Demand side lacking: SC partners need to develop similar HR
practices if they need to respond to market requirements in a
collaborative effort.
Aquino & Draper
(2008: 13)
The demand from industry is for university graduates to be
generalists, who can be trained into specialists as needed. If
university and professional training programs cannot incorporate
industry needs in their curricula, leaders in SCM may need to self-
train or pay for subject specific expertise.
Dischinger, Little &
Kellso (2008: 21)
The gap lies in articulating the supply chain requirements more
clearly by finding common descriptors for the SC and the skills
required. Thereafter the human resources can be trained according
to the skills level requirements.
La Londe & Ginter,
(2009:30)
List the top five challenges that were identified by the logistics and
SC executives for the 2009 research study. Main challenge is to lay
off staff in recession with no detriment to their own demand. Thus
labour supply > demand.
©© UUnniivveerrssiittyy ooff PPrreettoorriiaa
112
Source: Original summary of referenced authors
In 2002, Frazelle highlighted the point that SCM was sourcing human
resources across many disciplines but that only a small percentage of those
employed in these industries actually had formal training. Frazelle observed
this phenomenon as early as in 2002 namely that SCM staff was in high
demand. This was shown by regular staff turnover. Frazelle thought that high
performing HR could only be retained by further skills development and the
organisation’s investment in staff education (Frazelle, 2002: 343). This need
for skills development existed against a backdrop of growing industry
complexities. Business organisations needed tools, technology and training
to keep up with the changing complexity and skills demands (Frazelle, 2002:
3). This brings us to the issue of unmet skills required in SCM.
4.3.1. THE CHALLENGES OF UNMET SKILLS IN SCM
Between September 2006 and October 2007 Melnyck and Sandor tried to
identify the obstacles facing supply chain organisations in order for them to be
successful beyond the year 2010. The study found that the major obstacle
facing modern day organisations is lack of talent management and leadership.
This hinders organisations’ efforts to prepare for the requirements of the
future supply chains (Melnyck & Sandor, 2008: 6). They used two American
and one European site to compare industrial and academic respondents’
views through three workshop locations. Melnyck and Sandor complain that
currently, the managers produced by universities, colleges and professional
societies are primarily functional in training and tactical in execution. They
say that organisations need managers with a cross-functional orientation, who
can be integrative in perspective and strategic in orientation. The problem is
that there is no supply of such managers readily available. Melnyck and
Sandor argue that in order to make the most effective use of the new supply
chains, the right type of managers must be found (2008: 6). Finding the right
managers includes the need for SC partners to develop similar HR practices if
©© UUnniivveerrssiittyy ooff PPrreettoorriiaa

113
they need to respond to market requirements in a collaborative effort (Othman
& Ghani, 2008:260).
In a study succeeding the research done by Melnyck and Sandor (Melnyck &
Sandor, 2008:6), the American Ohio State University, conducted the 2009
annual Survey of Career Patterns in Logistics. Two researchers, La Londe
and Ginter, undertook this survey of career patterns after the 2008 global
economic meltdown. During the 2008 to 2009 global recession many skilled
and semi-skilled HR were facing retrenchment all over the world. The La
Londe and Ginter research survey sample size of logistics and supply chain
executives consisted of 2265 e-mails that were sent out and yielded a 5,5%
response rate. Of the 124 respondents 84,6% were male and 15, 6% were
female, which closely resembles the likely scenario for the male-dominated
SA market. Most of the respondents were between the ages of 50 and 55
years of age, although the common age range for logistics and SC executives
is around 45 and 49 years of age (La Londe & Ginter, 2009: 6).
The largest section of the La Londe and Ginter respondents (31%) came from
the food and consumer packaged goods category. The retail and wholesale
category was next with 14%, followed by the industrial/electronic and
mechanical category at 11%. The popular 2009 SC slogan was to be “lean
and green” although the green initiatives were slowing down. The 2009 study
highlighted that one of the main challenges were still to forecast product
demand better. This challenge was compounded by the reality of having too
many forecasts to choose from, which is normal during recession times (La
Londe & Ginter, 2009: 30).
According to La Londe and Ginter, the top five challenges that were identified
by the logistics and SC executives for the 2009 research study were:
Challenge 1= firms need to manage the global SC structures while
simultaneously making serious changes to their operations.
Challenge 2 = managers had to reduce inventory without negative impact to
customer requests and also decrease labour without lessening their
organisations’ most important skills bases.
©© UUnniivveerrssiittyy ooff PPrreettoorriiaa

114
Challenge 3 = managers were faced with contradictions because they had to
plan as if the markets were deteriorating yet also position their
businesses as if they were experiencing an improvement in the market
environments.
Challenge 4 = managers had to attempt to redesign operational processes
and restructure their entire supply chain structures at the same time.
Challenge 5 = managers still had to provide for their firms’ cash flow
requirements while trying to act on the listed 4 challenges.
La Londe & Ginter (2009: 31) agree that each industry faces different
challenges and will respond to forecasts and opinions as required. They note
that the top five challenges all point to the extremes of supply chains and
economic uncertainties. For 2009 it presented difficult decisions for managers
to make regarding the staff complement that they required then versus their
future training needs.
In 2008, another study also tried to predict what skills would be required in
supply chains in 2010. This research study was done by AMR Research and
the American Supply Chain Council (SCC). They probed respondents
amongst director level practitioners (Aquino & Draper, 2008: 2). What made
this research study different was that 91% of the respondents were hired by
their organisations only in the preceding year. The respondent large
organisations had more than 10000 employees (52% of the respondents) and
more than $5 billion annual revenue (49% of the respondents). The 287
respondents’ view on skills demanded versus skills available in the year 2010
are summarised in Figure 4.2.
©© UUnniivveerrssiittyy ooff PPrreettoorriiaa

115
Figure 4.2. Results from the 2008 AMR study on SC skills available
versus those prioritised in 2010.
Source: Adapted from AMR research by Bridget McCrea (in Aquino & Draper,
2008: 13)
In Figure 4.2. the basic and intermediate skills being “sought after” but that
are “not available” include the skills required in corporate governance and
post-sales support (This is designated Quadrant one). The advanced and
leadership or strategic skills being “sought after” but that are scarce, include
those required for strategy and change management, customer management
and technology enabling (Quadrant 2). Since these are the views of director
levels and above, their emphasis is also expected to be on higher-level skills
(Aquino & Draper, 2008: 2). Quadrants three and four are in a happy state
where skills sought can be filled, by the market. A key finding from this survey
is that half of the 287 respondents believe that they can recruit staff with no
particular speciality and train them to reach the required skill levels. The
SKILLS DEMAND MAP
SKILLS SOUGHT VERSUS SKILLS AVAILABLE
Quadrant 3
Performance Measurement *
& Analytics New product *
Quadrant 4 *Source *Deliver *Plan
Make*
Quadrant 1
Governance* *Post Sales Support
Quadrant 2 *Strategy *Customer & change Management Management Quadrant 4 *Technology Management
SKILLS SOUGHT
SKILLS AVAIL.
Has VERY FEW of the Skills
Have SOME skills
Has ALL skills
©© UUnniivveerrssiittyy ooff PPrreettoorriiaa
116
demand from industry is for university graduates to be generalists, who can
be trained into specialists as needed (Aquino & Draper, 2008: 13). Also,
industry could use higher-level understanding where potential employees see
their functions as integrating into interdependent SC elements (Aquino &
Draper, 2008: 13).
In 2008, Dischinger, Little and Kellso would firstly ask whether companies are
clearly articulating the skills they demand in order for their supply chain
programs to be adapted to world market requirements. Secondly, they
questioned whether universities are responding effectively to the need to
match the demand and supply of supply chain talent and skills. If both
questions could not be answered, they introduce a third question whether SC
associations should not be actively involved in letting other partners
collaborate in the process of skills development (2008:4). Dischinger et al.
were commenting on the research done by Aquino and Draper and presented
their findings at the 2008 conference in Denver, Colorado. Since American
businesses use professional recruitment agencies to find executive level
recruits, it is logical that Dischinger, et al. are not expecting universities to
adapt their training programs drastically, nor are they placing responsibilities
on the professional SC associations to find the skills required (Dischinger, et
al., 2008: 21).
The conclusion drawn from the three questions that Dischinger et al., asked is
that their first question remained unresolved. The gap for Dischinger, et al.,
lies in articulating the SC requirements more clearly by finding common
descriptors for the SC and the skills required (2008:21). This concurs with the
Aquino and Draper (2008: 2) attempt to develop a common SC talent attribute
model between academia and business organisations. If university and
professional training programs cannot transpose industry needs into their
curricula, leaders in SC may need to self-train or pay for subject specific
expertise. This also requires leading organisations to integrate SC talent and
performance management with HR initiatives (Aquino & Draper, 2008: 19).
©© UUnniivveerrssiittyy ooff PPrreettoorriiaa

117
This conundrum of universities training enough skilled graduates versus
whether it is the business organisations’ responsibility to train enough SC
staffers, will not be resolved overnight. The following section discusses the
effect of HR training and skills in SCM.
To summarise: the main points to be derived from the issue of demand and
supply in SCM talent is that specific market characteristics influence demand
and supply. Recession may cause supply to exceed the talent demanded by
industries. Similarly a lack of training and/or training of the wrong skills set for
managers may cause the talent supplied to be less suited to what is
demanded. An encouraging thought is that generalist skills are in demand in
order to be trained in becoming SCM specialists. More HR training and SCM
skills research literature will be highlighted in the following section.
4.3.2. WOMEN AND SKILLS DEVELOPMENT IN SCM
In the next section the influence that HR training can have on the skills
demand will be investigated from secondary sources. A current view is that
HR training can affect the competitive survival of business organisations.
Gattorna asserts that the future requires competing supply chains to source
and obtain completely new capabilities to stay competitive and that talent
(HR) will be at a premium (Gattorna, 2006: 6). Since many industry types
demonstrated a collective need for skilled SCM staff, the demand for SCM
training itself becomes a derived demand. This means that the need for SCM
training is dependent on the SCM skills’ demand.
The CSCMP believes that training program content must be updated routinely
but must correlate to the strategic objectives of the organisation. They urge
that widespread access to both training and training information is necessary.
The results of three separate annual (2007, 2009, 2012) surveys done by the
CSCMP will be discussed in the subsequent paragraphs.
©© UUnniivveerrssiittyy ooff PPrreettoorriiaa

118
This proposed research study was based on the premise that training should
not be conducted without having a background of the HR needs already in
existence. For this reason, a study that identifies the changing needs of the
female half of the labour force is worth noting. The recurrent survey being
conducted by the Council for Supply Chain Management Professionals
(CSCMP) focuses on the career patterns of executive level women in
logistics. Some of the 2007 career patterns of women in logistics findings will
be discussed first, before more general research studies will be reviewed in
this section.
The eleventh annual survey done by the CSCMP focused on the career
patterns of women in logistics. Cooper, Santosa and Burgos-Dominguez
focused on six research questions for the year 2007. Their methodology
involved sending out questionnaires to 873 listings from the year 2007
membership of the CSCMP. They also e-mailed 466 out of 1301 non-
members, which is not their usual practice. In order to increase the sample
size they included 896 from 1055 past members. The outcome of this was
that undeliverable e-mail reduced the sample from 2235 to 2037, of which 234
responses were usable. This equates to an 11.5% response rate for the year
2007 study. The authors point out that the results of this study should not be
generalized to all women in the general practice of logistics (Cooper, Santosa
& Burgos-Dominguez, 2007: 2).
The demographics of the all-female respondents in the 2007 study were:
� Women ranging in age range of between 35 and 51 years (about 79%
of the sample)
� Those who are younger than 30 are only 6% and those over 50 are
about 15%
� Their marital status indicates that 65% of the respondents are married,
18% are single and 17 are divorced
� Their levels of education show that the greater percentage (40%) have
only an undergraduate degree, while 38% have a graduate degree
©© UUnniivveerrssiittyy ooff PPrreettoorriiaa

119
(mostly an MBA degree) and additional certification applies to 8% of
the respondents
The 2007 CSCMP study cannot be generalized to the South African context
since the demographics of the South African study are different.
Table 4.3. summarises the 2007 findings based on the following six recurring
research questions:
� What are the respondent demographics of the logistics executives?
� Describe the work environment of the respondents.
� What are their career patterns?
� What are their attitudes and perspectives?
� What is the role of mentoring in their careers?
� What views do the women have on globalisation?
Table 4.3. Brief findings about the 2007 CSCMP Career patterns of
women in logistics study.
Authors: Cooper, Santosa and Burgos-Dominguez
Main findings of the 2007career patterns study
Demographics Used 234 response out of 2037 sample size
About 79% of the women’s ages ranged from 31 to 52 years
and 65% of respondents were married. Education levels were
at undergraduate level (40%), graduate degrees (38%) and
additional qualifications (8%).
Work environments: Managers (35%), directors (21%) and vice-presidents (21%)
with either direct/advisory responsibilities in logistics or both
Career Patterns: Participative management styles, where leading and building
consensus prevails.
Perspectives: 90% felt that career prospects were better than ever before.
©© UUnniivveerrssiittyy ooff PPrreettoorriiaa

120
Mentors: Provided guidance, support, advice, moral support,
constructive criticism, insight into politics, networking and job
hunting assistance.
Globalisation Since their supply chain partners were global, cultural
understanding was seen as key to success, besides
relationship and strategic management.
My conclusion: the 2007 career patterns of women in logistics study yielded no major
HR training requirements for the future success of the executive women in logistics.
Source: Adapted from Cooper, Santosa and Burgos-Dominguez (2007: 2-6)
Since the CSCMP study is an annual recurrence, I wished to skip a year in
order to detect changes in the focus of the research questions or the supply
chain environments more easily. This decision is supported by the results of
the study the year immediately following the 2008 recession, where we saw
the skills gaps and job insecurity starting to feature. The 2009 questions
focused on career expectations and perceived knowledge and skills gaps.
The 2009 study was a special edition and therefore did not use the 6 research
questions from the 2007 study. The 2009 research contained two enquiries
where one was about retirement views and the other question was about skills
gaps.
While the demographic profile did not alter radically, their job titles and
retirement views differed. More junior staff expected to retire before the age of
55, whilst only 19% of vice-presidents agreed with them. The mean
perspective was that they could potentially lose their jobs while about a third
felt there was a realistic chance of being fired/retrenched.
Cooper, Santosa, Coley and Hurst conducted the 2009 CSCMP logistics
study. While the CSCMP 2007 study investigated six research questions, the
2009 career patterns of women study investigated three main themes. The
©© UUnniivveerrssiittyy ooff PPrreettoorriiaa

121
first two 2009 themes attempted to determine the retirement age and ultimate
positional title that women expect in their careers. The 2009 study’s third
theme included questioning women on whether they were sure of job security
in recession. The responses for ideal retirement age were inconsistent and
ranged from “hoping to retire” before the age of 55 (idealistically) and “hoping
to retire” at the age of 65 (realistically). The issue of age is applicable to the
South African study since the literature reviewed was inconclusive on the
status and behavior of the aging working population.
The 2009 CSCMP logistics study’s second theme dealt with business-related
titles and hierarchical positions and is not directly relevant to the South African
study. However, the 2009 CSCMP study yielded valuable findings of key
skills and knowledge gaps that respondents think are required for leaders and
managers in SC today (Cooper, et al., 2009: 7). The 2009 CSMCP women
perceived that the key skills and knowledge gaps for managers include (in no
particular order):
� Developing skills specific to SC such as SC metrics, is necessary.
� Leading, managing and forming teams with others are necessary
business practices
� Professional development by having a mentor, for instance, is
important.
� Dealing with discrimination (by males) and to work across cultures
must be addressed.
� Important elements currently missing are the need to develop integrity
and to stay in a job long enough to learn.
� Managing both individuals and the big picture beyond silos, is
important.
The only finding from the 2009 CSCMP study that has a direct link to this
South African study, is investigating whether women experience gender
discrimination by males or not.
©© UUnniivveerrssiittyy ooff PPrreettoorriiaa

122
The 2009 CSCMP career patterns of women in logistics study is relevant
since it highlighted some of the respondents’ personal knowledge and skills
gaps (Cooper, et al., 2009: 8). The 2009 CSCMP study reinforced the need
to include respondents from both management levels and ordinary workers’
levels in the research methodology of the 2011 SA research project. The
personal training challenges or gaps from the 2009 CSCMP study include (in
no particular order):
� Respondents struggle to remain up to date since they are being
constrained by an education and training budget that is small or non-
existent.
� Women think that they need to develop more strategic thinking.
� Women claim they are unable to make rapid adjustments to leadership
and other changes.
� Women state that they do not have nearly enough knowledge about
international shipping practices.
� Women find there a deficiency in the provision of skills around logistics
and SCM.
� Women also find, themselves, to be in need of knowledge about
finance, profits and losses.
� There is a challenge to keep up to date, in the face of insufficient
exposure to information technologies.
� There is a need for formal education, degrees, SCM-specific and
foreign language education.
� Mentoring and coaching in personal development are urgent
requirements.
From the gender related SCM studies, the following hypothesis is again reinforced for
inclusion in the empirical research project:
H60: There is no gender-based difference in the perception that female employees
receive more training than males
H6 A: There is a gender-based difference in the perception that female employees
receive more training than males
©© UUnniivveerrssiittyy ooff PPrreettoorriiaa

123
� Women need men to support women in obtaining the job that they are
qualified for, instead of running into boys’ club resistance in the
workplace. A comparison between the 2007 study and current
conditions seemingly showed no change in this finding.
In conclusion, the 2009 CSCMP career patterns of women in logistics study
remained optimistic about the future of women in logistics (Cooper, et al.,
2009: 9).
The summary in Table 4.4. must be interpreted in the context of the global
recession and in the light of the additional challenge of an aging American
workforce. Note that, according to Table 4.4 women executives first
responded to general leadership issues before addressing their own personal
skills gaps.
Table 4.4. Summary of knowledge and skills gaps highlighted in the
2009 CSCMP career patterns of women in logistics study.
Lack of understanding regarding world trade economics, changing technology and planning
for HR challenges.
Lack of international experience, and insufficient knowledge about international and local
trade policies.
Lack of Masters in Business Administration (MBA) level of qualifications or graduate studies
for leaders in SCM.
Lack of leadership skills that include emotional intelligence soft skills, collaboration and
speaking languages other than English.
Lack of additional development in mentoring skills and networking skills.
Lack of workplace cultural changes to build more relationships across cultures and gender.
Lack of developing in-depth talent, across functions and of integrity.
Lack of understanding of big picture view on the entire supply chain.
Source: Adapted from Cooper, Santosa, Coley & Hurst (2009:7)
Personal skills gaps that were identified in the 2009 study showed that :
� formal education, including management and supply chain specific
education, was needed.
©© UUnniivveerrssiittyy ooff PPrreettoorriiaa

124
� there were gaps in Information technology, systems and software
� accounting, finance, profit-and-loss knowledge was needed
� supply chain business functions such as marketing and transport, were
lacking
� knowledge of international logistics and SC was required
� strategic leadership skills in order to respond to emerging trends were
lacking
� management development was curtailed due to limited or unavailable
training budgets
A review of the above studies indicates that skills development became
important in the light of serious job market insecurity and aging and other
related changes. Both organisational learning and personal skills
development requirements presented themselves as needs in the 2009 career
patterns for women in logistics study. The SCM research thus influenced the
design of the research project through the hypotheses formulated below. The
2009 findings called for the gaps in both functional skills and emotional
quotient soft skills to be addressed, as in Table 4.4.
H10: There is no significant difference in the training received by managers and
employees in the preceding 12 months
H1A: There is a significant difference in training received by managers and employees
in the preceding 12 months
H20: There is no significant difference in the format of training preferred by
managers compared to employees.
H2A: There is a significant difference in the format of training preferred by
managers compared to employees.
H30: There is no significant difference in the reasons motivating employees to attend
training
H3A: There is a significant difference in the reasons motivating employees to attend
training
©© UUnniivveerrssiittyy ooff PPrreettoorriiaa

125
Considering that women make up half the population in most countries, their
education and the views they have about skills development and training are
indicative that training needs analyses are important enough in logistics and
SCM.
The variables that were tested in both hypotheses 3 and 4, will be delineated
in chapter five. Chapter five will expound on the research design and
methodology in finer details.
In order to plan for future requirements, the 16th career patterns of women in
logistics study took place in 2012 and is summarised in the same format as
the 2007 study in Table 4.5. Although these findings are presented here; they
were too late for inclusion in the 2011 training needs analyses research
project, which is the focus of this thesis.
Table 4.5. Brief findings about the 2012 CSCMP study: Career patterns
of women in logistics.
Therefore the following hypotheses are also included in the research project: H40: There is no significant difference in the reasons demotivating employees and
managers from attending training
H4A There is a significant difference in the reasons demotivating employees and
managers from attending training
H50 There is no relationship between existing educational qualifications and
urgency for employee training
H5 A: There is a relationship between existing educational qualifications and
urgency for employee training
©© UUnniivveerrssiittyy ooff PPrreettoorriiaa

126
Authors: Cooper, Santosa and Burgos-Dominguez
Main findings for the 2012 career patterns of women in logistics
Demographics
Used 185 responses out of 1093 sample size. Response rate is
still 5% higher than the 2007study.
About 59% of the women’s ages ranged from 31 to 50 and 71% of
respondents were married. Education levels included
undergraduates (46%), graduates (44.5%) and additional
qualifications (8%).
Work environments:
Directors (29%), managers (28%), and vice-presidents (16%) with
either direct or advisory functions or both as their primary
responsibilities in logistics.
Career patterns:
Participative management styles, where facilitating decisions
rather than directly ordering decisions prevailed.
Perspectives:
86% felt that prospects to build a solid logistics career were better
than ever before. Compared to the 2011 (88%), the 2010 (86%)
and the 2009 (84%) perspectives.
Mentors:
The roles of mentors were unchanged. They provided guidance,
support, advice, moral support, constructive criticism, insight into
politics, networking and job seeking assistance. 75% of
respondents acknowledge that they did have a mentor at some
point.
Type of management
style used.
Decisions were considered rationally, systematically and with
caution. An individualistic corporate culture existed in which
respondents did not see others being treated as family members
or in a welfare-oriented way.
Source: Cooper, Santosa, Hurst, Sanders, Andic & Polyviou (2012: 2-7)
The MBA appeared as the most frequently listed graduate qualification in the
2012 study, which is a positive response to the need for this in the 2009
study. Although the authors caution about generalising the findings of their
Career Pattern series, this suggests personal development and growth where
perceived needs existed three years earlier. They label their sample as
biased since the CSCMP is the leading professional association for logistics
and SCM professionals. The contrasting view of sampling is held for the
current study since the supply chain organisations and respondents were
specifically targeted to increase the validity of the findings.
©© UUnniivveerrssiittyy ooff PPrreettoorriiaa

127
To summarise the findings of the career patterns women in logistics studies,
the 2007 career pattern study yielded no major HR training requirements for
the future success of the executive women in logistics. The unexpected 2008
recession probably brought the fear of losing their jobs even amongst the
women in logistics. An interesting observation is that skills development,
organisational knowledge requirements and personal training needs featured
in the uncertain 2009 global business environments. This could have been an
environmental concern affecting the sentiment of the current research project,
although the research instrument did not measure fear of job loss. The next
section moves away from gender specific views to the secondary research
about gender inclusive skills requirements.
4.3.3. ADDRESSING FUTURE SKILLS GAPS
In an attempt to assess where SCM skills gaps are and will be in the new
millennium, more recent studies are reviewed in this section. Table 4.6.
returns to the gender inclusive research studies conducted with regards to HR
training and skills development in SCM.
Table 4.6. follows on the next page…
©© UUnniivveerrssiittyy ooff PPrreettoorriiaa

128
Table 4.6. Brief findings about human resources training and skills in
supply chain management
Authors Main findings
Bowersox, Closs & Stank, (2000:
12)
Predicted ten mega-trends that would revolutionise SC
logistics back then. Although training is listed at number
9, training SC logistics HR was already imperative at the
start of the millennium.
Grant (2001: 574) Further education and training (FET) is a given in order to
add value to SCM.
Gowen III & Tallon (2003:34) Train and re-train employees since best practice firms
view training HR as a strategic need in order to excel in
SCM. The best practice SCM training and re-training of
staff, is important especially in times when environmental
changes take place.
Myers, Griffith, Daugherty &
Lusch (2004: 224)
There are certain job skills that are making SCM
employees more valuable than others and compensate
for a lack of education. These include social skills,
decision-making skills, problem solving and time
management skills.
Chen & Paulraj, (2004: 151) The true dynamics of SCM is not clearly understood. The
research theory lacks clarity
Othman & Ghani (2008: 259). The level of SCM linkages amongst firms will determine
the HR practices they adopt.
Keller & Ozment, (2009: 385) It is necessary to recruit skills for logistics at early
management levels
CSCMP, (2010: 52). There is currently a need to “train the trainer”(e-book)
Source: Author’s own summary of referenced authors
In this segment, the incidences of training in SCM principles are examined as
they appeared in different research studies. Whether training took place in
academia or in practice made a difference to the value associated with skills
and the knowledge transferred. It is hoped that the existing gap in the SCM
skills being supplied to business organisations can be addressed by referring
to prior studies completed outside South Africa. The flow of this section
follows a chronological sequence in order to identify previous training gaps
and to determine whether these gaps are currently resolved or not.
©© UUnniivveerrssiittyy ooff PPrreettoorriiaa

129
At the start of the new millennium, Bowersox, Closs and Stank (2000: 12)
predicted ten mega-trends that would revolutionise logistics and supply chain
(SC) management. The authors’ point of reference is that integrating SC
logistics would improve the value that the end customers would receive. The
end customer’s perceived value would have to be interpreted from at least
three points of view. From the first perspective customers are price sensitive
and look for economic value (Bowersox, et al., 2000: 1). The second
customer perspective on value focuses on convenience and a variety of
products/services and is termed “market value”. Thirdly, the perspective that
things can influence the way customers work and the way consumers live, is
termed “customer value” due to its relevance (2000: 2). The challenge to
firms in the year 2000 was to improve their offerings and structure themselves
to be positioned in the technological 21st century. This means that all firms
have to accept the revolutionary challenge and adapt to new definitions of
customer value.
In 2001, Grant conducted a research survey from point of the view that the
aim of further education and training (FET) is to add value to SCM (2001:
574). While block courses were used to teach logistics at undergraduate
level, the respondent students completed questionnaires before and after the
logistics training. Grant wanted to determine students’ expectations of the
training and the subsequent outcome. Grant’s method of conducting the
training in block format, as opposed to semester courses, arose from prior
positive effects he found with companies in both the public and private sector
domains. Grant used the block format since generally, anything longer in
duration will prove to be inconvenient to most full-time or part-time employees.
Grant found that previous respondents’ view on training is that they can afford
a week’s vacation to go on a training course, hence his use of the block
format (Grant, 2001:583). The importance of the study by Grant was that a
logistics course can be taught successfully in one week, which is what most
SCM employees would be able to attend. HR training should therefore take
©© UUnniivveerrssiittyy ooff PPrreettoorriiaa

130
note of the delivery mechanisms to be used in conducting logistics and SCM
training for busy employees.
Gowen III and Tallon, surveyed 358 large American service and production
organisations in 2003 to see whether HR practices could influence the SCM
level of success. In particular the HR practice of training employees was
scrutinised, together with barriers to implementation and efforts by both
managers and employees to work towards competitive advantage (Gowen III
& Tallon, 2003: 32). The authors quote the 1987 best practice study by Ernst
and Whinney, who, in agreement with the Logistics Council believe that HR
and training should be seen as part of business strategy instead of as
discretionary budgetary considerations. They noted that best practice in SCM
necessitates the training and re-training of staff, especially in times of when
environmental changes are taking place (Gowen III & Tallon, 2003: 34).
Gowen III and Tallon also highlight that the best practice of so-called world-
class organisations placed strong emphasis on employee education, training
and participation (2003: 35). They investigated Fortune 1000 companies in
respect of five SCM practices and found the best types of training to be:
� For the practice of supplier quality evaluation = team building skills are
required.
� For supplier partnerships = seek problem-solving skills correlation.
� In evaluating customer satisfaction = leadership skills required.
� For benchmarking of competitors = job skills are important.
� For continuous improvement teamwork = team building skills are
necessary.
They conclude that it will take total commitment to HRM for firms to excel in
SCM in the future (Gowen III & Tallon, 2003: 35). The limitations of the
Gowen III and Tallon study, arise from the fact that it was exploratory and
used only one respondent per organisation. It notes that the results are not to
be generalised to all SCM practices in future (Gowen III & Tallon, 2003: 41).
In contrast to the Gowen III and Tallon study, a 2004 study by Myers, Griffith,
Daugherty and Lusch questioned what the industry should do to contribute to
©© UUnniivveerrssiittyy ooff PPrreettoorriiaa
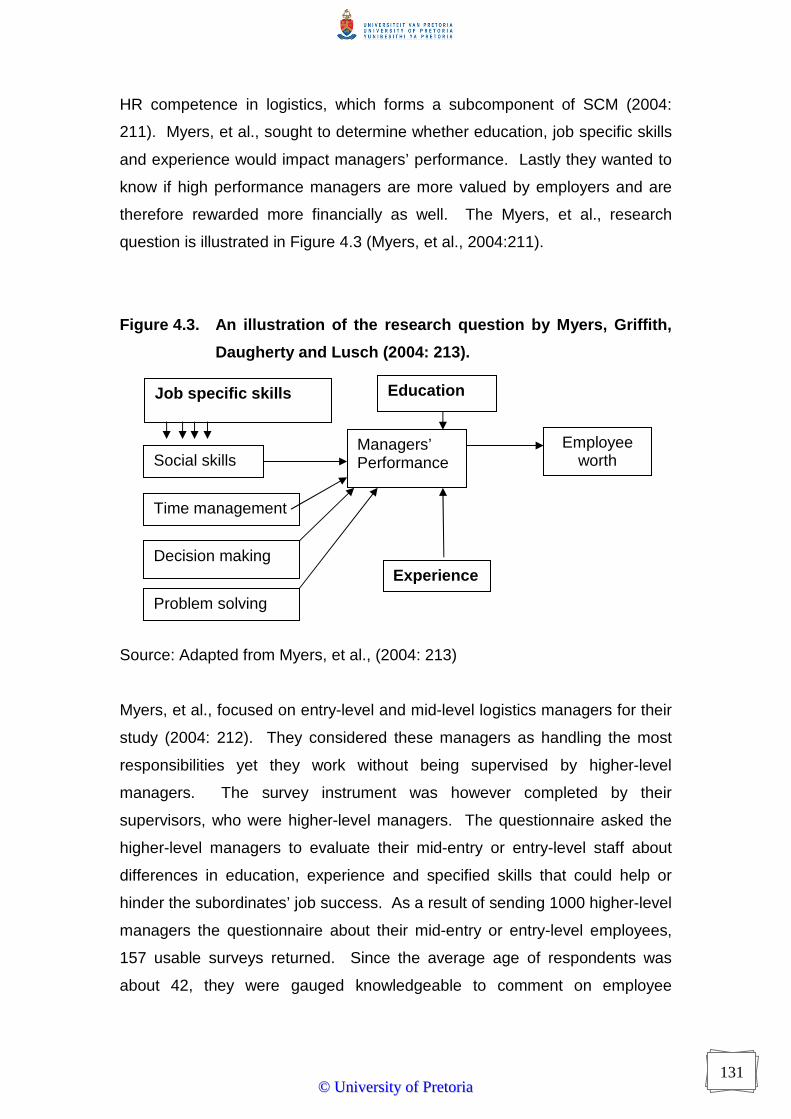
131
HR competence in logistics, which forms a subcomponent of SCM (2004:
211). Myers, et al., sought to determine whether education, job specific skills
and experience would impact managers’ performance. Lastly they wanted to
know if high performance managers are more valued by employers and are
therefore rewarded more financially as well. The Myers, et al., research
question is illustrated in Figure 4.3 (Myers, et al., 2004:211).
Figure 4.3. An illustration of the research question by Myers, Griffith,
Daugherty and Lusch (2004: 213).
Source: Adapted from Myers, et al., (2004: 213)
Myers, et al., focused on entry-level and mid-level logistics managers for their
study (2004: 212). They considered these managers as handling the most
responsibilities yet they work without being supervised by higher-level
managers. The survey instrument was however completed by their
supervisors, who were higher-level managers. The questionnaire asked the
higher-level managers to evaluate their mid-entry or entry-level staff about
differences in education, experience and specified skills that could help or
hinder the subordinates’ job success. As a result of sending 1000 higher-level
managers the questionnaire about their mid-entry or entry-level employees,
157 usable surveys returned. Since the average age of respondents was
about 42, they were gauged knowledgeable to comment on employee
Experience
Social skills
Time management
Problem solving
Decision making
Managers’ Performance
Employee worth
Job specific skills Education
©© UUnniivveerrssiittyy ooff PPrreettoorriiaa

132
education, social skills, decision-making skills, problem solving skills and the
potential impact on their subordinate’s performance.
The results from the Myers, et al., hypothesized study on experience,
education and skills development yielded the following:
� Neither job experience nor educational levels are directly related to
employee performance. However, specific job skills provided a better
prediction of what the employee (sub-ordinate) would be worth to the
employer, since they could make up what the employee lacked in terms
of formal education (Myers, et al., 2004:224).
� The methodology may need to be altered for future studies. By
requesting information from higher-level management about lower
ranking managers, researchers may find that results differ from one
population to another. This is recommended by Myers, et al.,
(2004:224). Based on this recommendation, this research study was
adapted to questioning management level respondents about their
employees in general. This study went one step further by contrasting
managers’ views with employee perceptions.
� The Myers, et al., survey could not comprehensively measure problem
solving or time management skills through the methodology used. Yet
employees should realise that these skills, including those of decision
making and social skills, will influence the managers’ perceived value of
their employees. Based on this management perception, they may
advise the employees’ organisation to find training means to improve
these particular skills (Myers, et al., 2004:225). .
The study by Myers, et al. (2004:225) yielded many more questions to be
investigated. The make-or-buy decision featured in terms of training
employees internally to the desired levels or hiring new employees with the
necessary skills from the start (Myers, et al., 2004:225). If employers decide
to “buy”, how do they assess potential employees’ skills? If employers decide
to “make” how do they determine the best types of training required? The
authors recommend that multiple disciplines such as HR, operations
management and even marketing collectively determine how to identify
©© UUnniivveerrssiittyy ooff PPrreettoorriiaa
133
employee skills. Their conclusion supports the multidisciplinary approach to
the current South African study. While the Myers 2004 study focused on HR
practices in sourcing SCM skills and talent, the next study by Othman and
Ghani, looks outside of the organisation to determine HR practices.
The level of association or linkages between organisations and their supplier
organisations will determine the type of HR practices they adopt (Othman &
Ghani, 2008: 259). By investigating the relationships of seven Malaysian
companies with their suppliers, Othman and Ghani found that three levels of
linkages existed between them (2008: 206). Business can have low,
moderate or high linkages between customer and supplier. When customers
do not audit their suppliers, low linkage exists. When HR and processes are
being audited, moderate linkage exists. When technical assistance is offered
to the supplier after they have been audited, high linkage exists. The authors
found that extensive training in job related and other multiple skills occurs only
with high linkage (Othman & Ghani, 2008: 261). By adding job rotation
practices to the training, suppliers and their customers become more flexible
in dealing with future challenges and opportunities in skills development
(Othman & Ghani, 2008: 262).
In the Keller and Ozment article, Daugherty (2000: 72) is quoted: her 2000
research shows that logistics senior management struggle to recruit, develop
and hold on to quality logistics staff (Keller & Ozment, 2009: 378). In all
countries, calls for fair opportunities were heard since the disabled, minority
groups or female employees seemed to be unfairly treated in the job market.
If organisations could employ more of the latter mentioned staff, they would
be perceived as a more diverse organisation. The matter of an increasingly
older workforce was also raised at the start of the new millennium (Keller &
Ozment, 2009: 378).
In their research methodology, Keller and Ozment reviewed articles from as
early as 1961 but ended in 1990s. Besides the following journals:
� Journal of Business Logistics (JBL)
� Transport Journal (TJ)
©© UUnniivveerrssiittyy ooff PPrreettoorriiaa

134
� International Journal of Logistics Management (IJLM)
� International Journal of (IJPDLM) and Transportation Research: Part E
(TRE), they also utilised the ABI/INFORM, ProQuest and Google
Scholar searches to find more recent articles.
Keywords used included “logistics personnel, HR, employee recruitment,
diversity, transportation and distribution”. The managerial skills identified by
Keller and Ozment were as follows, listed in alphabetical order:
� basic business knowledge such as economics,
marketing, statistics and industrial management
� basic logistics skills
� basic managerial skills
� decision making skills
� diversity awareness, management and sensitivity
� extroversion and conscientiousness
� fast problem solving
� focus/ willingness to change
� problem solving
� quantitative / technical/ information system skills
� SCM core skills
� social/communication skills
� time management
The summary of management skills found in Keller & Ozment (2009: 392) is
the reason why respondents are asked about training they received in the
previous 12 months preceding the empirical study. This was called
hypothesis one:
Rao and others found in the 1990s that using both qualitative and quantitative
course material may help students with problem solving skills, decision
H10: There is no significant difference in the training received by managers and
employees in the preceding 12 months
H1A: There is a significant difference in the training received by managers and
employees in the preceding 12 months
©© UUnniivveerrssiittyy ooff PPrreettoorriiaa

135
making skills and understanding logistics’ effect on strategy (cited in Keller &
Ozment, 2009: 381). For students, lectures, course readings and case study
analyses were used in the knowledge transfer process. This format of training
became a reason to investigate hypothesis two:
Keller and Ozment also reported on a case where employers agreed that
seven skills were important to look for in potential employees in an attempt to
attract the students into logistics careers. These include: being able to write
and communicate verbally, to prioritize issues, to visualise the complete
picture and to work in a team. These decision-making and problem-solving
skills were also valued by hiring organisations as well as by students
themselves (Keller & Ozment, 2009: 382). Keller & Ozment show that
managers and students/ new employees would disagree on the type of skills
required. Skills that are being disagreed on by managers and students are
those of computer usage, statistics and project management skills. Students
expect latest technology training from potential employers while employers in
turn expect more ethical awareness from student recruits.
Research relating to skills for entry level managers was generally agreed as
being knowledge of economics, industrial management, statistics and
marketing since they were immediately useful to managers (Keller & Ozment,
2009: 384). When moving to skills required for mid-level managers, the
following were considered important: time management skills, interpersonal
and leadership skills. This is meant to build on the existing basis of problem
solving and decision-making skills. Of these skills, Daugherty found only
decision-making skills to be statistically significant and positively related to
employee compensation (Keller & Ozment, 2009: 381). Different studies
concur that top managers need to be extroverted and mid-level managers
H20: There is no significant difference in the format of training preferred by
managers as compared to employees.
H2A: There is a significant difference in the format of training preferred by
managers as compared to employees.
©© UUnniivveerrssiittyy ooff PPrreettoorriiaa

136
should be conscientious. These personality traits would serve managers well
in the logistics environment (Keller & Ozment, 2009: 385).
In the same way that the career patterns of women in logistics research study
considered gender, age, formal education and job experience, the skills noted
above all form part of what distinguishes managers and employees from each
other. However the need for skills development and training can be neatly
summed up by what the council for supply chain management professionals
(CSCMP) suggested. The CSCMP suggested a minimum process standard
for developing and training employees (CSCMP, 2010: 52). Their newly
released 2010 e-book states that “train the trainer” is the preferred mode of
teaching. They note that the focus should be on training and support of first-
level managers and that training programs must exist by function/role.
Nothing more has been said about the training-the-trainer initiative at either
the start or conclusion of this empirical research.
4.4. SOUTH AFRICAN SCM TRAINING NEEDS
Most of the literature reviewed so far, relates to studies conducted beyond
South Africa (SA). This section highlights the contrast between recent SCM
research studies and identifies possible training gaps that continue to exist in
the South African context.
In sharp contrast to the United States, the Republic of South Africa (RSA)
currently has a minority of SCM staff with degrees and is not concerned about
the content of Melnyk & Sandor’s Master of Business Administration (MBA)
degree alone. The tertiary level courses being offered include SCM related
courses such as procurement, transport management, warehousing, freight
forwarding, port management, inventory control, imports and exports. In my
own view, even if qualified SCM staff exist in SA, they can also be enticed
through incentives to work in supply chains abroad. Since none of the
qualified SA staff can be convinced to remain in S.A. on the strength of
“building capacity to meet local skills demand alone”, skills migration is a
reality for investigation.
©© UUnniivveerrssiittyy ooff PPrreettoorriiaa
137
This South African research study respondents belong to mainly private
sector SCM associations. It is therefore not directly comparable to the Grant
study since he used non-salaried students instead of industry practitioners.
Also, Grant’s intervention was longer (at least one week) than the South
African survey of employee respondents will be (48hours).
The Fifth Annual State of Logistics survey conducted in 2008 by the Council
for Scientific and Industrial Research (CSIR) and Imperial Logistics was done
after South Africa shed 500 000 jobs following the 2008 global recession. The
2009 CSIR report stated that many engineers, machine operators, technicians
and drivers have low skills levels. Although it was reported in 2009 that
employment demand increased in the transport sector, the problem was that
the supply of employees did not.
Since the preceding literature appears to highlight the challenge of skills
supply in hard cold reality terms, the future of SCM research outside of South
Africa is touched on in the following section.
4.5. FUTURE SCM RESEARCH TRENDS
Although the preceding synopsis comments in retrospect on a few secondary
SCM research sources, there are some recommendations for future research
directions, made by authors who themselves are well known outside of South
Africa. This section deals with the select few recommendations made for
SCM research in the years between 2007 and 2010 and added impetus to
implementing this current research study.
Over a number of years, the definitions of SCM appear to have polarised into
two main sections. The first section sees SCM as a functional integrator and
The aforementioned studies on SCM, HR and skills development, led to the following hypothesis: H50 There is no relationship between existing educational qualifications and urgency for employee training H5 A: There is a relationship between existing educational qualifications and urgency for employee training
©© UUnniivveerrssiittyy ooff PPrreettoorriiaa

138
the second section defines SCM as a process manager (Rossetti & Dooley,
2010: 40). Whether supply chains are focusing on continuous replenishment,
being lean, agile or flexible, they are more about managing extended
networks than being simple chain structures (Gattorna, 2010:11). For any
type of supply chain structure, the people comprising it are still a vital
component.
One year earlier in 2009, the editors of the Journal of Supply Chain
Management emphasized the need to include triadic relationships in the
research field, moving away from dyadic relationships. This is seen as
necessary to highlight the networked phenomenon of organisations in SC
structures, moving away from the links in a chain type of scenarios (Carter &
Ellram, 2009: 6). Those familiar with the old way of testing research
hypotheses could in future also consider using confidence intervals as
opposed to absolute statistical values when hypothesizing relationships
(Carter & Ellram, 2009: 6).
Melnyck and Sandor, who were discussed earlier under the demand for HR,
criticised existing formal education structures. They believe educational
structures have some responsibility to produce managers for global business
requirements. Melnyck and Sandor (2008: 6) contend that an appropriate
body of knowledge must be developed – one that identifies the critical skills
that a strategic SC manager needs.
In the same way that the SCM industry is evolving and updating itself, even
research journals need a revamp. This is according to the editors of the
Journal of SCM, which is the oldest journal on SCM, published since 1965.
Of the 27 supply journals that were evaluated by Zsidis in 2007, the JSCM
was ranked number 3 out of 27 (Carter, Ellram & Kaufmann, 2008: 5). In
future the journal wants to include empirical work in the areas of transaction
cost economies, marketing channels, strategic management, negotiations,
operations and even social networks. Their aim is to incorporate the different
theories such as management theory, economics and psychology (Carter, et
al., 2008:6), inside and outside SCM, as long as authors continue to assess
©© UUnniivveerrssiittyy ooff PPrreettoorriiaa

139
validity. Core topics in SCM and isolated disciplines’ topics should also be
relevant. Current trends in the South African research arena include green
and sustainable supply chains, amongst others.
4.7. CONCLUSION
This chapter looked at the definition of supply chain management by tracing
its origins and evolution. Previous research identified an inherent orientation
or management philosophy behind SCM, which must work together with all
the processes involved. Both academics’ and industry’s search for the SCM
definition made us conclude that SCM is defined as a network of business
partners interdependent on strategically related activities and processes to
serve customer needs, for the purposes of this research study.
There appears to be a continuous demand for SCM talent in view of the
changing global markets. Which makes the challenges of unmet skills in SCM
a reality worth investigating through this empirical research study. It is
important to acknowledge women when it comes to skills development in
SCM if we are to address future skills gaps. This applies to meeting both the
global and the South African SCM training needs.
Regardless of the steps taken to correctly define SCM or to communicate
research results effectively to practitioners, there remains the urgent call to
bridge the research-practice gap. Managers want to know what they can do
with the research findings (Dess & Markoczy, 2008: 58), which are reported in
chapter seven. This emphasises the need, once again, for this particular
research project to be relevant in both practical and literary contexts. The
next chapter will explain the research methodology and approach to the
supply chain training needs analysis (SC-TNA) study, with the aim of their
being both relevant and useful as driving forces.
©© UUnniivveerrssiittyy ooff PPrreettoorriiaa

140
CHAPTER FIVE RESEARCH METHODOLOGY
5.1. INTRODUCTION
5.2. RESEARCH PROBLEM
5.3. RESEARCH OBJECTIVES AND HYPOTHESES
5.4. RESEARCH DESIGN
5.5. THE SAMPLING PROCESS
5.5.1. Sample population definition
5.5.2. Sampling frame
5.5.3. Sample size
5.5.4. Sampling method
5.6. THE DATA COLLECTION PROCESS
5.6.1. Questionnaire design
5.6.2. Data collection
5.6.3. Pre-testing of the questionnaire
5.6.4. Data collection and questionnaire reliability and validity
5.7. DATA ANALYSIS PROCEDURE
5.7.1. Data capture and data editing
5.7.2. Data analysis focus
5.7.3. Shortcomings and sources of error
5.8. CONCLUSION
©© UUnniivveerrssiittyy ooff PPrreettoorriiaa

141
5.1. INTRODUCTION
This chapter explains the research method and design applied in the training
needs analysis of South African SC managers and employees. The research
problem is revisited, followed by the research objectives and design of the
actual study. Furthermore the research sample and population are explained
in more detail. The sampling process which resulted in the empirical data
collection between July 2011 and October 2011 is set out. The research
survey utilised three questionnaires named Training Needs Analysis One,
Two and Three (TNA1, TNA2 and TNA3). The questionnaires were compiled
after investigating previous types of research studies.
E-mailing TNA1 to respondents, during phase one, started the data collection.
The respondents typed their answers in a user-friendly electronic format and
returned it via e-mail. Phase two data collection was done by manual
completion of TNA2. Phase two took place on business organisations’
premises. The reasons for using TNA 2 again as TNA3, during phase two
are also clarified in this chapter. The survey questionnaires’ design phase is
also clarified, which pre-empts the discussion on validity and reliability from
both a quantitative and qualitative literature perspective.
The data analysis tools and techniques are highlighted and contextualised in
this chapter. This chapter puts the foundation in place to defend the research
contribution of this study to the academic community as well as clarifying
potential for practical industrial use.
5.2. RESEARCH PROBLEM
The research problem is to measure whether gaps exist between the training
needs as perceived by SC managers and training needs as perceived by
lower level, non-managerial staff. In the training context, a need is defined as
a gap between a current situation and a future situation. This means there
appears to be a discrepancy between “what is” (which is the present state)
and “what should be”, (representing the desired state) according to Witkin &
Altschuld (1995: 4).
©© UUnniivveerrssiittyy ooff PPrreettoorriiaa

142
The statistical aim of the study is to test nine hypotheses proposing variables
that may affect the supply chain training need perceptions in industry. The
purpose of the study is to conduct TNA in the context of the South African
business environment in order to identify and examine potential SCM training
gaps. Although the research motivation have been discussed in preceding
chapters, the key variables that reinforce the basis for the research aim and
purpose are clarified in the questionnaire design section.
5.3. RESEARCH OBJECTIVES AND HYPOTHESES
With reference to the macro-environment described for SC personnel, the
research questions are derived.
The primary research question is:
Which gaps exist and why do they exist between the perceptions of training
needs held by management and employees within the supply chain
management (SCM) environment?
The secondary question is:
5.3.1. Which variables influence the perceptions of training needs held by
South African SCM managers and employees respectively?
The constructs under investigation include the types of training, which refer to
computer software training, contract management, financial management,
negotiation skills, new product training, occupational health and safety, people
skills, stress management, supervisory skills, time management, transport,
distribution and warehousing skills. The research constructs also included
existing educational qualifications, gender, the respondents’ career stages,
the duration of their current job tenure, signing a contract before training
considerations, a list of demotivating elements and a list of motivating
elements.
5.3.2. Which variables influence the perceptions of employees contrasted
against the perceptions of managers? I need to explain why I wanted to
investigate this aspect. The constructs under investigation will be the
©© UUnniivveerrssiittyy ooff PPrreettoorriiaa

143
same as stated above, which include the types of training, existing
educational qualifications, gender, the respondents’ career stages, the
duration of their current job tenure, signing a contract before training
considerations, a list of de-motivating elements and a list of motivating
elements.
5.3.3. How does the training content on previous courses that respondents
have already attended differ from what they perceive to be future
training content requirements? It is important to note that these
sections were open-ended questions. The answers were reported only
to their respective business organisations and are confidential. This
was a requirement that the researcher had to adhere to, in return for
having access to employee groups in the second phase of the research
project.
RESEARCH OBJECTIVES
The research questions are translated into the following nine research
objectives, namely to:
� determine whether there is a difference between managers' and
employees' types of training that were attended in the 12 months prior
to the study.
� determine which format of training is preferred by respondents
� determine the extent to which identified reasons motivate employees to
attend training
� determine the extent to which identified reasons demotivate employees
from attending training
� assess whether existing educational qualifications have any
relationship with respondents’ demand urgency for training
� test the perception whether females are offered more training
opportunities than males
� determine if late-career-stage employees (older than 45 years of age)
are less likely to request training than earlier career entrants
©© UUnniivveerrssiittyy ooff PPrreettoorriiaa

144
� establish the relationship, if any, between current job tenure (i.e. the
duration with the same organisation) and the willingness to attend
training
� ascertain whether employers’ insistence that employees sign a contract
will deter them from requesting more training
Judging from the literature review and the aforementioned research
questions and objectives, the research hypotheses (denoted H1 to H9)
are:
H10: There is no significant difference in the training received by managers
and employees in the preceding 12 months
H1A: There is a significant difference in the training received by managers
and employees in the preceding 12 months
H20: There is no significant difference in the formats of training preferred by
managers as compared to employees.
H2A: There is a significant difference in the formats of training preferred by
managers as compared to employees.
H30: There is no significant difference in reasons motivating
employees to attend training
H3A: There is a significant difference in reasons motivating employees to
attend training
H40: There is no significant difference between reasons demotivating
employees and managers from attending training
H4A There is a significant difference between reasons demotivating
employees and managers from attending training
©© UUnniivveerrssiittyy ooff PPrreettoorriiaa
145
H50 There is no relationship between existing educational qualifications and
urgency for employee training
H5 A: There is a relationship between existing educational qualifications and
urgency for employee training
H60: There is no gender-based difference in the perception that female
employees receive more training than males
H6 A: There is a gender-based difference in the perception that female
employees receive more training than males
H70: There is no difference in the frequency of training requests between
late-career-stage employees (older than 45 years) and others
H7A: There is a difference in the frequency of training requests between late
career stage employees (older than 45 years) and others
H80: There is no significant difference in the willingness to attend training
between long-tenure employees (employed >10 years) in the same
organisation and new recruits
H8 A: There is a significant difference in the willingness to attend training
between long-tenure employees (employed >10 years) in the same
organisation and new recruits
H90: Employees are not likely to request more training when employers
insist on a repayment contract
H9A: Employees are likely to request more training when employers insist on
a repayment contract
Hypotheses that indicate relationships or correlation amongst variables do not
assume any cause-and-effect relationship (Leedy & Ormrod, 2005:267).
Explanatory or causal hypotheses, imply that an independent variable can
“make happen” a dependent variable (Cooper & Schindler, 2003: 51). When
causal hypotheses are interpreted they must be considered with regard to the
©© UUnniivveerrssiittyy ooff PPrreettoorriiaa

146
direction of the influence as well. A research hypothesis stems from the
identified research problem, but is different from a statistical inference
hypothesis (Leedy & Ormrod, 2005: 270). A good hypothesis is adequate for
the task at hand, testable and better than its rivals (Cooper & Schindler, 2003:
53). In order to test the nine hypotheses statistically against the empirical
evidence collected, the research design is illuminated next.
5.4. RESEARCH DESIGN
Business research is classified into two major categories or strategies, namely
quantitative and qualitative research (Bryman & Bell, 2011: 26, Saunders,
Lewis & Thornhill, 2007: 472). For this research study, both types of data are
collected, although the qualitative, open-ended questions were included in the
same predominantly quantitative questionnaire. The research instruments
contain both quantitative, numeric data and non-numeric, qualitative
descriptors (Saunders, et al., 2007: 145). Although the research strategy
collects both numeric and non-numeric data, it uses the mono-method
approach by using questionnaires as the only research instrument. According
to Bryman and Bell (2011: 27), the selected research strategy would be
considered quantitative with a deductive orientation that allows preceding
theory from reviewed literature to be tested.
©© UUnniivveerrssiittyy ooff PPrreettoorriiaa

147
In Table 5.1. five different types of research design are briefly explained to
reinforce why the decision was made for this study to be a quantitative,
deductive study, which is also considered cross-sectional and comparative.
Table 5.1. Research design types and characteristics
Type of research
design
Characteristics of the research design type
1. Experimental design This design is borrowed from natural science laboratories where
conditions are controllable and variables are easily manipulated. In
contrast the SCM TNA business research study took place in real
life where the researcher cannot manipulate business conditions.
Thus the research cannot be classified as experimental.
2.Cross-sectional
design
This design involves the collection of data at a single point in time,
with more than one case and multiple variables. This study is
cross-sectional since it involved many businesses, at one point in
time and could possibly detect variation between multiple variables.
The survey method is employed to obtain various responses
quickly.
3. Longitudinal design This involves surveying samples of respondents over time in order
to map changes in behaviour or processes. This design is rarely
used in business due to the sample consistency required to prove
causal influences over time.
4. Case study design Involves detailed and intensive study of particular cases or
businesses. This limits research to a specific organisation,
location, person or event. Time constraints prevented spending
extensive research time with each of the businesses that constitute
the SCM environment.
5. Comparative design This design uses the logic of comparison between situations or
scenarios to derive meaning from the comparison. Reasons for
similarities and/or differences across training cultures or between
training cultures can be a useful way of gaining insight into the
SCM TNA environments. This research study is therefore also
considered a comparative research design.
Source: Adapted from Bell & Bryman (2011: 45-60), Cooper & Schindler
(2003: 149).
©© UUnniivveerrssiittyy ooff PPrreettoorriiaa

148
The conclusion of the design types recorded in Table 5.1, is to designate the
research project as cross-sectional in duration since time and financial
resource constraints prevent a longitudinal study from being conducted. The
study is also comparative since the intention is to find descriptive and
explanatory answers for the discrepancy in perceived training needs.
The ethical considerations of research design, apply to any type of research
design and morally guide the research content, the means of gaining access;
the collection, processing and storage of data (Saunders, et al., 2007: 178).
Ethics compel the appropriate practices of acknowledging quoted authors and
avoiding plagiarism (Mouton, 2005: 241). The ethical foundation of the
research project had to be approved by an ethical research committee at the
university. The committee members examined the ethical and non-
discriminatory nature of the study. Research participants require assurance
of the right to remain anonymous and to have confidentiality about their
answers to the questions asked. The informed consent approach of the
questionnaires was also approved before being distributed to the respondent
sample. This consent was coupled with the right to refuse to participate in the
research study. The sampling and data collection processes are clarified in
the following section.
5.5. THE SAMPLING PROCESS
5.5.1. The sampling process and sampling error
The sampling of a population of respondents is necessary when the entire
population consists of too many people and businesses to survey practically
within a limited time frame (Bryman & Bell, 2011:176, Saunders, et al., 2007:
206). A sample is a subset of the entire population but should be large
enough to derive information from the data collected. Budget constraints
restrict the number of respondents that may be included in the sample, but a
non-negotiable time deadline also plays its part (Bryman & Bell, 2011:170,
Saunders, et al., 2007: 206). Excluding time and cost, other reasons for
taking a sample instead of using a census of the population, include
confidentiality and accuracy (Diamantopoulos & Schlegelmilch, 2002:11).
©© UUnniivveerrssiittyy ooff PPrreettoorriiaa

149
Four factors actually influence the term ‘sampling error’ as asserted by
Bryman and Bell (2011: 194). Firstly, the inaccurate sampling frame and non-
response result in errors during the sampling process. Secondly data
collection could be flawed through wording errors. Data processing could
thirdly introduce faults when coding answers. Finally the sampling error exists
inherently due to the fact that no selected sample could truly represent the
population from whence it comes (Bryman & Bell, 2011: 194).
The sampling process as applied by Diamantopoulos & Schlegelmilch (2002:
18-19) includes the following steps.
� Define the population.
� Specify the sampling frame.
� Determine the sample size.
� Select the sampling method.
� Draw the sample and collect the data.
These steps in the sampling process were used as the demarcation of the
following paragraphs.
5.5.2. Sample population definition
The population units for this study consist of individuals employed in
organisations that have a verifiable supply chain structure that allows them to
produce goods and services. The Phase One respondents were found in the
following industry types: agriculture, mining, manufacturing, automotive
industry, food and beverage; health, education, forestry, transport, retail,
services and government. The Phase Two employees included fast moving
consumer goods and service concerns. Although according to the
internationally accepted Standard Industrial Classification (SIC) scheme there
are 17 main sections of economic activity (Bryman & Bell, 2011: 182), some
sections were not relevant in the local SC context. Coding rules have
therefore been applied and are explained under the data preparation and
research analysis section.
©© UUnniivveerrssiittyy ooff PPrreettoorriiaa
150
The units of analysis are both managers and non-managerial employees
representing organisations in the South African supply chain marketplace.
The levels of management included executives, middle management and
supervisory-, first level management. No distinction is made between whether
respondents were full-time or part-time employees and therefore contract
workers were also given a chance to participate.
5.5.3. Sampling frame
The types of organisations that were sought to take part in the research study,
especially for Phase 2, had to be sizable and employ more than 50
employees. This requirement improved the chance of respondent
organisations having a Workplace Skills Development Plan for their
employees. This means that small, medium and micro enterprises (SMMEs)
would not form part of the targeted respondents if they have less than 50
employees. Major organisations selected were also able to identify their
business partners upstream and downstream, thus qualifying them as part of
a legitimate functional supply chain structure.
5.5.4. Sample size
The sample size has to take into account the degree of variability in the
population, that is the more heterogeneous the population, the larger the
sample size needed to capture the diversity in the population
(Diamantopoulos & Schlegelmilch, 2002:16). The law of large numbers for
the sample size, makes it more likely that the mean of the sample is equal or
close to the mean of the population (Saunders, et al., 2007: 211, Leedy &
Ormrod, 2005: 269). The sampling strategy aims for the research sample to
be representative, especially if survey findings should be generalized to the
population (Bryman & Bell, 2011: 176). Representative generalizable
samples are in turn linked to the research ideal of minimising the sampling
error discussed earlier.
Not all researchers agree with Saunders, et al., about sample size
determination. According to Cooper and Schindler (2010: 408) the level of
©© UUnniivveerrssiittyy ooff PPrreettoorriiaa

151
precision that the researcher is looking for, will influence the sample size
decision (denoted by n). Sampling size is inversely related to sampling error
according to Diamantopoulos & Schlegelmilch (2002:16). For this study,
although it is not possible to judge which estimate is the true mean, the
researcher is willing to take a 5% risk that the sample selected does not
represent the true mean of the population. That means there is a 5% loss in
precision.
To illustrate the determination of sample size by using the concept of
precision, for example, a survey question used a 5-point Likert
Agree/Disagree scale to determine the perceptions of managers and
employees about training needs. In Table 5.2, the Likert scale example is
used to calculate the approximate required sample size at the 5% risk level.
This calculation of the sample size was done when the TNA1 questionnaire
responses were slow and stood at only 60. This was done to double check
that the sample size alone would not be the main cause of error in the data
processing stage of the research.
Table 5. 2. Example of sample size determination follows…
©© UUnniivveerrssiittyy ooff PPrreettoorriiaa
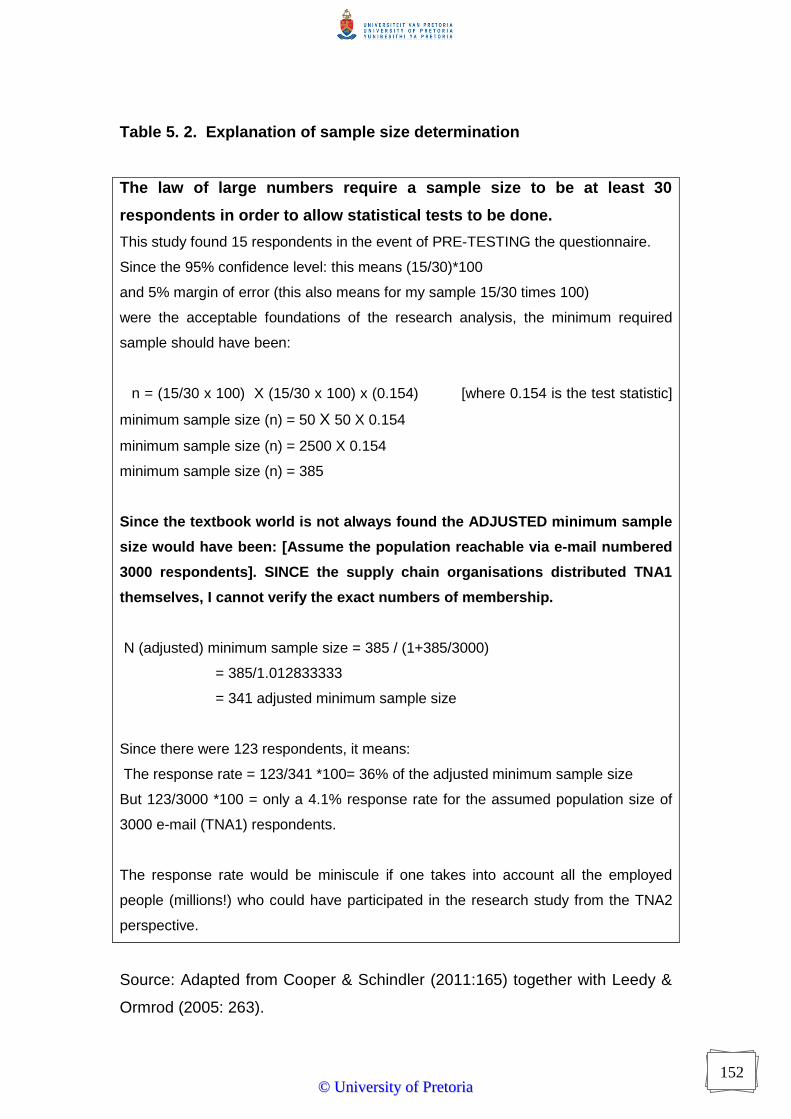
152
Table 5. 2. Explanation of sample size determination
Source: Adapted from Cooper & Schindler (2011:165) together with Leedy &
Ormrod (2005: 263).
The law of large numbers require a sample size to be at least 30
respondents in order to allow statistical tests to be done.
This study found 15 respondents in the event of PRE-TESTING the questionnaire.
Since the 95% confidence level: this means (15/30)*100
and 5% margin of error (this also means for my sample 15/30 times 100)
were the acceptable foundations of the research analysis, the minimum required
sample should have been:
n = (15/30 x 100) X (15/30 x 100) x (0.154) [where 0.154 is the test statistic]
minimum sample size (n) = 50 X 50 X 0.154
minimum sample size (n) = 2500 X 0.154
minimum sample size (n) = 385
Since the textbook world is not always found the ADJUSTED minimum sample
size would have been: [Assume the population reachable via e-mail numbered
3000 respondents]. SINCE the supply chain organisations distributed TNA1
themselves, I cannot verify the exact numbers of membership.
N (adjusted) minimum sample size = 385 / (1+385/3000)
= 385/1.012833333
= 341 adjusted minimum sample size
Since there were 123 respondents, it means:
The response rate = 123/341 *100= 36% of the adjusted minimum sample size
But 123/3000 *100 = only a 4.1% response rate for the assumed population size of
3000 e-mail (TNA1) respondents.
The response rate would be miniscule if one takes into account all the employed
people (millions!) who could have participated in the research study from the TNA2
perspective.
©© UUnniivveerrssiittyy ooff PPrreettoorriiaa

153
From the calculation of sample size determination in Table 5.2, the researcher
was reassured to continue the research process due to the small number of
respondents required over and above the 5% level of making an error. The
next section will elaborate on the sampling method of the sampling process.
5.5.5. Sampling method
The literature distinguishes strongly between sampling that is done according
to probability sampling or that is done via non-probability techniques. The
former does not guarantee that the sample selected will be more
representative, only that sampling error can be statistically determined
(Bryman & Bell, 2011: 717, Saunders, et al., 2007: 207, Diamantopoulos &
Schlegelmilch, 2002:13). Probability sampling means that each respondent
had a known chance of being selected, while non-probability sampling infers
that some population units are more likely to be selected (Bryman & Bell,
2011:176, Saunders, et al., 2007: 207). Table 5.3 briefly explains why this
research study applied non-probability, purposive, judgmental sampling
technique.
Table 5.3. Advantages and disadvantages of the non-probability
sampling method used
Non-probability sampling
description
Advantage Disadvantage
Purposive judgment sampling:
Sample conforms to certain criteria for
a given purpose.
Researcher selects respondents
based on particular objective.
This method can save costs and is useful to find specific themes amongst the heterogeneous population.
Has a low likelihood of being truly representative.
Sources: Adapted from Bryman & Bell (2011: 179-196), Cooper & Schindler
(2003: 199), Saunders, et al., (2007: 207-234), Diamantopoulos &
Schlegelmilch (2002:14-16).
In addition to the disadvantages of using certain sampling techniques there
are some more obvious reasons to consider. Since the researcher did not
have access to the entire population for TNA1, (i.e. all people employed in a
©© UUnniivveerrssiittyy ooff PPrreettoorriiaa

154
supply chain member organisation) the use of simple random sampling was
ruled out. This meant any other probability sampling technique was not
feasible. Cluster sampling would relate to clusters and not individual
members. Individual respondents are required when measuring employee
training needs perceptions (Bryman & Bell, 2011: 223).
The purposive, judgemental sampling technique was chosen since it would
allow the research questions to be answered and its objectives to be realized
(Saunders, et al., 2007: 230). The value of using the purposive sampling
strategy (for TNA1) is that heterogeneous, maximum variability data could
potentially explain the training needs gaps amongst SC respondents. Recall
that supply chains consists of suppliers, warehouses, manufacturers,
distributors and large customers and are therefore very heterogeneous. For
TNA2, the critical case sampling meant choosing ‘important’ organisations to
participate since their ‘training problems’ could also highlight training issues in
other organisations (Saunders, et al., 2007: 232). On finalising the reasons
for using the non-probability sampling technique, the data collection had to be
done.
5.6. THE DATA COLLECTION PROCESS
5.6.1 Questionnaire design
Three questionnaires were designed after consolidating the literature
reviewed in preceding chapters and taking into account the local context.
Training needs analysis 1 (TNA1) was used for management only while TNA2
and TNA3 focused on employees “before and after” the supply chain
“awareness” intervention. TNA1 contained 60 distinctive variables and was
divided into three main sections as follows:
TNA1 Section 1: Background information
This TNA 1 section included questions about managers’ job titles, work areas,
organisational business level, industrial sector, gender, age, number of
employees, tenure of employment and number of employees reporting to
them.
©© UUnniivveerrssiittyy ooff PPrreettoorriiaa

155
TNA1 Section 2: Education and training (about themselves)
This section included questions about their personal levels of qualification,
training received in the 12 months’ prior to the survey; and perceptions about
previous and future training.
TNA1 Section 3: Education and training (about their staff)
This section questioned the types of training they preferred for their staff,
whether they agreed with demotivating and motivating reasons for their staff
to attend training, future training, budgets, frequency of training for their staff
and themselves.
The TNA2 and TNA 3 questionnaires contained only 52 variables since some
of the variables from TNA1 were not applicable to them. TNA 2 and TNA3
were used amongst non-supervisory employees and were divided into 3
sections as follows:
TNA2 & TNA3 Section 1: Background information
This TNA 1 section included questions in sequence about employees’ job
titles, tenure of employment, gender, age and their personal levels of
qualification.
TNA2 & TNA3 Section 2: Views about their own training
This section included questions about reasons motivating and demotivating
them to attend training and their preferred format of training. The answers to
these questions could therefore be easily tested against the views of
managers about employee training.
TNA2 & TNA3 Section 3: Views about their organisations
This section questioned staff views about training in general, the training they
think their bosses needed, the training they needed for themselves, and the
format of past training they received in the previous 12 months and future
needs.
The variables were linked to the hypotheses as summarised in Table 5.4
below. Note that only the data that linked up with specific hypotheses were
©© UUnniivveerrssiittyy ooff PPrreettoorriiaa

156
reported and analysed statistically in this research project’s findings. Any
remaining variables, such as open-ended questions about future training
wished for; will be reported in subsequent literature such as academic
research articles. Some open ended questions may well have been
supported by the research intervention performed by the researcher.
5.6.2. Research Intervention
The research intervention that was delivered to the TNA2 groups, were
designed to allow them the same content as “food for thought” in their 48 hour
reflection period. The intervention took the form of Powerpoint slides which
were presented to the respondents in their training rooms/boardrooms. NB:
the content of the slides were based on the example from business practice
that managers use to prevent non-managerial employees from taking holiday/
paid leave. The approach followed was more artistic than scientific since the
author’s creative licence experience of teaching adults came into effect. The
slides contained the following content:
1. Heading: Introduction to supply chain training needs
2. This slide demonstrates that respondents could have used 20 different
product in the time period from waking up in the morning, to getting to
the office and having their first meeting.
3. The employees could be daydreaming about being on holiday at the
coast or in the Drakensberg area, both of which are tourism services in
the supply chain industry.
4. The reasons for bosses to refuse employees often involve that “no one
else has the skills to do your job…”
5. Employees could very well get upset with the excuses…an irate picture
was shown.
6. A diagram is shown, to allow employees to identify where they fit into
their supply chain structures.
7. The bosses requests are listed: that employees should work harder to
“improve customer service, help suppliers to become green, train staff
on Six Sigma and so forth.
8. The bosses again remind staff about supply networks and the “big
picture”.
©© UUnniivveerrssiittyy ooff PPrreettoorriiaa

157
9. The employees wish they could become the boss and are left to
ponder: “what training do I need in order to be promoted to a more self-
determining level?”
For the sake of brevity, only research objectives, not hypotheses, are listed in
Table 5.4. Note that variables that were directly used in tests of comparison,
association or other hypothesis testing have been placed next to each other in
Table 5.4. This will expedite the explanation of the findings in chapter six.
Variables that may not appear in Table 5.4 include those linked to questions
about the respondents’ background and demographics.
Table 5.4. Link between research objectives and variables
Research Objective
Management
TNA 1
variables
Employees
TNA 2 and
TNA3
variables
Scale of the
data
1. To determine which training was
attended in the 12 months prior to
the survey.
V12-V23 V40-V51 Nominal:
Dichotomous
2. To determine which format of
training is preferred by respondents
VV33-40 V17-V24 Ordinal,
Likert scale
with 3 options
3. To determine the extent to which
identified reasons motivate
employees to attend training
V53-V57 V7-V11 Ordinal,
Likert scale
with 5 options
4. To determine the extent to which
identified reasons demotivate
employees from attending training
V41-V52
V41
V42
V48
V45
V12-V16
V12
V13
V14
V16
Ordinal,
Likert scale
with 5 options
5. To assess whether existing
educational qualifications have any
relationship to respondent’s demand
urgency for training
No
corresponding
question
V6 =
qualifications
and
V25
Nominal/
Dichotomous
and Ordinal.
Likert scale 5
options
6. To test the perception whether
females are offered more training
No
corresponding
V4 = gender
and V26
Nominal/
Dichotomous
©© UUnniivveerrssiittyy ooff PPrreettoorriiaa

158
opportunities than males question and Ordinal.
Likert scale
with 5 options
7. To determine if late-career-stage
employees (older than 45 years of
age) request less training than
earlier career entrants
V7 = age
Contrasting
question at
V50
V5 = age
And V27
Ratio and
Ordinal.
Likert scale
with 5 options
8. To establish the relationship, if
any, between current job tenure (i.e.
>10 years with the same
organisation) and the willingness to
attend training
V9 = tenure
but no
corresponding
question
V3 = tenure
and V28
Ratio and
Ordinal Likert
scale with 5
options
9. To ascertain if employers’
insistence that employees sign a
contract will deter them from
requesting more training
V51 V29 Ordinal Likert
scale with 5
options
Source: Author’s own compilation
Table 5.4 sets the tone for hypothesis testing that can involve testing for
specific population characteristics, contrasts or associations (Diamantopoulos
& Schlegelmilch, 2002: 135). Specific descriptive and statistical tests were
selected based on which groups of respondents are analysed i.e. TNA1
management group or TNA 2 and 3 groups (employees “before” and “after”).
In chapter five only those statistical tests that were actually applied in the data
analyses are explained. Note that the Table 5.4 variables are also
inconclusive since other variables not listed above were used to test the
reliability and validity of their respective questionnaires.
5.6.3. Data collection steps
The first phase of the research study targeted management levels through
their membership of professional associations and industry structures. The
reason for selecting the relevant associations is that they represented the
main industrial and functional areas within SCM. Those functional areas
include procurement, warehousing and transport for example. During Phase
1 of data collection, the TNA1 questionnaires were electronically distributed
©© UUnniivveerrssiittyy ooff PPrreettoorriiaa

159
(via e-mail) to the professional associations in the SC realm. For purposes of
unbiased selection of the sample, the researcher did not have access to the
membership databases of the professional bodies. Instead, to further
encourage the equal chance of participation, the relevant associations sent
the questionnaire to everyone on their databases. The participating SC
professional associations included:
� the Chartered Institute of Purchasing and Supply Southern Africa
(CIPS)
� the Chartered Institute of Logistics and Transportation Southern Africa
(CILTSA)
� the Association for Operations Management of Southern Africa
(SAPICS)
� Commerce Edge (Pty) Ltd, a procurement solutions company
Due to the fact that the SC associations’ distribution of TNA1 yielded an
insufficient number of responses (about 65), the project was at risk of having
insufficient data to analyze. Traditional common research practice advocates
resending the same questionnaire as a follow-up if the response is not as
desired, to serve as a reminder (Cooper & Schindler, 2003:342). However the
risk of alienating the industry from participating in Phase 2 of the project
required the researcher to find an alternative distribution mechanism.
Contrary to the practice of re-sending the questionnaire, the researcher used
the annual procurement conference hosted by Commerce Edge (Pty) Ltd as a
means of faster data collection for TNA1. The questionnaires were completed
manually (i.e. answers were not typed) but allowed participants to remain
anonymous. The same letter of informed consent was attached to each
questionnaire as applied to the e-mailed version, to allow for voluntary
participation. Distributing the questionnaire both electronically and at the
procurement conference, meant that a total of 123 TNA1 questionnaires were
completed in four months.
Initially the researcher was planning to ask the respondents to TNA1, to
volunteer their business organizations for Phase 2 of the study. Research
supervisors advised against this since it might have been interpreted as
©© UUnniivveerrssiittyy ooff PPrreettoorriiaa

160
coercive. The sample for Phase 2 of the research study was therefore
selected by requesting assistance from a network of business and personal
contacts. These individuals are all employed in supply chain organizations.
Organisations were initially approached telephonically. Immediately
thereafter, an e-mail letter of request was sent to the relevant person’s e-mail
address. The TNA2 sample grew with permission being granted by
respondent business organizations. These business organisations
assembled between 10 and 30 employees respectively to take part in the
study. The participating businesses sites/premises were visited twice during
the same week, with a 48-hour rest/reflection period between sessions.
Managers communicated the time and place (i.e. boardroom or training
rooms) to their staff members even if the research request was not originally
addressed to the particular managers by name.
The five participating organisations included business partners from fast
moving consumer goods (FMCG) organisations as well as a service related
logistics organisation. These organisations were visited twice within the same
week for data collection to maintain consistent treatment of all respondents.
The number of non-participant organisations that were approached via e-mail
requests, telephonically or via personal referrals was eleven. Of the 11
approached, only three politely declined the TNA2 request directly. The rest
(eight) silently communicated their inability to participate by their non-
response to the TNA2 request. The completed questionnaires (both TNA2
and TNA3) numbered 110 and these were collected between August and
October 2011. Due to their festive season business preparations, companies
were not likely to participate in research studies beyond October in any given
year.
5.6.4. Pre-testing of the questionnaire
Both questionnaires were pre-tested before distribution to the field. The
management level TNA1 questionnaire was pre-tested amongst five
managers in the supply chain field. Their completion times were recorded to
double-check that the questionnaire was not too long. No complaints were
©© UUnniivveerrssiittyy ooff PPrreettoorriiaa

161
received regarding question ambiguity or lack of clarity. Questions were
answered completely as requested in the cover letter/consent page.
TNA2 was pre-tested in a continuous education class that was coincidently
and conveniently held on campus. Fifteen respondents completed the
questionnaire in less than 30 minutes. The SC pitch intervention was
delivered after collecting the completed instrument. The respondent class
was given free rein to comment on the content and format of the SC pitch
before being given 48 hours to reflect on their training needs. After 48 hours
within the same week, the TNA3 questionnaire was administered to the same
group of respondents. On both occasions the questionnaires were completed
in full and no complaints were received about the contents. On the contrary,
respondents welcomed the opportunity to provide their views on their own
managers’ training needs.
Since the questionnaires appeared to fit the requirements of the research
objectives, they were administered in field as soon as the university’s ethical
committee had cleared their contents and approach.
5.6.5. Data collection and questionnaire reliability and validity
The goal of validity is to question whether we are really measuring what we
think we are measuring. Reliability asks whether the results from our
measures are consistent, according to Diamantopoulos and Schlegelmilch
(2002:32). Research design credibility will be judged on whether an existing
research instrument has been previously used (and validated) or not. Since
TNA1, TNA2 and TNA3 were newly constructed by using many literature
sources, the criteria that assess credibility namely reliability, replication and
validity became applicable to testing the questionnaire as well as the overall
design (Bryman & Bell, 2011:41, Mouton, 2005: 100, Statsoft, 2003).
Although these criteria apply to predominantly quantitative data, qualitative
responses have to comply with the element of trustworthiness. Table 5.5.
highlights the aspects of reliability and validity to show similarities between
quantitative and qualitative data collection strategies. Table 5.5. also lists four
©© UUnniivveerrssiittyy ooff PPrreettoorriiaa

162
subsections to describe trustworthiness under the qualitative research section
below.
Table 5.5. The research design and questionnaire credibility criteria
Criterion &
threats
Quantitative research Qualitative research
Reliability:
Reliability checks whether the
results will stay consistent on
different research projects and be
transparent enough to repeat the
measurement (Saunders, et al.,
2007: 149).
Dependability, is similar to external
reliability and questions whether the
findings are likely to apply at other
times, outside of the study (Bryman &
Bell, 2011: 43).
Confirmability parallels the objectivity of
the researcher, which means that
his/her values should not influence the
research process (Bryman & Bell,
2011: 43).
Validity Validity is concerned with how well
the research concept is defined by
the measure(s) and whether the
findings are reflections of reality
(Saunders, et al., 2007: 150)
Credibility which is similar to “internal
validity” that determines whether the
findings are believable (Bryman & Bell,
2011: 43).
Transferability parallels the concept of
external validity and questions whether
findings will be applicable in other
contexts (Bryman & Bell, 2011: 43).
Source: Adapted from Bryman & Bell (2011: 43), Saunders, et al., (2007: 150)
The need to test questionnaires’ validity and reliability stems from the
existence of research errors. There are two types of measurement error:
systematic error (or Bias) and random error (also called Variable Error). Bias
occurs in a consistent manner every time a measurement is taken, for
instance a general tendency to respond negatively, while random error can
occur in any direction. When a measure is free of both systematic error (S)
and random error (R), then it becomes a measure of its validity. In other
words a perfectly valid measure implies that the observed score (O) is equal
to the true score (T). Measurement error means that: Observed score (0) =
©© UUnniivveerrssiittyy ooff PPrreettoorriiaa

163
True Score (T) + Measurement Error (E) according to Diamantopoulos and
Schlegelmilch (2002: 32):
However, reliability can be under threat from participant error/bias or from
observer error/bias (Saunders, et al., 2007: 150). Reliability means that a
measure is free from random error and implies that random error (R) = 0
(zero). Note that if a measure is not reliable, it cannot be valid
(Diamantopoulos and Schlegelmilch, 2002: 34). However, if a measure is
reliable, it may/may not be valid. In other words, a measure that is valid is
reliable, but not necessarily the other way around.
Reliable research instruments should deliver consistent results (Cooper &
Schindler (2003: 236). Bryman and Bell explain three different meanings of
reliability that assess the consistency of the measuring instrument used in the
research project (Bryman & Bell, 2011:157). The first one of stability involves
a test-retest scenario where an instrument is administered to the same group
over a short time to determine if any variation occurs. Their second
interpretation of reliability checks for internal reliability to see if a respondent’s
scores on any indicator are related to their scores on other indicators (Bryman
& Bell, 2011: 158). The third interpretation of reliability is called inter-observer
consistency and is not commonly used (Bryman & Bell, 2011: 158).
Cronbach’s Alpha is a commonly used test of internal reliability. It calculates
the average of all possible split-half reliability coefficients. A score of 1 on the
computed Cronbach-Alpha coefficient means a perfect internal reliability and
a score of 0 implies no internal reliability (Bryman & Bell, 2011: 159). The rule
of thumb suggests that a score of 0.7 is enough to denote an acceptable level
of internal reliability (Bryman & Bell, 2011: 159). Hair, Anderson, Tatham and
Black (1998: 88) suggest that a Cronbach-Alpha value of between 0.6 and 0.7
can be considered the lower limit of acceptability.
Chapter six findings are based on ways of minimising the risks of inconsistent
or not valid questionnaires. Construct validity was not tested through factor
analysis (Cooper & Schindler, 2003: 232). Since the questionnaires were
©© UUnniivveerrssiittyy ooff PPrreettoorriiaa

164
newly constructed for the purposes of the research study, due to the
comparative nature of the analysis statistical tests were done to look for
underlying patterns or common variance amongst variables (Cooper &
Schindler, 2003: 613, Diamantopoulos & Schlegelmilch, 2002: 216).
Since the research design did not lend itself to factor analyses, corresponding
questions were asked in different sections of the questionnaires in order to
verify that the respondents understood the questions and interpreted them
correctly. The data analysis procedure therefore follows next in order to
explain the ways of increasing the validity and reliability of the questionnaires.
5.7. DATA ANALYSIS PROCEDURE
This section briefly explains the data analysis procedure upon completion of
the data collection stage.
5.7.1. Data capture and data editing
Phase 1 Data:
After completing the electronic questionnaire that was scheduled to be less
than half an hour long, the management level of participants returned it to the
researcher via e-mail. The researcher’s e-mail address was written in the
cover letter (Refer to the appendices to see a copy of the cover letter). The
completed questionnaires were printed out individually to allow manual
encoding by the researcher. For the manual completion of TNA1 at the
Commerce Edge (Pty) Ltd. conference, the hard copy completed
questionnaires were coded in the same way as those returned via e-mail.
Phase 2 Data:
The researcher travelled with manual copies of the TNA2 questionnaire that
were completed manually by participating supply chain organisations’
employees. An electronic slide presentation was shown to respondents on a
big screen at the organisations’ training facilities/boardrooms in order to show
respondents simultaneously what SCM is about. After 48 hours the
researcher returned to the organisations’ facilities where the respondents
assembled again to complete the TNA3 questionnaire manually.
©© UUnniivveerrssiittyy ooff PPrreettoorriiaa

165
The data collection period took about four months to complete (July-October
2011). A typist assisted with the data collected from TNA1, TNA2 and TNA3
to capture the data after coding into three separate electronic (computerised)
databases. Unanswered questions were not coded (i.e. they were left blank)
since some binomial questions already used 1 or zero to indicate affirmative
or negative answers. Open-ended questions were typed into an Excel
spreadsheet with respondent numbers as the unique identifiers. These were
reserved mainly to clarify any unusual results obtained from the quantitative
data analyses. The Statistical Analysis Software (SAS) system for data
analysis was used since the program is licensed for use by the Statistical
Department of the university.
5.7.2. Data analysis focus
The rationale for the data analysis process included a descriptive focus, a
comparative focus and a hypothesis testing focus. The latter two use
inferential statistics to see if the sample data can inform us about the SCM
TNA population (Leedy & Ormrod, 2005: 267).
� Descriptive data analysis
The data set can be described according to its measures of central tendency,
variation and correlation (Leddy & Ormrod, 2005: 257). Variations are found
per variable where scores differ from the mean aptly named standard
deviations. Since central tendency and variations only check individual
variables, correlation looks at whether a relationship exists between two or
more variables (Leedy & Ormrod, 2005: 257). Correlation can indicate
direction and strength of the relationship between two or more variables.
Direction is recorded as either perfectly positive or perfectly negative (i.e. +1
and –1) while the strength of the relationship is shown by the closeness of the
measured statistic to 1 (Leedy & Ormrod, 2005: 265).
According to Saunders, et al., (2007: 423) individual variables can also be
summarised to consider their trends over time, proportions and distributions.
©© UUnniivveerrssiittyy ooff PPrreettoorriiaa

166
By applying descriptive analysis, the descriptive frequency tables also allowed
the individual data distributions to be checked for major discrepancies or
proportions of missing data. In this way, compiling the frequency tables
enabled the categorisation of continuous data into acceptable ranges.
Measures of central tendency in the data set distributions include the mode
(which occurs the most frequently), the median/numerical center and the
mean/fulcrum point of the data (Leedy & Ormrod, 2005: 258). The mean was
used mostly in testing hypotheses in the research project. By keeping
management data (TNA1) separate from employees’ “before” (TNA2) and
“after” (TNA3) data, it was easier to distinguish between questions that were
fully answered or not.
� Comparative data analysis
The authors Diamantopoulos and Schlegelmilch see the statistical test options
for making comparisons between groups as illustrated in Figure 5.1. below.
Statistical tests are selected based on the level of measurement being either
nominal, ordinal, interval or ratio types of data.
During the comparisons between data sets, the contingency tables were
easily assembled since the variables could be verified from coding tables
completed during the data capture phase. The two-sample tests of
homogeneity or tests of independence were done to establish whether the
management group displayed characteristics similar to the employee group
on certain variables (Diamantopoulos & Schlegelmilch, 2002: 180).
The data sets were compared in the following settings:
Managers (TNA1) were compared to employees “before the intervention”
(TNA2).
Managers (TNA1) were compared to employees “after the intervention”
(TNA2)
Employees were compared with each other before and after the intervention
(i.e. TNA2 was compared to TNA3).
©© UUnniivveerrssiittyy ooff PPrreettoorriiaa

167
Figure 5.1. Making comparisons using different statistical techniques
Source: Adapted from Diamantopoulos & Schlegelmilch (2002:174).
Recall that in Figure 5.1 the statistical tests with asterisks *** are all non-
parametric. This concept of non-parametric tests is explained in Table 5.6.
THREE OR
MORE
TWO
Nominal= Cochran’s Q test Ordinal = Friedman’s two-way ANOVA Interval/Ratio = (tr) Test for all pairs
How many measures?
TWO
Nominal = two sample chi-square test Ordinal = Mann-Whitney U test *** Interval/Ratio = Two sample t-test, z-test
What is being compared?
Different/ independent groups of individuals/
objects across the same measure
How many measures?
The same/ related individuals/objects across different measures
THREE OR
MORE
Nominal= k-sample chi -square test *** Ordinal = Kruskal-Wallis one way ANOVA *** Interval/Ratio = One way ANOVA
Nominal= McNemar test Ordinal = Paired-samples sign test *** Interval/Ratio = Paired sample t-test (tr)
©© UUnniivveerrssiittyy ooff PPrreettoorriiaa
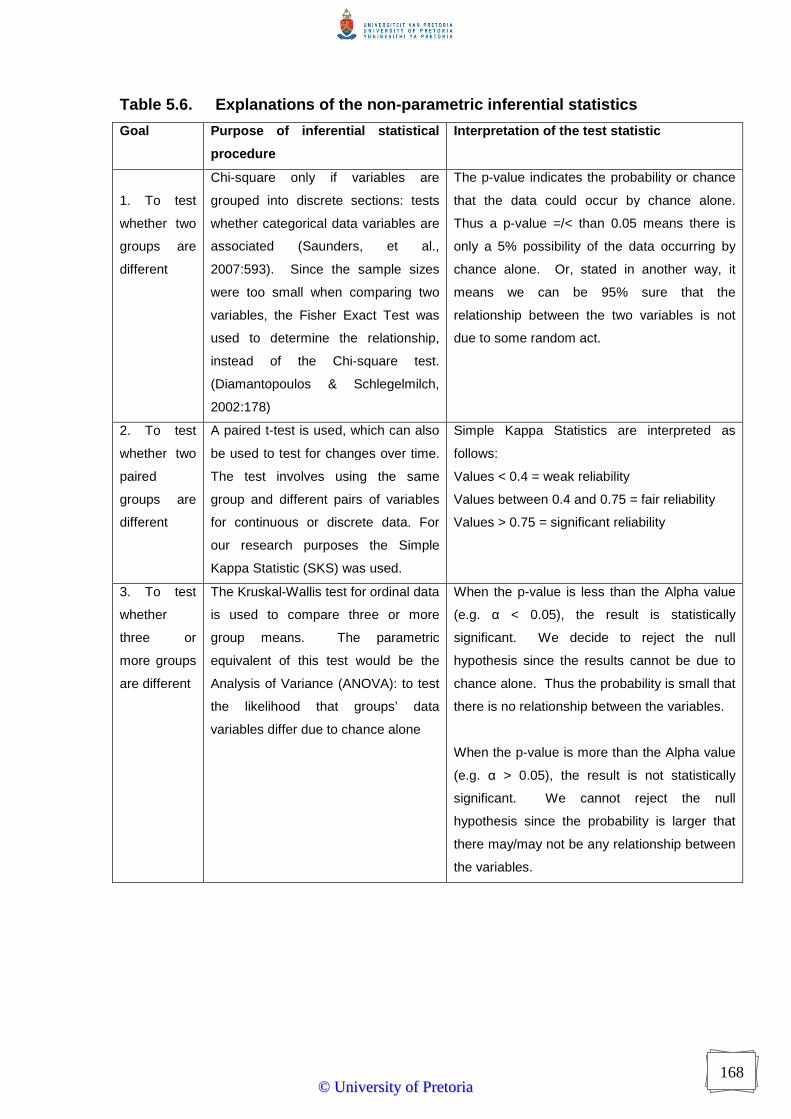
168
Table 5.6. Explanations of the non-parametric inferential statistics
Goal Purpose of inferential statistical
procedure
Interpretation of the test statistic
1. To test
whether two
groups are
different
Chi-square only if variables are
grouped into discrete sections: tests
whether categorical data variables are
associated (Saunders, et al.,
2007:593). Since the sample sizes
were too small when comparing two
variables, the Fisher Exact Test was
used to determine the relationship,
instead of the Chi-square test.
(Diamantopoulos & Schlegelmilch,
2002:178)
The p-value indicates the probability or chance
that the data could occur by chance alone.
Thus a p-value =/< than 0.05 means there is
only a 5% possibility of the data occurring by
chance alone. Or, stated in another way, it
means we can be 95% sure that the
relationship between the two variables is not
due to some random act.
2. To test
whether two
paired
groups are
different
A paired t-test is used, which can also
be used to test for changes over time.
The test involves using the same
group and different pairs of variables
for continuous or discrete data. For
our research purposes the Simple
Kappa Statistic (SKS) was used.
Simple Kappa Statistics are interpreted as
follows:
Values < 0.4 = weak reliability
Values between 0.4 and 0.75 = fair reliability
Values > 0.75 = significant reliability
3. To test
whether
three or
more groups
are different
The Kruskal-Wallis test for ordinal data
is used to compare three or more
group means. The parametric
equivalent of this test would be the
Analysis of Variance (ANOVA): to test
the likelihood that groups’ data
variables differ due to chance alone
When the p-value is less than the Alpha value
(e.g. α < 0.05), the result is statistically
significant. We decide to reject the null
hypothesis since the results cannot be due to
chance alone. Thus the probability is small that
there is no relationship between the variables.
When the p-value is more than the Alpha value
(e.g. α > 0.05), the result is not statistically
significant. We cannot reject the null
hypothesis since the probability is larger that
there may/may not be any relationship between
the variables.
©© UUnniivveerrssiittyy ooff PPrreettoorriiaa

169
4. To assess
the strength
of
relationship
between two
variables
Spearman’s rank correlation
coefficient (Spearman’s rho) or
Kendall’s rank correlation coefficient
(Kendall’s tau) for ranked data. The
parametric equivalent would be
Pearson’s product moment correlation
coefficient (PMCC) to test the strength
of the relationship
Source: Adapted from Saunders, et al., (2007: 442-444 and 591-614) and
Leedy & Ormrod (2005: 274) and Diamantopoulos & Schlegelmilch, (2002:
178).
5.7.3. Shortcomings and sources of error
Referring to hypotheses testing Cooper and Schindler (2003: 524) state that
we reject a Null Hypothesis (Ho) when finding a statistically significant
difference and therefore accept the Alternative Hypothesis (HA). When a
Type I error is committed, it means a true Ho is rejected (Leedy & Ormrod,
2005: 272, Cooper & Schindler, 2003: 525). The alpha value (∝) is called the
level of significance and is expressed at 5% for most main purposes of the
research analysis. The ∝ is the probability of rejecting the true Ho. This
means that the probability of making a correct decision not to reject Ho if Ho is
true; will equal 95%. With a Type 2 error, (β= which is pronounced Beta), the
researcher can fail to reject a false Ho.
Some of the data sets were not well represented when compiling contingency
tables during the comparative phase of data analyses. For this reason the
Chi-square (λ2) tests were not always appropriate for all comparisons and
issued warnings. For example, when using a contingency table where the
degrees of freedom (d.f.) equal 1, the expected frequency should be at least 5
in size. When degrees of freedom are more than one, less than 20% of the
expected frequencies should be smaller than 5, for the λ2 test to be used. The
λ2 test prefers expected frequencies not to be less than 1. As a result, the
©© UUnniivveerrssiittyy ooff PPrreettoorriiaa
170
decision was made to exclude the λ2 results in favour of using the Fisher
Rank test for all discussions and findings.
This phenomenon of having to substitute the Chi-square test with the Fisher
Rank test occurred when multivariate comparisons took place for example
measuring two groups, splitting them into gender groupings and splitting the
response types into a Likert scale as well. Thus there were too many options
to allow large enough respondents on particular questions, which made the
frequencies sometimes <5.
5.8. CONCLUSION
This chapter reintroduced the research problem, objectives and hypotheses
as first stated in chapter one. It explained the research design as being a
cross-sectional comparative study within the South African SCM context. The
sampling process was explained, highlighting the involvement of SCM
industry associations and the employees of participating organisations in the
empirical collection of data. The data collection process involved two phases
since the first questionnaire (TNA1) was distributed via e-mail and in phase 2,
the second and third questionnaires (TNA2 and TNA3) were administered on
site. Respondent questionnaires were checked for completeness and coded
manually, preceding their data capture for processing using the SAS system.
In conclusion, the results of the descriptive, comparative and inferential data
analyses will be discussed in the next chapter.
©© UUnniivveerrssiittyy ooff PPrreettoorriiaa

171
CHAPTER SIX RESEARCH FINDINGS
6.1. INTRODUCTION
6.2. DESCRIPTIVE STATISTICAL FINDINGS
6.3. HYPOTHESES AND INFERENTIAL STATISTICAL FINDINGS
6.4. SUMMARY OF FINDINGS IN TRAINING NEEDS
6.5. CONCLUSION
©© UUnniivveerrssiittyy ooff PPrreettoorriiaa

172
6.1. INTRODUCTION
This chapter presents the research findings of the empirical training needs
analysis conducted between July and October 2011. The respondents are
divided into two major groups i.e. managers and employees. The group of
employees is further sub-divided into their responses before the supply chain
management “awareness” intervention and after the event. Managers’
questionnaires were returned electronically during Phase 1 while employees’
questionnaires were completed manually in Phase 2 at the premises of their
business organisations. The abbreviations used to distinguish between
groups are as follows:
� For managers: Training Needs Analysis 1 is called TNA1
� For employees, before the SCM pitch: Training Needs Analysis 2 (TNA2)
� For employees, after the SCM pitch: Training Needs Analysis 3 (TNA3)
The chapter starts with descriptive and demographic information about the
two main groups of respondents, i.e. managers and employees. The
discussion is structured such that management feedback is reported first,
followed immediately by employees’ findings. The major differences
discovered about supply chain training needs displayed by respondents were
encapsulated in the hypotheses testing. The hypotheses’ statements and
findings from various statistical tests are presented. The previous chapter
explained the basis for the validity and reliability of the research instrument
whose results are presented here. In conclusion the chapter will capture and
highlight the main findings that are discussed in the final chapter.
6.2. DESCRIPTIVE STATISTICAL FINDINGS
This section describes the respondents’ gender, job title, industry description,
age, organisations’ number of employees, length of employment and number
of direct reports to the managers. The findings of the employees versus their
managers’ responses are similar except that the employees were not asked
about the size of their organisations, in case they did not know the answers.
©© UUnniivveerrssiittyy ooff PPrreettoorriiaa
173
Since TNA2 and TNA3 targeted employees at non-supervisory levels, they
were also not asked about the number of staff members reporting directly to
them. The findings of the managers are reported first.
6.2.1. DEMOGRAPHIC FINDINGS –MANAGERS
There were 123 management level respondents of which 70% are male and
30% are female. The senior management level of respondents at 35.83%
only marginally outnumbered the middle managers, which stood at 35%. The
third highest level of managerial hierarchy claimed is at the operational level
with 17.17% of the total respondents. This spread amongst levels of
managers indicates that using the professional associations to distribute the
questionnaire electronically yielded a response from diverse but relevant
decision makers in SCM. The distribution via e-mail decision in Phase 1 has
also been justified by another phenomenon. The phenomenon is that the
largest classification of work functions came from respondents who are
involved with all SC functions (33.61%). This classification includes those in
Procurement (20.49%) and Logistics/Transport at 10.66%. Altogether almost
two thirds of the managerial respondents are actually involved in the main
supply chain functions currently. This bodes well for the quality and
authenticity of their responses. The managers’ business levels are illustrated
in Figure 6.1.
©© UUnniivveerrssiittyy ooff PPrreettoorriiaa
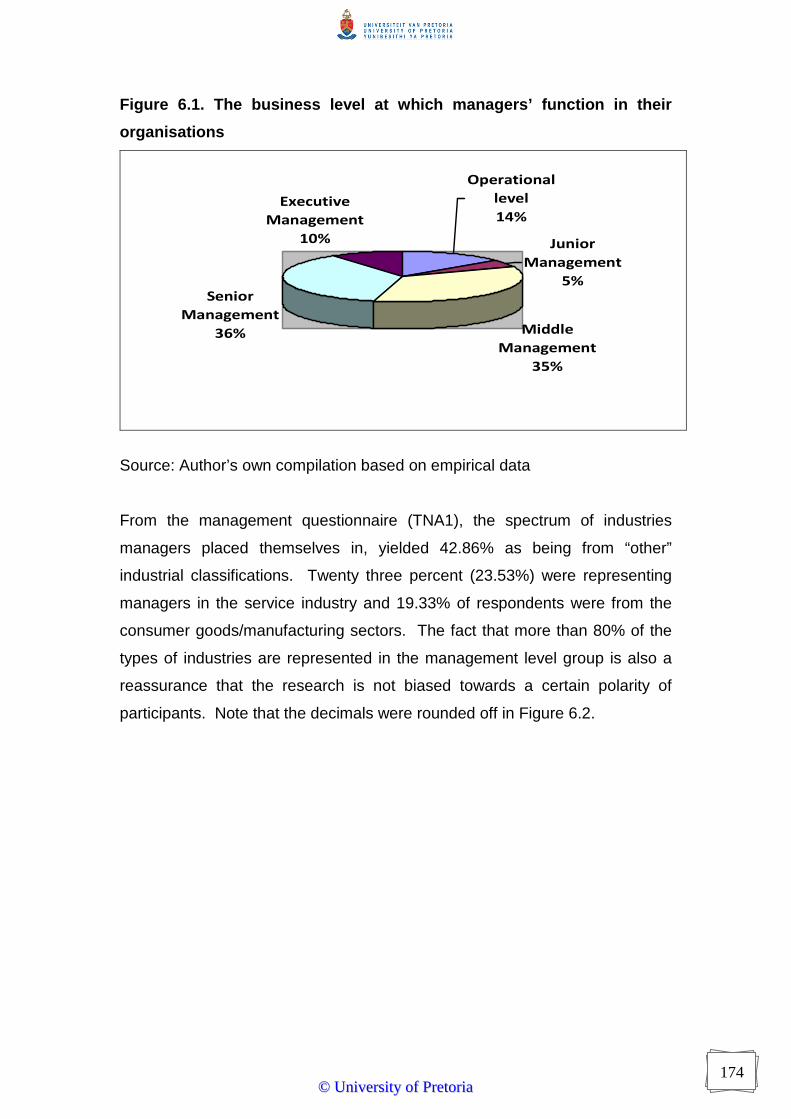
174
Figure 6.1. The business level at which managers’ function in their
organisations
Operational
level
14%
Junior
Management
5%
Middle
Management
35%
Senior
Management
36%
Executive
Management
10%
Source: Author’s own compilation based on empirical data
From the management questionnaire (TNA1), the spectrum of industries
managers placed themselves in, yielded 42.86% as being from “other”
industrial classifications. Twenty three percent (23.53%) were representing
managers in the service industry and 19.33% of respondents were from the
consumer goods/manufacturing sectors. The fact that more than 80% of the
types of industries are represented in the management level group is also a
reassurance that the research is not biased towards a certain polarity of
participants. Note that the decimals were rounded off in Figure 6.2.
©© UUnniivveerrssiittyy ooff PPrreettoorriiaa

175
Figure 6.2. The industrial sector in which managers’ placed their
organisations
24
11
19
22
43
0
5
10
15
20
25
30
35
40
45
Frequency
%
Supply chain services
Industrial goods
manufacturing
Consumer goods
manufacturing
Retailing
Supply chain information
technology
Other
Source: Author’s own compilation from research findings
The ages of the TNA1 management respondents ranged from between 21 to
70 years of age at the time of the survey in 2011. The first quartile ended
between ages 33-34 years at the 29.5th percentile, while the 75th percentile
started at age 45 years old. This means that the bulk of the managerial
respondents are between the ages of 35 and 45 years of age. Only five of the
respondents failed to state their ages out of the total of 123 respondents.
The size of the organisations that these managers worked for ranged from 3
employees to 180000. Note that the range of frequencies listed in Table 6.1.
below are not split up into equal parts due to large variations in organisational
size.
©© UUnniivveerrssiittyy ooff PPrreettoorriiaa

176
Table 6.1. The size of organisations according to employee numbers reported by the management group TNA1. Organisational size according to number of
employees
Actual
Frequency
Cumulative
Percentage
Between 3 and 500 employees 43 40.57%
Between 501 and 1000 employees 10 50.00%
Between 1001 and 1500 employees 06 55.66%
……..Between 1800 and 8000 employees 27 81.13%
……..Between 10000 and 50000 employees 19 99.06%
……..At 180000 employees 01 100.00%
The number of respondents who either “did not know” the number of
employees or merely neglected to answer the question equals 17 non-
respondents. Half of the respondents were from organisations with 1000 or
less employees. Eighty-one percent of the respondents had less than 8000
employees. The strange incidence (call it an outlier) is that a gradual
progression occurred in the growth of employee numbers, up to the 50 000
mark, thereafter only one organisation made the astronomical jump to 180
000 employees. The unknown factors about the organisations above are
twofold. Firstly we do not know how many of them conduct actual training
needs analyses for their staff members. The reason why the question was
not put forward to the management group is that one cannot be sure that all
the respondents would have known how to answer the question. Secondly
we also do not know whether performance reviews conducted by or
administered to the participating respondents would necessarily have resulted
in any training need being identified. It is therefore important to note that the
size of the organisation is not an indication of an organisation’s training
needs. The size of the respondents’ organisations can also not indicate the
type of training policies the organisation upholds.
The TNA1 respondents reported the duration (in years) they have been
employed by their particular organisations. The length of employment ranged
from 1 year to 37 years and the findings were as displayed in Table 6.2. which
follows:
©© UUnniivveerrssiittyy ooff PPrreettoorriiaa

177
Table 6.2. Length of employment with current organisations for managers Employment duration (in years) as at 2011 Actual
Frequencies
Cumulative
Percentage
1 - 5 years 56 47.86%
6 - 10 years 17 62.39%
11 -15 years 15 75.21%
16 - 20 years 16 88.89%
21 -25 years 09 96.58%
26 – 30 years 03 99.15%
31 – 35 years 00 99.15%
36 – 40 years 01 100.00%
Total response (n) 117
Non-response (n) 06
From the original data collected for Table 6.2, it appears that a quarter of the
management group (16+13= 29) were employed for two years or less in the
organisations from which they responded to the survey. A lesser part
(8+11+8 = 27) has been there for between 3-5 years. This incidence appears
a little odd considering the fact that the majority of the management group’s
ages ranged between 35-45 years of age. This could suggest that there are
rapid inter-organisational staff movements in the South African SC context
since 47% of the respondents have been employed for 5 years or less in their
current organisations. This may be normal in any industrial context, but may
require further delving into the South African industrial labour patterns in order
to further explain the phenomena.
In terms of employees who directly report to the TNA1 respondent
management group, 54% have an average of 3 direct reports. The manager
with the most number of staff reporting directly to him appears to be 300. It is
not clear what the organisational structure is for one manager to be
responsible for such a large number of employees. The next closest large
number was stated as 174 employees reporting to another manager, while
©© UUnniivveerrssiittyy ooff PPrreettoorriiaa
178
two managers reportedly have 100 employees respectively reporting to them.
The employee findings are reported on, next.
6.2.2. DEMOGRAPHIC FINDINGS –EMPLOYEES
There were 110 respondents amongst the non-managerial level of which 53%
are male and 47% are female. Only one respondent abstained from the
question on gender. The employees are more evenly split between males
and females than the TNA1 split was 70:30 in favour of males. In order to
encourage respondents to participate, the question on rank/ position was
omitted. The only question indicative of official employment is an open-ended
question on the respondent’s job title, which allowed them to describe how
they are known at their places of work. The resultant titles reflected the
nature of the organisation that participated in the study, but the respondents
remained anonymous in their responses. Employees were also not asked to
identify their organisation within the spectrum that managers were requested
to do, since it was not known how many employees would actually know the
answer to the question. The same principle was applied in the omission of
the question regarding the organisational size. As a result the respondents
were not distracted from answering the majority of the TNA2 and TNA3
questionnaires in full.
The ages of the respondents ranged from those between 19 to 60 years of
age at the time of the survey in 2011. Seven of the respondents failed to
state their ages out of the total of 110 respondents. The percentiles were
therefore calculated on 103 respondents. The first quartile for employees
ended between ages 27-28 years at the 25.75th percentile, while the 75th
percentile located between ages 41-42 years of age. This means that the
bulk of the employee respondents are between the ages of 29 and 40 years of
age. This range is noticeable different from the bulk of the manager
respondents who fell between 35-45 years of age.
The employee respondents reported their duration in terms of the number of
years they have been employed by their particular organisations. The
©© UUnniivveerrssiittyy ooff PPrreettoorriiaa

179
respondents’ answers stated as a “number of months equalling less than a
year”, were coded as being one year, since they would have completed a year
tenure by the time the findings are reported. The length of employment
ranged from 1 year to 32 years and the findings are listed in Table 6.3 below.
Six employees were non-respondents on this question.
Table 6.3. Length of employment with current organisations for Employees Employment duration in years as at 2011 Actual
Frequency
Cumulative
Percentage
1 –5 years 56 53.85%
6 – 10 years 21 74.04%
11 –15 years 11 84.62%
16 – 20 years 05 89.42%
21 –25 years 05 94.23%
26 – 30 years 04 98.08%
31 - 35 years 02 100.00%
Total (n) 104
From Table 6.3, it shows that the 74% of the respondents who participated in
TNA2 and TNA3 have been with their organisations for 10 years or less. This
74% of respondents and 26% employed for longer than 10 years, are shown
per year in the polygon below. From the original data, there is one employee
each for the categories who have been with their organisations for between
22-32 years.
©© UUnniivveerrssiittyy ooff PPrreettoorriiaa
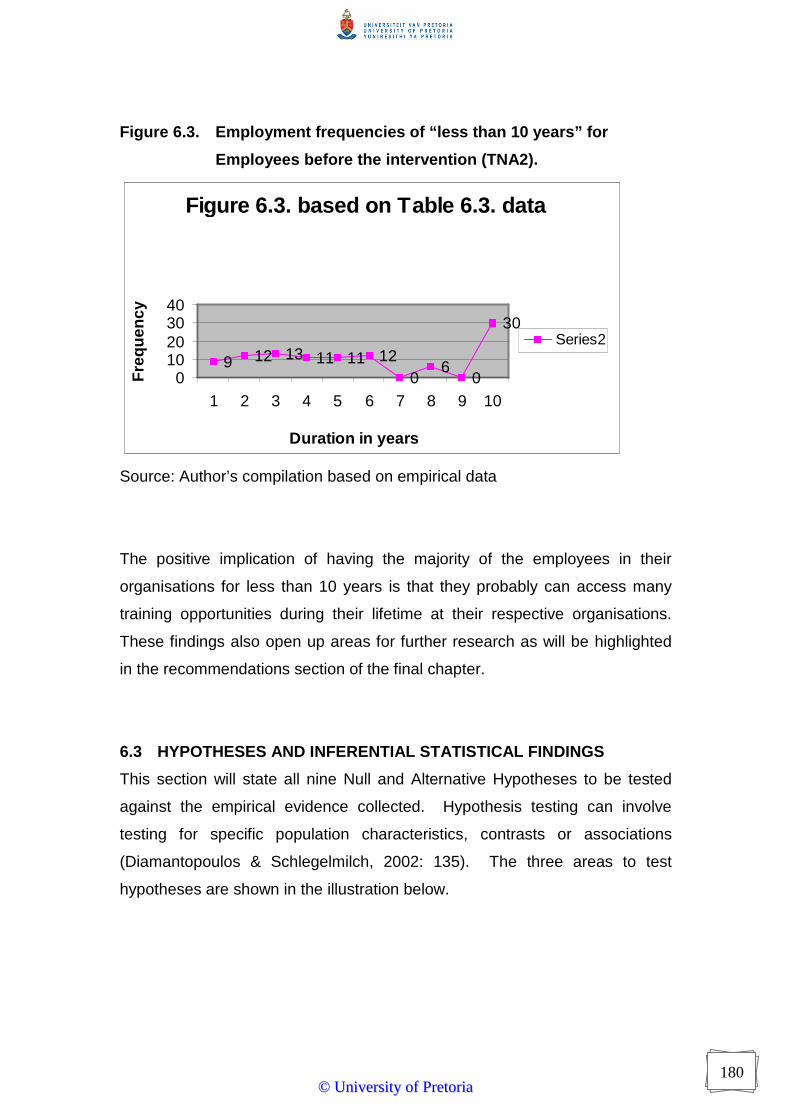
180
Figure 6.3. Employment frequencies of “less than 10 years” for
Employees before the intervention (TNA2).
Figure 6.3. based on Table 6.3. data
9 12 13 11 11 120
60
30
010203040
1 2 3 4 5 6 7 8 9 10
Duration in years
Fre
quen
cy
Series2
Source: Author’s compilation based on empirical data
The positive implication of having the majority of the employees in their
organisations for less than 10 years is that they probably can access many
training opportunities during their lifetime at their respective organisations.
These findings also open up areas for further research as will be highlighted
in the recommendations section of the final chapter.
6.3 HYPOTHESES AND INFERENTIAL STATISTICAL FINDINGS
This section will state all nine Null and Alternative Hypotheses to be tested
against the empirical evidence collected. Hypothesis testing can involve
testing for specific population characteristics, contrasts or associations
(Diamantopoulos & Schlegelmilch, 2002: 135). The three areas to test
hypotheses are shown in the illustration below.
©© UUnniivveerrssiittyy ooff PPrreettoorriiaa
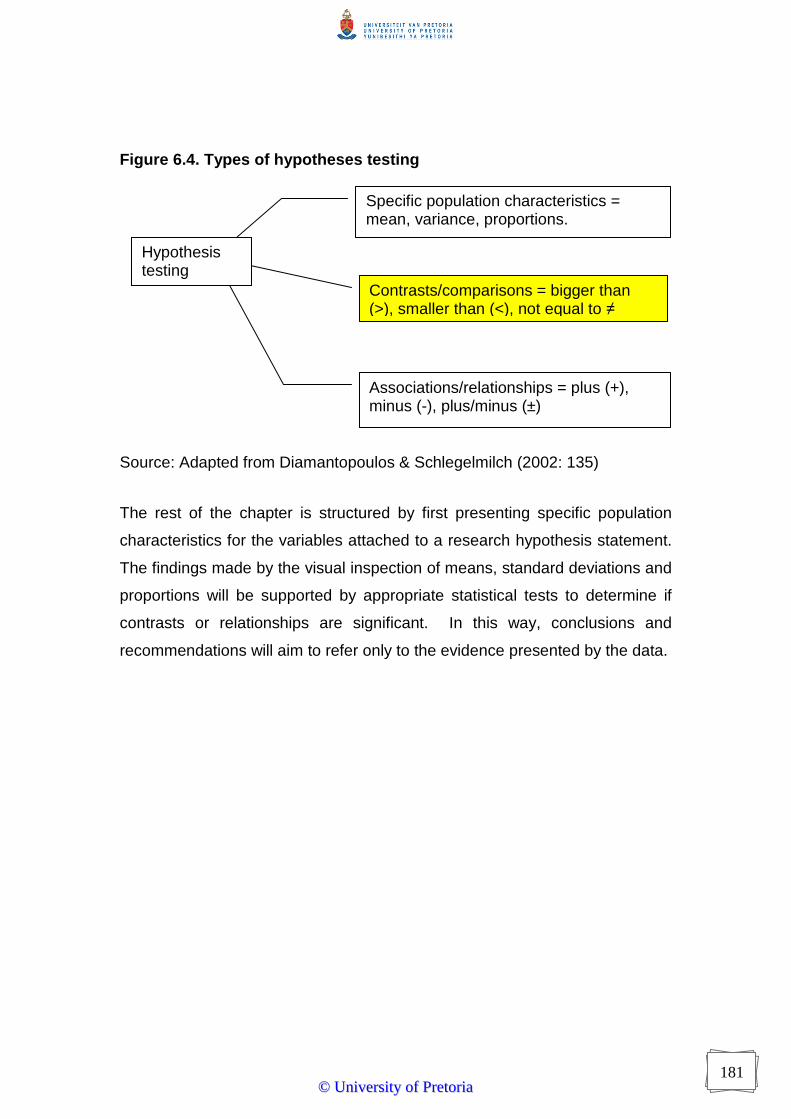
181
Figure 6.4. Types of hypotheses testing
Source: Adapted from Diamantopoulos & Schlegelmilch (2002: 135)
The rest of the chapter is structured by first presenting specific population
characteristics for the variables attached to a research hypothesis statement.
The findings made by the visual inspection of means, standard deviations and
proportions will be supported by appropriate statistical tests to determine if
contrasts or relationships are significant. In this way, conclusions and
recommendations will aim to refer only to the evidence presented by the data.
Specific population characteristics = mean, variance, proportions.
Contrasts/comparisons = bigger than (>), smaller than (<), not equal to ≠
Associations/relationships = plus (+), minus (-), plus/minus (±)
Hypothesis testing
©© UUnniivveerrssiittyy ooff PPrreettoorriiaa

182
6.3.1. SECTION ONE: TESTS OF PROPORTION
H10: There is no significant difference in the training received by
managers and employees in the preceding 12 months
H1A: There is a significant difference in the training received by
managers and employees in the preceding 12 months
TRAINING RECEIVED BY MANAGERS IN PRECEDING 12 MONTHS
It was important to determine whether managers have attended training in the
12 months preceding the research survey, instead of presuming that no
training was taking place in industry. Managers were presented with a list of
12 courses and had to select the ones they had attended in the 12 months
prior. The 12 courses were split into two categories namely technical skills
and soft skills for coding purposes. The two categories were decided on the
basis of “personal” manager skills or “job related” skills. Technical skills are
regarded for this study, as objective matters involving ‘less personal’ related
aspects. The technical skills grouping included training courses in software
computer skills, contract management, financial management skills, new
product training, occupational health and safety; transport and distribution;
and warehousing skills. Soft skills training included negotiation skills, people
skills, stress management, supervisory and time management skills. The
category of “Both” includes where the managers have indicated that they had
received both types of training. The data summary below represents a
classification of Technical Skills, Soft skills and a Combination of both
technical and soft skills; that the managers were sent on training for:
Table 6.4. The training received by the managers in the 12 months preceding the survey.
Non-response
Both Technical and Soft
Technical skills
Soft skills Total
20 42 39 22 123
From the Hypothesis 1 Table 6.4, it appears that 34% (42/123) of the
management group had training in both technical and soft skills, while 16.2%
©© UUnniivveerrssiittyy ooff PPrreettoorriiaa

183
(20/123) did not respond to this question. Possible reasons for the non-
response could include that they attended training in a time period outside of
the preceding 12 months under question, or alternatively that they were not
trained in the courses listed.
Since the list of 12 courses was not exhaustive, managers also had the option
to select “other” and describe the training they attended in their own words.
By referring to the “other” option, the open-ended answers yielded the
following courses listed in alphabetical order for the managers:
� advanced management training
� auditing training
� environmental/sustainability training
� forecasting
� lean manufacturing
� manufacturing
� presentation skills
� project management
� supply chain management training
� waste management
� writing skills
The only training courses where the management group recorded a frequency
higher than one (but less than five) included certified supply chain
management training, coaching skills training, exporting/customs training and
leadership training.
The value derived from the question on training received in the 12 months
preceding the survey, lies in the evidence that there can be as many
combinations and permutations of courses as there are managers willing to
be trained. This variety bodes well for the supply chain industry. Since the
management sample has attended training in the 12 months preceding the
research study, others can imitate.
©© UUnniivveerrssiittyy ooff PPrreettoorriiaa

184
TRAINING RECEIVED BY EMPLOYEES IN PRECEDING 12 MONTHS It was important to also determine whether employees attended training in the
12 months preceding the research survey, instead of presuming that no
training took place. The data summary for employees in Hypothesis 1 Table
6.5. represent a classification of Technical Skills, Soft skills and a
Combination of Both, exactly the same as what managers were sent on
training for: Similarly to the management questionnaire, the technical skills
grouping included training courses in software computer skills, contract
management, financial management skills, new product training, occupational
health and safety; transport and distribution; and warehousing skills. Soft
skills training included negotiation skills, people skills, stress management,
supervisory and time management skills. It is immediately noticeable how few
employee respondents had received soft skills training in the 12 months
preceding the survey (only 3 out the 110).
Table 6.5. The training received by employees in the 12 months preceding the survey.
Non-response
Both Technical and Soft
Technical skills
Soft skills Total
34 27 46 03 110
From Hypothesis 1 Table 6.5, it appears that only 25% (27/110) of the
employee group had training in both technical and soft skills, while 31%
(34/110) did not respond to this question. Potential reasons for the non-
response could include that they attended training in a time period outside of
the preceding 12 months under question, or that they were not trained at all.
Employees also had the option to select “other” and describe the training they
attended in their own words. By referring to the “other” option, the open-
ended employee answers yielded the following courses listed in alphabetical
order:
� emotional intelligence
� fire fighting
� marketing
©© UUnniivveerrssiittyy ooff PPrreettoorriiaa

185
� procurement training
� sales training
� System Analysis and Program Development (SAP) supervisor
� stock training
� super user training
The only training courses where the employee group recorded a frequency
higher than one (but less than five) included: asset management training,
disciplinary procedures/handling, supply chain management introduction,
project management and quantum lean manufacturing.
Hypothesis 1.1: There is no significant difference between Managers
(TNA1) and Employees “before” (TNA2) for training received in
preceding 12 months
Hypothesis 1.1. Table 6.6 summarises the Frequencies and Percentages of
both the managers and the employees. The data shown in H1.1 Table 6.6
exclude Missing Frequencies of the 20 Managers’ non-response and 34
Employees non-responses on the question of training received in the 12
months preceding the survey. The two-sample Chi-Square statistical test for
nominal data resulted in a warning due to the amount of missing responses.
Therefore the Fisher Exact Test was used to test for a significant result.
Table 6.6. Contingency table between TNA1 and TNA 2 on “hard, soft and Combination of both” training skills Group Both Technical
and Soft Skills Soft Skills
Technical Skills
Total
TNA1 /Managers 42 22 39 103 Frequency % 40.78% 21.36% 37.86% TNA2 / Employees 27 03 46 76 Frequency % 35.53% 03.95% 60.53% Total (effective sample size)
69 25 85 179
Frequency Missing 54 Fisher’s Exact Test Pr< = P: 4.917E-04 which means that the result is less
than 0.0001
In the analysis of the 9 hypotheses the reader is reminded that training needs
analyses are abbreviated to TNA. Hypotheses may be abbreviated to H….
©© UUnniivveerrssiittyy ooff PPrreettoorriiaa

186
The empirical evidence shows that there is mostly technical training taking
place amongst employees, which is proportionately different from the training
received by managers. The Null hypothesis H1.1 0 is rejected due to
Fisher’s Exact test yielding a significant result less than 0.05, when testing at
the 95% significance level. The fact that a more significant portion of the
management group received soft skills training compared to the non-
managerial level employees indicates a difference in training received in the
preceding 12 months.
Hypothesis 1.2: There is no significant difference between Managers
(TNA1) and Employees “after” (TNA3) for training received in preceding
12 months
Hypothesis 1.2. Table 6.7 summarises the Frequencies and Percentages of
both the managers and the employees. H1.2. Table 6.7 excludes Missing
Frequencies of the 20 Managers’ non-response and 35 Employees non-
responses on the question of training received in the 12 months preceding the
survey. The two-sample Chi-Square statistical test for nominal data resulted
in a warning due to the amount of missing responses. Therefore the Fisher
Exact Test was used to test for a significant result.
Table 6.7. Contingency table between TNA1 and TNA3 on “hard, soft and combination of both” training skills Group Both Technical
and Soft Skills Soft Skills
Technical Skills
Total
TNA1 /Managers 42 22 39 103 Frequency % 40.78% 21.36% 37.86% TNA3 / Employees 19 3 45 67 Frequency % 28.36% 4.48% 67.16% Total (effective sample size)
61 25 84 170
Frequency Missing 55 Fisher’s Exact Test Pr< = P: 1.900E-04 which means that the result is less
than 0.0001
Besides the attrition of nine less employee participants during the “after”
session of data collection, there is also a significant difference at the 95%
In the analysis of the 9 hypotheses the reader is reminded that training needs
analyses are abbreviated to TNA. Hypotheses may be abbreviated to H….
©© UUnniivveerrssiittyy ooff PPrreettoorriiaa

187
level. Fisher’s Exact Test yielded a result of smaller than 0.05 and confirms
that the discrepancy between technical, soft skills training and the
combination of both is a significant difference. Both Hypothesis 1.1 and
Hypothesis 1.2 are therefore rejected. However, we still have to check
whether employees from TNA2 and TNA3 have changed their training
experience answers within the 48 hours of reflection they encountered
between answering the questionnaires.
Hypothesis 1.3: There is no significant difference between “Employees
Before (TNA2) and Employees After (TNA3)” in training received in
preceding 12 months
Hypothesis 1.3. Table 6.8 summarises the Frequencies and Percentages of
the employees before and after the supply chain awareness intervention.
H1.3. Table 6.8 excludes 49 Missing Frequencies of combined data sets on
the question of training received in the 12 months preceding the survey. The
two-sample statistical test for nominal data with related samples is used. The
Simple Kappa test, which is similar to the McNemar before and after test, was
used to test for a significant result. Data are however presented in a three-
way contingency table, while McNemar would have used a 2-way contingency
table. The key to interpreting the Simple Kappa Statistic for dependent
samples is as follows:
Values < 0.4 = weak reliability
Values between 0.4 and 0.75 = fair reliability
Values > 0.75 = significant reliability
In the analysis of the 9 hypotheses the reader is reminded that training needs
analyses are abbreviated to TNA. Hypotheses may be abbreviated to “H”….
©© UUnniivveerrssiittyy ooff PPrreettoorriiaa

188
Table 6.8. Contingency table between TNA2 and TNA3 on “hard, soft and combination of both” training skills Group Employees Before (TNA2) Employees After (TNA3) Both Technical
and Soft Skills Soft Skills Technical
Skills Total
Both Technical and Soft Skills
18 01 01 19
Frequency % 94.74% 0.00 1.61% Soft Skills 01 01 00 02 Frequency % 50.00% 50.00% 0.00 Technical Skills 03 00 38 41 Frequency % 07.32% 0.00% 92.68% Total (effective sample size) 22 01 39 62 Frequencies Missing 49 Simple Kappa Statistic (SKS)
Since SKS =0.8301 the result is significant, therefore reject the null hypothesis
The reasoning behind not using the Chi-square test for nominal data is that
the employees for the two groups TNA2 and TNA3 are the same respondents.
The two groups are therefore related or dependent samples. Since the SAS
program was used for the data analysis (which has less functionality than
SPSS), the Simple Kappa Statistic for non-parametric statistics was more
useful.
Thus we can conclude the results for Hypothesis One by noting that there are
training gaps in existence between Managers (TNA1) and Employees Before
(TNA2); and between Managers (TNA1) and Employees After (TNA3) as it
pertains to receiving “Soft skills, Technical Skills or Both” in the 12 months
preceding the research project. There is also a significant difference between
Employees Before (TNA2) and Employees After (TNA3) with regards to
receiving “Soft skills, Technical Skills or Both” in the 12 months preceding the
research project. The implications of these findings are discussed in chapter
seven. The conclusion of the Hypothesis One results can be illustrated as in
Figure 6.4 below:
©© UUnniivveerrssiittyy ooff PPrreettoorriiaa

189
Figure 6.5. Conclusion of tests for Hypotheses One variables
Source: Author’s own compilation
INTERPRETATION OF HYPOTHESIS 1
The H1 null hypothesis that there is no significant difference in the proportions
of training received in the 12 months preceding the survey, between
managers and employees was rejected. Gaps existed between TNA1-TNA2,
between TNA1-TNA3 and between TNA2-TNA3. The results were obtained
by using Fisher’s Exact test on contingency tables for independent samples
and the Simple Kappa Test for dependent samples. This hypothesis used 12
courses to determine whether all respondents (managers and employees)
have undergone training in the preceding 12 months for any of the courses
listed. The dichotomous nature of the answer, made it necessary to split 7 of
the courses as “technical skills” and the remainder was labelled “soft skills” for
ease of analysis. Since the technical skills included most functions of supply
chain management, it was increasingly obvious that employees only had
exposure to technical skills in the preceding 12 months. The gap that must be
bridged before employees can grow and/or move into managerial type
positions would thus include soft skills such as negotiation, stress
management, supervisory, time management and general people skills.
Hypothesis two follows…
TNA1 TNA2
TNA3
Reject H1.10
Reject H1.3.0 Reject H1.2.0
©© UUnniivveerrssiittyy ooff PPrreettoorriiaa

190
6.3.2. SECTION TWO: TESTS OF BOTH INDEPENDENT AND
DEPENDENT GROUPS ON 3+ MEASURES
H20: There is no significant difference in the opinion of managers and
employees with regard to the preferred formats of training for
employees
H2A: There is a significant difference in the opinion of managers and
employees with regard to the preferred formats of training for
employees
The questions targeted managers’ response on the formats of training they
preferred for their staff and thereafter asked employees which formats of
training they preferred for themselves. The response options include “never,
sometimes and always” and were arranged in a Likert scale format of never =
1, sometimes = 2 and always = 3. The variables under consideration are
listed in the following sequence:
1. On the job training
2. In-house training
3. Seminar/conference training
4. Short course training
5. Product training
6. Distance education
7. Self training
8. Online/web/internet courses
Each of the eight variables will be discussed from the data collected from
TNA1 (managers), TNA 2 (employees, before the intervention) and TNA 3
(after the intervention). It is important to note that the managers’ responses
are recorded from 123 questionnaires for TNA1, while TNA 2 had 110
respondents and TNA3 with attrition, had 102 respondent employees.
In the analysis of the 9 hypotheses the reader is reminded that training needs
analyses are abbreviated to TNA. Hypotheses may be abbreviated to “H”….
©© UUnniivveerrssiittyy ooff PPrreettoorriiaa

191
In order to understand the flow of the Hypothesis Two findings, an
example is shown to demonstrate how the results are structured:
For example- for the variable “on the job training”:
Hypothesis 2.1(i): The results show the comparison between Managers
(TNA1) and Employees Before (TNA 2). The concluding remarks will list it as
TNA1-TNA2.
Hypothesis 2.1(ii): There is no significant difference between Managers
(TNA1) and Employees After (TNA3) preference for “on the job” training. The
concluding remarks will list it as TNA1-TNA3.
Hypothesis 2.1(iii): There is no significant difference between Employees
Before (TNA2) and Employees After (TNA3) preference for “on the job”
training. The concluding remarks will list it as TNA2-TNA3.
The findings are first recorded in frequencies, followed by comparative
contingency tables between sample groups, TNA1, TNA2 and TNA3. The
decision to reject or accept the hypothesis is provided before the subsequent
set of samples’ findings are presented. All formats of training (showing the 8
variables’ results) are summarised, before reporting on the findings for
Hypothesis Three. Without further ado, the results for hypothesis two follow.
The first type of format for training under consideration, tests how often
managers and employees want to use the format of training that is mainly “on
the job”.
Hypothesis 2.1(i): There is no significant difference between “Managers
(TNA1) and Employees before (TNA2)” preference for “on the job”
training
Table 6.9: Frequencies for the format of training “on-the-job” NB: Frequencies recorded where TNA1 =123, TNA2 = 110 and TNA3=102
TNA1/ MNGT
TNA2 / EMP
TNA3 / EMP
Never = 1 01.05 02.80 05.05 Sometimes = 2 28.42 41.12 44.44 Always = 3 70.53 56.07 50.51
In the analysis of the 9 hypotheses the reader is reminded that training needs
analyses are abbreviated to TNA. Hypotheses may be abbreviated to “Hn.n”.….
©© UUnniivveerrssiittyy ooff PPrreettoorriiaa

192
The frequency responses show that the management industry norm is to
prefer the format of “on-the-job” training. The descriptive statistics from Table
6.9. show that more than 70% of the management response selected
“always” to indicate their preference. Employees were more split between
“sometimes” and “always” for TNA 2. However more employees started
saying “never” for on-the job training in the TNA 3 sessions as opposed to
“always” in the TNA2 sessions.
The correlation test between the TNA1 group of managers and the TNA2
group of employees yields an effective sample size of 202, with 31
frequencies missing.
Table 6.10. Correlation between TNA1 and TNA2 on the format of training “on-the-job” Variable: On-the-job-training
TNA2 Employees
TNA1 Managers
Fisher’s Exact Test
1 2 3 1 2 3 Frequency 3 44 60 1 27 67 Percentage (%) 2.8 41.12 56.07 1.05 28.42 70.53 Pr<=0.09
Note that the H2 Table 6.10. uses the same legend of H2 Table 1 where 1=
Never, 2 = Sometimes and 3 = Always. The probability that this difference in
preference between managers and employees is due to chance alone is
larger than 0.05 at the 5% significance level, at two degrees of freedom.
Therefore there is no statistical difference between the managers (TNA1)
and employees’ preferences (TNA2) for on-the-job-training, before the
intervention. The decision is not to reject the null hypothesis.
Hypothesis 2.1(ii): There is no significant difference between Managers
(TNA1) and Employees After (TNA3) preference for “on the job” training
The correlation test between the TNA1 group of managers and the TNA3
group of employees yields an effective sample size of 194, with 31
frequencies missing.
©© UUnniivveerrssiittyy ooff PPrreettoorriiaa

193
Table 6.11. Correlation between TNA1 and TNA3 on the format of training “on-the-job” Variable: On-the-job-training
TNA3 Employees
TNA1 Managers
Fisher’s Exact Test
1 2 3 1 2 3 Frequency 5 44 50 1 27 67 Percentage (%) 5.05 44.44 50.51 1.05 28.42 70.53 Pr<=0.0085
The probability that this difference in preference between managers and
TNA3 employees is due to chance alone is smaller than 0.05 at the 5%
significance level, at two degrees of freedom. Therefore there is a
statistical difference between the managers (TNA1) and employees’
preferences (TNA3) for on-the-job-training, after the intervention. The
decision is to reject the null hypothesis.
Summarising the findings for the variable “on the job” training, the null
hypotheses is not rejected for groups TNA1-TNA2 but rejected between
TNA1-TNA3. This means that there are significant differences between
managers and employees (TNA3) on their preference for on-the-job training.
The next step is to examine the findings between TNA2-TNA3.
Hypothesis 2.1(iii): There is no significant difference between
Employees Before (TNA2) and Employees After (TNA3) preference for
“on the job” training
The correlation test between the TNA2 and TNA 3 groups of employees yields
an effective sample size of 98, with 13 frequencies missing. Note that
1=never, 2=sometimes and 3=always in the following table.
©© UUnniivveerrssiittyy ooff PPrreettoorriiaa

194
Table 6.12. Simple Kappa Test between “Employees before (TNA2) and Employees after (TNA3)” with their preference for “on-the- job” training Group Employees Before (TNA2) Employees After (TNA3) 1= Never 2= Sometimes 3= Always Total 1= Never 01 03 01 05 2= Sometimes 02 26 15 43 3= Always 00 10 40 50 Total (effective sample size)
03 39 56 98
Frequencies Missing 13 Simple Kappa Statistic (SKS)
Since SKS =0.4057 the result is fair. Therefore we cannot reject the null hypothesis.
The Simple Kappa test works on the same principle as the McNemar Before
and After test. The McNemar test cannot be applied here since the data are
not dichotomous in nature. The principle of testing symmetry still applies. In
other words, the TNA2-TNA3 test is trying to determine if employees changed
their minds after the SCM awareness intervention or not.
INTERPRETATION OF THE FINDINGS ABOUT ON-THE-JOB TRAINING
The discrepancy between TNA1-TNA2 showed similar perceptions
[therefore could not reject H2.1 (i)] null hypothesis. However the employees
in the comparison between TNA1-TNA3 changed their minds about “on-the-
job” training preferences [therefore we could reject H2.1. (ii)]. For the paired
samples of TNA2-TNA3, the employees’ Simple Kappa Statistic was fair
[therefore could not reject H2.1. (iii)]. It appears that the old traditional
method of training staff has been heavily relied upon and accepted as
common practice amongst managers. Perhaps in the year 2013, the future
requires a deeper enquiry as to employee preferences for on-the-job training
when they may well prefer using other alternatives.
©© UUnniivveerrssiittyy ooff PPrreettoorriiaa

195
HYPOTHESIS 2 (CONTINUED) FOR THE VARIABLE: IN-HOUSE
TRAINING
The following results pertain to the variable of the format of in-house training.
Note that the frequencies recorded are for differing sample sizes where TNA1
=123, TNA2 = 110 and TNA3=102.
Hypothesis 2.2. (i): There is no significant difference between Managers (TNA1) and Employees Before (TNA2) preference for “in-house” training
Table 6.13. Frequencies for the format of training: “In-house” NB: Frequencies recorded where TNA1
=123, TNA2 = 110 and TNA3=102
TNA1/ MNGT
TNA2 / EMP
TNA3 / EMP
Never = 1 04.31 16.50 11.96 Sometimes = 2 64.52 54.37 54.35 Always = 3 31.18 29.13 33.70
The different responses between TNA1 and TNA2 show that employees are
12% less enchanted with in-house training than what managers prefer. From
TNA3, more employees (about 4%) started seeing “in-house” training as an
“always” option as opposed to “never”.
The comparison between the TNA1 group of managers and the TNA2 group
of employees yields an effective sample size of 195, with 38 frequencies
missing.
Table 6.14. Frequencies for the correlation on format of training: “in- house training” for TNA1-TNA2 Variable: In-house training
TNA2 Employees
TNA1 Managers
Fisher’s Exact Test
1 2 3 1 2 3 Frequency 17 56 30 3 60 29 Percentage 16.50 54.37 29.13 3.26 65.22 31.52 Pr<=0.0078
The probability that this difference in preference between managers and
employees is due to chance alone is less than 0.05 at the 5% significance
level, at two degrees of freedom. Therefore there is a statistical difference
between the managers (TNA1) and employees’ preferences (TNA2) for
in-house training, before the intervention. The results for the TNA1-
TNA2 comparison on the format of “in-house” training demonstrate that
©© UUnniivveerrssiittyy ooff PPrreettoorriiaa

196
the null hypothesis should be rejected. The following sets of data refer to
the TNA1-TNA3 findings.
Hypothesis 2.2 (ii): There is no significant difference between Managers
(TNA1) and Employees “after” (TNA3) preference for “in-house” training
The comparison between the TNA1 group of managers and the TNA3 group of employees
yields an effective sample size of 184, with 41 frequencies missing.
Table 6.15. Correlation on format of training: “in-house” for TNA1-TNA3 Variable: In-house training
TNA3 Employees
TNA1 Managers
Fisher’s Exact Test
1 2 3 1 2 3 Frequency 11 50 31 3 60 29 Percentage 11.96 54.35 33.70 3.26 65.22 31.52 Pr<=0.0603
The probability that this difference in preference between managers and
employees is due to chance alone is more than 0.05 at the 5% significance
level, at two degrees of freedom. Therefore there is no statistical
difference between the managers (TNA1) and employees’ preferences
(TNA3) for in-house training, after the intervention. We cannot reject the
null hypothesis on the “in-house” training format since the test statistic
exceeds the critical value of 0.05. The subsequent set of findings stem from
the TNA2-TNA3 sets of data.
©© UUnniivveerrssiittyy ooff PPrreettoorriiaa

197
Hypothesis 2.2 (iii): There is no significant difference in the proportion
of “Employees before (TNA2) and Employees after (TNA3)” preference
for “in-house” training
The correlation test between the TNA2 and TNA 3 groups of employees yields
an effective sample size of 92, with 19 frequencies missing. Note that
1=never, 2=sometimes and 3=always in the following table.
Table 6.16. Correlation between “Employees before (TNA2) and Employees after (TNA3)” on the format of “in-house” training Group Employees Before (TNA2) Employees After (TNA3) 1= Never 2=
Sometimes 3= Always Total
1= Never 08 03 00 11 2= Sometimes 03 38 09 50 3= Always 02 10 19 31 Total (effective sample size) 13 51 28 92 Frequencies Missing 19 Simple Kappa Statistic (SKS)
Since SKS =0.4934 the result is fair. Therefore we cannot reject the null hypothesis.
INTERPRETATION OF THE FINDINGS ABOUT IN-HOUSE TRAINING
The discrepancy between TNA1-TNA2 showed different perceptions
[therefore could reject H2.2 (i)] null hypothesis. However the employees in
the comparison between TNA1-TNA3 changed their minds about “in-
house” training preferences [therefore could not reject H2.2. (ii). The cause
of the changed preference is unknown. For the paired samples of TNA2-
TNA3, the employees’ Simple Kappa Statistic was fair [therefore could not
reject H2.2. (iii)]. It appears that the well-known method of using in-house
training is also up for review in current business practices. Perhaps a
misunderstanding or misinterpretation exists between management and
employees on the nature and/or value of using in-house training for staff
development.
©© UUnniivveerrssiittyy ooff PPrreettoorriiaa

198
Hypothesis 2 (continued) for the variable: SEMINAR/CONFERENCE
TRAINING
The next comparison is for the variable: seminar /conference training. Note
that the frequencies recorded are for differing sample sizes where TNA1
=123, TNA2 = 110 and TNA3=102.
Hypothesis 2.3 (i): There is no significant difference between “Managers
(TNA1) and Employees before (TNA2)” preference for “seminar/ conference”
training
Table 6.17. Frequencies for the format of training: “seminar/ conference” NB: Frequencies recorded where TNA1
=123, TNA2 = 110 and TNA3=102
TNA1/ MNGT
TNA2 / EMP
TNA3 / EMP
Never = 1 12.22 09.09 14.61 Sometimes = 2 74.44 56.57 51.69 Always = 3 13.33 34.34 33.71
The difference between TNA1 and TNA 2 is that 74% of managers prefer to
“sometimes” send their employees to attend seminars/conferences as part of
the employee training, while 90% of employees prefer going to seminars and
conferences as a method of training themselves. The difference between
TNA2 and TNA3 is that about 5% of employees changed from “sometimes” to
“never” in TNA3.
There were 11 non-respondents in the TNA2 study and marginally more (13)
TNA3 non-respondents after 48 hours of measurement.
©© UUnniivveerrssiittyy ooff PPrreettoorriiaa

199
The correlation between the TNA1 group of managers and the TNA2 group of
employees yields an effective sample size of 188, with 45 frequencies
missing.
Table 6.18. Frequencies for the format of training “seminar/ conference training” Variable: Seminars/ conferences
TNA2 Employees
TNA1 Managers
Fisher’s Exact Test
1 2 3 1 2 3 Frequency 9 56 34 10 67 12 Percentage 9.09 56.57 34.34 11.24 75.28 13.48
Pr<= 0.0036 The probability that this difference in preference between managers and
employees is due to chance alone is less than 0.05 at the 5% significance
level, at two degrees of freedom. Therefore there is a statistical difference
between the managers (TNA1) and employees’ preferences (TNA2) for
using the seminars/conferences training format, before the intervention.
The decision is to reject the null hypothesis. The following comparison is
based on the TNA1-TNA3 preferences for seminar/conference training.
Hypothesis 2.3 (ii): There is no significant difference between “Managers
(TNA1) and Employees after (TNA3)” preference for “seminar/
conference” training
The correlation between the TNA1 group of managers and the TNA3 group of
employees yields an effective sample size of 178, with 47 frequencies
missing.
Table 6.19. Frequencies for the format of training: “seminar/ conference” Variable: Seminars/ conferences
TNA3 Employees
TNA1 Managers
Fisher’s Exact Test
1 2 3 1 2 3 Frequency 13 46 30 10 67 12 Percentage 14.61 51.69 33.71 11.24 75.28 13.48
Pr<= 0.0023 The probability that this difference in preference between managers and
employees is due to chance alone is less than 0.05 at the 5% significance
©© UUnniivveerrssiittyy ooff PPrreettoorriiaa

200
level, at two degrees of freedom. Therefore there is a statistical difference
between the managers (TNA1) and employees’ preferences (TNA3) for
using the seminars/conferences training format, before the intervention.
The null hypothesis can therefore be rejected.
Table 6.20. Simple Kappa Test between the “Employees before (TNA2) and Employees after (TNA3)” in their preference for “seminar/conference” training Group Employees Before (TNA2) Employees After (TNA3) 1= Never 2=
Sometimes 3= Always Total
1= Never 04 07 02 13 2= Sometimes 01 37 05 43 3= Always 00 07 23 30 Total (effective sample size) 05 51 30 86 Frequencies Missing 25 Simple Kappa Statistic (SKS)
Since SKS =0.5536 the result is fair. We therefore cannot reject the null hypothesis.
INTERPRETATION OF THE FINDINGS ABOUT
SEMINAR/CONFERENCE TRAINING
There was no change in the TNA1-TNA2 and the TNA1-TNA3
comparisons, therefore we could reject both H2.3 (i) and H2.3 (ii) null
hypotheses. The null hypotheses stated that there were no significant
differences between managers and employees on the issue of
seminars/conferences as a way of training. By rejecting both null
hypotheses we can conclude that there is a significant difference in the
way managers and employees have experienced seminars and
conferences. The decisions to reject the null hypotheses are indicative of
face and sample validity since industrial practice may make a distinction
between whether certain ranks of employees might be exposed to the
same ‘privileges” of using seminars and conferences as training
mechanisms. Managers concentrated on using seminars and conferences
only “sometimes”, while both TNA2 and TNA 3 respondents were
concentrated more on “sometimes” and “always. This phenomenon
strongly suggests that this form of training is something employees may
want to explore but that managers may not readily assent to employees
attending seminars/conferences.
©© UUnniivveerrssiittyy ooff PPrreettoorriiaa

201
INTERPRETATION OF THE FINDINGS ABOUT SEMINAR/
CONFERENCE TRAINING (CONTINUED)
Although this conclusion may seem premature, the Simple Kappa Statistic
measured for employees alone (TNA2-TNA3) reinforce the findings. The
H2.3 (iii) hypothesis stated that there was no significant difference between
employees before and after the intervention. By looking at employees’
responses apart from managers, the employee preference seems
substantiated. The result of the Simple Kappa test was fair and the null
hypothesis for H2.3 (iii) cannot be rejected. This means that employees did
not change their minds about their preferences for seminars and conference
even though they had a supply chain awareness intervention. Employees
would sometimes/always prefer to have this option as a training mechanism
whereas managers leaned more overwhelmingly only toward “sometimes”!
In future, businesses may need to incorporate this form of training in a
sustainable way to allow their employees some benefit from training through
seminars and conferences.
©© UUnniivveerrssiittyy ooff PPrreettoorriiaa

202
HYPOTHESIS 2 (CONTINUED) FOR THE VARIABLE: SHORT COURSES
The next variable to be compared under H2 is that of preferences for short
courses.
The succeeding variable of “short course training is used to compare
managers and employees’ perceptions.
Hypothesis 2.4 (i): There is no significant difference between Managers (TNA1) and Employees “before” (TNA2) preference for “short-course” training
Table 6.21. Frequencies for the format of training: “short course training” NB: Frequencies recorded where TNA1
=123, TNA2 = 110 and TNA3=102
TNA1/ MNGT
TNA2 / EMP
TNA3 / EMP
Never = 1 05.00 01.90 03.19 Sometimes = 2 62.00 39.05 40.43 Always = 3 28.00 59.05 56.38
From TNA 1 we find that 62% of managers think it is only “sometimes”
preferred as a means to train employees. In contrast, from TNA2 it shows
that 59% of employees always prefer using short courses as a method of
training themselves. Twenty-eight respondents from the management side
declined to state their preferences. The difference in frequencies between
TNA2 and TNA 3 was a tiny employee movement away from short courses
from “always” to both “sometimes” and “never”. TNA 2 had 5 non-
respondents and TNA 3 had 8 non-responses.
The correlation between the TNA1 group of managers and the TNA2 group of
employees yields an effective sample size of 200, with 33 frequencies
missing.
Table 6.22. Format of training “short course training” Fisher’s Exact Test for TNA2-TNA1 Variable: Short course training
TNA2 Employees
TNA1 Managers
Fisher’s Exact Test
1 2 3 1 2 3 Frequency 2 41 62 5 62 28 Percentage 1 20.50 31.00 5.26 65.26 29.47 Pr<=
6.712E-05
©© UUnniivveerrssiittyy ooff PPrreettoorriiaa

203
The probability that this difference in preference between managers and
employees is due to chance alone is less than 0.0001 at the 5% significance
level, at two degrees of freedom. Therefore there is a statistical difference
between the managers (TNA1) and employees’ preferences (TNA2) for
using format of short courses, before the intervention. The null
hypothesis can thus be rejected.
Hypothesis 2.4 (ii): There is no significant difference between “Managers (TNA1) and Employees After (TNA3)” preference for “short-course” training The correlation between the TNA1 group of managers and the TNA3 group of
employees yields an effective sample size of 189, with 36 frequencies
missing.
Table 6.23. Fisher’s Exact Test for TNA3-TNA1 for the format of training: “short course training” Variable: Short course training
TNA3 Employees
TNA1 Managers
Fisher’s Exact Test
1 2 3 1 2 3 Frequency 3 38 53 5 62 28 Percentage 3.19 40.43 56.38 5.26 65.26 29.47 Pr<=
5.760E-04
The probability that this difference in preference between managers and
employees is due to chance alone is less than 0.0001 at the 5% significance
level, at two degrees of freedom. Therefore there is a statistical difference
between the managers (TNA1) and employees’ preferences (TNA3) for
using the format of short courses, after the intervention. Therefore the
null hypothesis can also be rejected here.
Hypothesis 2.4 (iii): There is no significant difference between “Employees before (TNA2) and Employees after (TNA3)” preference for “short course training”.
Table 6.24. Contingency table for Employees Before (TNA2) and Employees After (TNA3) preference for “short course” training Group Employees Before (TNA2) Employees After (TNA3) 1= Never 2=
Sometimes 3= Always Total
©© UUnniivveerrssiittyy ooff PPrreettoorriiaa

204
1= Never 00 03 00 03 2= Sometimes 00 24 13 37 3= Always 00 11 41 52 Total (effective sample size) 00 38 54 92 Frequencies Missing 19 Simple Kappa Statistic (SKS)
Since SKS = 0.4155 the result is fair. Therefore we cannot reject the null hypothesis
From the findings in Table 6.24, the employees from TNA3 appear to retain
their earlier mindset from TNA2 about short courses as a preferred format of
training.
INTERPRETATION OF THE FINDINGS ABOUT SHORT COURSE
TRAINING
The null hypothesis for H4 stated that there is no significant difference
between managers’ and employees’ preference for short course training. In
both tests for H2.4 (i) and H2.4 (ii), the probability statistics were so
miniscule that the null hypotheses could be rejected in both TNA1-TNA2 and
TNA1-TNA3. The discrepancy is big since employees seem to love short
courses as a training mechanism, whereas managers think they are
worthwhile only “sometimes”.
When comparing only the employee responses in TNA2-TNA3, the Simple
Kappa Statistic is also fair. This means that the H2.4 (iii) hypothesis that
there is no significant difference for employees before and after the
intervention in their preference for short course training; cannot be rejected.
By default, the conclusion is that employees have not changed their minds in
the 48hour reflection space. Their love for using short courses as a form of
training therefore appears convincing.
©© UUnniivveerrssiittyy ooff PPrreettoorriiaa
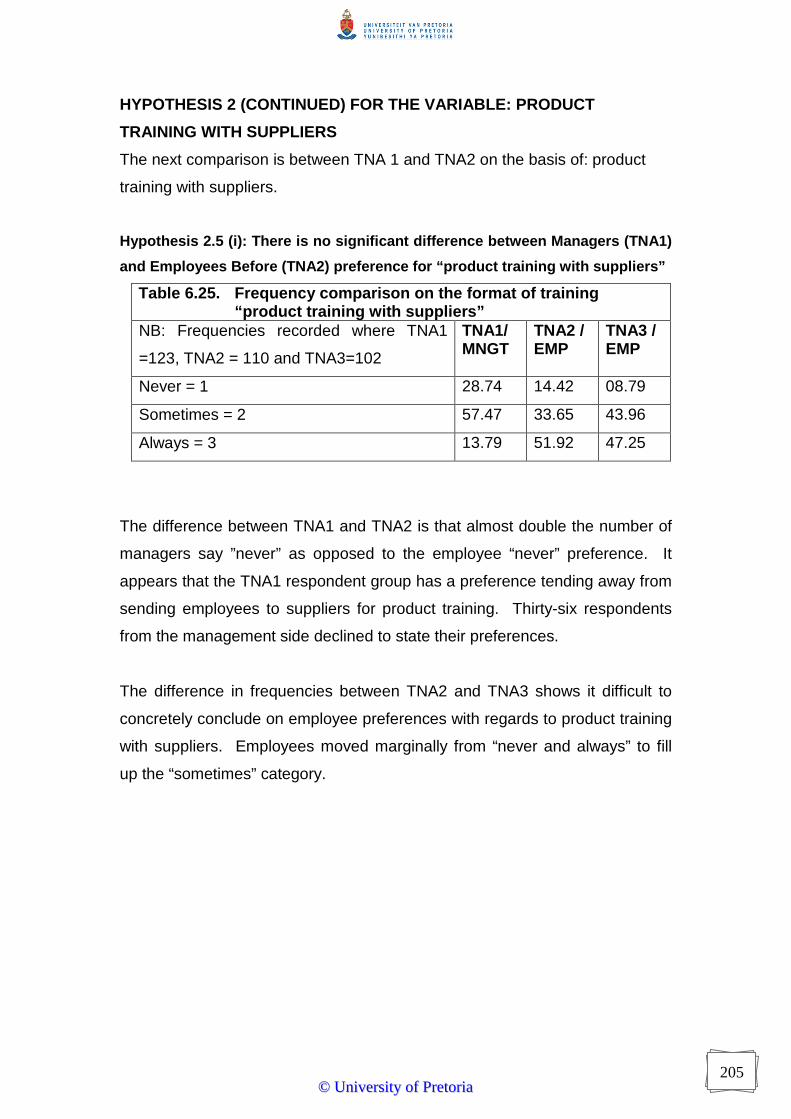
205
HYPOTHESIS 2 (CONTINUED) FOR THE VARIABLE: PRODUCT
TRAINING WITH SUPPLIERS
The next comparison is between TNA 1 and TNA2 on the basis of: product
training with suppliers.
Hypothesis 2.5 (i): There is no significant difference between Managers (TNA1)
and Employees Before (TNA2) preference for “product training with suppliers”
The difference between TNA1 and TNA2 is that almost double the number of
managers say ”never” as opposed to the employee “never” preference. It
appears that the TNA1 respondent group has a preference tending away from
sending employees to suppliers for product training. Thirty-six respondents
from the management side declined to state their preferences.
The difference in frequencies between TNA2 and TNA3 shows it difficult to
concretely conclude on employee preferences with regards to product training
with suppliers. Employees moved marginally from “never and always” to fill
up the “sometimes” category.
Table 6.25. Frequency comparison on the format of training “product training with suppliers” NB: Frequencies recorded where TNA1
=123, TNA2 = 110 and TNA3=102
TNA1/ MNGT
TNA2 / EMP
TNA3 / EMP
Never = 1 28.74 14.42 08.79
Sometimes = 2 57.47 33.65 43.96
Always = 3 13.79 51.92 47.25
©© UUnniivveerrssiittyy ooff PPrreettoorriiaa

206
The comparison between the TNA1 group of managers and the TNA2 group
of employees yields an effective sample size of 190, with 43 frequencies
missing.
Table 6.26. Fisher’s Exact Test between TNA2-TNA1 for the format of training: “product training with suppliers” Variable: Product training with suppliers
TNA2 Employees
TNA1 Managers
Fisher’s Exact Test
1 2 3 1 2 3 Frequency 15 35 54 24 50 12 Percentage 14.42 33.65 51.92 27.91 58.14 13.95 Pr<=
1.462E-07
The probability that this difference in preference between managers and
employees is due to chance alone is less than 0.0001 at the 5% significance
level, at two degrees of freedom. Therefore there is a statistical difference
between the managers (TNA1) and employees’ preferences (TNA2) for
using “product training with suppliers” format, before the intervention.
Therefore this null hypothesis can be rejected that stated no difference
between TNA1 and TNA 2 on product training with suppliers.
Hypothesis 2.5 (ii): There is no significant difference between Managers
(TNA1) and Employees After (TNA3) preference for “product training
with suppliers”
The comparison between the TNA1 group of managers and the TNA3 group
of employees yields an effective sample size of 177, with 48 frequencies
missing.
©© UUnniivveerrssiittyy ooff PPrreettoorriiaa

207
Table 6.27. Fisher’s Exact Test between TNA3-TNA1 for the format of training: “product training with suppliers” Variable: Product training with suppliers
TNA3 Employees TNA1 Managers Fisher’s Exact Test
1 2 3 1 2 3 Frequency 8 40 43 24 50 12 Percentage 8.79 43.96 47.25 27.91 58.14 13.95 Pr<=
1.091E-06
The probability that this difference in preference between managers and
employees is due to chance alone is less than 0.0001 at the 5% significance
level, at two degrees of freedom. Therefore there is a statistical difference
between the managers (TNA1) and employees’ preferences (TNA3) for
using “product training with suppliers” format, before the intervention.
The decision is to reject the null hypothesis.
Hypothesis 2.5 (iii): There is no significant difference between “Employees before (TNA2) and Employees after (TNA3) preference for “product training with suppliers”
Table 6.28. Contingency table for “Employees before (TNA2) and Employees after (TNA3) preference for “product training with suppliers” Group Employees Before (TNA2) Employees After (TNA3) 1= Never 2=
Sometimes 3= Always Total
1= Never 07 01 00 08 2= Sometimes 03 20 17 40 3= Always 00 10 33 43 Total (effective sample size) 10 31 50 91 Frequencies Missing 20 Simple Kappa Statistic (SKS)
Since SKS = 0.4136. The result is fair. Therefore we cannot reject the null hypothesis.
This concludes the hypothesis testing on the format of product training with
suppliers between TNA1-TNA2, TNA1-TNA3 and TNA2-TNA3.
©© UUnniivveerrssiittyy ooff PPrreettoorriiaa

208
INTERPRETATION OF THE FINDINGS ABOUT PRODUCT TRAINING
WITH SUPPLIERS
The H2.5(i) and H2.5(ii) null hypotheses that there is no significant
difference between managers and employees preference for product
training with supplier, can both be rejected. Managers do not prefer this
method of training while employees seem to embrace it more often. There
is by default, a statistically significant difference between how managers
and employees view product training with suppliers.
By themselves employees also held fast to their preference and yielded a
fair Simple Kappa Statistic. This means the null hypothesis that there is no
significant difference in employee perceptions before and after the
intervention; cannot be rejected. This means that employees held on to
their convictions that product training with their suppliers, is a form of
training they would always want to use/engage in.
©© UUnniivveerrssiittyy ooff PPrreettoorriiaa

209
HYPOTHESIS 2 (CONTINUED) FOR THE VARIABLE: DISTANCE
EDUCATION
The next comparison is between TNA1 and TNA 2 on who prefers distance
education or not as a means of training staff members.
Hypothesis 2.6 (i): There is no significant difference between “Managers
(TNA1) and Employees Before (TNA2)” preference for “distance education”
training
Table 6.29. Frequencies for the format of training: “distance education where employees study after hours by themselves” NB: Frequencies recorded where TNA1
=123, TNA2 = 110 and TNA3=102
TNA1/ MNGT
TNA2 / EMP
TNA3 / EMP
Never = 1 13.98 18.45 21.51
Sometimes = 2 67.74 49.51 41.94
Always = 3 18.28 32.04 36.56
The difference between TNA1 and TNA2 is that almost exactly the same
percentage of managers (18%) say ”always” as opposed to the employee
“never” preference for this format of training. It appears that 68% of the
respondent group of managers believe in distance education for their
employees to use “sometimes” as training, while about 50% of employees
prefer it “sometimes”. It is notable that 30 respondents from the management
side declined to state their preferences, while only 7 employee respondents
declined to answer. The difference between TNA2 and TNA3 is a bi-
directional shift away from “sometimes” to a 3% employee increase in “never”
as a preference and 4% in “always” as an option.
The comparison between the TNA1 group of managers and the TNA2 group
of employees yields an effective sample size of 196, with 37 frequencies
missing.
©© UUnniivveerrssiittyy ooff PPrreettoorriiaa

210
Table 6.30. Fisher’s Exact Test between TNA2-TNA1 for the format of training “Distance education where employees study after- hours by themselves” Variable: Distance education
TNA2 Employees
TNA1 Managers
Fisher’s Exact Test
1 2 3 1 2 3 Frequency 19 51 33 13 63 17 Percentage 18.45 49.51 32.04 13.98 67.74 18.28 Pr<= 0.0303
The probability that this difference in preference between managers and
employees is due to chance alone is less than 0.05 at the 5% significance
level, at two degrees of freedom. Therefore there is a statistical difference
between the managers (TNA1) and employees’ preferences (TNA2) for
using distance education, before the intervention. The decision is to
reject the null hypothesis.
Hypothesis 2.6 (ii): There is no significant difference between Managers
(TNA1) and Employees’ After (TNA3) preference for “distance
education” training
Table 6.31. Fisher’s Exact Test between TNA3-TNA1 for the format of training “Distance education where employees study after hours by themselves” Variable: Distance education
TNA3 Employees TNA1 Managers Fisher’s Exact Test
1 2 3 1 2 3 Frequency 20 39 34 13 63 17 Percentage 21.51 41.94 36.56 13.98 67.74 18.28 Pr<= 0.0015
The probability that this difference in preference between managers and
employees is due to chance alone is less than 0.05 at the 5% significance
level, at two degrees of freedom. Therefore there is a statistical difference
between the managers (TNA1) and employees’ preferences (TNA3) for
using distance education, after the intervention. The decision is to
reject the null hypothesis.
©© UUnniivveerrssiittyy ooff PPrreettoorriiaa

211
Hypothesis 2.6 (iii): There is no significant difference between
“Employees before (TNA2) and Employees after (TNA3)” preference for
“distance education where employees study after hours by themselves”
Table 6.32. Contingency table for “Employees before (TNA2) and Employees after (TNA3)” preference for “distance education” Group Employees Before (TNA2) Employees After (TNA3) 1= Never 2=
Sometimes 3= Always Total
1= Never 13 07 00 20 2= Sometimes 01 29 09 39 3= Always 01 10 23 34 Total (effective sample size) 15 46 32 93 Frequencies Missing 18 Simple Kappa Statistic (SKS)
Since SKS = 0.5237. The result is fair. Therefore we cannot reject the null hypothesis.
INTERPRETATION OF THE FINDINGS ABOUT DISTANCE EDUCATION
TRAINING
Both the H2.6 (i) and the H2.6 (ii) null hypotheses stated that there was no
significant difference between managers’ and employees’ preferences for
distance education where employees study after hours by themselves.
Fisher’s Exact Test between TNA2-TNA1 and TNA1-TNA3 showed that both
the null hypotheses could be rejected. This means that managers actually
feel different when it comes to employees studying via distance education
institutions.
By themselves employees also held fast to their preference and yielded a
fair Simple Kappa Statistic. This means that the null hypothesis, that there is
no significant difference in employee perceptions before and after the
intervention; cannot be rejected. This means that employees held on to their
convictions that distance education is a form of training they would want to
participate in.
©© UUnniivveerrssiittyy ooff PPrreettoorriiaa

212
HYPOTHESIS 2 (CONTINUED) FOR THE VARIABLE: SELF-TRAINING
USING BOOKS/JOURNALS AND MAGAZINES
The next comparison is between TNA1 and TNA 2 on who prefers “self-
training using books/journals and magazines” or not as a means of training
staff members.
Hypothesis 2.7 (i): There is no significant difference between Managers (TNA1)
and Employees’ Before (TNA2) preference for “self-training using books,
journals and magazines”
Table 6.33. Frequencies of the format of training: “self-training using books, journals and magazines” NB: Frequencies recorded where TNA1
=123, TNA2 = 110 and TNA3=102
TNA1/ MNGT
TNA2 / EMP
TNA3 / EMP
Never = 1 08.99 06.80 10.64
Sometimes = 2 59.55 52.43 41.49
Always = 3 31.46 40.78 47.87
The difference between TNA1 and TNA2 frequencies, according to H2 Table
7, is that more managers (60%) believe in self-training for their employees to
use “sometimes”, while only 52% of employees prefer it. While 34
management respondents declined to answer this question, only seven
employee respondents declined to state their preferences. There could be
many reasons for managers not to have answered this question, including
that they may not directly know how their employees self-train.
The comparison between the TNA1 group of managers and the TNA2 group
of employees yields an effective sample size of 191, with 42 frequencies
missing. The comparison is presented in Table 6.34.
©© UUnniivveerrssiittyy ooff PPrreettoorriiaa

213
Table 6.34. Fisher’s Exact Test between TNA2-TNA1 for the format of training: “self-training using books, journals and magazines” Variable: Self-training
TNA2 Employees
TNA1 Managers
Fisher’s Exact Test
1 2 3 1 2 3 Frequency 7 54 42 7 53 28 Percentage 6.80 52.43 40.78 7.95 60.23 31.82 Pr<= 0.4572
The probability that this difference (shown in Table 6.34) in preference
between managers and employees is due to chance alone is more than 0.05
at the 5% significance level, at two degrees of freedom. Therefore there is
no statistical difference between the managers (TNA1) and employees’
preferences (TNA2) for using the self-training training format, before the
intervention. The decision is not to reject the null hypothesis.
Hypothesis 2.7 (ii): There is no significant difference between “Managers
(TNA1) and Employees’ After (TNA3)” preference for “self-training using
books, journals and magazines”
The comparison between TNA 3 employees and management used an
effective sample size of 182 respondents, with 43 missing respondents.
Table 6.35. Fisher’s Exact Test between TNA3-TNA1 for the format of training “Self-training using books, journals and magazines” Variable: Self-training
TNA3 Employees TNA1 Managers Fisher’s Exact Test
1 2 3 1 2 3 Frequency 10 39 45 7 53 28 Percentage 10.64 41.49 47.87 7.95 60.23 31.82 Pr<= 0.0403
The probability that this difference in preference between managers and
employees is due to chance alone is less than 0.05 at the 5% significance
level, at two degrees of freedom. Therefore there is a statistical difference
between the managers (TNA1) and employees’ preferences (TNA3) for
using the self-training training format, after the intervention. The
decision is to reject the Null Hypothesis.
©© UUnniivveerrssiittyy ooff PPrreettoorriiaa

214
Hypothesis 2.7. (iii) There is no significant difference between Employees Before (TNA2) and Employees’ After (TNA3) preference for “self-training using books, journals and magazines”
Table 6.36. Format of training: “Self-training using books, journals and magazines” SKS between TNA2-TNA3 Group Employees Before (TNA2) Employees After (TNA3) 1= Never 2=
Sometimes 3= Always Total
1= Never 04 05 01 10 2= Sometimes 02 29 08 39 3= Always 00 16 29 45 Total (effective sample size) 06 50 38 94 Frequencies Missing 17 Simple Kappa Statistic (SKS)
Since SKS = 0.4120. The result is fair. Therefore we cannot reject the null hypothesis.
INTERPRETATION OF THE FINDINGS ABOUT SELF-TRAINING
The null hypotheses H2.7 (i) and H2.7 (ii) stated that there was no significant
difference between managers’ and employees’ preference for self-training
using books, journals and magazines. The H2.7 (i) null hypothesis could
not be rejected since the Fisher Exact test yielded a statistic that was not
significant. However between managers and the second round of
employees (TNA1-TNA3), the H2.7 (ii) null hypothesis could be rejected.
The result leans toward the notion that the employees in the comparison
between TNA1-TNA3 changed their minds about self-training preferences
during the TNA3 measurement.
However when examining the employees only (TNA2-TNA3), the Simple
Kappa Statistic was fair and therefore we could not reject H2.7.(iii). It
appears that the employees retained their convictions about the
importance of self-training amongst themselves. Perhaps employee
preferences for self-training instead of using other alternatives, are rooted
in self-efficacy and is not dependent on outsiders such as managers.
More information would be required before drawing any meaningful
insights.
©© UUnniivveerrssiittyy ooff PPrreettoorriiaa

215
HYPOTHESIS 2 (CONTINUED) FOR THE VARIABLE: WEB/ONLINE
TRAINING
The next comparison is between TNA1 and TNA 2 on who prefers “web/online
training” or not as a means of training staff members.
Hypothesis 2.8 (i): There is no significant difference between “Managers (TNA1) and Employees before (TNA2)” preference for “online/ web courses”
Table 6.37. Frequencies for the format of training: “online/web courses” NB: Frequencies recorded where TNA1
=123, TNA2 = 110 and TNA3=102
TNA1/
MNGT
TNA2 /
EMP
TNA3 /
EMP
Never = 1 20.69 16.67 18.28
Sometimes = 2 63.22 50.00 48.39
Always = 3 16.09 33.33 33.33
The difference between TNA1 and TNA2 frequencies in H2 Table 8 is that
exactly the same percentage of managers prefer “always”, as employees who
prefer “never”, for the format of online training. It appears that more
managers (63%) believe in online courses for their employees to use
“sometimes”, while only 50% of employees prefer it. While 36 management
respondents declined to answer this question, only eight employee
respondents declined to state their preferences. There could be many
reasons for managers not to answer the question, but one possibility is that
they may be unsure about their employees’ Internet access.
The comparison between the TNA1 group of managers and the TNA2 group
of employees yields an effective sample size of 189, with 44 frequencies
missing.
Table 6.38. Fisher’s Exact Test between TNA2-TNA1 for the format of training: “Online/web courses” Variable: Online/web/ Internet
TNA2 Employees
TNA1 Managers
Fisher’s Exact Test
1 2 3 1 2 3 Frequency 17 51 34 18 55 14 Percentage 16.67 50.00 33.33 20.69 63.22 16.09 Pr<= 0.0238
©© UUnniivveerrssiittyy ooff PPrreettoorriiaa

216
The probability that this difference in preference between managers and
employees is due to chance alone is less than 0.05 at the 5% significance
level, at two degrees of freedom. Therefore there is a statistical difference
between the managers (TNA1) and employees’ preferences (TNA2) for
using the online/web/Internet training format, before the intervention.
The decision is to reject the Null Hypothesis.
Hypothesis 2.8 (ii): There is no significant difference between Managers (TNA1) and Employees “after” (TNA3) preference for “online/ web courses” The comparison between the TNA1 group of managers and the TNA3 group
of employees yields an effective sample size of 180, with 45 frequencies
missing.
Table 6.39. Fisher’s Exact Test between TNA 3-TNA1 for the format of training: “Online/web courses” Variable: Online/web/ Internet
TNA3 Employees TNA1 Managers Fisher’s Exact Test
1 2 3 1 2 3 Frequency 17 45 31 18 55 14 Percentage 18.28 48.39 33.33 20.69 63.22 16.09 Pr<= 0.0268
The probability that this difference in preference between managers and
employees is due to chance alone is less than 0.05 at the 5% significance
level, at two degrees of freedom. Therefore there is a statistical difference
between the managers (TNA1) and employees’ preferences (TNA3) for
using the online/web/Internet training format, after the intervention. The
decision is to reject the null hypothesis.
©© UUnniivveerrssiittyy ooff PPrreettoorriiaa
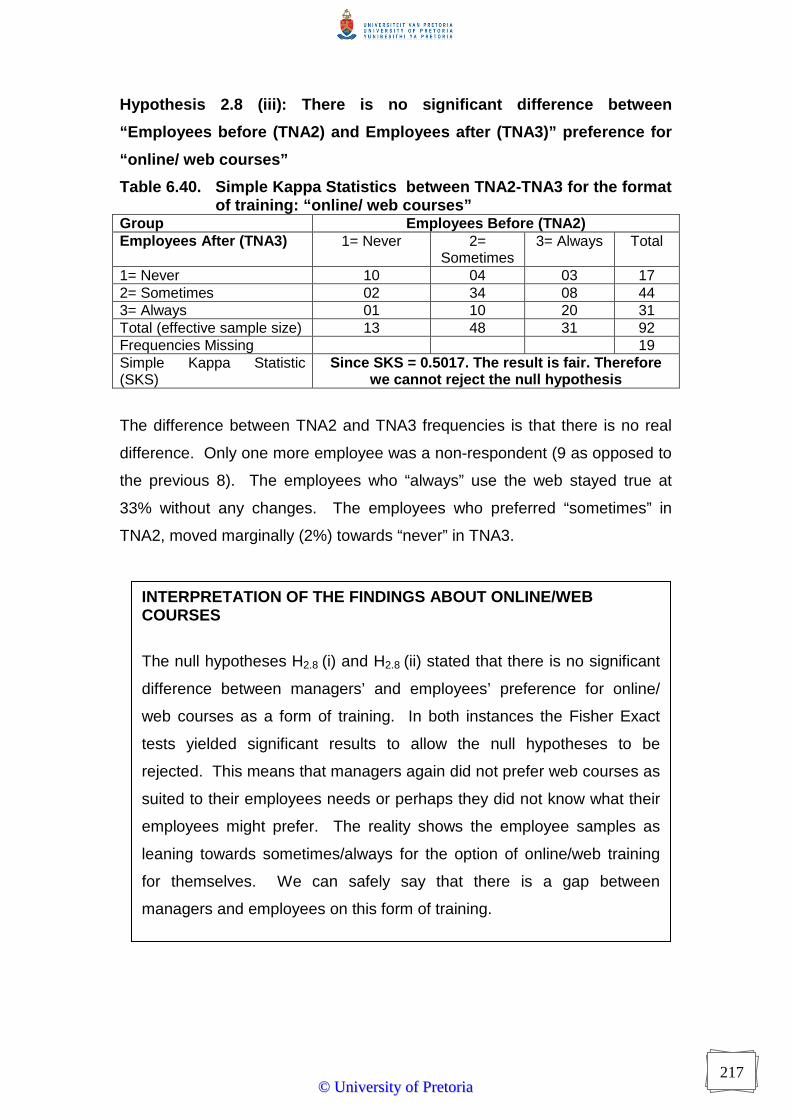
217
Hypothesis 2.8 (iii): There is no significant difference between
“Employees before (TNA2) and Employees after (TNA3)” preference for
“online/ web courses”
Table 6.40. Simple Kappa Statistics between TNA2-TNA3 for the format of training: “online/ web courses” Group Employees Before (TNA2) Employees After (TNA3) 1= Never 2=
Sometimes 3= Always Total
1= Never 10 04 03 17 2= Sometimes 02 34 08 44 3= Always 01 10 20 31 Total (effective sample size) 13 48 31 92 Frequencies Missing 19 Simple Kappa Statistic (SKS)
Since SKS = 0.5017. The result is fair. Therefore we cannot reject the null hypothesis
The difference between TNA2 and TNA3 frequencies is that there is no real
difference. Only one more employee was a non-respondent (9 as opposed to
the previous 8). The employees who “always” use the web stayed true at
33% without any changes. The employees who preferred “sometimes” in
TNA2, moved marginally (2%) towards “never” in TNA3.
INTERPRETATION OF THE FINDINGS ABOUT ONLINE/WEB COURSES
The null hypotheses H2.8 (i) and H2.8 (ii) stated that there is no significant
difference between managers’ and employees’ preference for online/
web courses as a form of training. In both instances the Fisher Exact
tests yielded significant results to allow the null hypotheses to be
rejected. This means that managers again did not prefer web courses as
suited to their employees needs or perhaps they did not know what their
employees might prefer. The reality shows the employee samples as
leaning towards sometimes/always for the option of online/web training
for themselves. We can safely say that there is a gap between
managers and employees on this form of training.
©© UUnniivveerrssiittyy ooff PPrreettoorriiaa

218
In summarising the TNA2-TNA3 comparisons for Hypothesis 2, we found
that employees did not significantly change their preferences to match
their TNA2 responses. In fact, all 8 variables (training formats) received
FAIR Simple Kappa statistics. In practical terms, this implies that employees
did not change their minds within the 48 hours in which they tested on TNA2
and thereafter TNA3. The figure that follows below summarises the Simple
Kappa Statistics for the 8 variables compared between employees samples
(TNA2-TNA3) only.
FURTHER INTERPRETATION OF THE FINDINGS ABOUT ONLINE/WEB COURSES
When the employee groups were compared (TNA2-TNA3), the Simple
Kappa Statistic again yielded a fair result. This means that the null
hypothesis H2.8 (iii) that stated that no significant difference existed
amongst employees before and after the intervention; cannot be rejected.
This means that the employees’ views on web/online training as a
preferred form of training remained the same, even after the supply chain
awareness intervention.
©© UUnniivveerrssiittyy ooff PPrreettoorriiaa

219
Figure 6.6. below summarises the Simple Kappa Statistics for the eight
variables compared between employees samples (TNA2-TNA3) only.
Figure 6.6. The Simple Kappa Statistics for the 8 variables compared between employees samples (TNA2-TNA3) only.
Source: Author’s own compilation based on empirical results
The Simple Kappa statistic works on the same principle as the McNemar
before and after tests for linked samples. As mentioned before in the H1.3
section of this chapter, only results of the Simple Kappa Statistic (SKS) that
are above 0.75 are considered significant enough to justify that the null
hypotheses should be rejected. Based on this premise, all the SKS values in
Figure 6.6. are below 0.75 and are considered Fair. This means that none of
the H2 variables yielded significant results for the employee (TNA2-TNA3)
groups.
The original null hypothesis for H20 proposed that there were no significant
differences between managers and employees regarding the format of
training they preferred. Testing the eight variables connected to the format of
training, revealed many reasons to reject their individual null hypotheses. The
0
0.1
0.2
0.3
0.4
0.5
0.6 On the job traininng
In-house training
Seminars/Conferences
Short courses
Product training withsuppliers
Distance education
Self training
Online/web traininng
©© UUnniivveerrssiittyy ooff PPrreettoorriiaa

220
findings of the statistical tests and subsequent decisions regarding the Null
hypotheses for TNA1-TNA2 and TNA1-TNA3 are summarised in H2 Table
6.41. below. The findings for Hypotheses 2.1 until 2.8 are contained in this
chapter while the implications of these findings are discussed in Chapter 7.
Table 6.41. Summary of the format of training (H2) hypotheses for Managers (TNA1) versus Employees (TNA2 and TNA3)
H2 Variable on Format of Training
Fishers Exact test results TNA 1 and TNA2
Decision to accept/reject the Null Hypotheses
Fishers Exact test results TNA 1 and TNA3
Decision to accept/reject the Null Hypotheses
1.On-the-job Pr <=0.09 Cannot reject H0 Pr <=0.0085 Reject H0
2. In-house Pr <=0.0078 Reject H0 Pr <=0.0603 Cannot reject H0
3. Seminar/
Conference
Pr <=0.0036 Reject H0 Pr <=0.0023 Reject H0
4. Short
Courses
Pr <=0.0001 Reject H0 Pr <=0.0001 Reject H0
5. Product
training with
suppliers
Pr <=0.0001 Reject H0 Pr <=0.0001 Reject H0
6. Distance
education
Pr <=0.0303 Reject H0 Pr <=0.0015 Reject H0
7. Self
training
Pr <=0.45 Cannot reject H0 Pr <=0.0403 Reject H0
8.Online/
web training
Pr <=0.0288 Reject H0 Pr <=0.0268 Reject H0
Source: Author’s own compilation
Figure 6.6. shows that the summary statistics and the frequency tables were
not substantial enough evidence to make conclusions about managers and
employees preferences for specific training formats. The value of the
statistical testing is that a more objective picture is presented to compare
managers and employee responses to training formats. Since there are
statistically significant differences in the preferred format of training between
managers and employees, Chapter 7 has a few recommendations to consider
under H20. This concludes the discussion of the Hypothesis 2 variables and
©© UUnniivveerrssiittyy ooff PPrreettoorriiaa

221
their findings. The next section deals with the five reasons that may or may
not motivate employees to attend training.
©© UUnniivveerrssiittyy ooff PPrreettoorriiaa

222
SECTION THREE: COMPARATIVE TESTS BETWEEN TWO EMPLOYEE
GROUPS (TNA2 AND TNA3) AND THE MANAGERS (TNA1)
H30: There is no significant difference between managers’ and
employees’ perceptions regarding the reasons motivating
employees to attend training
H3A: There is a significant difference between managers’ and
employees’ perceptions regarding the reasons motivating
employees to attend training
REASONS MOTIVATING STAFF TO ATTEND TRAINING
The reasons given as motivating reasons to encourage employees to attend
training included: improved prospects of promotion, industry novelty, zero cost
to the employee, to escape the workplace and insistence from supervisory
staff. Managers were asked to agree/disagree in TNA1 with the given
statements that would motivate their employees to attend training. In TNA2
and TNA 3, the employees were asked to agree/disagree with the same
questions. Discrepancy would indicate differing views about reasons
motivating employees to attend training between managerial level and non-
supervisory levels.
This question used a Likert scale where 1= strongly disagree, 2 = disagree, 3=
neutral, 4= agree and 5= strongly agree.
Table 6.42. Frequencies regarding training attendance motivated by “prospects for promotion”
H3.1: Employees would attend training if they knew it would help them get promoted
Management TNA1 (n=123)
Employees Before TNA2 (n=110)
Employees After TNA3 (n=102)
Frequency Percentage Frequency Percentage Frequency Percentage
1= strongly disagree
03 03.03 11 10.38 05 05.15 2 = disagree 05 05.05 12 11.32 17 17.53 3= neutral 08 08.08 11 10.38 07 07.22 4= agree 64 64.65 38 35.85 42 43.30 5= strongly agree 19 19.19 34 32.08 26 26.80 Total responses (n) 99 106 97 Frequency missing 24 04 05
©© UUnniivveerrssiittyy ooff PPrreettoorriiaa

223
It appears from the frequencies in Table 6.42, that employees did change
their views about training and promotion between TNA 2 and TNA3.
Employees seemed to congregate to “agree” that a motivational reason to
attend training would be if it would assist them in their aspiration to be
promoted. To the contrary some employees also simmered down from
“strongly disagree” to merely “disagree”. Since 8 respondents less took part
in TNA 3 than those in TNA2, it would be pompous to make any definite
conclusions except to say that employees could change their views about
training and promotion prospects within 48 hours. However from both
managers’ and employees’ responses it appears that future promotion
prospects would motivate employees to attend training.
Table 6.43. Frequencies regarding training attendance motivated by “the need to stay informed”
H3.2: Employees would attend training if the course was new and they had to stay informed.
Management TNA1 (n=123)
Employees Before TNA2 (n=110)
Employees After TNA3 (n=102)
Frequency Percentage Frequency Percentage Frequency Percentage
1= strongly disagree 02 02.06 03 02.80 02 02.00
2 = disagree 06 06.19 03 02.80 00 00.00
3= neutral 12 12.37 01 00.93 01 01.00
4= agree 56 57.73 25 23.36 34 34.00
5= strongly agree
21 21.65 75 70.09 63 63.00
Total responses (n) 97 107 100
Frequency missing 26 03 02
Table 6.43, shows that employees are eager to learn about something new in
their industry and this motivates them to attend training. They agree to a
greater extent than what management did about the motivational pull of being
trained when something is new in their industry. This means that new training
topics can be a good reason for drawing employees towards training.
©© UUnniivveerrssiittyy ooff PPrreettoorriiaa
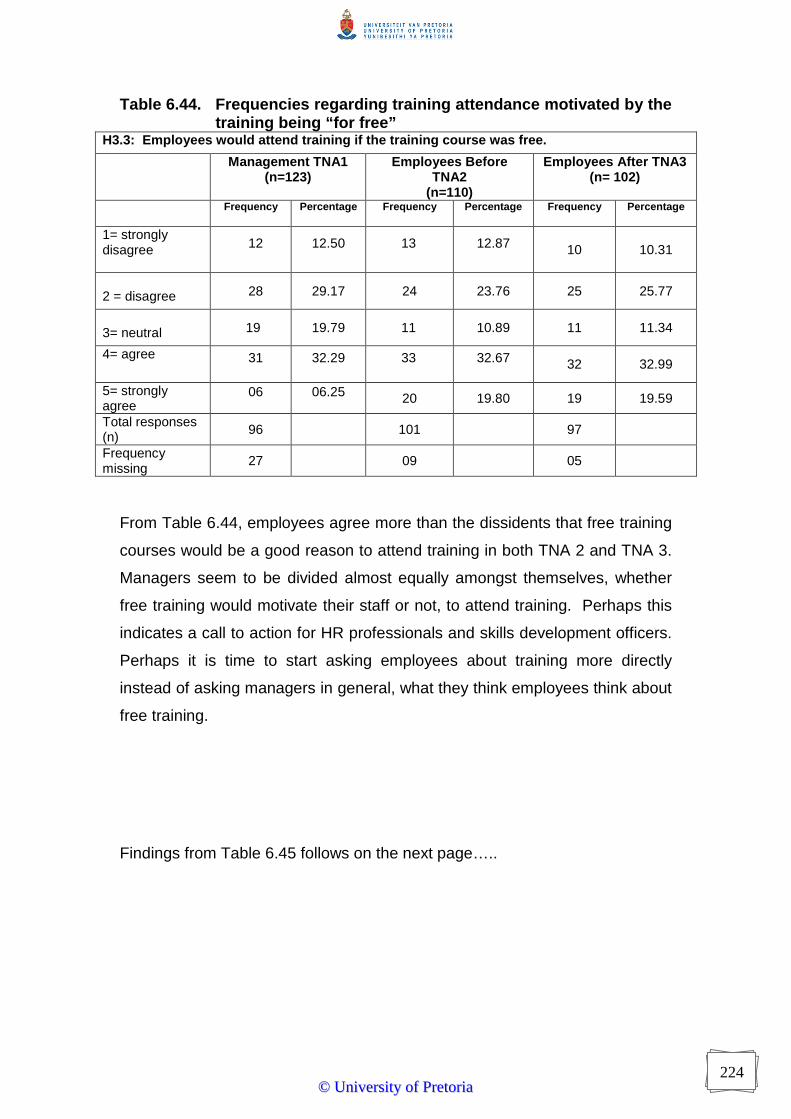
224
Table 6.44. Frequencies regarding training attendance motivated by the training being “for free”
H3.3: Employees would attend training if the training course was free.
Management TNA1 (n=123)
Employees Before TNA2
(n=110)
Employees After TNA3 (n= 102)
Frequency Percentage Frequency Percentage Frequency Percentage
1= strongly disagree 12 12.50 13 12.87 10 10.31
2 = disagree 28 29.17 24 23.76 25 25.77
3= neutral 19 19.79 11 10.89 11 11.34
4= agree 31 32.29 33 32.67 32 32.99
5= strongly agree
06 06.25 20 19.80 19 19.59
Total responses (n) 96 101 97
Frequency missing
27 09 05
From Table 6.44, employees agree more than the dissidents that free training
courses would be a good reason to attend training in both TNA 2 and TNA 3.
Managers seem to be divided almost equally amongst themselves, whether
free training would motivate their staff or not, to attend training. Perhaps this
indicates a call to action for HR professionals and skills development officers.
Perhaps it is time to start asking employees about training more directly
instead of asking managers in general, what they think employees think about
free training.
Findings from Table 6.45 follows on the next page…..
©© UUnniivveerrssiittyy ooff PPrreettoorriiaa

225
Table 6.45. Frequencies regarding training attendance motivated by “time off from work”
H3.4: Employees would attend training if the training course would get employees some time off/away from the workplace. Management TNA1
(n=123) Employees Before TNA2 (n=110)
Employees After TNA3 (n=102)
Frequency Percentage Frequency Percentage Frequency Percentage
1= strongly disagree 15 15.63 19 18.63 09 09.28
2 = disagree 27 28.13 22 21.57 33 34.02
3= neutral 25 26.04 08 07.84 13 13.40
4= agree 20 20.83 38 37.25 33 34.02
5= strongly agree
09 09.38 15 14.71 09 09.28
Total responses (n) 96 102 97
Frequency missing
27 08 05
From Table 6.45, management appear ignorant to some extent of how much
their employees would or would not value time away from the office for
training purposes. This question proved the uncertainty surrounding their
employees’ preferences, since it yielded the highest occurrence thus far,
where 25/96 managers selected the neutral option. Employees from TNA 2
seem in agreement. TNA2 yielded 24 respondents more than those in TNA1
who agree that training accompanied by “time off from work”, would be
welcomed. After the intervention, in TNA3, employees were exactly equal in
their preference for and against time off from the workplace for training
purposes. This question would be an interesting point to pursue in future
research studies.
Findings from Table 6.46 follows on the next page…..
©© UUnniivveerrssiittyy ooff PPrreettoorriiaa

226
Table 6.46. Frequencies regarding training attendance motivated by “supervisors’ insistence that employees attend training”
H3.5: Employees would attend training if their (superior) supervisor said they should attend training. Management TNA1
(n=123) Employees Before TNA2 (n=110)
Employees After TNA3 (n=102)
Frequency Percentage Frequency Percentage Frequency Percentage
1= strongly disagree 13 13.54 33 31.73 21 21.88
2 = disagree 34 35.42 35 33.65 45 46.88
3= neutral 24 25.00 14 13.46 06 06.25
4= agree 21 21.88 16 15.38 20 20.83
5= strongly agree
04 04.17 06 05.77 04 04.17
Total responses (n) 96 104 96
Frequency missing
27 06 06
Management appear to shy away from painting themselves as the ‘bad guys’
who compel their employees to attend training in this question’s responses.
The majority of management responses are in disagreement, perhaps in the
hope that their employees would have better motivational reasons to attend
training. The TNA1 employee response supports the management view that
attending training “because the boss said you should” is probably not a good
motivator to attend training. An overwhelming 68/104 respondents disagree
with this statement. An even bigger proportion of 66/96 respondents
disagreed in TNA 3; perhaps reinforcing the notion that employees will not
only attend training when their managers insist that they do.
In summarising the tests of proportion amongst the three groups (TNA1, 2
and 3) and reasons motivating employees to attend training, by utilizing
Descriptive Statistics alone, the following points would have supported the
Alternate Hypothesis to H3:
� Employee promotion as a motivator to attend training: here managers
and employees expressed similar views
©© UUnniivveerrssiittyy ooff PPrreettoorriiaa

227
� New topics pertaining to the industry: here managers under-estimate
employee agreements that this is good motivation to attend training
� Training courses that are for free: Managers are split (half agree and
half disagrees) about whether this is good motivation, while employees
agree undoubtedly.
� The issue of time-off from work: this is an undecided issue for both
management and employees. Management appear a little less
confident about whether it would motivate their employees. In turn, the
employees are equally split about whether it should/should not
motivate anyone to attend training.
� Management insistence to attend training: Both managers shy away
from making the boss’ insistence to be a motivating reason to attend
training. Perhaps managers do not want to appear as too harsh versus
the employees who want to be seen not only as “obedient” in the
decision to attend training.
Perhaps the above proportions appear “to be expected” and contributing
nothing to the existing body of knowledge…. This means that a contrasting
variable such as the existing qualification of respondents could be motivating
them to attend training or not. Therefore the proportional evidence is
examined further by conducting Kruskal-Wallis one way ANOVA tests
for ordinal data. Perhaps more can be learnt from a statistically significant
point of view about the variables motivating employees to attend training.
The specific variables motivating employees to attend training, compared to
the employee educational levels, yielded the results presented in Table 6.47.
The low respondent numbers required the groups “Bachelors/B.Tech” and
“postgraduate Honours, Masters or Doctorate”, to be combined. There are
therefore only 4 levels of qualifications. When the 4 levels of qualification are
contrasted with the respondents’ reasons motivating them to attend training,
Table 6.47 shows the measures of location per qualification level for TNA2.
Note that the highest mean score is indicated in the first column. Non-
response equals 11 and Standard Deviation is abbreviated to Std Dev.
©© UUnniivveerrssiittyy ooff PPrreettoorriiaa
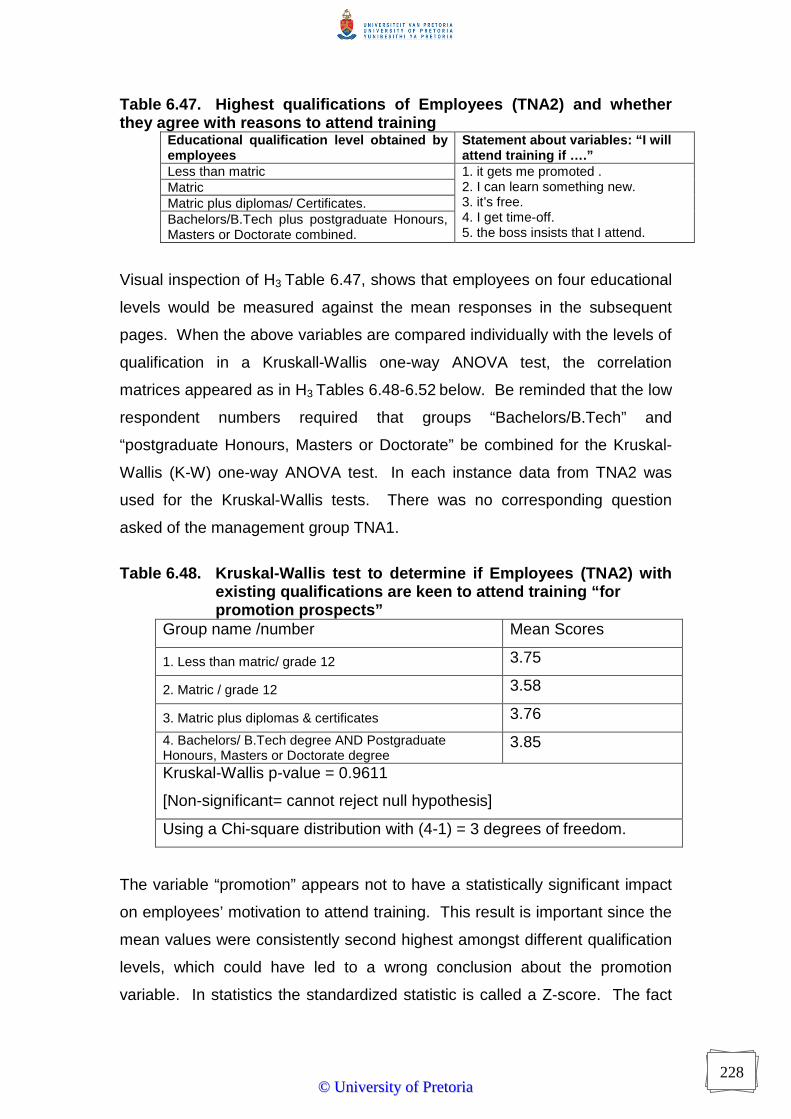
228
Table 6.47. Highest qualifications of Employees (TNA2) and whether they agree with reasons to attend training
Educational qualification level obtained by employees
Statement about variables: “I will attend training if ….”
Less than matric Matric Matric plus diplomas/ Certificates. Bachelors/B.Tech plus postgraduate Honours, Masters or Doctorate combined.
1. it gets me promoted . 2. I can learn something new. 3. it’s free. 4. I get time-off. 5. the boss insists that I attend.
Visual inspection of H3 Table 6.47, shows that employees on four educational
levels would be measured against the mean responses in the subsequent
pages. When the above variables are compared individually with the levels of
qualification in a Kruskall-Wallis one-way ANOVA test, the correlation
matrices appeared as in H3 Tables 6.48-6.52 below. Be reminded that the low
respondent numbers required that groups “Bachelors/B.Tech” and
“postgraduate Honours, Masters or Doctorate” be combined for the Kruskal-
Wallis (K-W) one-way ANOVA test. In each instance data from TNA2 was
used for the Kruskal-Wallis tests. There was no corresponding question
asked of the management group TNA1.
Table 6.48. Kruskal-Wallis test to determine if Employees (TNA2) with existing qualifications are keen to attend training “for promotion prospects”
Group name /number Mean Scores
1. Less than matric/ grade 12 3.75
2. Matric / grade 12 3.58
3. Matric plus diplomas & certificates 3.76
4. Bachelors/ B.Tech degree AND Postgraduate Honours, Masters or Doctorate degree
3.85
Kruskal-Wallis p-value = 0.9611
[Non-significant= cannot reject null hypothesis]
Using a Chi-square distribution with (4-1) = 3 degrees of freedom.
The variable “promotion” appears not to have a statistically significant impact
on employees’ motivation to attend training. This result is important since the
mean values were consistently second highest amongst different qualification
levels, which could have led to a wrong conclusion about the promotion
variable. In statistics the standardized statistic is called a Z-score. The fact
©© UUnniivveerrssiittyy ooff PPrreettoorriiaa

229
that the Z-statistics are all smaller than the Z-critical values at both 10% and
5% significance levels, confirms that the H3.1 null hypothesis cannot be
rejected, based on the promotion variable, either.
The next variable to be tested is the desire to learn something new.
Table 6.49. Kruskal-Wallis test for “Employees (TNA2) with existing
qualifications” to see if they are keen to attend training “to
learn something new”:
Group name /number Mean Scores
1. Less than matric/ grade 12 3.87
2. Matric / grade 12 4.71
3. Matric plus diplomas & certificates 4.76
4. Bachelors/ B.Tech degree AND Postgraduate Honours, Masters or Doctorate degree
4.69
Kruskal-Wallis p-value = 0.0113 [Significant = reject the null
hypothesis]
Using a Chi-square distribution with (4-1) = 3 degrees of freedom.
H3 Table 6.49 reinforces the perception that the motivation to learn something
new is a statistically significant variable. This conclusion is supported by Z-
statistics of 3 and 3,03 larger than the Z-critical value of 2.64 at the 5% level.
The next variable under scrutiny is the one where training is for free.
©© UUnniivveerrssiittyy ooff PPrreettoorriiaa

230
Table 6.50. Kruskal-Wallis test for employees with existing qualifications to determine if they are “keen to attend training when it is free”
Group name /number Mean Scores
1. Less than matric/ grade 12 3.56
2. Matric / grade 12 3.74
3. Matric plus diplomas & certificates 2.97
4. Bachelors/ B.Tech degree AND Postgraduate Honours, Masters or Doctorate degree
2.69
Kruskal-Wallis p-value = 0.0323 [Significant= reject null hypothesis]
Using a Chi-square distribution with (4-1) = 3 degrees of freedom.
H3 Table 6.50 corroborates that the motivation to attend free training is a
statistically significant variable. This conclusion is only supported by Z-
statistic of 2.45; which is larger than the Z-critical value of 2.39 at the 10%
level. It is however smaller than the critical value of 2.64 at the 5%
significance level. The next variable for consideration is the one where
training allows employees time off from work.
Table 6.51. Kruskal-Wallis test for employees with existing qualifications to determine if they attend training “to get time off work”
Group name /number Mean Scores
1. Less than matric/ grade 12 3.25
2. Matric / grade 12 3.45
3. Matric plus diplomas & certificates 2.78
4. Bachelors/ B.Tech degree AND Postgraduate Honours, Masters or Doctorate degree
2.92
Kruskal-Wallis p-value = 0.2107 [Non-significant= cannot reject the
null hypothesis]
Using a Chi-square distribution with (4-1) = 3 degrees of freedom.
H3 Table 6.51 corroborates that the motivation to attend have time off work
due to training is not a statistically significant variable. This conclusion is
supported by none of the Z-statistic being larger than the Z-critical values at
either 5% or 10% levels. The next variable for consideration is the one where
employees see the boss’ insistence on attending training as a motivator/not.
©© UUnniivveerrssiittyy ooff PPrreettoorriiaa
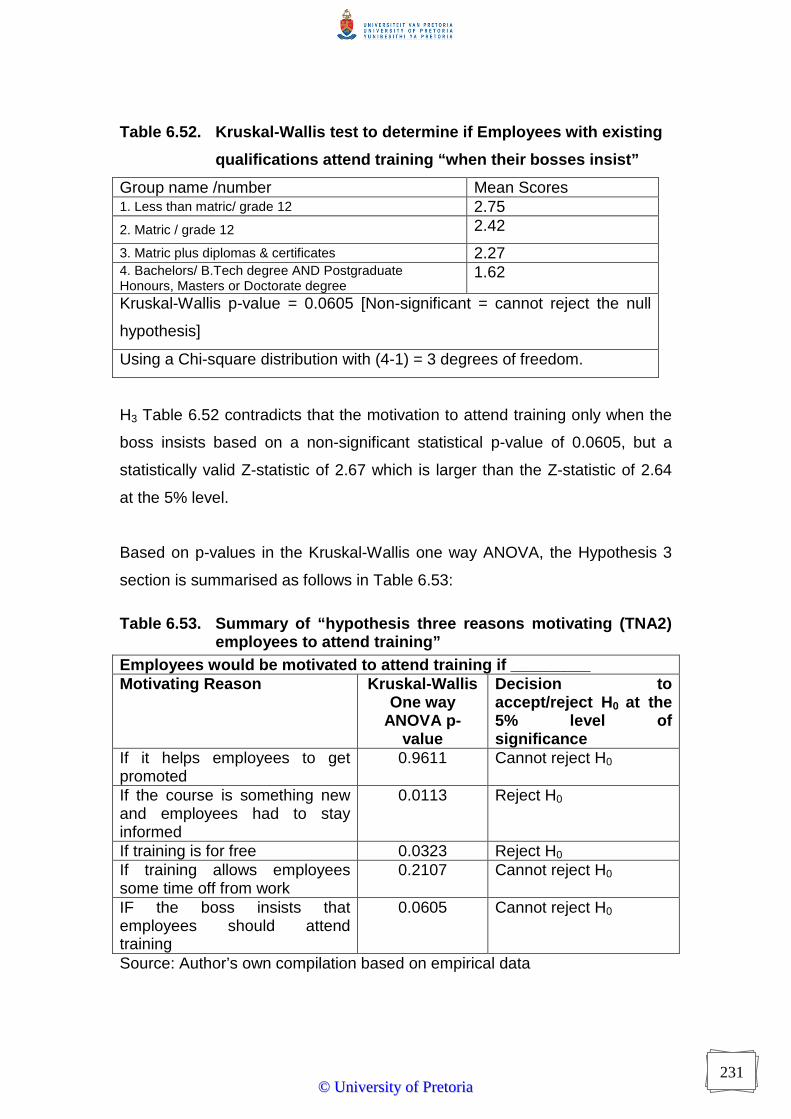
231
Table 6.52. Kruskal-Wallis test to determine if Employees with existing
qualifications attend training “when their bosses insist”
Group name /number Mean Scores 1. Less than matric/ grade 12 2.75 2. Matric / grade 12 2.42
3. Matric plus diplomas & certificates 2.27 4. Bachelors/ B.Tech degree AND Postgraduate Honours, Masters or Doctorate degree
1.62
Kruskal-Wallis p-value = 0.0605 [Non-significant = cannot reject the null
hypothesis]
Using a Chi-square distribution with (4-1) = 3 degrees of freedom.
H3 Table 6.52 contradicts that the motivation to attend training only when the
boss insists based on a non-significant statistical p-value of 0.0605, but a
statistically valid Z-statistic of 2.67 which is larger than the Z-statistic of 2.64
at the 5% level.
Based on p-values in the Kruskal-Wallis one way ANOVA, the Hypothesis 3
section is summarised as follows in Table 6.53:
Table 6.53. Summary of “hypothesis three reasons motivating (TNA2) employees to attend training” Employees would be motivated to attend training if _________ Motivating Reason Kruskal-Wallis
One way ANOVA p-
value
Decision to accept/reject H 0 at the 5% level of significance
If it helps employees to get promoted
0.9611 Cannot reject H0
If the course is something new and employees had to stay informed
0.0113 Reject H0
If training is for free 0.0323 Reject H0 If training allows employees some time off from work
0.2107 Cannot reject H0
IF the boss insists that employees should attend training
0.0605 Cannot reject H0
Source: Author’s own compilation based on empirical data
©© UUnniivveerrssiittyy ooff PPrreettoorriiaa

232
A critic may comment that employees were ignorant about what motivates
them by only using the TNA2 data for the Kruskal-Wallis tests summarised in
Table 6.53. Therefore the results of the paired sample t-tests using TNA3
data follows in Tale 6.54 below.
In trying to see if the employee views improved towards being more motivated
to attend training after having received the SCM awareness intervention,
Table 6.54 summarises the Means and Standard Deviation of the employee
group’s “after” (TNA3) minus “before” (TNA2). The paired sample t-tests were
conducted to determine the p-values. Table 6.54 used n=89 respondents for
both TNA2 and TNA3 groups.
Table 6.54. Summary of H 3 reasons motivating employees to attend training (a paired sample t-test between TNA2-TNA3) Employees would be motivated to attend training if _________ Motivating Reason Mean=
after- before= difference
Standard Deviation
p-value per variable analysed
Decision to accept/reject H 0 at the 5% level of significance:
If it helps employees to get promoted (V7)
After Before
Difference
3.66 3.76 -0.10
1.19 1.22 1.13
p =0.404
Not statistically
significant. Cannot reject H0
If the course is something new and employees had to stay
informed (V8) After
Before Difference
4.55 4.54 0.01
0.74 0.90 1.14
p =0.93
Not statistically
significant. Cannot reject H0
If training is for free (V9) After
Before Difference
3.22 3.18 0.04
1.33 1.34 1.40
p =0.76
Not statistically
significant. Cannot reject H0
If training allows employees some time off from work (V10)
After Before
Difference
2.99 3.00 -0.01
1.37 1.22 1.16
p =0.93
Not statistically
significant. Cannot reject H0
If the boss insists that employees should attend
training (V11) After
Before Difference
2.35 2.23 0.12
1.14 1.18 0.92
p =0.21
Not statistically
significant. Cannot reject H0
©© UUnniivveerrssiittyy ooff PPrreettoorriiaa

233
Source: Author’s own compilation based on empirical data. Note that Table
6.54 data were rounded off to 2 decimal points.
The implication of not finding any statistically significant p-values at the 95%
significance level, suggest that employees were not more motivated to attend
training than before the SCM awareness intervention. This may suggest that
there are more complex issues to confront in trying to motivate the
respondents to attend training, than what the researcher’s intervention could
achieve in 48 hours.
There would definitely be merit in deeper level investigation into the reasons
motivating employees to attend training. The next section deals with the
opposite effect of hypothesis three by proposing some reasons that may/may
not discourage employees from attending training.
6.3.3. SECTION FOUR: COMPARING THREE GROUPS’ DEMOTIVATING
REASONS
H40: There is no significant difference between perceived reasons
demotivating managers and employees from attending training
H4A: There is a significant difference between perceived reasons
demotivating managers and employees from attending training
REASONS DEMOTIVATING STAFF FROM ATTENDING TRAINING
The reasons given as demotivating reasons that discourage employees from
attending training included: being too busy at work, when one waits for more
senior staff to precede you at the training offered, when training is not relevant
to current job responsibility and when there is no test/exam for assessment.
Managers were asked to agree/disagree in TNA1 with statements provided
that would demotivate their employees from attending training. In TNA2 and
TNA3, the employees were asked to agree/disagree with the same questions.
©© UUnniivveerrssiittyy ooff PPrreettoorriiaa

234
Discrepancy would indicate differing views between managerial level and non-
supervisory levels about reasons demotivating employees to attend training.
As before, the descriptive statistics are presented for each motivating reason
for TNA1, 2 and 3. By initially investigating the proportional responses to the
levels of agreement/disagreement, the statistical hypotheses can be reported
on with greater conviction. The first reason that employees may offer as a
training attendance deterrent, is the very common one of being too busy at
work.
This question used a Likert scale where 1= strongly disagree, 2 = disagree, 3= neutral, 4=
agree and 5= strongly agree.
Table 6.55. Frequencies about being “too busy at work to attend training”
H4.1 (a): Employees would not attend training due to “being too busy at work”.
Management TNA1 (n= 123)
Employees Before TNA2 (n=110)
Employees After TNA3 (n=102)
Frequency Percentage Frequency Percentage Frequency Percentage
1= strongly disagree
03 03.16 20 19.42 16 16.16
2 = disagree
26 27.37 49 47.57 51 51.52
3= neutral 17 17.89 11 10.68 17 17.17
4= agree 41 43.16 21 20.39 13 13.13
5= strongly agree
08 08.42 02 01.94 02 02.02
Total responses (n) 95 103 99
Frequency missing
28 07 03
In Table 6.55 of H4 it seems managers and employees differ in their response
to the statement that being too busy at work is a legitimate reason not to
attend training. Fifty one percent of managers agree with the statement while
more than 60% of TNA2 and TNA 3 employees disagree. It is however going
to be difficult to ascertain whether employees would be determined not to let
In the analysis of the 9 hypotheses the reader is reminded that training needs analyses are
abbreviated to TNA. Hypotheses may be abbreviated to H….
©© UUnniivveerrssiittyy ooff PPrreettoorriiaa

235
busy schedules interfere with training or whether managers would see it as a
legitimate reason to postpone training. More in-depth probing would be
required in future research endeavours to qualify the obvious gap in opinions.
The comparison between the TNA1 group of managers and the TNA2 group
of employees yields an effective sample size of 198, with 35 frequencies
missing. The contingency table yields a Fisher’s Exact test probability of less
than 0.0001 where Pr<= 1.645E-10.
The probability that this difference in preference between managers and
employees is due to chance alone is less than 0.0001 at the 5% significance
level, at two degrees of freedom. Therefore there is a significant statistical
difference between the managers (TNA1) and employees (TNA2) using
the demotivating factor of being ‘too busy at work’ as a reason not to
attend training. This variable would indicate that the null hypothesis
must be rejected.
The comparison between the TNA1 group of managers and the TNA3 group
of employees yields an effective sample size of 194, with 31 frequencies
missing. The contingency table yields a Fisher’s Exact test probability of less
than 0.0001 where Pr<= 1.898E-11. Therefore there is also a significant
statistical difference between the managers (TNA1) and employees
(TNA3) using the demotivating factor of being ‘too busy at work’ as a
reason not to attend training. This variable would indicate that the null
hypothesis must be rejected.
The next comparison is about the demotivating reason where employees wait
for senior staff to attend training first.
©© UUnniivveerrssiittyy ooff PPrreettoorriiaa

236
Table 6.56. Frequencies about “waiting for seniors to attend training
first”
H4.2: Employees would not attend training due to waiting for their seniors to go before them Management TNA1
(n=123) Employees Before TNA2 (n=110)
Employees After TNA3 (n= 102)
Frequency Percentage Frequency Percentage Frequency Percentage
1= strongly disagree 25 26.60 30 28.57 24 24.24
2 = disagree 47 50.00 47 44.76 50 50.51
3= neutral 11 11.70 14 13.33 12 12.12
4= agree 07 07.45 08 07.62 08 08.08
5= strongly agree 04 04.26 06 05.71 05 05.05
Total responses (n) 94 105 99
Frequency missing
29 05 03
From the frequencies in Table 6.56 of H4 there seems to be unanimous
disagreement between managers (at 76%) and employees (at 73% for TNA2
and 74% for TNA3) respectively, with this H4.2.statement. By default it means
that managers and employees are united in regarding this reason not to
attend training, with disdain. Perhaps it is not surprising therefore that the
statistical test also yields a non-significant result.
The comparison between the TNA1 group of managers and the TNA2 group
of employees yields an effective sample size of 199, with 34 frequencies
missing. The contingency table yields a Fisher’s Exact Test probability of
more than 0.05 where Pr<= 0.9552.
The probability that this difference in preference between managers and
employees is due to chance alone is more than 0.05 at the 5% significance
level, at two degrees of freedom. Therefore there is no significant
statistical difference between the managers (TNA1) and employees
(TNA2) using the demotivating factor of having ‘to wait for senior
©© UUnniivveerrssiittyy ooff PPrreettoorriiaa

237
personnel to attend training first’ as a reason not to attend training. The
decision is therefore not to reject the null hypothesis.
The comparison between the TNA1 group of managers and the TNA3 group
of employees yields an effective sample size of 193, with 32 frequencies
missing. The contingency table yields a Fisher’s Exact Test probability of
more than 0.05 where Pr<= 0.9987. The probability that this difference in
preference between managers and employees is due to chance alone is more
than 0.05 at the 5% significance level, at two degrees of freedom. Therefore
there is no significant statistical difference between the managers
(TNA1) and employees (TNA3) using the demotivating factor of having
‘to wait for senior personnel to attend training first’ as a reason not to
attend training.
The next comparison is about the demotivating reason where employees and
managers state their preferences on tests that may/may not accompany
training programs.
Table 6.57. (i). Frequencies for Managers (TNA1) where “tests and exams are the demotivating reason not to attend training”
H4.3 (i) from Managers’ perspective: “Employees would not attend if there was NO test or exam involved with the training”. Where TNA1 ( n=123) Frequency Percentage 1= strongly disagree 24 25.53 2 = disagree 42 44.68 3= neutral 16 17.02 4= agree 10 10.64 5= strongly agree 02 02.13 Total responses (n) 94 Frequency missing 29
From the frequencies in Table 6.57(i) the managers lean more towards
disagreement with the statement that employees would be deterred from
training in the absence of tests or exams. More than 70% of managers
disagree which indicates that they trust their employees not to disregard
©© UUnniivveerrssiittyy ooff PPrreettoorriiaa

238
training only because the assessment opportunity is lacking. Therefore
employees are not demotivated by having no test linked to their training
programs, according to the management group (TNA1).
However, the managers’ question (from TNA1) was turned around from
having no test to assess the employees and possibly award a certificate for
passing the test, to the feared position of employees not wanting to be tested
after their training. The corollary of the question in Table 6.57(i) tries to
determine if employees fear tests or whether they expect them to be a normal
part of training. In both TNA2 and TNA3 frequencies, it appears that
employees are also not demotivated by the existence of a test or examination
at the end of the training.
Table 6.57. (ii). Frequencies for Employees (TNA2 and TNA3) where “tests and exams are a demotivating reason not to attend training”
H4.3 (ii) from Employees’ perspective: “Employees would not attend if there WAS a test or exam involved with the training.”
Employees Before TNA2 (n=110)
Employees After TNA3 (n=102)
Frequency Percentage Frequency Percentage
1= strongly disagree 36 33.96 33 33.33
2 = disagree 56 52.83 59 59.60 3= neutral 02 01.89 03 03.03 4= agree 11 10.38 04 04.04 5= strongly agree 01 0.94 00 00.00
Total responses (n) 106 99 Frequency missing 04 03
More than 80% respectively of the employee groups summarised in Table
6.57(ii), disagree with the statement that tests and exams would demotivate
them from attending training. Since the questionnaires differed and are
therefore two different variables, no comparative test could be done between
TNA1-TNA2 nor between TNA1-TNA3. Instead the paired sample t-test was
conducted between TNA 2-TNA3 only.
©© UUnniivveerrssiittyy ooff PPrreettoorriiaa

239
Table 6.57. (iii). Paired sample test for employees on the demotivating variable of “having tests/exams involved with the training” H4.3 (ii) : Employees would be demotivated to attend training if there WAS a test or exam involved with the training.” Motivating Reason Mean=
after- before= difference
Standard Deviation
p-value per variable analysed
Decision to accept/reject H 0 at the 5% level of significance:
If there were a test/exam involved with the training (V14)
After Before
Difference
1.758 1.853 -0.095
0.664 0.899 0.864
p =0.2878
Not statistically
significant. Cannot reject H0
Since the p-value for the paired sample t-test is not statistically significant
(p=0.2878), it shows that employees did not change their views in the 48-hour
reflection period. Therefore there is no significant statistical difference
between the employees (TNA2-TNA3) using the demotivating factor of having
‘a test/exam’ for the training course” as a reason not to attend training. This
variable would indicate that the null hypothesis H4.3 (ii) cannot be rejected.
The next comparison is about the demotivating reason where employees
would not attend training if they considered it to be irrelevant to their current
positions or responsibilities at work.
Table 6.58. Frequencies about the ”lack of relevance as a reason not to attend training”
H4.4: “The training was not relevant to their current responsibilities”
Management TNA1 (n=123)
Employees Before TNA2 (n=110)
Employees After TNA3 (n=102)
Frequency Percentage Frequency Percentage Frequency Percentage
1= strongly disagree 14 15.22 22 20.75 18 18.00
2 = disagree 38 41.30 37 34.91 46 46.00
3= neutral 19 20.65 13 12.26 11 11.00
4= agree 20 21.74 23 21.70 18 18.00
5= strongly agree 01 1.09 11 10.38 07 7.00
Total responses (n) 92 106 100
Frequency missing
31 04 02
©© UUnniivveerrssiittyy ooff PPrreettoorriiaa

240
The comparison between the TNA1 group of managers and the TNA2 group
of employees yields an effective sample size of 198, with 35 frequencies
missing. The contingency table yields a Fisher’s Exact Test probability of less
than 0.05 where Pr<= 0.0269.
The probability that this difference in preference between managers and
employees is due to chance alone is less than 0.05 at the 5% significance
level, at two degrees of freedom. Therefore there is a significant statistical
difference between the managers (TNA1) and employees (TNA2) using
the demotivating factor of having ‘training that is not relevant’ as a
reason not to attend training. This variable would indicate that the null
hypothesis must be rejected.
The comparison between the TNA1 group of managers and the TNA3 group
of employees yields an effective sample size of 192, with 33 frequencies
missing. The contingency table yields a Fisher’s Exact Test probability of
more than 0.05 where Pr<= 0.1051.
The probability that this difference in preference between managers and
employees is due to chance alone is more than 0.05 at the 5% significance
level, at two degrees of freedom. Therefore there is no significant
statistical difference between the managers (TNA1) and employees
(TNA3) using the demotivating factor of having ‘training that is not
relevant’ as a reason not to attend training. This variable would indicate
that the null hypothesis cannot be rejected.
This brings the comparison on demotivating variables to an end. The next
table summarises the findings for Hypothesis 4.
©© UUnniivveerrssiittyy ooff PPrreettoorriiaa

241
Table 6.59. (i) Summary of variables “demotivating employees from attending training compared to managers’ perceptions” H4 Demotivating
Variables
Fishers Exact
test results
TNA 1 and
TNA2
Decision to
accept/reject
the Null
Hypotheses
Fishers Exact
test results
TNA 1 and
TNA3
Decision to
accept/reject
the Null
Hypotheses
1. Too busy at
work
Pr<= 0.0001 Reject H0 Pr<=0.0001 Reject H0
2. Wait for
seniors
Pr<=0.9552 Cannot Reject
H0
Pr<=0.9987 Cannot Reject
H0
3. Training and
Tests
This test was
not performed
This test was
not performed
4. Training not
relevant
Pr<=0.0269 Reject H0 Pr<=0.1051 Cannot Reject
H0
The findings from H4Table 6.59 (i) show that employees are not really affected
by senior staffers preceding them on training programs before and after the
intervention. The variable about training being relevant changed in the 48
hours between the before and after the training intervention. This area
suggests an area of further investigation. The summary of comparison
between TNA2-TNA3 employee views follows in Table 6.59. (ii) below. This
will be expounded on in chapter seven.
The paired sample test for employees on the demotivating variable of having
tests/exams involved with the training yielded no surprising results.
©© UUnniivveerrssiittyy ooff PPrreettoorriiaa
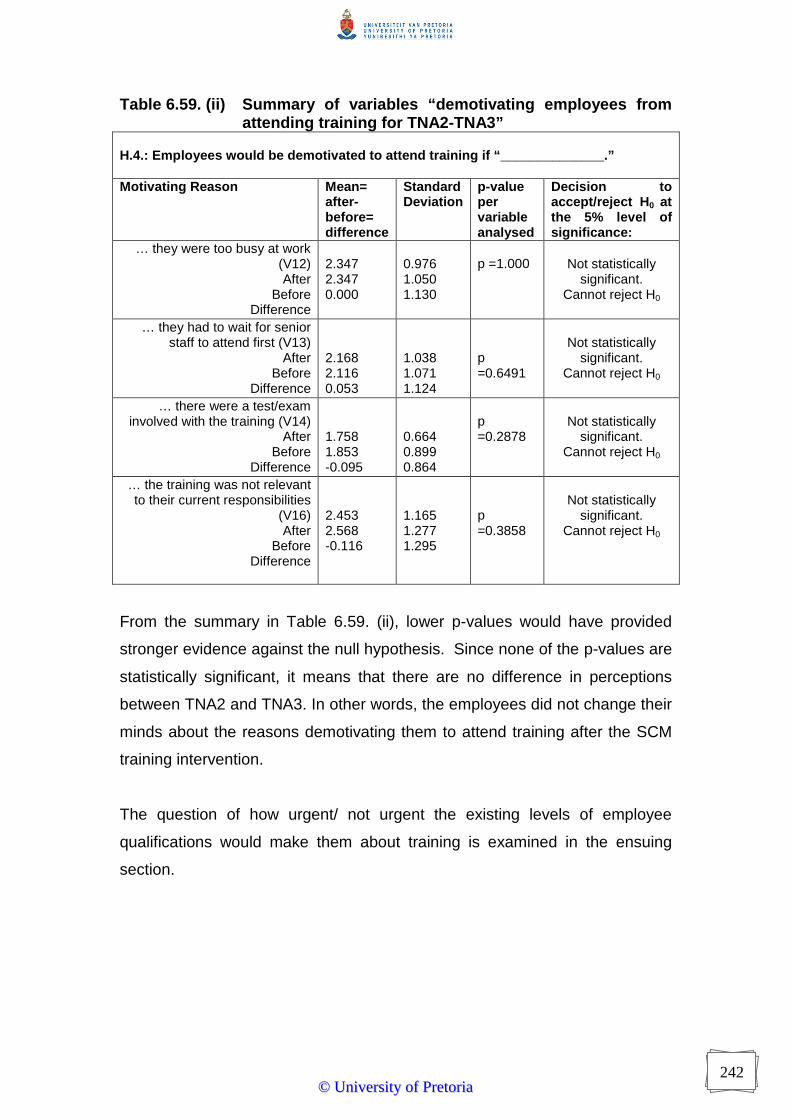
242
Table 6.59. (ii) Summary of variables “demotivating employees from attending training for TNA2-TNA3” H.4.: Employees would be demotivated to attend training if “______________.” Motivating Reason Mean=
after- before= difference
Standard Deviation
p-value per variable analysed
Decision to accept/reject H 0 at the 5% level of significance:
… they were too busy at work (V12) After
Before Difference
2.347 2.347 0.000
0.976 1.050 1.130
p =1.000
Not statistically
significant. Cannot reject H0
… they had to wait for senior staff to attend first (V13)
After Before
Difference
2.168 2.116 0.053
1.038 1.071 1.124
p =0.6491
Not statistically
significant. Cannot reject H0
… there were a test/exam involved with the training (V14)
After Before
Difference
1.758 1.853 -0.095
0.664 0.899 0.864
p =0.2878
Not statistically
significant. Cannot reject H0
… the training was not relevant to their current responsibilities
(V16) After
Before Difference
2.453 2.568 -0.116
1.165 1.277 1.295
p =0.3858
Not statistically
significant. Cannot reject H0
From the summary in Table 6.59. (ii), lower p-values would have provided
stronger evidence against the null hypothesis. Since none of the p-values are
statistically significant, it means that there are no difference in perceptions
between TNA2 and TNA3. In other words, the employees did not change their
minds about the reasons demotivating them to attend training after the SCM
training intervention.
The question of how urgent/ not urgent the existing levels of employee
qualifications would make them about training is examined in the ensuing
section.
©© UUnniivveerrssiittyy ooff PPrreettoorriiaa

243
6.3.5. SECTION FIVE: TEST OF ASSOCIATION
H50: There is no relationship between existing educational
qualifications and urgency for employee training
H5A: There is a relationship between existing educational qualifications
and urgency for employee training
This hypothesis obtained answers about respondents’ existing qualifications
separately from the question about the urgency for supply chain management
training. The question about urgency was only asked to the employee level
respondents, which means that TNA1 did not contain the latter variable about
urgency.
The highest qualifications of the management respondents lean positively towards
the tertiary level of qualifications as shown in H5 Table 6.60 below. What is also
notable is that all 123 managerial respondents volunteered this information in TNA 1.
It was expected for the South African context that the highest qualifications of the
employee respondents would lean away from the tertiary level of qualifications
toward more basic educational levels. This is confirmed as shown in the same H5
Table 1 where 49% of the respondents report qualifications of matric level (about 12
years of basic education) or less. This question was answered well for the
employees also since 108/110 respondents volunteered this information in TNA2. It
is reassuring to see that 39% (42/108) of employees (from TNA2) have obtained
diplomas and certificates after the matric level of qualification. Note that Managers
are now abbreviated to MNGT in the table and EMPLOYEES to EMP. Cumulative
percentage has been shortened to Cum. %
Table 6.60 follows on the next page…….
©© UUnniivveerrssiittyy ooff PPrreettoorriiaa

244
Table 6.60. Highest qualifications reported by TNA 1 managers and TNA2 and TNA3 Employees The highest educational level
obtained at the time of the
survey in Jul-Oct 2011
Frequency
TNA1
MNGT
Cum.
%
Frequency
TNA2
EMP
Cum.
%
Frequency
TNA3
EMP
Cum.
%
Less than matric/ grade 12 03 2.44 18 16.67 18 18 Matric / grade 12 03 4.88 35 49.07 30 48 Matric plus diplomas & certificates
30 29.27 42 87.96 38 86
Bachelors/ B.Tech degree 39 60.98 12 99.07 12 98 Postgraduate Honours, Masters or Doctorate degree
48 100 01 100 01 99
Total respondents (n) 123 108 100 Frequency Missing 00 02 02
This exact question about employee qualification and the respondents’
urgency to attend training question was absent from the TNA1
questionnaire. However when the Employees were pertinently
questioned on whether staff with existing qualifications, are not urgent
about further training in SCM, their answers reflected as in H5 Table
6.61. below.
Table 6.61.(i) Frequencies of staff with “existing qualifications and their urgency to attend further training” Variable: “Staff with existing qualifications are not urgent about further training”.
TNA2 Frequency TNA2 % TNA3
Frequency TNA3 %
1= strongly disagree 09 8.57 12 11.88 2 = disagree 34 32.38 37 36.63 3= neutral 29 27.62 23 22.77 4= agree 31 29.52 27 26.73 5= strongly agree
02 1.90 02 1.98 Total responses (n) 105 101 Frequency missing 05 01
From H5 Table 6.61 (i), more than 40% of the TNA2 respondents disagreed
with the statement that “staff with existing qualifications, are not urgent about
further training”. About 30% actually agreed with the statement. The TNA3
©© UUnniivveerrssiittyy ooff PPrreettoorriiaa
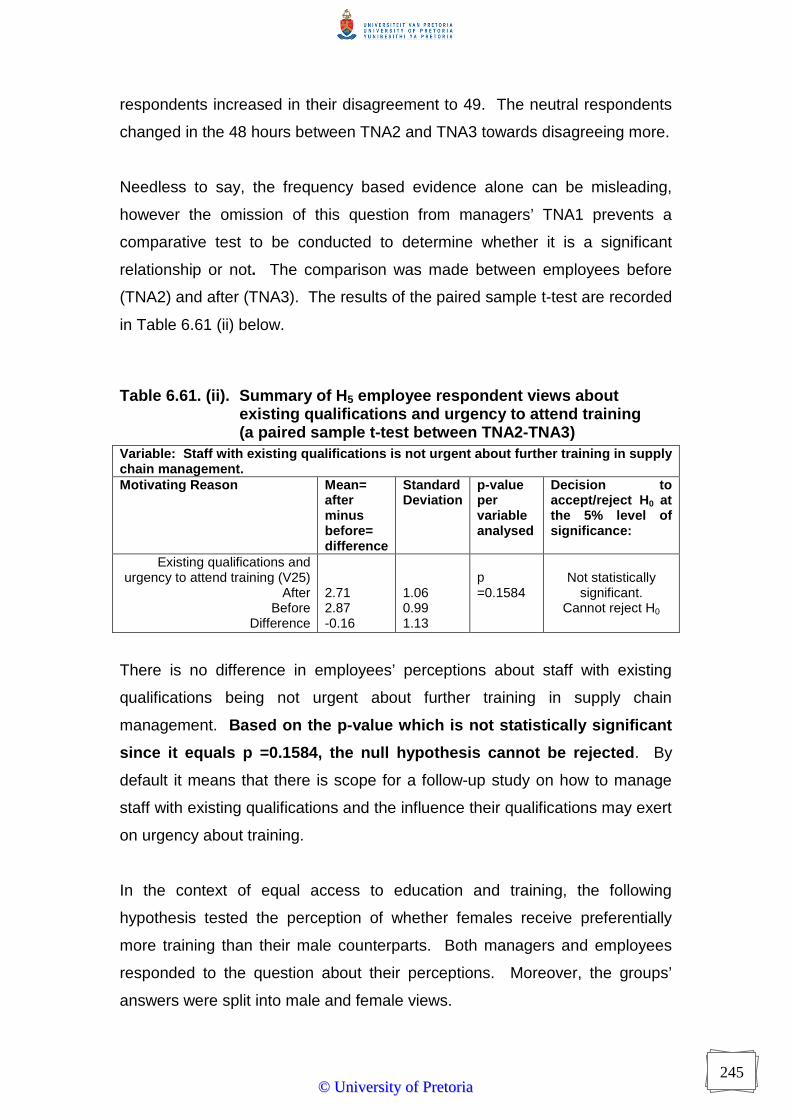
245
respondents increased in their disagreement to 49. The neutral respondents
changed in the 48 hours between TNA2 and TNA3 towards disagreeing more.
Needless to say, the frequency based evidence alone can be misleading,
however the omission of this question from managers’ TNA1 prevents a
comparative test to be conducted to determine whether it is a significant
relationship or not. The comparison was made between employees before
(TNA2) and after (TNA3). The results of the paired sample t-test are recorded
in Table 6.61 (ii) below.
Table 6.61. (ii). Summary of H 5 employee respondent views about existing qualifications and urgency to attend training (a paired sample t-test between TNA2-TNA3) Variable: Staff with existing qualifications is not urgent about further training in supply chain management. Motivating Reason Mean=
after minus before= difference
Standard Deviation
p-value per variable analysed
Decision to accept/reject H 0 at the 5% level of significance:
Existing qualifications and urgency to attend training (V25)
After Before
Difference
2.71 2.87 -0.16
1.06 0.99 1.13
p =0.1584
Not statistically
significant. Cannot reject H0
There is no difference in employees’ perceptions about staff with existing
qualifications being not urgent about further training in supply chain
management. Based on the p-value which is not statistically significant
since it equals p =0.1584, the null hypothesis cannot be rejected . By
default it means that there is scope for a follow-up study on how to manage
staff with existing qualifications and the influence their qualifications may exert
on urgency about training.
In the context of equal access to education and training, the following
hypothesis tested the perception of whether females receive preferentially
more training than their male counterparts. Both managers and employees
responded to the question about their perceptions. Moreover, the groups’
answers were split into male and female views.
©© UUnniivveerrssiittyy ooff PPrreettoorriiaa
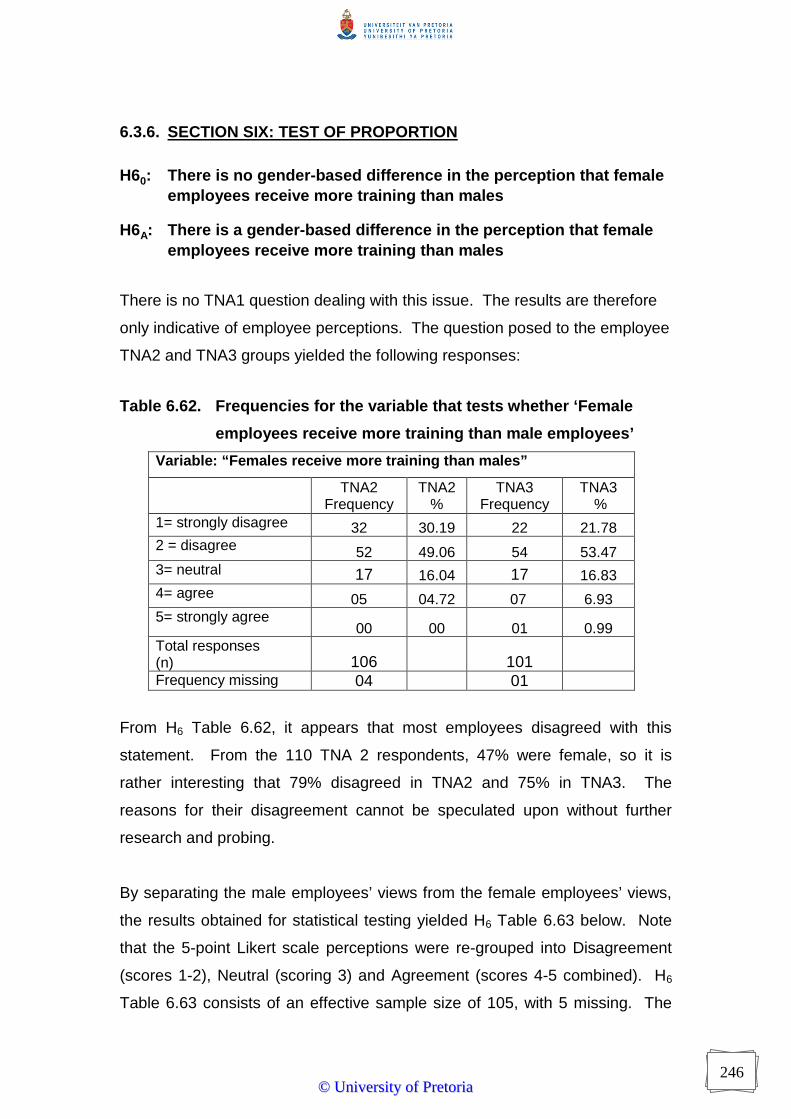
246
6.3.6. SECTION SIX: TEST OF PROPORTION
H60: There is no gender-based difference in the perception that female employees receive more training than males
H6A: There is a gender-based difference in the perception that female employees receive more training than males
There is no TNA1 question dealing with this issue. The results are therefore
only indicative of employee perceptions. The question posed to the employee
TNA2 and TNA3 groups yielded the following responses:
Table 6.62. Frequencies for the variable that tests whether ‘Female
employees receive more training than male employees’
Variable: “Females receive more training than males”
TNA2 Frequency
TNA2 %
TNA3 Frequency
TNA3 %
1= strongly disagree 32 30.19 22 21.78 2 = disagree 52 49.06 54 53.47 3= neutral 17 16.04 17 16.83 4= agree 05 04.72 07 6.93 5= strongly agree
00 00 01 0.99 Total responses (n) 106 101 Frequency missing 04 01
From H6 Table 6.62, it appears that most employees disagreed with this
statement. From the 110 TNA 2 respondents, 47% were female, so it is
rather interesting that 79% disagreed in TNA2 and 75% in TNA3. The
reasons for their disagreement cannot be speculated upon without further
research and probing.
By separating the male employees’ views from the female employees’ views,
the results obtained for statistical testing yielded H6 Table 6.63 below. Note
that the 5-point Likert scale perceptions were re-grouped into Disagreement
(scores 1-2), Neutral (scoring 3) and Agreement (scores 4-5 combined). H6
Table 6.63 consists of an effective sample size of 105, with 5 missing. The
©© UUnniivveerrssiittyy ooff PPrreettoorriiaa

247
re-grouping of data was done to counteract the warning that Chi-square was
not an appropriate test and to allow for the Fisher’s Exact test to be applied.
The results of the statistical test, is the contingency table named H6 Table
6.63, which follows next.
Table 6.63. Male versus female comparison on whether female employees receive more training than male employees for TNA2. MALE % FEMALE %
Strongly disagree and Disagree =1-2 42 73.68 41 85.42
Neutral = 3 13 22.81 04 08.33
Agree and Strongly Agree =4-5 02 03.51 03 06.25
Total (n) 57 48
The resultant grouping of disagreement and agreement yielded the following
result on the statistical test application: Fisher’s Exact test yielded a Pr<=
0.1237 at the 5% significance level. This result means there is no
statistically significant difference in gender perceptions about whether
females receive more training in the workplace. Therefore the H6 0 null
hypothesis cannot be rejected on the basis of these findings.
Since there is speculation about whether older people in business
organisations actually attend training, or whether training is targeted at
younger staff members, the seventh hypothesis is subsequently put forward.
©© UUnniivveerrssiittyy ooff PPrreettoorriiaa

248
6.3.7. SECTION SEVEN: MEASURE OF PROPORTION & ASSOCIATION
H70: There is no difference in the frequency of training requests
between the late-career-stage employees (older than 45 years)
and others
H7A: There is a difference in the frequency of training requests
between the late-career-stage employees (older than 45 years)
and others
Note that the TNA1 question dealing with this issue referred to older and
younger employees while the TNA2 and TNA 3 question specifically asked
about being older than 45 years of age. This question was presented to
employees to gauge their perceptions: “if employees are older than 45 years
of age, they do not request as much training as the younger staff members”.
The employee results are shown in H7 Table 6.64. There was no directly
corresponding question asked of managers in the TNA1 questionnaire,
however a different version of the question asked managers if this is a reason
for their employees not to attend training. The managers’ findings are
recorded in H7 Table 6.65.
Table 6.64. Frequency of responses by employees in both TNA2 and TNA3.
H7-Variable: “Employees older than 45 years of age do not request as much training as younger staff” Employees Before
(TNA2) Employees After (TNA3)
Frequency % Frequency % 1= strongly disagree 17 15.60 27 19.80
2 = disagree 37 33.94 30 29.70 3= neutral 16 14.68 19 18.81 4= agree 33 30.28 24 23.76
5= strongly agree 06 05.50 08 07.92 Total responses (n) 109 101 Frequency missing 01 01
From Table 6.64. employees appear to be divided on this question. Fifty-four
respondents (about 49%) from TNA2 disagreed with the notion that
employees older than 45 years do not request as much training as the
©© UUnniivveerrssiittyy ooff PPrreettoorriiaa

249
younger staff members. This is in contrast to the 39 people (about 35%) who
agreed with the statement. From the TNA 3 data, it appears more employees
wanted to remain neutral on the issue, than who were previously neutral in
TNA2. Also notable is that the proportion which agreed, decreased by the
same amount of non-response of the TNA 3 questionnaire.
In contrast the managers’ response to whether “employees are too old to
attend training” yielded the proportions set out in H7 Table 6.65.
Table 6.65. Frequency of responses by TNA1 managers about their “employees’ age and their willingness to attend/not attend training.
From H7 Table 6.65, seventy-six managers disagreed with the statement
about employees being too old for training. The proportion of managers in
disagreement is in agreement with the employee response even though the
managers in % TNA1 were not specifically led to believe that employees older
than 45 years; are actually considered “old”. This suggests that age or being
older than 45 years, does not automatically qualify as a demotivating reason
for employees not to attend training; albeit from their managers’ perspective.
H7-Variable: “Employees are too old for training and therefore only younger ones attend”.
Managers (TNA1) Frequency Percentage
1= strongly disagree 36 38.30
2 = disagree 40 42.55
3= neutral 11 11.70
4= agree 06 06.38
5= strongly agree 01 01.06 Total responses (n) 94 Frequency missing 29
©© UUnniivveerrssiittyy ooff PPrreettoorriiaa

250
Table 6.66. Statistics of location for late-career-stage (>45 years old) employees for TNA2 and age
Simple Statistics
Variable N Mean Std Dev Sum Min. Max. Label
Variable late-career-stage where employee older >45 years
100 2.83 1.20651 283 1 5 V27
Variable: age of employees
100 35.79 9.47969 3579 19 60 V5
When testing the correlation co-efficient, the values of Rho should be between
+1 and -1.
Table 6.67. The Pearson Correlation Coefficient for late-career-stage (>45 years old) employees for TNA2 and Employee age.
Pearson Correlation Coefficients, N = 100 Prob > |r| under H0: Rho=0
Variable (V5): Age of employees
Variable (V27) where employee older >45 years
Variable (V27) where employee older >45 years
-0.13651
p-value = 0.1756
From H7 Table 6.67. the value of Rho at negative 0.13651 indicates a slightly
negative relationship between the chronological age of employees and the
over 45 employees’ willingness to attend training. Since the p-value is equal
to 0.1756, it shows a statistically non-significant relationship and
therefore the H 7 Null hypothesis for Employees cannot be rejected. This
hints at the opposite of the Null hypothesis and could mean that the age of
being over 45 years of age, does indeed not impact on employee willingness
to attend training. This means there is no statistically significant difference in
the frequency of training requested between >45 years and others.
©© UUnniivveerrssiittyy ooff PPrreettoorriiaa

251
6.3.8. SECTION EIGHT: MEASURE OF PROPORTION AND
ASSOCIATION
H80: There is no significant difference in the willingness to attend
training between long-tenure employees (employed >10 years) in
the same organisation and new recruits
H8A: There is a significant difference in the willingness to attend
training between long-tenure employees (employed >10 years) in
the same organisation and new recruits
Table 6.68. Frequencies about long-tenure employees and their
willingness to attend training.
Variable: “Long-tenure employees are not as willing as young recruits to attend training” Employees Before
(TNA2) Employees After (TNA3)
Frequency % Frequency % 1= strongly disagree 14 13.46 14 13.73
2 = disagree 50 48.08 51 50.00 3= neutral 18 17.31 19 18.63 4= agree 18 17.31 17 16.67
5= strongly agree 04 03.85 01 0.98 Total responses 104 102 Frequency missing 06 00
From H8 Table 6.68 about sixty two percent of TNA2 employees disagree with
the statement that working for the same organisation for longer than 10 years
would make employees unwilling to attend training. This percentage even
increased for TNA3 to 64%. Twenty percent and less agree with this
statement for both TNA2 and TNA 3. One has to take into account that the
majority of the TNA1 management respondents were not employed for more
than ten years with their particular organisations in the first place.
©© UUnniivveerrssiittyy ooff PPrreettoorriiaa

252
By contrasting the TNA2 group’s variables “number of years employed, age of
respondents and their tenure with the organisation” where they participated in
the research study, H8 Table 6.69 yielded the following statistics of location:
Table 6.69. Statistics of location for long tenure career stage employees for TNA2 and Number of years employed by the same organisation
Simple Statistics
Variable N Mean Std Dev
Sum Min. Max. Label
Variable = long tenure where employee is employed for >10 years
100 2.48 1.01980 248 1.00 5 V28
Variable = number of years employed at same organisation
100 7.98 7.56651 798 1.00 32 V3
Table 6.70. The Pearson Correlation Coefficient for long tenure where employee is employed for >10 years for TNA2 versus the number of years employed by the same organisation.
Pearson Correlation Coefficients, N = 100 Prob > |r| under H0: Rho=0
V3 = number of years employed at same organisation
Variable V28= long tenure where employee is employed for >10 years
Variable V28 = long tenure where employee is employed for >10 years
-0.11656
p-value = 0.2481
According to H8 Table 6.70, there is not a strong correlation between
employees’ long tenure where the employee is employed for >10 years and
the number of years they had been with the researched organisation. Since
©© UUnniivveerrssiittyy ooff PPrreettoorriiaa

253
the p-value is equal to 0.2481, it shows a statistically non-significant
relationship and therefore the H 8 Null hypothesis for Employees cannot
be rejected. This suggests that long tenure careers that extend beyond 10
years; may very well not impact on employee willingness to attend training,
compared to more recently employed employees.
______________________________________________________________
6.3.9. SECTION NINE: TEST OF PROPORTION
H90: Employees are not likely to request more training when employers
insist on a repayment contract
H9A: Employees are likely to request more training when employers
insist on a repayment contract
Table 6.71. Frequencies about employees’ willingness to attend training when employers insist they first sign a contract
Variable: “employees’ likelihood to request more training when employers insist they first sign a contract” Employees Before
(TNA2) Employees After (TNA3)
Frequency % Frequency % 1= strongly disagree 12 11.32 13 12.87
2 = disagree 32 30.19 31 30.69 3= neutral 16 15.09 21 20.79 4= agree 36 33.96 29 28.71
5= strongly agree 10 09.43 07 06.93 Total responses (n) 106 101 Frequency missing 04 01
From H9 Table 6.71, more than 40% of employees disagree that they would
be less willing to attend training if organisations insist they sign a (obligation to
pay back) contract. However, it seems that employees became more neutral
about their willingness to attend training in TNA 3 than TNA2.
In contrast, the question had been re-phrased for managers and their TNA1
frequencies show their perception in H9 Table 6.72 below. No managers
©© UUnniivveerrssiittyy ooff PPrreettoorriiaa

254
strongly agreed with this statement and due to the non-response, the option
five column had no frequencies.
Table 6.72. TNA1 Managers’ frequencies about employee refusal to sign a contract to pay back before attending training
From H9 Table 6.72, it appears that managers mostly disagreed about
whether this statement could have been a true deterrent to employees
attending training. The high non-response of 30, is a clear indication that this
question was not well received by managers in the TNA1 questionnaire.
Since the issue of signing a contract to repay the costs of training appears to
be open for further debate, there cannot be any conclusive argument about
employees’ nor about managers’ views.
Variable: “Employees refuse to sign a contract and therefore did not attend training in the past” Managers (TNA1)
Frequency Percentage
1= strongly disagree 35 37.63
2 = disagree 39 41.94
3= neutral 10 10.75
4= agree 09 9.68
5= strongly agree 00 0.00 Total responses (n) 93 Frequency missing 30
©© UUnniivveerrssiittyy ooff PPrreettoorriiaa
255
6.4. SUMMARY OF FINDINGS IN TRAINING NEEDS
The findings of nine hypotheses in total were discussed above. The
conclusions based on the empirical evidence analysed will be expanded in
this section. Findings of managers versus employees, male versus female
and between managers and non-supervisory staff are discussed here. The
hypotheses will be discussed in sequence from H1 to H9. The purpose of this
section is to pre-empt the discussions encapsulated in the final chapter.
6.4.2. HYPOTHESIS 2
The H2 null hypothesis that there is no significant difference between the
formats of training preferred by managers and employees yielded different
decisions to reject/not reject the null hypothesis based on the specific variable
under scrutiny.
The results were obtained by using Fisher’s Exact test on contingency tables
for independent samples and the Simple Kappa Test for dependent samples.
The findings are bulleted below for ease of reference between the 8 variables
that were being tested.
6.4.3. HYPOTHESIS 3
The H3 null hypothesis about reasons motivating (TNA2) employees to attend
training yielded different decisions to reject/not reject the null hypothesis
based on the specific motivating variable examined. The managers (TNA1)
were asked whether they agreed/disagreed on a 5-point Likert scale with
reasons that would motivate employees to attend training. The reasons given
as motivating reasons to encourage employees to attend training included:
improved prospects of promotion, training being new, zero cost to the
employee, to allow employees to escape the workplace and lastly insistence
from supervisory staff.
Initially by examining the frequencies using descriptive statistics, employee
promotion, industry newness of training courses and free courses all
appeared to be motivators to employee respondents without doubt.
©© UUnniivveerrssiittyy ooff PPrreettoorriiaa

256
Managers did not agree with employees (from both TNA2 and TNA3) on 4 of
the 5 reasons given. The only variable with seemingly straightforward
agreement between managers and employees appeared to be the prospect of
promotion.
However when using the Kruskal-Wallis non-parametric test (between TNA1-
TNA2) to determine whether the relationship between respondents existing
qualifications and the variables that motivate them is due to chance alone;
new information was uncovered. The K-W one-way ANOVA showed two new
statistically significant p-values apart from the promotion motivator. The
newness of the training course and whether the training was for free yielded
results that made us reject the null hypothesis. The time off work and boss’
insistence variables now sided with promotion in us being unable to reject the
null hypothesis.
However the picture was not complete without testing employee responses
from TNA2-TNA3. The paired sample t-tests yielded 5 results that were not
statistically significant. This meant that employees did not change their
reasons for motivation based on the SCM awareness intervention or within
the 48 hours of reflection.
Overall these results demonstrate that employee motivation lies deeper than
what the research study was able to uncover. The results also warn that
frequency proportion comparisons can be misleading and inconclusive. Even
though we thought that managers and employee agreement on the prospects
of promotion seemed to be the only obvious motivator, the findings from the
inferential statistical tests proved to the contrary for H3. The variable of
motivation can thus be qualified by using the existing qualifications of
respondents as a common starting point of reference.
6.4.4. HYPOTHESIS 4
The H4 null hypothesis stated that there is no significant difference between
reasons demotivating employees from attending training. The demotivating
variables included: being too busy at work, waiting for senior staff to attend
©© UUnniivveerrssiittyy ooff PPrreettoorriiaa
257
training first, training not being relevant to current responsibilities and training
without assessment. Overall there seemed to be less of a gap between
managers and employees on the demotivating reasons of H4 than on the
motivating reasons from H3.
Initially the employee perceptions (both TNA2 and TNA3) compared to
managers’ perceptions appeared to be polar opposites. The variable of ‘being
too busy to attend training’ was perceived as a valid reason by managers, but
not by employees. This differing perception was validated through the TNA1-
TNA2 Fisher’s Exact Test as a case to reject the null hypothesis.
When managers and employees both disagreed that employees would not
attend training because they are waiting for senior staff members to precede
lower level employees, the Fisher Exact tests (for both TNA1-TNA2 and
TNA1-TNA3) confirmed that the null hypothesis should not be rejected. This
means that there is no difference between managers and employee views on
this statement. Although there may be another underlying reason that would
demotivate employees from attending training, I cannot extract any solid truth
from the H4.2 demotivating reason alone.
The H4.3(i) hypothesis stated that employees would not attend training if there
was no test or exam involved with the training. This question was asked of
the managers only in TNA1. Seventy percent of the managers from TNA1
disagreed with the statement (*this combined “strongly disagree” with
“disagree figures”). This could possibly be because they have experienced
sending employees to training where there was no assessment involved,
before the survey. Or they perceive their employees as not being too
concerned whether training has a test or not.
The H4.3.(ii) statement applied to both TNA2 and TNA3 and were answered by
employee groups only. The H4.3.(ii) was unintentionally rephrased to say that
employees would not attend training if there was a test or exam involved with
the training. The employees disagreed more with their statement. In TNA2
about 87% and 93% in TNA3 disagreed with (*) the statement that they would
©© UUnniivveerrssiittyy ooff PPrreettoorriiaa

258
stay away from training due to there being a test/exam involved with the
training.
The H4.4 stated that employees would not attend training if it were not relevant
to their current responsibilities. From the descriptive statistics managers
(TNA1) and employees (in both TNA2 and TNA3) were reacting in a similar
fashion to the statement. Yet the Fisher’s Exact tests between TNA1-TNA2
showed a statistically significant reason to reject the null hypothesis. In
contrast the Fisher’s Exact test between TNA1-TNA3 showed a non-
significant result.
6.4.5. HYPOTHESIS 5
The null hypothesis for H50 stated that there is no relationship between
existing educational qualifications and the urgency for employees to attend
supply chain training. The question was not asked of the management group
and the TNA2 employees were split between 40%: 30% being in
disagreement versus agreement with the statement. The TNA3 respondents
increased in their disagreement to 49%, which can be attributed to the neutral
respondents who changed in the 48 hours between TNA2 and TNA3 towards
disagreeing more.
The paired sample t-test did not yield a statistically significant result and
therefore the null hypothesis cannot be rejected.
6.4.6. HYPOTHESIS 6
The management level decision makers amongst the respondents, split into
70:30 ratio where males outnumbered the females. This is similar to
overseas research respondents in supply chain management. At lower levels
of the organisational hierarchy, the employees were split more evenly 53:47
for the ratio male: female. The gender activists may or may not be justified in
calling for more female representation at higher managerial levels in South
Africa, however the gender variable was used to test if females are perceived
©© UUnniivveerrssiittyy ooff PPrreettoorriiaa
259
as receiving more training than males. Although females were less than
males in the both respondent groups, there appears to be no bias perceived
towards females receiving more training in supply chain industries.
6.4.7. HYPOTHESIS 7
The bulk of manager respondents were between the ages of 35-45 years
while the employee bulk lay between 29-40 years of age. The age variable
was linked to both the perception of being willing to attend training and
whether employees could become too old to attend training. In the first
incidence, almost 50% of employees disagreed that being older than 45 years
of age is enough reason to lessen employee frequency of requests to attend
training. More than 80% of management disagreed that only younger
employees would attend training. A slightly negative relationship between the
TNA2 Employees “before group” about being over 45 and age in general.
The data showed a statistically non-significant Pearson Correlation coefficient
when tested, which means that the Null hypothesis (that there is no significant
difference) cannot be rejected. It is important to note however that there is no
evidence nor suggestion from the research conducted that being over 45
years should be classified old in the supply chain arena.
6.4.8. HYPOTHESIS 8
This hypothesis tested whether respondents who have been employed for
longer than 10 years (i.e. long tenure) would be perceived as less willing to
attend training than younger recruits.
For the employee groups (TNA2 and TNA3) 74% of the respondents had
been employed by their organisations for <10 years. This means that the
majority of employees were now asked to comment on the remaining 26% of
the sample or their perception in general. For the management group
(TNA1), 25% were employed for less than 2 years and 47% less than 5 years.
This implies that managers change jobs or move between supply chain
entities more frequently than normal employees. This was to be expected
©© UUnniivveerrssiittyy ooff PPrreettoorriiaa
260
since their educational qualifications would permit them more liberties/mobility
in employment opportunities. This phenomenon is contrasted by the fact that
the years employed for managers were longer i.e. between 1-37 years. The
number of years for the employees ranged between 1-32 years long.
The results show that the null hypothesis cannot be rejected, which means
that the tenure of a person’s career at any particular place of employment
should not affect the respondents’ willingness to attend training. This is a
confirmation that HR directors/managers cannot presume that the older
employees would be unwilling to attend training.
There is however a limitation to the study since it did not question how many
people (with employment longer than 10 years) had already left the
participating companies. Since this survey took place after the 2008 global
recession, it will not be known whether the participating companies had fired
or retrenched employees who had worked for them >10 years. Perhaps they
would have altered the current perception or not. The findings from H8 can be
referred back to the need for employees to receive more soft skills training in
the future. Perhaps a gap can be eradicated by matching existing job
experience with future qualifications worthy of promotion and advancement.
6.4.9. HYPOTHESIS 9
This hypothesis wanted to investigate the fear that employees may have
about signing new contracts for retention when they want to attend training
programs. During TNA2 the employees were equally divided in disagreement
and agreement with the statement provided. In TNA3 they appeared to agree
less and remained more neutral than in TNA2. This suggests that there is no
absolute clarity about contracts nor are industry specific practices being
followed by the participating business entities.
In contrast, the management group overwhelmingly disagreed (at 78%) that
the contract threat could have prevented employees from attending training.
Perhaps they honestly believe or perhaps are better informed about the
©© UUnniivveerrssiittyy ooff PPrreettoorriiaa

261
possibility of extra contracts being used before training commences. The fact
that the employee groups were not as convincing in their perception as the
TNA1 management group, implies that a gap could exists even from an
information/communication perspective between managers and employees.
On the other hand, the managers could also have been hiding their
uncertainty through the non-response of 30 on this particular concern. This
chapter will conclude all the hypotheses’ findings before making any
recommendations in the subsequent chapter.
6.5. CONCLUSION
This chapter reported and analysed the findings of three questionnaires that
were administered to a group of managers (TNA1) and two employee groups
(TNA2 and TNA3). The overall purpose of the study was to determine if gaps
exist in the training needs perceived by managers and employees and
amongst employees themselves. The goal was accomplished by testing nine
hypotheses against empirical evidence gathered from respondents in the
supply chain industry. The findings confirmed that managers and employees
do not always share the same perceptions regarding hypotheses about:
1. the types of training
2. the format of training
3. motivating variables
4. demotivating variables
5. existing educational qualifications
6. gender
7. the demographic variable age (> 45 years)
8. career tenure (more than 10 years)
9. and signing new contracts before training.
The findings are briefly summarised according to the Hypothesis number it
applied to. The recommendations will be made in chapter 7, where the
empirical findings are referred back to the context of broader macro-
economics and the literature of existing global scale supply chain
management systems. Since the significance of the main findings will be
©© UUnniivveerrssiittyy ooff PPrreettoorriiaa

262
discussed in the next chapter, this conclusion merely aggregates the training
gaps identified by the research data.
Hypothesis one was reassuring in that it assured us of training activities that
took place in the 12 months preceding this July-October 2011 research study.
Most supply chain functional areas’ training is on offer in this country and
respondents made use of the opportunities presented to attend training. The
gap exists mostly between the training received by managers’ versus the
employees’ training. The former are sent more frequently for both technical
and soft skills training. The employees were mainly sent for the technical
training but no soft skills training was involved. In order to address the gap,
some soft skills courses must be offered to the employees who wish to pursue
managerial positions or whom are being groomed for supervisory careers.
Hypothesis two had 8 formats of training (variables) being evaluated between
the TNA1, TNA2 and TNA3 groups. The gaps that were found pertained to
on-the-job training, in-house training and self-training. These gaps were
discovered by the changes from not rejecting the null hypothesis between
TNA1-TNA2, only to be rejecting the null hypothesis for the same variable
between TNA1-TNA3 or vice versa. The remainder variables all had
statistically significant differences between both TNA1-TNA2 and TNA1-
TNA3. The variables that were compared between the management and
employee groups include: the use of seminars/conferences, short courses,
product training with suppliers, distance education and online/web training.
These findings caused the null hypotheses to be rejected between TNA1-
TNA2 and TNA1-TNA3. In contrast, there were no statistically significant
results between the employees before and after the supply chain awareness
intervention (i.e. between TNA2-TNA3). The way to address the training
format gaps is examined further in chapter seven.
Hypothesis three suggested five motivating reasons as variables to be tested.
Since motivation by itself is difficult to prove, the motivating variables were
correlated to the existing qualifications of respondents. This shed more light
on the categories of qualifications and how each category of respondents will
©© UUnniivveerrssiittyy ooff PPrreettoorriiaa

263
be motivated to attend training. The two variables that called for the null
hypotheses to be rejected are when the courses are for free and whether the
courses were new, in order to help respondents to stay informed about their
industries. These two variables used a Kruskall-Wallis one-way analysis of
variance to demonstrate that there is a significant difference between TNA1-
TNA2 on these issues. Thus the intention to learn something new and be on
top of industry developments is not such a straightforward motivation to
influence employees from a training initiative. The unanswered question for
this variable is that the concept of “newness” will be subject to individual
training experience variations.
Hypothesis four put forward four reasons that could possibly demotivate
employees from attending training. The variables included being too busy at
work, waiting for senior members to attend training first, having/ not having
tests associated with the training and the relevance of the training to current
employee responsibilities.
From the H4 findings management and staff had different opinions on “being
busy” as a deterrent to attend training. Managers thought that being busy
was a legitimate reason not to attend training, but employees thought
otherwise. Clearly this gap will have a different context in the job environment
for every employee and every manager, which chapter seven should advise
on.
Both managers and employees in H4 disagreed with the notion that anyone
wanting to attend training should wait for hierarchical level senior staff to
attend the training first. Since no statistically significant result came about
between TNA1-TNA2, TNA1-TNA3 nor between TNA2-TNA3, the null
hypotheses could not be rejected. On the issue of seniority preferential
training, unanimous support from respondents show that it would not be best
practice to let employees wait for seniors before attending training.
Managers were optimistic that employees would still attend even if there was
no test or exam attached to a training program. Employees on the other
©© UUnniivveerrssiittyy ooff PPrreettoorriiaa

264
hand, disagreed that they would stay away from training if there were a test or
exam attached to the training program. This H4 variable question was not
worded in a consistent way between the questionnaires thus no real
hypothesis testing could be performed on the data.
The last variable tested under H4 was the relevance of training and the null
hypothesis could be rejected only between TNA1-TNA2. Employees changed
their minds to increasing disagreement before and after the intervention. This
meant that the null hypothesis could not be rejected for TNA1-TNA3. The
high p-value of the paired sample t-test also concluded with the TNA2-TNA3
no rejection of the null hypothesis. This inconsistent result may indicate that
the respondents are not sure about the training being relevant to their current
responsibilities. It could also demonstrate that they do not think irrelevance
should discourage them from attending training.
The H5 question was posed only to employees. In both TNA2 and TNA3
employees disagreed that staff with existing educational qualifications are not
as urgent to attend training. The decision was not to reject the null hypothesis
based on the non-significant p-value from the paired sample t-test. This
means that existing qualifications should not deter staff from being urgent to
attend training amongst respondents.
The possibility of gender discrimination was resolved with the H6 question.
The question was again addressed only to the employee groups of
respondents. Since there were no statistically significant differences, we
cannot reject the null hypothesis. Neither male nor female employees
perceive that females receive more training in the workplace at this point in
time.
Hypothesis seven proved that there is no noteworthy relationship between
age and the need for training. Being older than 45, was not perceived as a
reason to ask for less training. Since the Pearson correlation coefficient did
not yield a statistically significant result the null hypothesis could not be
rejected. This means that there is no significant difference between
©© UUnniivveerrssiittyy ooff PPrreettoorriiaa

265
respondents and their perceptions about late-career-stage (older than 45)
potential trainees and their requests for training.
The duration of employment in the same organisation could not directly be
age related as in H7. Therefore hypothesis eight was questioning about
employees having been in their organisations for longer than 10 years and
their willingness to attend training. Since there was no statistically significant
p-value the null hypothesis could not be rejected. The problem with this
conclusion was that the average number of years of employees hovered
around eight years of employment. chapter seven would definitely have to
restructure the career tenure link to training programs for the supply chain
context.
From hypothesis nine, it appears that employees do not seem to be deterred
by the need to sign another contract linked to training opportunities. In
contrast a large percentage of the managers did not respond to this question.
Even though the results of this hypothesis were inconclusive, it must be
viewed in light of the fact that organisations will differ in their approach to
exchange training for continued loyalty. Overall it appears as if contractual
obligations would not necessarily deter employees for requesting training
opportunities.
The conclusions of the research findings from hypotheses 1 to 9, brings the
final chapter in sight. Chapter seven will revisit the research that prompted
the development of each individual research variable examined above. The
areas of contribution that the research results brought forward; will also be
followed by recommendations for future research studies.
©© UUnniivveerrssiittyy ooff PPrreettoorriiaa

266
CHAPTER SEVEN CONCLUSION AND RECOMMENDATIONS
7.1. INTRODUCTION
7.2. THEORY VERSUS FINDINGS
7.3. RESEARCH CONTRIBUTION
7.4. LIMITATIONS OF THE STUDY
7.5. RECOMMENDATIONS FOR FUTURE RESEARCH
7.6. CONCLUSION
©© UUnniivveerrssiittyy ooff PPrreettoorriiaa

267
7.1. INTRODUCTION
This chapter summarises how the research findings are similar to or different
from the theory. It aims to conclude the gap analysis of training needs in
supply chain organisations by discussing implications for management. The
research contribution will be made in the context of the sample characteristics
and environment. Limitations of the study will be revisited. However, the
recommendations that are made in this chapter cannot be generalised to all
other organisations without taking into account that each business is following
its own strategy and thus its own training initiatives.
Training courses are often suggested, delivered and advocated when no
training needs analyses pre-empted the program implementation. However it
is noted that training cannot fix all deficiencies identified during performance
evaluations within organisations. The shortage of skills in different supply
chain areas such as procurement, manufacturing, transport and logistics,
marketing, finance and others require a dedicated effort to identify individual
training needs. Gaps can exist between the types of training managers
believe they or their employees should be sent on. There can also be gaps in
what employees think they need. There can even be gaps in existence after
exposing the employees to the same information about the supply chain
discipline. The previous chapter demonstrated that employees can change
their perceptions and choices within 48 hours.
Trying to find the gaps in the training needs analyses of both managers and
employees in the supply chain industry meant targeting both respondent
groups with pertinent questions. The research model and hypotheses are
illustrated below (Figure 7.1.) to show where the gaps exist between the one
management group and the two employee groups. The gaps that were
proven to exist are indicated with the numbered hypotheses that tested the
findings. The arrows are colour coded to demonstrate which two groups were
being compared at the time.
©© UUnniivveerrssiittyy ooff PPrreettoorriiaa

268
Figure 7.1. The research model with the gaps identified from the
completed research study
EMPLOYEE GROUP ONE
TNA2 (BEFORE)
EMPLOYEE GROUP TWO, TNA3 (AFTER)
H1= gaps found in training received H2= gaps found in training format preferred H3= gaps found in motivational factors H4 = gaps found in demotivating factors
H5= gaps found in view on existing qualifications and urgency about training
H1= gaps found in training received H2= gaps found in training format preferred H3= gaps found in motivational factors H4 = gaps found in demotivating factors
MANAGEMENT
GROUP
TNA1
H6= no gaps found in gender and training received H7 = no conclusive gaps found for training over 45 year-olds H8 = inconclusive evidence on employees job tenure >10 years and willingness to attend training H9 = split response on need for additional training related contracts
©© UUnniivveerrssiittyy ooff PPrreettoorriiaa

269
Source: Author’s own compilation
Figure 7.1. lists the most important findings from the research study. Between
the management group and the employees, the first four hypotheses were
tested and revealed gaps between all three groups. The previous training
received, the training format preference and the motivational/ demotivating
factors were tested in the first four hypotheses and showed discrepancies
between managers and both employee groups. These comparisons are
indicated using the red and the green arrows shown in Figure 7.1.
Between the two employee groups (TNA2 and TNA3), indicated by the blue
arrows, the fifth hypothesis was used to show gaps in how employees view
staff with existing qualifications and their urgency for training. Since this
hypothesis did not have a corresponding question being asked of the
management group the resultant gap only applies to employees before and
after the supply chain intervention.
In the center of Figure 7.1, the inconclusive results of hypotheses six to nine
were found between all the groups (TNA1, TNA2 and TNA3). These
hypotheses focused on gender, employees over the age of 45, those with job
tenure longer than 10 years and contract requirements associated with
training respectively.
Each of the hypotheses will now be revisited with reference to the theory that
preceded their derivation and focus areas.
7.2. THEORY VERSUS FINDINGS
This section links previous research recorded in the literature to the current
findings in the sequence of the hypotheses that were tested.
7.2.1. THEORY VERSUS FINDINGS FOR HYPOTHESIS ONE:
In 2008, Aquino and Draper (2008: 2) tried to develop a common supply chain
talent attribute model between academia and business organisations. They
©© UUnniivveerrssiittyy ooff PPrreettoorriiaa

270
reasoned that if university and professional training programs could not
transpose industry needs into their curricula, leaders in supply chain may
need to self-train or pay for subject specific expertise themselves. However, if
employers decided to “make” their own skilled employees they still had to
determine the best types of training required. The Myers et al., (2004: 225)
authors recommended that multiple disciplines such as human resources,
operations management and even marketing collectively determine how to
identify employee skills. Their multidisciplinary approach was used to test
which courses the respondents were exposed to in the 12 months preceding
the research project for hypothesis one (H1).
According to Dischinger, Little and Kellso (2008: 21), the gap was not to be
found through needs analysis but rather by articulating the supply chain
requirements more clearly. This articulation process meant finding common
descriptors for the supply chain and the skills required. Thereafter contended
Dischinger et al., the human resources could be trained according to the skills
level requirements. Hypothesis one was therefore using standard terminology
for the courses that were listed and tested.
In the process of listing 12 different training types and subsequently
subdividing them into technical and soft skills, a serious discrepancy was
uncovered under hypothesis one. To retrace; the questionnaire question
allowed for a technical division of courses which consisted of computer
software, contract management, financial management; new product training;
occupational health and safety, transport, distribution and warehousing. This
division was in line with the Council for Supply Chain Management
Professionals career patterns of women in logistics study, which stated that
information technology, systems and software gaps were already in existence
in 2009. Women respondents argued that they personally needed accounting
and finance. In the 2009 study supply chain business functions such as
marketing and transport, were lacking.
While the 2009 women in logistics called for a need for a formal education,
including management and supply chain specific education, the current study
©© UUnniivveerrssiittyy ooff PPrreettoorriiaa

271
appears to have covered most of the technical skills offering in the 12 months
preceding the research project. The current research found that functional
area training (which the research analysis grouped as “technical skills”) had
been taking place and that both managers and employees were recipients of
the technical training. The current research study focused on the difference
between training received by managers versus employees in testing
hypothesis one, therefore no real findings were recorded for women
specifically on this question. There was also no gender specific enquiry under
H1, but rather under H6.
While Mangan and Christopher (2005: 181) said finance, information
technology, management and strategy were important, they argued that the
critical skills would be supply chain specific. This is in contrast with the
current research, which found that non-supply chain focused skills training
was lacking- especially amongst employees. As a reminder, the division of
the five soft skills consisted of negotiation skills, people skills, stress
management, supervisory skills and time management. By comparing the
groups of respondents it was found that mainly managers had received soft
skills training in the 12 months preceding the project. Employees were found
lacking in soft skills training for the 12-months time period prior to the
research study. The two plausible explanations for this H1 phenomenon could
be that firstly it is generally assumed that only managers need to possess soft
skills as part of their job of leading and managing people. Secondly, it could
be argued that the function of the employees in the study was non-
supervisory and they therefore did not need to have a soft skills training
program in their line duties. In both instances, follow-up research would be
required to elaborate on the explanation of the H1 discrepancy or training gap.
The implication of the result of the H1 gap is that any future form of skills
empowerment for employees would require a shift in the type of training being
offered. The consequences of addressing this glaring training gap (between
TNA1, TNA2 and TNA3) in terms of “soft, technical and the combination of
both” skills training may be twofold. Business organisations will enable more
currently non-managerial employees to firstly, move up in the ranks in their
©© UUnniivveerrssiittyy ooff PPrreettoorriiaa

272
supply chain careers or secondly, play a new supervisory role in their existing
positions. This call to action for managers, are in line with the Cappelli
Principle 2 which said that employees should be trained with generic
interchangeable skills, and only specialise as and when gaps arise in the
workplace (Cappelli, 2008: 79-80). In response to Cappelli’s argument, it may
be safe to conclude that a training gap has now definitely been identified in
the workplace, with the findings from hypothesis one.
7.2.2. THEORY VERSUS FINDINGS FOR HYPOTHESIS TWO
Hypothesis two questioned the format of training and the respondents’
preferences on how training should be delivered. The Marlborough study
from 2003 looked at in-house/onsite training, computer based online training,
universities and self-study (2003:21). The TNA1, TNA2 and TNA3
questionnaires included the following formats for respondents to consider
namely: on-the-job training, in-house training, seminar/conference training;
short courses, product training with suppliers, distance education by yourself,
self-training by reading books/journals/magazines; and training via the
online/web/Internet environment.
� IN-HOUSE TRAINING
The second type of training format under consideration was in-house training.
This stemmed from the reasoning that functional areas presented room for
training without costing too much, which meant that in-house training was
considered beneficial (Cappelli, 2008:78). The view by Hannun (2009:27)
was that off-site training may not be best.
The null hypothesis stated that there was no significant difference in the
perceptions about managers and employees with respect to “in-house”
training. The results initially showed that managers value in-house training in
the same way as employees do, since there was a statistical reason to reject
the null hypothesis.
©© UUnniivveerrssiittyy ooff PPrreettoorriiaa
273
However, after the intervention, employees started to think “differently” from
their managers about “in-house” training, according to the decision not to
reject H2 null hypothesis. Perhaps training awareness interventions can
change the perceptions of employees regarding the “in-house” format of
training.
In retrospect of both the literature and the empirical research findings, I am
convinced that there is a misunderstanding between managers and
employees as to the format of “in-house” training. My speculation, that will
require further investigation, is that in-house training can be perceived as a
cost saving form of training and may therefore not be perceived as valuable
by the recipients. In reality, the 2013 opportunities for structuring dynamic
training programs to meet both the objectives of cost-efficiency and being
inspirational effectiveness are vast.
� SEMINAR/ CONFERENCE TRAINING
The employee views on seminar/ conference training concur with the older
views of Garavan (1997:42) which state that skills development is not
confined to the classroom or the coaching situation. Although the comparison
between managers and employees in both surveys indicated there is no
statistically significant difference between them, the supply chain world has a
different reality. The option to use seminars or conferences that last two,
three or five days as training, includes hidden costs such as daily allowances,
transport and accommodation. The consequence of totalling the hidden
costs, means that the training budgets will be exhausted more rapidly in one
financial year by trying to send many staff members to attend seminars and
conferences.
The views of managers are that employees should sometimes be afforded the
opportunity whereas employees are always eager to attend. The broader
context of organisational structure, hierarchy, culture and training strategy
may mean that, while management levels attend conferences and seminars
employees are destined to attend less prestigious forums for training. My
©© UUnniivveerrssiittyy ooff PPrreettoorriiaa

274
educated guess is that seminars and conferences are currently also being
used as a reward to managers for fulfilling their other responsibilities.
� SHORT COURSE TRAINING
There appears to be a gap or mismatch between the views of managers and
employees regarding short courses. It is necessary to clarify the views of
both managers and employees on short courses. Perhaps employees know
that, as options for themselves, short courses are no real replacement for
more long-term training courses. Degrees and year-long certificates are
perceived by employers themselves as more valuable than a collection of
short courses and employees are well aware of this.
Human resources managers and supervisory managers in industry may not
be agreement about the return on investment from the use of the short course
as a format of employee training. Either way, this issue merits more debate
more between managers and employees in future and each participating
organisation should be implementing best practices for its training
environment.
In the South African context, the matter of short courses is currently (in the
year 2013), being reconsidered by government officials, educators and
business organisations. Government officials are hoping the short courses
can form part of a widely recognisable qualification for recipients. In my
opinion, the issue is far more deep-rooted since, at this point in time the two
applicable legislations (the education law and the labour laws) are not
integrated in their approach to training, skills development and growth of the
employment base. Until the two standards generating bodies can be
reconciled, both managers and employees will not be completely confident
about the value obtained by using short courses as training formats in the
current global supply chain management environment.
� PRODUCT TRAINING WITH SUPPLIERS
The views of Othman and Ghani (2008: 261) relate to the linkages that exist
generally between trade partners in their respective supply chain networks.
©© UUnniivveerrssiittyy ooff PPrreettoorriiaa

275
When businesses audited their suppliers’ human resources and processes
they concluded that moderate linkage exists. When technical assistance was
offered to the suppliers after they had been audited, high linkages were found
to exist. The authors found that extensive training in job related and other
multiple skills occurs only with high linkage.
The matter of using suppliers as a source of and format for, training,
confirmed empirically that respondents and their suppliers were engaged in
training. This was reassuring since no direct questions were asked about how
a business and its partners were interlinked. The fact that training was being
done was a reassuring sign that high levels of linkage do exist, according to
the Othman and Ghani (2008: 261) definition of high linkages.
With the current trend in the supply chain management environment the
business strategy aims for collaboration amongst business trade partners,
including both suppliers and customers. Under the collaboration initiatives,
agreements of confidentiality and co-operative training on the products being
sold, could improve linkages between business partners. The risk of collusion
and poaching of employees by suppliers could possibly steer managers away
from the involvement of employees with suppliers for product specific training
sessions. The nature of the industry and normal business practices can thus
influence the use of product training with suppliers substantially. Employees
would consequently be restricted in their use of this format of training even if
they are willing to interact more with their suppliers, as shown by the empirical
results.
� DISTANCE EDUCATION TRAINING
The concept of distance education does not always involve Internet based
activities and must be kept separate from the online format of training.
Distance education involves the submission of reports and assignments via
the traditional posting mechanisms and therefore managers may be unaware
of all their employees’ distance education activities.
©© UUnniivveerrssiittyy ooff PPrreettoorriiaa

276
The empirical results indicate that this could be a form of training that both
managers and employees favour, which would be a highlight for future
recommendation to relevant stakeholders. It appears that the respondent
group of employees became more decisive about distance education by the
time they had completed their second questionnaire. The research results do
not make it clear whether employees are becoming more favourably disposed
toward distance education activities.
� SELF TRAINING
In the manager-employee comparison the results showed an interesting shift
by employees from “sometimes” towards “always” as a preference. Although
self-training could be a form of training that both managers and employees
support; many influences could have swayed employees within their 48-hour
reflective period.
The problem with this format of training is that there is no assessment
opportunity that would allow employers to monitor how much the training has
helped/hindered their employees. Unless employees show marked
improvement in either their knowledge, prowess or leadership in the particular
area of business where they trained themselves in, it is possible that this form
of training may pass unnoticed by managers. Again, no critique may be
issued against the principle of self-efficacy that allows employees to use this
format of training.
� ONLINE/ WEB TRAINING
This format of training will be used by respondents who do not suffer from
technology phobia. In the current millennium, there are theories about the
different generations’ use and perceptions of training content found online.
The fact that the web users/online training supporters stayed their course and
did not show any shift in preferences, issues a management challenge to
engage employees on the format of online/web training. In this way,
technological advances may serve the dual purpose of streamlining business
processes while being a useful training tool for staff members.
©© UUnniivveerrssiittyy ooff PPrreettoorriiaa

277
This concludes the commentary on the eight variables that delineated the
format of training preferred by both managers and employees. The following
hypothesis (H3) will comment on the factors motivating employees to attend
training.
7.2.3. THEORY VERSUS FINDINGS FOR HYPOTHESIS THREE
This hypothesis included five variables that were tested in the light of their
ability to motivate employees to attend training. The variables included:
� the prospect of being promoted
� the opportunity to learn something new
� the possibility of the course being free
� attending training in order to get time off work
� attending training at the boss’s insistence
Cappelli (2008:81) contended that conflict exists when employees want
promotion. This arises from the fact that employers want affordable
employees and national interests want higher-level skills in general.
According to the empirical results the prospect of promotion proved to be a
motivator for employees to attend training.
Cappelli (2008:78) also said firms should let employees share in the
advancement decisions or else watch them leave for greener pastures. This
is a relevant statement since the demographic information on managers
showed the existence of migratory patterns. Some respondents had been in
their positions for less than five years. The impact on training could be
negative if employers fear that the trained employees will leave for greener
pastures as Cappelli argued.
Managers and employees definitely differ on the second and third motivating
variables. The two statistically significant findings related to employees
learning something new and training being free of charge. Perhaps managers
are unaware of how employees perceive the newness of supply chain
©© UUnniivveerrssiittyy ooff PPrreettoorriiaa

278
training. They could also be unsure about how employees would experience
something that is free. This variable of free training was double checked
again through hypothesis nine.
The two remaining variables left room for speculation and a need for a follow-
up research effort. Employees did not want to be remembered as attending
training only to get time off work. Nor did they agree with attending training at
the boss’s insistence. Perhaps bosses secretly hoped that employees did not
loathe their workplaces so much that training would become a welcome relief.
Similarly, they did not agree with the notion that employees would attend
training only if they insisted they should. Further investigation, perhaps during
performance reviews would allow more reasons to surface about the
motivators for training. This information could however be considered as
generally too sensitive to be divulged.
7.2.4. THEORY VERSUS FINDINGS FOR HYPOTHESIS FOUR
This hypothesis included four variables that could possibly demotivate
respondents from attending training. These included:
� being too busy at work
� waiting for seniors to attend first
� tests/exams
� irrelevance to current job
According to McCranken and Winterton (2006:64) time pressures would be an
extrinsic barrier to learning. The empirical results revealed that managers and
employees differ on whether being busy should motivate /demotivate them
from attending training. Employees think they will never be too busy to attend
training while, in contrast, managers think that being busy would be a reason
for not attending training. The empirical results demonstrate how easy it is for
managers and employees to be on different wavelengths on the subject of
“busyness”, relative to attending training.
©© UUnniivveerrssiittyy ooff PPrreettoorriiaa

279
Senior staff causing less senior staff to wait before attending training was
seen as unacceptable to both management and employee groups.
The remaining two variables between the managers and employee groups,
did not yield conclusive results, which, again, means there should be an
investigative process to follow up on demotivating variables. Without the
follow-up, we may not fully understand reasons that would deter employees
from attending training in future.
7.2.5. THEORY VERSUS FINDINGS FOR HYPOTHESIS FIVE
Hypothesis five investigated an objective but important variable of existing
educational qualifications and how these influence employees’ sense of
urgency regarding training. This was based partly on Letseka (2009: 89) who
said potential employees graduate with irrelevant skills. This was stated from
a developing economy’s perspective. The statement from a developed
economy’s perspective was even more sobering. A Swedish study by Gartel,
Jans and Persson (2010: 207) claimed that lower-level jobs were more likely
to be destroyed during recessions. By implication, the arguments were that
the right educational qualifications could secure employment and be a hedge
against job loss during recessions.
The empirical results confirmed the serious nature of the claims made by
Letseka and Gartel et al., by reporting that most employee respondents had
less than a formal degree while a third of managers were at the bachelors’
level of qualifications. The empirical results did not represent the extreme
statistics that were put forward by Erasmus, et al., (2007: 125) that under-
qualified Apartheid legacy staff meant 81% of 12.8 million people have less
than a secondary level qualification. This equalled 10 368 000 people of the
South African population in 2007. Technically speaking the respondent
sample groups were better qualified than the national statistics’ findings from
Erasmus, et al., (2007: 125).
©© UUnniivveerrssiittyy ooff PPrreettoorriiaa

280
Since the research study did not question respondents on their intention to
study a Master of Business Administration (MBA) qualification in the short to
medium terms, it could not be judged by the same margin as the literature
from the State of Logistics Survey. The MBA appeared as the most frequently
listed graduate qualification in the 2012 study, which is a positive response
the need for this which was identified from the State of Logistics 2009 study.
Perhaps the data about the local marketplaces can be updated again now that
the census data on educational levels of employees have become available.
The studies completed by Peters (2004:9) and McQuaid, Lindsay & Johnson,
(2010:4) both say that respondents who already have existing qualifications
makes are more likely to attend training. This is supported by what
McCranken and Winterton (2010:4) called the Matthias Principle which states
that “those who have shall be given more” in terms of education and training.
Walters claimed that South Africans’ initial levels of education will determine
their education throughout adulthood (1999:220). Fortunately the findings
discussed in chapter six, suggest that those respondents with qualifications
are keen to attend further training. However there still appeared to be
ambivalence since more than 40% of the respondents disagreed with the
statement that “staff with existing qualifications, are not urgent about further
training”, while about 30% actually agreed with the statement. This may
suggest that there are two major opinions on the topic. The empirical results
are limited by the fact that the analysis did not link the respondents’ views with
the harsh reality of their levels of qualifications.
7.2.6. THEORY VERSUS FINDINGS FOR HYPOTHESIS SIX
This hypothesis looked at any gender based difference as to whether female
staff members receive more training than males. From the literature it was
found that some sectors of the economy train parts of their workforce but not
necessarily everyone who has an existing training need (McGrath& Patterson,
2008: 305). In practice training is done for legal and administrative
requirements, but not necessarily to meet the training needs (Bushney &
©© UUnniivveerrssiittyy ooff PPrreettoorriiaa

281
Meyer, 2008:16). When asked about gender previously, McCranken and
Winterton (2006:63) recorded that females blamed existing corporate culture
for the barrier to their own training. In order to link the gender variable with
education (H6 with H5) Kara and Murrmann (2011:4) found that female (and
less educated) staff were less satisfied at work than males.
Since there was no managerial level question as to whether females receive
more training in the supply chain environment than males, the results reflect
only the employee views. Between employees there was no statistically
significant difference in gender perceptions about whether females receive
more training in the workplace. Therefore these findings eliminate some
concern about gender being a way to have preferential access to training for
the female staff members. The levels of satisfaction from the female staff
members were not tested. This is in contrast to the literature reviewed to
prevent possible dissent from developing in the participating organisations,
after the research study concluded.
7.2.7. THEORY VERSUS FINDINGS FOR HYPOTHESIS SEVEN
The hypothesis was based on the question asked by Marlborough (2003:20),
namely what training package should be given to people over 45, as opposed
to new recruits. The obvious assumption was that new recruits were much
younger than 45 years of age.
The questionnaire addressed to managers referred only to older and younger
employees, without specifying any age group. The majority of managers
(80%) disagreed that only younger employees would attend training.
The questionnaire used by employees specifically asked about employees
being older than 45 years of age. The results indicated a slightly negative
relationship between the chronological age of employees and the older
employees’ willingness to attend training. The results also yielded a
statistically non-significant relationship and therefore the null hypothesis for
©© UUnniivveerrssiittyy ooff PPrreettoorriiaa
282
employees cannot be rejected. This suggests from the sample that being
over 45 years of age, does indeed impact on employee willingness to attend
training.
The results from testing this hypothesis confirm the need to distinguish
between young recruits and older employees in terms of training.
7.2.8. THEORY VERSUS FINDINGS FOR HYPOTHESIS EIGHT
This hypothesis tested whether respondents who have been with their
respective organisations for longer than a ten-year-long tenure, would not be
willing to attend training. This was based on amongst others, literature from
McCranken and Winterton (2006: 63) where mid-career managers, who
stayed at their companies for their entire careers, were less likely to seek
opportunities for formal training.
The argument put forward by Opperman and Meyer (2008: 3) was that, for
decades, management has been slow to send staff for training. According to
Opperman and Meyer, the reason for managers’ reluctance was the lack of
transfer of what was learnt to the workplace. In current times, perhaps it
raised the need for employees to start deciding for themselves.
Schmidt (2009: 310) argued that human resource professionals should
develop training programs to accommodate job type and tenure rather than
demographics. He agreed with Marlborough (2003:20) that older employees
have different training requirements from new recruits. The demographics of
the respondent supply chain staff covered the age range well enough
although the average manager was older than the 20-to-35 year old
respondents in Schmidt’s study.
The findings recorded in the previous chapter showed that 74% of employees
were employed for longer than 10 years, while a total of 48% of managers
were employed for less than 5 years! The results concluded that there is
actually a significant difference in the willingness to attend training between
©© UUnniivveerrssiittyy ooff PPrreettoorriiaa

283
those employed for more than 10 years and new recruits. These results
caused the null hypothesis to be rejected; which concurs with previous
literature findings.
7.2.9. THEORY VERSUS FINDINGS FOR HYPOTHESIS NINE
This hypothesis was prompted by amongst others, the Cappelli Principle 3
which stated that employees should be asked to sign contracts when they are
given expensive training. This is based on the fact that American employers
expect at least a 20% repayment of the investment -equivalent to the value of
the training received- if the employees decide to leave before the appointed
time (Cappelli, 2008: 80).
In contrast, Roodhouse and Mumford (2010:325) supported the notion that
government policy should provide school level education and hand over
responsibility for skills development to the United Kingdom employers.
Roodhouse and Mumford also propose including further education and higher
education in promoting the education of employed people. This situation is
similar to the current research context.
An opposing view by Marlborough (2003: 20) was that training should be free.
Venter (2003: 186) argued that in China financially strong companies will
select only more highly qualified staff for further training. Venter reports that
the rest of the “non-selected” will depend on the government to educate them
after gaining employment.
Ashton, Green, Sung & James (2002:5) previously challenged the role of the
government as being the sole provider of skills development. Ashton et al.,
based their argument on the success of seven countries that accelerated
skills development into one generation instead of three generations.
This hypothesis had many contradicting literature views. Frazelle (2002: 343)
thought that high performing human resources could be retained only by
further skills development and the organisation’s investment in staff
©© UUnniivveerrssiittyy ooff PPrreettoorriiaa

284
education. The issue that was unclear was whether the high performing
individuals already had existing qualifications and training or not.
One of the challenges identified by the 2009 career patterns of women in
logistics study was that management development was expected to take
place with limited or no training budget available (CSCMP, 2009). McQuaid,
Lindsay and Johnson (2010: 8) said the United Kingdom (UK) had removed
access to funding issues in the UK by providing funding schemes. The local
view stated by Walters (1999: 218) was that although the government’s policy
was re-assessed since 1990s the Apartheid consequence is that adults are
not active learners later in life.
According to the Cappelli Principle 3 on the make-or-buy decision, firms can
ask human resources to pay for some of their own training or work out some
stretch assignments on their own time (Cappelli, 2008: 78). Cappelli (2008:
78) also links training to long-term strategic thinking by saying that the longer
the human resource talent is required in the organisation, the more inclined
organisations will be to invest in training the talent.
The research results proved to be inconclusive. More than 40% of employees
disagreed that they would be less willing to attend training if organisations
insist they sign a (an obligation to pay back) contract. However, it seems that
employees became more neutral about their willingness to attend training in
their second questionnaire than in their first.
In contrast, the question had been re-phrased for managers and no managers
strongly agreed with this statement. This phenomenon makes it appear that
managers were not so sure about whether this statement could have been a
true deterrent to employees attending training. Managers also displayed a
noticeable non-response. The high non-response of 30, is a clear indication
that this question was not well received by managers in their questionnaire.
Since the issue of signing a contract to repay the costs of training appears to
be open for further debate, there cannot be any conclusive argument about
©© UUnniivveerrssiittyy ooff PPrreettoorriiaa

285
either employees’ or managers’ views. In reality, neither labour law nor
educational laws make a uniform provision for whether employees are
supposed to sign a contract in order to receive training. Therefore this
hypothesis is definitely a case for further investigation.
This concludes the discussion on the nine hypotheses and how their research
findings relate to the literature reviewed. The next section deals with the
research contribution of the findings to the academic environment and
industrial practices.
7.3. RESEARCH CONTRIBUTION
This section comments on the research contribution made by this research to
the body of knowledge as well as to the practitioners in industry, labour and
education. This contribution is viewed in the light of the 2008 supply chain
foresight finding that skills shortages are among the top five challenges faced
by South African supply chain organisations.
7.3.1. VALUE OF RESEARCH ACROSS DISCIPLINES
Combining supply chain business management, human resources
management (training) and adult education into one research study helped to
review the merits and demerits of each discipline individually and collectively.
It helped to sketch the background and business context more clearly before
testing any hypotheses and making recommendations based on the findings.
Since all these disciplines have different histories and focus areas, the
commonality between them is made up of the units of analysis, namely
employees as respondents. Skilled employees are in great demand and short
supply globally. The employees who work for organisations involved in supply
chain management displayed gaps in training received, as well as in existing
motivational/demotivating training practices. Managers and employees
differed even in the format of training they preferred, which demonstrates that
strategic thinking should be more focused on people. These findings were
©© UUnniivveerrssiittyy ooff PPrreettoorriiaa

286
reachable through the combination of the different disciplines, which allows
the research to contribute to more than one discipline simultaneously.
7.3.2. VISIBILITY OF TRAINING NEEDS ANALYSES
Both the Council for Scientific and Industrial Research (Logistics News,
2009:11) and the Association of Human Resources Management (Bushney &
Meyer, 2008: 19) called for future training needs to be analysed before
training programs were implemented.
This research study targeted the main supply chain management associations
and prestigious businesses to participate in the investigation. By focusing on
the training needs analyses, future training programs could become more
targeted to the actual needs of managers and employees. In this way, more
value could be obtained for the amount of money being invested in training.
Continuous analysis of the training needs of employees meant that more
specific career development paths could be laid out. This is important in view
of the fact that managers were displaying a high labour turnover in the current
market environment. Employees who may have been exposed to previous
Apartheid-era educational deprivation, can also be identified by conducting
training needs analyses more consistently.
McGrath and Patterson (2008: 302) highlighted the practice of sending
employees for low-level skills training, in order to claim that it had been done.
Training needs analyses are intended to help assess the current stage of
employees and plan the appropriate level of training to match their more
specific training requirements. Conducting training needs analyses, would
hopefully assist with including the relevant parts of the workforce in the
training programs without favouritism or discrimination (McGrath & Patterson,
2008: 305). This research can contribute to allowing equal access to training
for all employees.
©© UUnniivveerrssiittyy ooff PPrreettoorriiaa

287
7.3.3. IMPROVING THE MOTIVATION FOR TRAINING
The government policies and the accompanying legislation that is meant to
help enforce their implementation, previously compromised on the reasons
why training was being done. According to Bushney and Meyer (2008: 16)
training in industry was done for legal and compliance purposes and not
necessarily to alleviate the gaps in training. This study hopefully enables the
employees themselves indicate their wish to be involved in making the
training decisions that will affect them.
Businesses alone cannot identify the training needs. A co-operative effort on
the part of managers and employees is required to help identify actual training
needs. In this way, the personal and organisational training needs can be
aligned for future improvements. Organisations will then be able to comply
with educational and labour laws, and deploy better motives in their
contribution to the solution of training problems.
7.3.4. ADDRESSING THE GAP BETWEEN MANAGERS AND
EMPLOYEES
The research results identified the following areas where managers and
employees may well be misreading and misunderstanding the training
perceptions in their organisations. Judging from the Hypothesis Two findings
alone, the implications for practical training programs are as follows:
� Implication 1: Management may think they are doing enough training
since, in their opinion, employees should “always” be trained “on the
job”. Perhaps, from the employees’ perspective, this is not the
preferred training option.
� Implication 2: Management should investigate the staff perception of
“in-house” training to eliminate any barriers to training efforts.
©© UUnniivveerrssiittyy ooff PPrreettoorriiaa

288
� Implication 3: Seminars and conferences as a method of training
should also be redefined to ensure that they provide maximum training
benefits.
� Implication 4: There is clearly a mismatch here, and a call to action for
management to clarify the contrast between their views on short
courses and those of the employees.
� Implication 5: Managers prefer not to send employees to suppliers for
product training. Specific instances should be investigated especially
when employees actually need to gain insight into suppliers’ products.
� Implication 6: Distance education appears to be a form of training that
both managers and employees support.
� Implication 7: Self-training could also be a form of training favoured by
both managers and employees.
The research findings contributed the finer details of training formats to fill in
the gaps between managers and employees in the supply chain environment.
7.3.5. ADDRESSING THE GAP BETWEEN TRAINERS AND TRAINEES
This research study used the before-and-after questionnaires which entailed
giving employees 48 hours to reflect on the research intervention that was
given. This was based partly on the Opperman and Meyer (2008:3) argument
that a gap could exist between the training the business expects and the
training that is delivered.
When organisations are able to administer an adequate training needs
analysis over a period that takes place before and after the actual training,
they have more control over the gap that may exist. Trainers will not be
misguided by managers’ assumptions of what they think their employees
need. In this way, there will be less disparity between the expected training
©© UUnniivveerrssiittyy ooff PPrreettoorriiaa

289
and the training that is delivered. The use of training needs analyses will
therefore assist both trainers and trainees to prioritise the goals, content and
format of the training to be delivered. This research contributed to enhancing
the quality of training design based on measured training needs.
7.3.6. MORE TRAINING MEANS MORE LEVIES RECLAIMED
According to the Skills Development Act, since 2002, at least 120 225 firms
have paid their skills development levies over to the Receiver of Revenue as
taxes. The funds collected could be redistributed to the business
organisations through their applicable Sector Education and Training
Authorities (SETAs), after the relevant organisations’ employees have
undergone training.
As early as 2004, the Human Science Research Council lamented that a
disproportionate level of claims were being made, compared to the levies that
were collected. It is hoped that conducting training needs analyses, will
increase the numbers who attend training courses and hence the money that
can be reclaimed from the SETAs. It also means that this research can
contribute to preventing funds from lying dormant instead of being applied in
the training of employees.
7.4. LIMITATIONS OF THE STUDY
The following aspects limit the value that the research can bring:
� The study is cross-sectional and patterns of training needs analyses
and implementation will require a longitudinal study.
� The respondent companies are all located in one economically
advanced province. Perhaps the findings would be different in other,
less economically advanced provinces.
� Some of the information could be considered too sensitive to be
divulged in a research study. Training needs could be identified in
performance management reviews but not be reported in a research
study.
©© UUnniivveerrssiittyy ooff PPrreettoorriiaa

290
� Since government policies and laws are not going to be altered
organisations, managers and employees were conducting their training
in a structured and constrained environment. Perhaps other laws
would set the scene for different behaviours and business practices in
a different context.
In the light of the above constraints, a few recommendations are made for the
future.
7.5. RECOMMENDATIONS FOR FURTHER RESEARCH
Addressing national and international training requirements will alleviate skills
shortages in the long run but never completely obliterate them. The following
are recommended for future research investigations:
� The rising costs of employment and training may involve the
application of more digital media in order to disseminate training. A
future research project should investigate how organisations use the
Internet, their intranets and social media to meet current training
needs.
� There should be more in-depth comparison of the statistics on
employee qualifications to see if this country lags behind or is on a par
with its counterparts.
� The aging population and their approach to training should be
investigated in greater depth.
� Government structures should monitor their vehicles for
implementation of training more closely. A future research project
should compare the training outputs with the skills development plans
that business organisations submit to their relevant SETAs.
� A future research investigation should determine whether there is a
new role for higher education or not. This should be based on the
Roodhouse and Mumford question (2010: 325) that remained
unanswered in this study as to whether higher education institutions
can accredit other institutions to deliver their educational programs.
©© UUnniivveerrssiittyy ooff PPrreettoorriiaa

291
� The synergy and co-operation between government, educational
institutions and business organisations require a workable framework.
This research question has remained unsolved for decades.
Any of the aforementioned proposals for future research will contribute to
alleviating the gaps in training needs analysed in the supply chain
environment.
7.6. CONCLUSION
The aim of this chapter was to summarise the research findings by connecting
each hypothesis with the theory that pre-empted its formulation and
investigation. The researcher used nine hypotheses to seek the gaps in
training needs analyses by distributing questionnaires to managers via their
professional supply chain associations and by being on-site at participating
businesses.
The research questionnaires were pre-tested on respondents similar to the
sample groups. This was in line with construct validity measure for the mainly
quantitative study to be conducted. The research was collected over a period
of four months between July and October 2011. The sample size was
sufficient to allow statistical tests of inference to be conducted. The research
data was analysed so that the findings could make a meaningful contribution
to the literature and best practices for training needs analyses in industry.
©© UUnniivveerrssiittyy ooff PPrreettoorriiaa

292
REFERENCES
Aquino, D. & Draper, L. 2008. Supply chain talent: the state of the discipline.
AMR Research Inc. [Online]. Available form www.supply-
chain.org/galleries/public-gallery/SupplyChainTalent_StateoftheDiscipline.pdf.
[Downloaded: 2009-06-23].
Ashton, D., Green, F. Sung, J. & James, D. 2002: The evolution of education
and training strategies in Singapore, Taiwan and South Korea: a development
model of skill formation. Journal of Work and Education. 15 (1): 5-30.
[Online] Available at doi: 10.1080/13639080120106695. [Downloaded: 2008-
07-16].
Barbazette, J. 2006. Training needs assessment: methods, tools and
techniques. San Francisco, USA: Pfeiffer.
Benjamin, H. & Hutchins, R. M. 1952. Education, what and how? The
Journal of Higher Education. 23 (1): 27-36. [Online] Available at
http://jstor.org/stable/1977141. [Downloaded: 2008-08-22].
Botha, J-A & Coetzee, M. 2007. The psychology of learning. In Practising
education, training and development in South African organisations. Cape
Town, South Africa: Juta.
Bradley, C & Oliver, M. 2002. The evolution of pedagogic models for work-
based learning within a virtual university. Computers and Education. 38: 37-
52. [Online] Available online at www.elsevier.com/locate/compedu under PII:
S0360-1315(01)00078-1 [Downloaded 2008-07-11].
Brown, J. 2002. Training needs assessment: a must for developing an
effective training program. Public Personnel Management. 31 (4): 569-578.
[Online] Available online at EBSCO Host Business Source Premier.
[Downloaded: 2008-04-11].
©© UUnniivveerrssiittyy ooff PPrreettoorriiaa

293
Bryman, A. & Bell, E. 2011. Business research methods. (3rd ed). Oxford,
United Kingdom: Oxford University Press.
Burgess, K., Singh, P.J. & Koroglu, R. 2006. Supply chain management: a
structured literature review and implications for future research. International
Journal of Operations and Production Management. Vol. 26 (7). Emerald
Group Publishing Limited [Online]. Available at
www.emeraldinsight.com/0144-3577.htm. [Downloaded: 2010-12-07].
Bushney, M & Meyer, M. 2008. The 6th annual American Society of Training
and Development (ASTD) State of the South African Training Industry Report.
Available from www.astd.co.za. [Accessed: 2009-10-27].
Cappelli, P. 2008. Talent management for the twenty-first century. Harvard
Business Review. 86 (3): 74-81. [Online] Available from http://0-
search.proquest.com.innopac.up.ac.za/docview/1178119921?accountid=1471
7. [Downloaded: 2009-06-08].
Carter, C.R. & Ellram, L.M. 2009. The 45th anniversary of the Journal of
supply chain management: progress to date and continued excellence moving
forward. Journal of supply chain management. 45(1): 5-7. [Online] Available
from ABI/INFORM Global. [Downloaded: 2010-11-10].
Carter, C.R., Ellram, L.M. & Kaufmann, L. 2008. From the editors: new
directions for JSCM. Journal of supply chain management. 44(1): 5-9.
[Online] Available from ABI/INFORM Global. [Downloaded: 2010-11-10].
Chen, I. J. & Paulraj, A. 2004. Understanding supply chain management:
critical research and a theoretical framework. International Journal of
Production Research. Vol 42(1): 131-163. [Online] Available from
http://dx.doi.org/10.1080/00207540310001602865. [Downloaded: 2013-02-
16].
©© UUnniivveerrssiittyy ooff PPrreettoorriiaa
294
Christopher, M. 2005: Logistics and supply chain management: creating
value-added networks (3rd). FT Prentice Hall/ Pearson Education: Harlow:
England.
CIPD. Chartered Institute of Personnel Development. 2008. Identifying
learning and training needs. [Online]. Available from
http://www.cipd.co.uk/subjects,1rnanddev/needs/idtlneeds?cssversion=printab
le. [Downloaded: 2008-11-24].
Cooper , D.R. & Schindler, P.S. 2011. Business research methods. (11th ed).
New York, USA: McGraw-Hill/Irwin.
Cooper, D. R & Schindler, P.S. 2003 (8th ed). Business research methods
(International edition). Singapore: Mc-Graw-Hill/Irwin.
Cooper, M.C., Santosa, J., Hurst, D. C., Sanders, N. R., Andic, E. and
Polyviou, M. 2012. Career patterns of women in logistics. [Online].
Available from http://cscmp.org/career/career-patterns.asp. [Downloaded:
2013-02-07].
Cooper, M.C, Santosa, J., Coley, L.S. & Hurst, D.C. 2009. Career patterns of
women in logistics. [Online]. Available from http://cscmp.org/career/career-
patterns.asp. [Downloaded: 2010-06-08].
Cooper, M.C., Santosa, J. & Burgos-Dominguez, A. 2007. Career patterns of
women in logistics. [Online]. Available from http://cscmp.org/career/career-
patterns.asp. [Downloaded: 2010-06-07].
CSCMP. 2010. Council for supply chain management professionals
suggested minimum supply chain benchmarking standards. Free e-book.
[Online]. Available from www.cscmp.org/minstandardsebook.pdf.
[Downloaded: 2010-06-15].
©© UUnniivveerrssiittyy ooff PPrreettoorriiaa

295
D’Abate, C. P., Eddy, E.R. & Tannenbaum, S.I. 2003. What’s in a name? A
literature based approach to understanding mentoring, coaching and other
constructs that describe developmental interactions. Human Resource
Development Review. 2 (4): 360-384. [Online] Available from ABI/Inform
Global DOI: 10.1177/1534484303255033. [Downloaded: 2009-06-08].
Diamantopoulos, A & Schlegelmilch, B, B. 2002. Taking the fear out of data
analysis: a step-by-step approach. Australia: Business Press/Thomson
Learning.
Dischinger, J., Little, N. & Kellso, J.R. 2008. Supply chain talent: matching
demand and supply at the skills level. Paper presented at CSCMP Annual
global conference. Denver: Colorado, USA. [Online]. Available from
http://www.supply-chain.org/galleries/public-
gallery/SupplyChainTalent_Stateof theDiscipline.pdf. [Downloaded: 2009-06-
23].
Dychtwald, K. & Baxter, D. 2007. Capitalizing on the new mature workforce.
Public Personnel Management. Vol 36 (4): 325-334. [Downloaded: 2009-06-
08].
Erasmus, B. J., Oedolff, PvZ., Mda, T. & Nel, P.S. 2007. Managing training
and development in South Africa. (4th ed). Cape Town, South Africa: Oxford
University Press.
Fairbairns, Jill. 1991. Plugging the gap in TNA. Personnel Management.
2 (23): 43-45. ISSN: 00315761. [Downloaded: 2010-08-20].
Frazelle, E., H. 2002. Supply chain strategy. McGraw-Hill: New York, USA.
Frazis, H., Gittleman, M. & Joyce, M. 2000. Correlates of training: an
analysis using both employer and employee characteristics. Industrial and
©© UUnniivveerrssiittyy ooff PPrreettoorriiaa

296
Labour Relations Review. 53 (3): 443-462. [Online] Available online at
EBSCO Host Business Source Premier: 0019-7939/00/5303. [Downloaded:
2008-04-11].
Garavan, T. N. 1997. Training, development, education and learning:
different or the same? Journal of the European Industrial Training. 21 (2/3):
39-50. [Online] Available from http://0-
web.ebscohost.com.innopac.up.ac.za/ehost/delivery?vid=4&hid=9&sid=85e84
59b-543f-4293-99b5-5e9aae7eecd6%40SRCSM1 [Downloaded 2008-07-16].
Gartell, M., Jans, A-C. & Persson, H. 2010: The importance of education and
the reallocation of labour: evidence from Swedish linked employer-employee
data 1986-2002. Labour Economics: 17: 206-214. [Online] Available from
www.elsevier.com/locate/labeco. Doi:10.1016.j.labeco.2009.09.009.
[Downloaded: 2011-04-15].
Gattorna, J. L. 2010. Dynamic supply chains: delivering value through
people. Pearson Education: Harlow, Great Britain.
Gattorna, J. L. 2006. Living supply chains: how to mobilize the enterprise
around delivering what your customers want. Pearson Education: Harlow,
Great Britain.
Gattorna, J.L & Clarke,R. S. 2003. Education and skills training requirements
in supply chains. In the Gower handbook of supply chain management. 5th
ed. Gattorna, J.l., Ogulin, R. & Reynolds, M.W. (eds). Gower: Cornwall, Great
Britain.
Gattorna, J.L. 2003. The challenging new operating environment and size of
the prize. Gower handbook of supply chain management. 5th ed. Gattorna,
J.l., Ogulin, R. & Reynolds, M.W. (eds). Gower: Cornwall, Great Britain.
Gibson, B. J., Mentzer, J.T., & Cook, R.L. 2005. Supply chain management:
the pursuit of a consensus definition. Journal of Business Logistics. Vol 26
©© UUnniivveerrssiittyy ooff PPrreettoorriiaa

297
(2): 17-25. [Online] Available from ABI/INFORM http://0-
search.proquest.com.innopac.up.ac.za/docview/212644498/fulltextPDF?acco
untid=14717 [Downloaded 2011-02-02].
Gowen, III, C.R. & Tallon, W.J. 2003. Enhancing supply chain practices
though human resource management. Journal of Management Development.
Vol 22. (1): 32-44. [Online] Available from http://emeraldinsight.co,.0262-
1711.htm. [Downloaded 2011-02-02].
Grant, D.B. 2001. Using block courses for teaching logistics. International
Journal of Physical Distribution and Logistics Management. 31 (7/8): 574-
584. [Online]. Available from http://www.emerald-library.com./ft.
[Downloaded: 2008-07-03].
Grobler, P., Wärnich, S., Carrell, M.R., Elbert, N. F. & Hatfield, R. D. 2009.
Human Resource Management in South Africa- concise edition. United
Kingdom: Cengage.
Guinipero, L.C., Hooker, R.E., Joseph-Matthews, S., Yoon, T.E. & Brudvig, S.
2008. A decade of SCM literature: past, present and future implications.
Journal of Supply Management. [Online]. Available from Wiley.
[Downloaded: 2010-08-20].
Gupta, K., Sleezer, C. M. & Russ-Eft, D. F. 2007. A practical guide to needs
assessment. San Francisco, USA: John Wiley & Sons
Guthrie, J.P. & Schwoerer, C.E. 1996. Older dogs and new tricks: career
stage and self-assessed need for training. Public personnel management. 25
(1): 59-72. [Online]. [Downloaded 2009-07-16]
Hair, J. F (Jr), Anderson, R.E., Tatham, R.L. & Black, W. C. 1998.
Multivariate data analysis (5th ed). New Jersey, USA: Prentice–Hall.
©© UUnniivveerrssiittyy ooff PPrreettoorriiaa

298
Hannum, W. 2009. Training myths: false beliefs that limit the efficiency and
effectiveness of training solutions, Part 1. Performance Improvement. 48 (2):
26-30. [Online]. Available from Wiley Interscience at
www.interscience.wiley.com. DOI: 10. 1002/pfi.20051. [Downloaded: 2011-
04-15].
Harrison, L. M., Davis, M.V., MacDonald, P., Alexander, L.K., Cline, J.S.,
Alexander, J. G., Rothney, E.E., Rybka, T.P., Stevens, R.H. 2005.
Development and implementation of a public health workforce, training needs
assessment survey in North Carolina. Association of Schools of Public
Health. [Online]. Available from Public Health Reports 120 Supplement 1:
28. [Downloaded: 2009-09-10].
Homer, M. 2001. Skills and competency management. Industrial and
commercial training. 33 (2): 59-62. [Online] Available from
http://www.emerald-library.co.ft. [Downloaded 2009-02-20].
Hornby, A. S., Cowen A. P. & Gimson, A. C. 1986. Oxford advanced
learners dictionary of current English. Oxford University Press: Oxford, Great
Britain.
HRD Department of the Institute of Personnel Management South Africa.
1994. The” How To” series on Human Resources Development: identifying
training needs. Randburg, South Africa: Knowledge Resources
Kara, D. & Murrmann, S. K. 2011. The effects of wage differences on
employee job satisfaction in the lodge industry. [Online] Available from
http://scholarworks.umass.edu.innopac.up.ac.za/cgi/viewcontent.cgi?article=1
117&context=gradconf_hospitality. [Downloaded: 2011-04-15].
Keller, S.B. & Ozment, J. 2009. Research on personnel issues published in
leading logistics journals. The international journal of logistics management.
Vol 20(3): 378-407. [Online]. Available from www.emeraldinsight.com DOI
10.1108/09574090911002832
©© UUnniivveerrssiittyy ooff PPrreettoorriiaa

299
La Londe, B.J. & Ginter, J.L. 2009. The Ohio State University 2009 survey of
career patterns in logistics. [Online] Available from
http://cscmp.org/career/career-patterns.asp. [Downloaded: 2010-06-08].
Lambert, D.M., & Cooper, M.C. 2000. Issues in supply chain management.
Industrial Marketing Management. Vol 29: 65-83. [Online] Available from
http://0-
www.cob.unt.edu.innopac.up.ac.za/slides/SwartzS/MKTG%206040%20Sprin
g%202009/Articles../T2%20Spatial%20Economics/Lambert%20cooper%20IM
M%202000%20Issues%20in%20supply%20chain%20management.pdf.
Lancaster, K. 2001. Planning a curriculum and a learning programme. In
ETD practices in South Africa. Meyer, M., Mabaso, J. & Lancaster, K. (eds).
Pietermaritzburg, South Africa: LexisNexis, Butterworths.
Lawson, K. 2008. Instructional design and development. In American Society
for Training and Development handbook for workplace learning professionals.
Biech, E. (ed). Maryland: USA: United Book Press.
Lee, J. W. & Lancaster, J.W. 1971. The maintenance training gap: the
changing nature and growing need for more effective maintenance training.
Training and Development Journal. [Online] Available from
www.ebscohost.com. [Downloaded: 2009-07-09].
Leedy, P.D. & Ormrod, J.E. 2005. Practical Research: planning and design
(8th ed-International). Upper Saddle River, New Jersey, USA: Pearson
Prentice-Hall International.
Letseka, M. 2009. University drop-out and researching (lifelong) learning and
work. Learning/Work: turning lifelong learning inside out. Human Sciences
Research Council: Cape Town, South Africa.
©© UUnniivveerrssiittyy ooff PPrreettoorriiaa

300
MacDuffie, J.P. & Kochan, T.A. 1995. Do US firms invest less in human
resources? Training in the world auto industry. Industrial Relations. 34 (2):
147-168. [Online] Available from Blackwell Publishing Limited. [Downloaded:
2009-07-09].
Mangan, J., & Christopher, M. 2005. Management Development and the
supply chain manager of the future. International Journal of Logistics
Management. Vol 16 (2): 178-191. [Online] Available from Emerald
Publishing Group www.emeraldinsight .com/0957-4093.htm. [Downloaded:
2010-02-22].
Mayer, M. J. & Altman, M. 2005. South Africa’s economic development
trajectory: implications for skills development. Journal of Education and Work.
18 (1): 33-56. [Online] Available at DOI: 10.1080/1363908052000332302.
[Downloaded: 2008-07-03].
McCracken, M & Winterton, J. 2006. What about the managers?
Contradictions between lifelong learning and management development.
International Journal of Training and Development. 10(1): 55- 67. [Online]
Available from Blackwell Publishing ISSN 1360-3736. [Downloaded: 2009-07-
16].
McGrath, S. & Patterson, A. 2008. “Enterprise Training” in Human
Resources Development Review: education, employment and skills in South
Africa. Kraak, A. & Press, K. (eds). [Online] Available from
http://www.hsrcpress.ac.za/home.php?cat=13. [Downloaded: 2009-11-03].
McQuaid, R., Lindsay, C. & Johnson, S. 2010. An appetite for learning:
increasing employee demand for skills development. Praxis: UK Commission
for employment and skills. 3:1-25. [Online]. Available from http://0-
researchrepository.napier.ac.uk.innopac.up.ac.za/4162/1/Praxis_UKCES_A5_
Appetite_For_Learning_1.pdf. [Downloaded: 2011-04-15].
©© UUnniivveerrssiittyy ooff PPrreettoorriiaa

301
Melnyk, S. & Sandor, J. 2008. SCM 2010 and beyond: mapping the future of
supply chain management obstacles and issues. Paper presented at SAPICS
30th Annual conference and exhibition. Sun City: South Africa. [Online]
Available at www.sapics.org.za ISBN 9780620407366. [Downloaded: 2008-
07-31].
Mentzer, J.t., DeWitt, W., Keebler, J.S., Min, S., Nix, N.W., Smith, C.D. &
Zacharia, Z.G. 2001 Defining supply chain management. Journal of
Business Logistics. Vol 22(2): 1-26. [Online]. Available from Ebsco Host at
http://0-
web.ebscohost.com.innopac.up.ac.za/ehost/detail?hid=12&sid=05ac14ec-
477d-40c9-9fb4-
e1770ada7682%40sessionmgr13&vid=1&bdata=JnNpdGU9ZWhvc3QtbGl2Z
SZzY29wZT1zaXRl#db=buh&AN=6352236. [Downloaded 2011-02-02].
Meyer, M., Opperman, C. & Dyrbye, C. 2003. Measuring return on
investment in training: a practical implementation guide. Randburg, South
Africa: Knowres Publishing.
Meyer, M. & Mokoele, M. 2001. ETD Occupational Development. In ETD
practices in South Africa. Meyer, M., Mabaso, J. & Lancaster, K. (eds).
Pietermaritzburg, South Africa: LexisNexis, Butterworths.
More, D. D. 2004. The impact of large scale training programmes on
education management development in South Africa. Unpublished thesis.
Pretoria: University of Pretoria. [Online]. Available from
http://upetd.up.ac.za/thesis/available/etd-09082004-080409/. [Downloaded:
2008-09-09].
Mouton, J. 2005. How to succeed in your Master’s and Doctoral studies: a
South African guide and resource book. Pretoria, South Africa: Van Schaik
Myers, M. B., Griffith, D. A., Daugherty, P.J. & Lusch, R. F. 2004. Maximising
the human capital equation in logistics: education, experience and skills.
©© UUnniivveerrssiittyy ooff PPrreettoorriiaa
302
Journal of business logistics. 25 (1): 211-232. [Online]. Available from
ABI/Inform Global. [Downloaded: 2010-02-23].
National Qualifications Framework Act, no 67 of 2008. Government Gazette
Vol 524: Cape Town. [Online] Available from
http://www.saqa.org.za/docs/legislation/acts/2008/act67-08.pdf.
[Downloaded: 2011-04-28].
O’Brien, E. & Hall, T. 2004. Training needs analysis – the first step in
authoring e-learning content. In Proceedings of the 2004 ACM Symposium
on Applied Computing pages 935-939. [Downloaded: 2009-07-09].
Olian, J.D., Durham, C.C., Kristof, A.L., Brown, K.G., Pierce, R.M. & Kunder,
L. 1998. Designing management training and development for competitive
advantage: lessons from the best. Human Resource Planning. 21 (1): 20-31.
[Online]. Available online at http://0-
web.ebscohost.com.innopac.up.ac.za/ehost/pdf?vid=2&hid=6&sid=28811e59-
0d1f-4e8b-853f-2d804c63c793%40sessionmgr2 [Downloaded 2008-07-16].
Othman, R. & Ghani, R.A. 2002. Supply chain management and suppliers’
HRM practice. Supply chain management: an international journal. 13(4):
259-262. [Online]. Available from http://www.emerald-library.com./ft. DOI
10.1108/13598540810882143. [Downloaded: 2010-12-06].
Peters, V. 2004. Working and training: First results of the 2003 Adult
Education and Training Survey. Culture, Tourism and the Centre for
Education Statistics Division research papers. [Online] Available under
catalogue number 81-595-MIE2004015 on www.statcan.ca/cgi-
bin.downpub/studiesfree.cgi. [Downloaded: 2008-07-03].
Pineda, P. 2010. Perspective on Practice: evaluation of training in
organisations: a proposal for an integrated model. Journal of European
Industrial Training. 34 (7): 673-693. [Online]. Available from
www.emerladinsight.com/0309-0590.htm. [Downloaded: 2010-11-17].
©© UUnniivveerrssiittyy ooff PPrreettoorriiaa

303
Roodhouse, S & Mumford, J. 2008-2010. HE@Work: three year longitudinal
employee learning attitudes survey of large private businesses. Industrial and
Commercial Training. 42: 319-329. [Online] Available from Emerald Group
Publishing DOI: 10.1108/00197851011070703]. [Downloaded: 2011-04-28].
Saunders, M., Lewis, P. & Thornhill, A. 2007. Research methods for
business students. 4th ed. Pearson Education: Harlow, England.
Schmidt, S. W. 2009. Employee demographics and job training satisfaction:
the relationship between dimensions of diversity and satisfaction with job
training. Human Resource Development International. 12 (3): 297-312.
[Online]. Available from http://informaworld.com DOI:
10.1080/13678860902982082 Taylor and Francis. [Downloaded: 2011-04-
15].
Sherman, R.J. 2013. Supply chain transformation: practical roadmap to best
practice results. New Jersey, USA: Wiley Corporate F&A
Simchi-Levi, D., Kaminsky, P. & Simchi-Levi, E. 2008. Designing and
managing the supply chain: concepts, strategies and case studies. (3rd ed).
New York, USA: McGraw-Hill/Irwin.
South African Qualifications Authority (Author unknown). 2011. Changes in
the SETAs' scope of coverage. [Online] Available from
http://www.saqa.org.za/news/2011/coverage.html. [Downloaded: 2011-04-
28].
Sparhawk, S. 1994. Identifying targeted training needs: a practical guide to
beginning an effective training strategy. London: Richard Chang Associates.
Stamps, D. 1997. Communities of practice: Learning is social. Training is
irrelevant? Training. Vol 34(2): 34-42. [Downloaded 2008-07-16].
©© UUnniivveerrssiittyy ooff PPrreettoorriiaa

304
Statsoft. 2003 edition. [Online]. Available at:
http://www.statsoft.com/textbook. Downloaded: [2012-03-29].
Stock, J.R., Boyer, S.L. & Harmon, T. 2010 . Research opportunities in
supply chain management. Journal of the Academy of Marketing Science.
Vol 38: 32-41. [Online] Available from Springer DOI
10.1007/s1174700901362. [Downloaded: 2010-12-07].
Swist, J. 2001. Conducting a training needs assessment. AMX Training
Needs Assessment. [Online] Available from
http://www.amxi.com/amx_mi30.htm [Downloaded 2009-02-20].
Sydhagen, K. & Cunningham, P. 2007. Human resource development in Sub-
Saharan Africa. Human resource development international. Vol 10 (2): 121-
135. [Online]. Available at DOI 10.1080/13678860701347156. Routledge.
[Accessed 2010-01-26].
Tajino, A., James, R. & Kijima, K. 2004. Beyond needs analysis: soft
systems methodology for meaningful collaboration in EAP course design.
Journal of English for Academic Purposes. [Online]. Available from Elsevier
DOI 10.1016/j.jeap.2004.01.001. [Downloaded: 2008-09-04].
Truman, K. 2007. Assessment and moderation in ETD. Practicing education,
training and development in South African organisations. Coetzee, M (ed).
Cape Town, South Africa: Juta.
Van der Schyff, R. 2003. Developing workplace skills plans. In ETD
practices in South Africa. Meyer, M., Mabaso, J. & Lancaster, K. (eds).
Pietermaritzburg, South Africa: LexisNexis, Butterworths.
Venter, K. 2003. Building on formal education: employers’ approaches to the
training and development of new recruits in the Peoples’ Republic of China.
International Journal of Training and Development. 7 (3): 186-202. [Online]
©© UUnniivveerrssiittyy ooff PPrreettoorriiaa

305
Available at EBSCO Publishing- ISSN 1360-3736. [Downloaded: 2008-07-
16].
Vermeulen, R.C.M. 2002. Narrowing the transfer gap: the advantage of “as
if” situations in training. Journal of European Industrial Training. 26 (8): 366-
374. [Online]. Available from
htpp://www.emeraldinsight.com/researchregisters. [Downloaded 2009-07-14].
Walters, S. & Daniels, F. 2009. Where can I find a conference on short
courses? in Learning/Work: turning work and lifelong learning inside out.
Cooper, L & Walters, S (eds). Cape Town, South Africa: HSRC Press.
Walters, S. 1999. New challenges and opportunities for lifelong learning in
South Africa. Comparative Education. 35 (2): 217-224. [Online]. Available
from Ebsco Host ejs ISSN 0305-0068. [Downloaded: 2008-08-24].
Witkin, B.R. & Altschuld, J.W. 1995. Planning and conducting needs
assessments: a practical guide. London, United Kingdom: Sage Publications
Zemke, R. & Kramlinger, T. 1982. Figuring things out: a trainer’s guide to
needs and task analysis. London, United Kingdom: Addison-Wesley.
©© UUnniivveerrssiittyy ooff PPrreettoorriiaa