a fast track to improving retention and student assessment data: using traditional recruitment...
TRANSCRIPT

A Fast Track to Improving Retention and Student Assessment Data:
Using Traditional Recruitment Systems to Increase Student Re-enrollment
Rates
Jay W. GoffDean of Enrollment Management
Missouri University of Science and Technology
Rolla, Missouri, USAhttp://enrollment.mst.edu

May 28-30, 2008, San Diego, CA

Admissions’ Multi-Media Resources
Direct Mail E-Mail Internet/Websites Social Networking Sites: MySpace or Facebook Phone Calling or Telecounseling
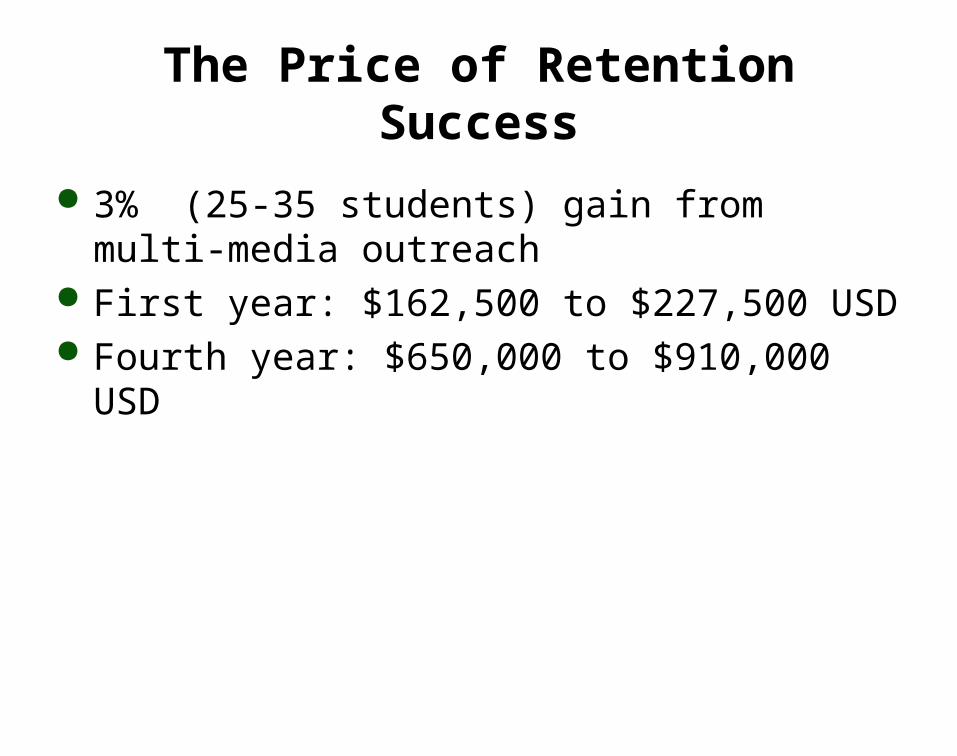
The Price of Retention Success
3% (25-35 students) gain from multi-media outreach
First year: $162,500 to $227,500 USD Fourth year: $650,000 to $910,000 USD
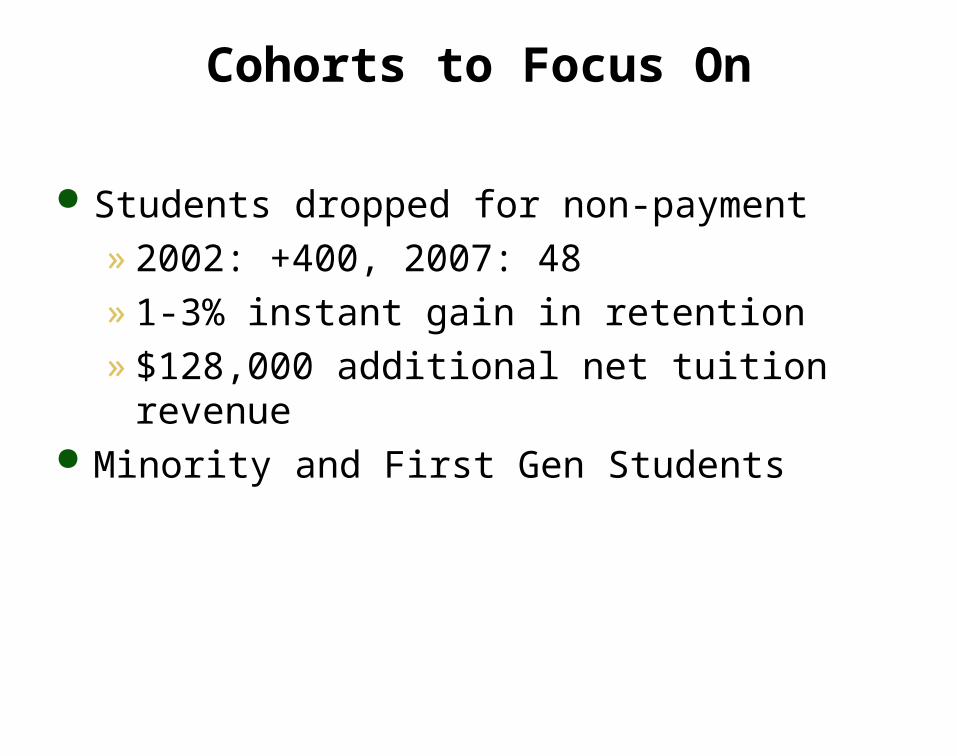
Cohorts to Focus On
Students dropped for non-payment» 2002: +400, 2007: 48» 1-3% instant gain in retention» $128,000 additional net tuition revenue
Minority and First Gen Students
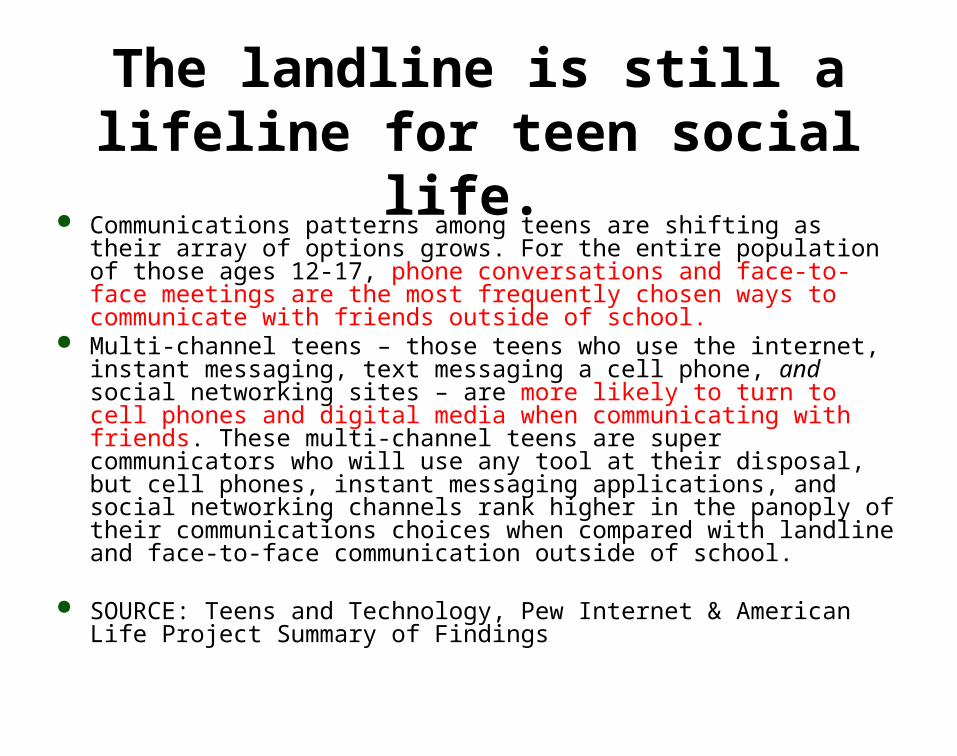
The landline is still a lifeline for teen social life.
Communications patterns among teens are shifting as their array of options grows. For the entire population of those ages 12-17, phone conversations and face-to-face meetings are the most frequently chosen ways to communicate with friends outside of school.
Multi-channel teens – those teens who use the internet, instant messaging, text messaging a cell phone, and social networking sites – are more likely to turn to cell phones and digital media when communicating with friends. These multi-channel teens are super communicators who will use any tool at their disposal, but cell phones, instant messaging applications, and social networking channels rank higher in the panoply of their communications choices when compared with landline and face-to-face communication outside of school.
SOURCE: Teens and Technology, Pew Internet & American Life Project Summary of Findings


Financial considerations the most common reason for leaving college
0%
5%
10%
15%
20%
25%
30%
35%
40%
Reasons for discontinuingpostsecondary education
Financial reasons
Other
Family responsibilities
Class not available / schedulinginconvenient
Dissatisfaction with program / school /campus / faculty
Completion of degree / certificate
Academic problems
Finished taking desired classes
Personal health reasons
Traumatic experience
Military service
SOURCE: ELS:2002 “A First Look at the Initial Postsecondary Experiences of the High School Sophomore Class of 2002 (National Center for Education Statistics)

Personal Reasons: Family issues – needed at home Girlfriend/Boyfriend issues Bad & overpriced dorm & food Too small of a town/Nothing to do Just not the right fit Wanted to get away from home Wanted to move closer to home
Academic Issues: Too hard/Grades lower than expected Changed major/preferred at another institution Felt university was too focused on Engineering/Not enough different liberal arts
programs/classes Advisor/Instructor not helpful enough
Financial Issues: Cost/Financial Cannot borrow enough Parents will not pay
Why Student Leave S&T
Note: Some students reported multiple reasons.

Student Success Trends
ACT, 2007

STUDENT RETENTION
Status in Fall Semester After One Year
70
75
80
85
90
Year
Per
cent Still
Enro
lled
Graduation Rates 2000 2005
General Student Body: 52% 64%

Freshmen Retention & Graduation Rates
40%45%50%55%60%65%70%75%80%85%90%95%
100%
87 88 89 90 91 92 93 94 95 96 97 98 99 00 01 02 03 04 05 06
Entering Fall
1 Yr 2 Yrs 3 Yrs 4 Yrs 5 Yrs 6 Yrs
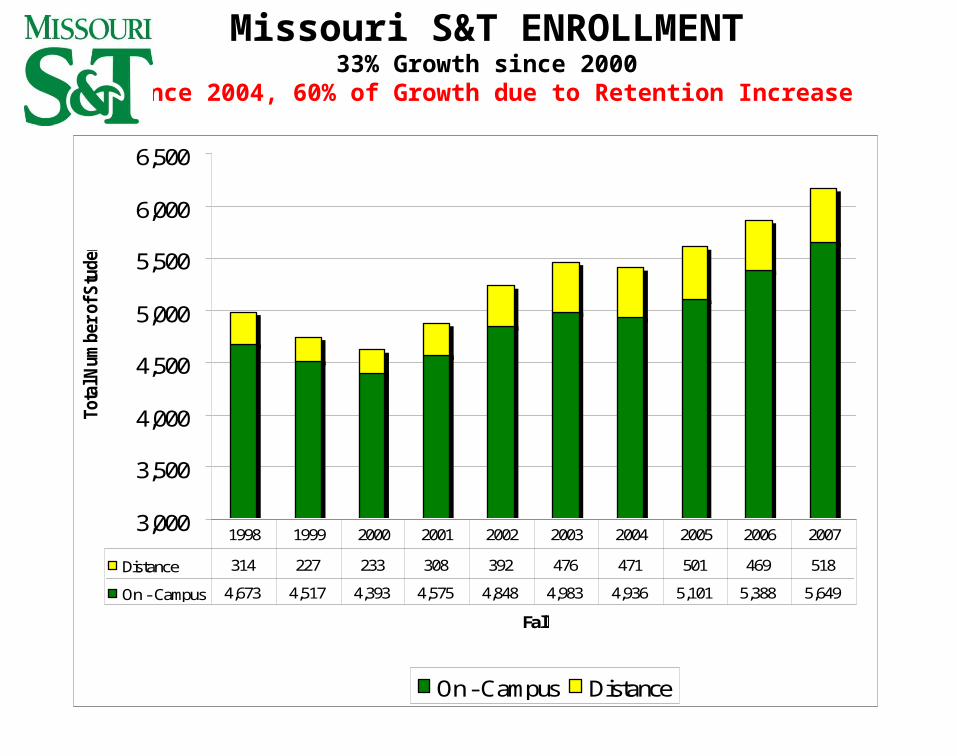
Missouri S&T ENROLLMENT33% Growth since 2000
Since 2004, 60% of Growth due to Retention Increase
3,000
3,500
4,000
4,500
5,000
5,500
6,000
6,500
Fall
Tota
l Num
ber
of S
tuden
ts
On - Campus Distance
Distance 314 227 233 308 392 476 471 501 469 518
On - Campus 4,673 4,517 4,393 4,575 4,848 4,983 4,936 5,101 5,388 5,649
1998 1999 2000 2001 2002 2003 2004 2005 2006 2007
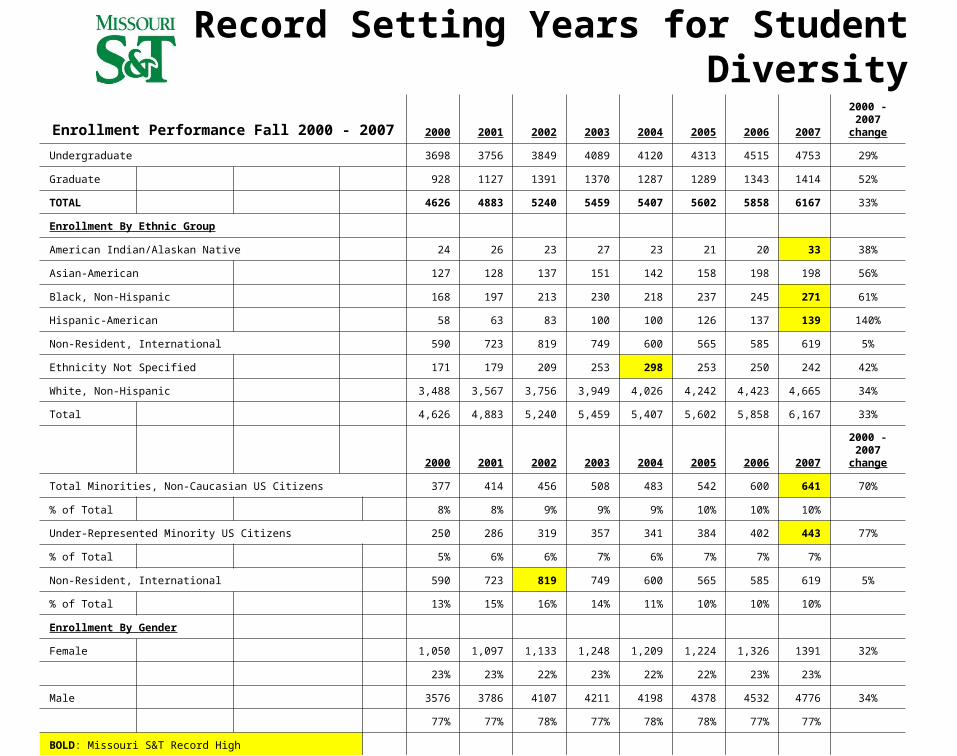
Enrollment Performance Fall 2000 - 2007 2000 2001 2002 2003 2004 2005 2006 20072000 -2007
change
Undergraduate 3698 3756 3849 4089 4120 4313 4515 4753 29%
Graduate 928 1127 1391 1370 1287 1289 1343 1414 52%
TOTAL 4626 4883 5240 5459 5407 5602 5858 6167 33%
Enrollment By Ethnic Group
American Indian/Alaskan Native 24 26 23 27 23 21 20 33 38%
Asian-American 127 128 137 151 142 158 198 198 56%
Black, Non-Hispanic 168 197 213 230 218 237 245 271 61%
Hispanic-American 58 63 83 100 100 126 137 139 140%
Non-Resident, International 590 723 819 749 600 565 585 619 5%
Ethnicity Not Specified 171 179 209 253 298 253 250 242 42%
White, Non-Hispanic 3,488 3,567 3,756 3,949 4,026 4,242 4,423 4,665 34%
Total 4,626 4,883 5,240 5,459 5,407 5,602 5,858 6,167 33%
2000 2001 2002 2003 2004 2005 2006 20072000 -2007
change
Total Minorities, Non-Caucasian US Citizens 377 414 456 508 483 542 600 641 70%
% of Total 8% 8% 9% 9% 9% 10% 10% 10%
Under-Represented Minority US Citizens 250 286 319 357 341 384 402 443 77%
% of Total 5% 6% 6% 7% 6% 7% 7% 7%
Non-Resident, International 590 723 819 749 600 565 585 619 5%
% of Total 13% 15% 16% 14% 11% 10% 10% 10%
Enrollment By Gender
Female 1,050 1,097 1,133 1,248 1,209 1,224 1,326 1391 32%
23% 23% 22% 23% 22% 22% 23% 23%
Male 3576 3786 4107 4211 4198 4378 4532 4776 34%
77% 77% 78% 77% 78% 78% 77% 77%
BOLD: Missouri S&T Record High
2007 International Student Representation: 2.6% of undergraduates, 2.5% of distance grad students, 53.3% of campus grad students
Record Setting Years for Student Diversity

Rolla, Missouri“The Middle of Everywhere”

What is Missouri S&T?
A Top 50 Technological Research University 6100 students: 4700 Undergrad, 1400 Graduate 90% majoring in Engineering, Science, Comp. Sci. Ave. Student ACT/SAT: upper 10% in nation +60% of Freshmen from upper 20% of HS class 20% Out of State Enrollment 96% 5 Year Average Placement Rate within 3
months of Grad Ave. Starting Salary in 2007: +$53,000
F o u n d e d 1 8 7 0 R o l l a , M i s s o u r i
2008 National Academic and Outcomes Rankings
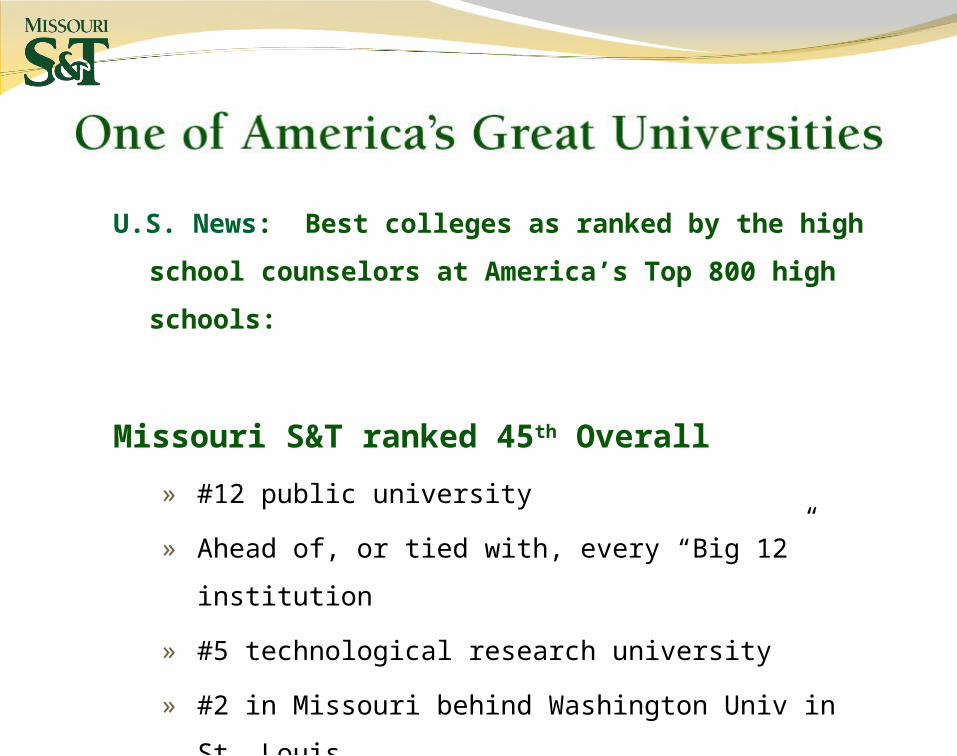
U.S. News: Best colleges as ranked by the high school
counselors at America’s Top 800 high schools:
Missouri S&T ranked 45th Overall
» #12 public university
» Ahead of, or tied with, every “Big 12” institution
» #5 technological research university
» #2 in Missouri behind Washington Univ in St. Louis
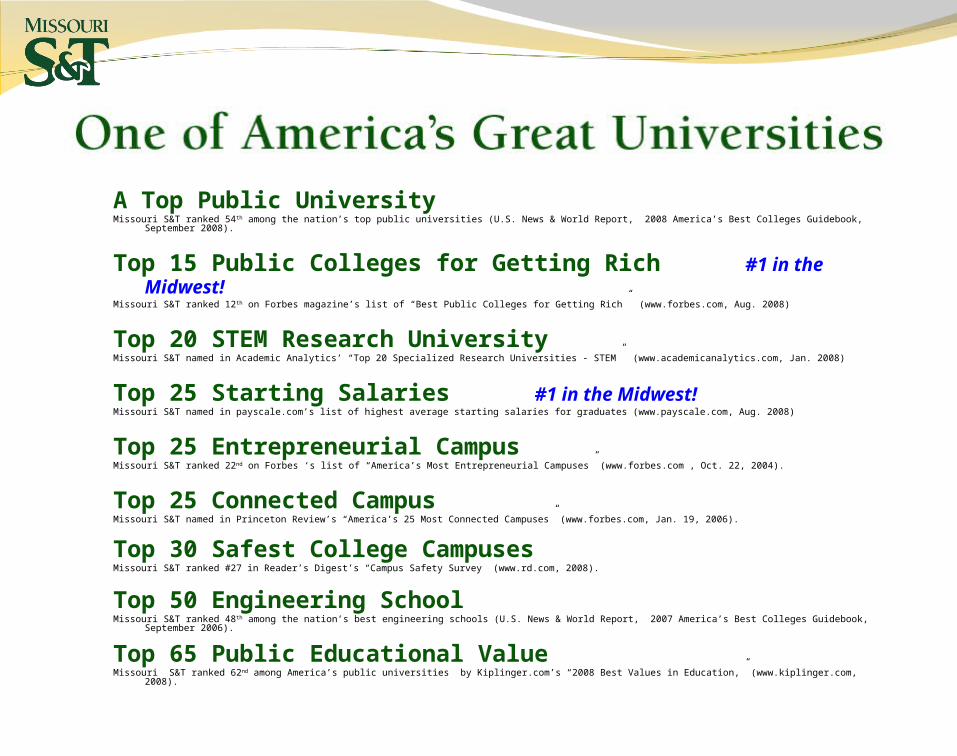
A Top Public UniversityMissouri S&T ranked 54th among the nation’s top public universities (U.S. News & World Report, 2008 America’s Best Colleges Guidebook, September 2008).
Top 15 Public Colleges for Getting Rich #1 in the Midwest! Missouri S&T ranked 12th on Forbes magazine’s list of “Best Public Colleges for Getting Rich” (www.forbes.com, Aug. 2008)
Top 20 STEM Research University Missouri S&T named in Academic Analytics’ “Top 20 Specialized Research Universities - STEM” (www.academicanalytics.com, Jan. 2008)
Top 25 Starting Salaries #1 in the Midwest! Missouri S&T named in payscale.com’s list of highest average starting salaries for graduates (www.payscale.com, Aug. 2008)
Top 25 Entrepreneurial Campus Missouri S&T ranked 22nd on Forbes ‘s list of “America’s Most Entrepreneurial Campuses” (www.forbes.com , Oct. 22, 2004).
Top 25 Connected Campus Missouri S&T named in Princeton Review’s “America’s 25 Most Connected Campuses” (www.forbes.com, Jan. 19, 2006).
Top 30 Safest College CampusesMissouri S&T ranked #27 in Reader’s Digest’s “Campus Safety Survey” (www.rd.com, 2008).
Top 50 Engineering SchoolMissouri S&T ranked 48th among the nation’s best engineering schools (U.S. News & World Report, 2007 America’s Best Colleges Guidebook, September 2006).
Top 65 Public Educational ValueMissouri S&T ranked 62nd among America’s public universities by Kiplinger.com’s “2008 Best Values in Education,” (www.kiplinger.com, 2008).
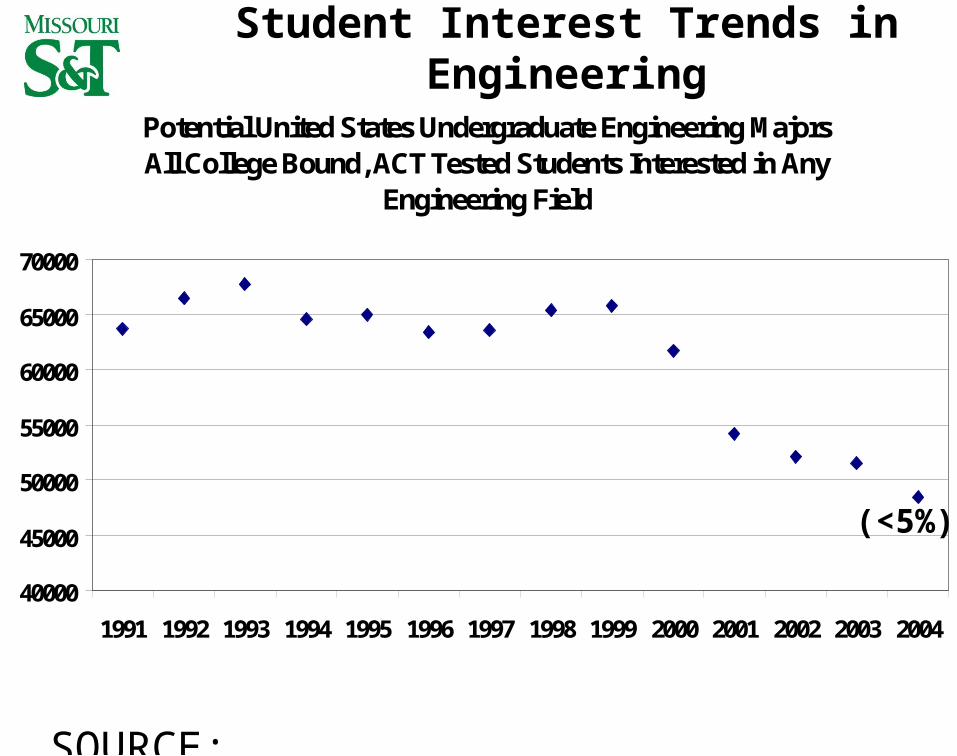
Student Interest Trends in Engineering
Potential United States Undergraduate Engineering MajorsAll College Bound, ACT Tested Students Interested in Any
Engineering Field
40000
45000
50000
55000
60000
65000
70000
1991 1992 1993 1994 1995 1996 1997 1998 1999 2000 2001 2002 2003 2004
(<5%)
SOURCE: ACT, 2006

Missouri S&T: 90% Engineering, Science, & Computing Majors
Fall 2007 Total Students
4,663 75.61%
313 5.08%
206 3.34%
846 13.72%
139 2.25%
Engineering
Business and IST
Arts and Social Sciences
Science and Computing
Non-Degree/Undecided
Average enrollment is 6,457
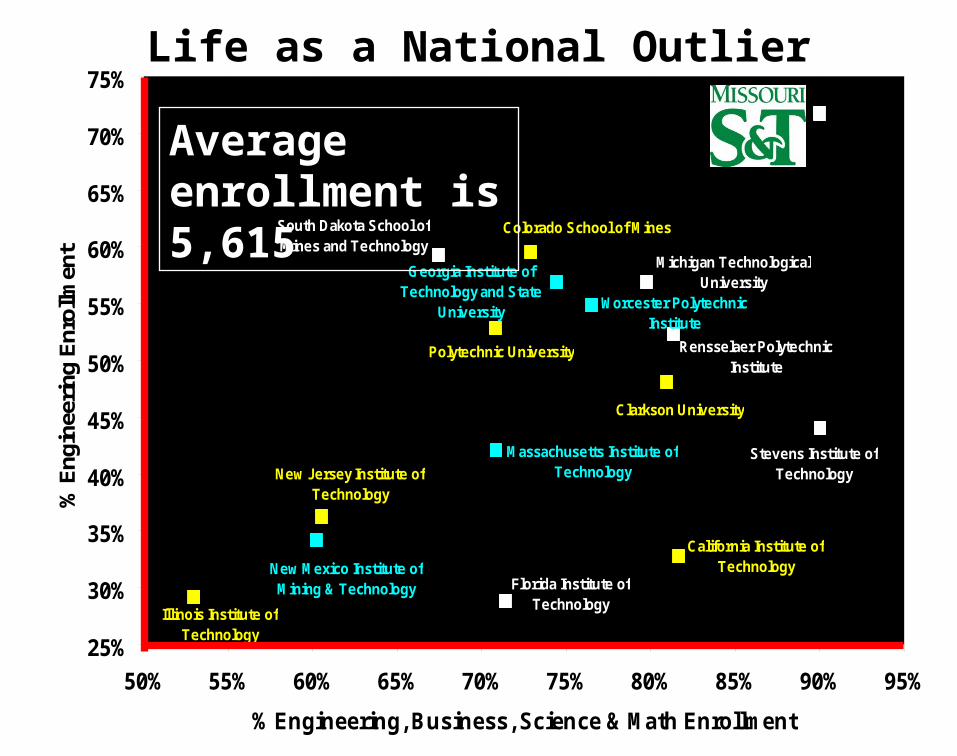
Life as a National Outlier
California Institute of Technology
Polytechnic University
Colorado School of Mines
Georgia Institute of Technology and State
University
Illinois Institute of Technology
Michigan Technological University
New Jersey Institute of Technology
Rensselaer Polytechnic Institute
South Dakota School of Mines and Technology
Stevens Institute of Technology
Missouri S&T
Massachusetts Institute of Technology
Clarkson University
Florida Institute of Technology
New Mexico Institute of Mining & Technology
Worcester Polytechnic Institute
25%
30%
35%
40%
45%
50%
55%
60%
65%
70%
75%
50% 55% 60% 65% 70% 75% 80% 85% 90% 95%
% Engineering, Business, Science & Math Enrollment
% E
ngin
eeri
ng E
nrol
lmen
t
Average enrollment is 5,615
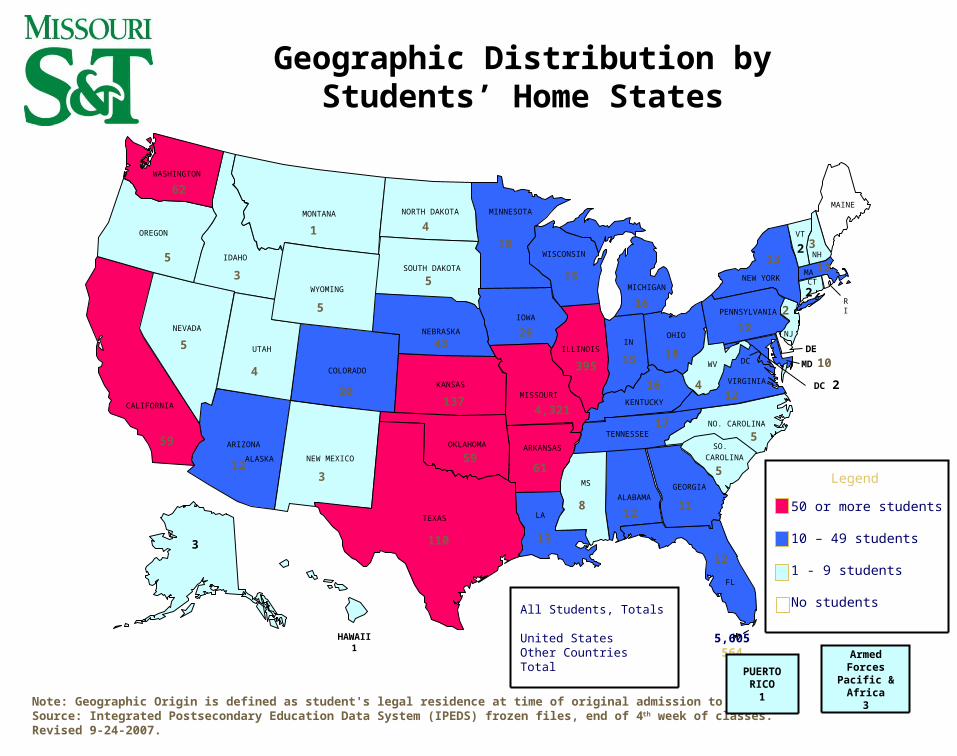
All Students, Totals
United States 5,605 Other Countries 564 Total 6,167
ALASKA
CALIFORNIA
IDAHO
OREGON
WASHINGTON
MONTANA
WYOMING
UTAH
COLORADO
ARIZONA
NEW MEXICO
TEXAS
OKLAHOMA
KANSAS
NEBRASKA
SOUTH DAKOTA
NORTH DAKOTA MINNESOTA
WISCONSIN
IOWA
ILLINOIS
OHIOIN
KENTUCKY
WV
VIRGINIA
NO. CAROLINA
GEORGIA
FL
ALABAMA
MS
MISSOURI
ARKANSAS
LA
NEVADA
HAWAII1
MICHIGAN
PENNSYLVANIA
NJ
NEW YORK CTMA
VT
NH
MAINE
TENNESSEE
CAROLINA
SO.
MD
DE
RI
DC
62
5
3
1
5
5
4
20
59
123
59
137
43
5
26
4,321
61
13110
8
4
18
15
395 15
16
18
16
17
1211
5
12
5
124
12
132 3
3
Note: Geographic Origin is defined as student's legal residence at time of original admission to S&T. Source: Integrated Postsecondary Education Data System (IPEDS) frozen files, end of 4th week of classes. Revised 9-24-2007.
12
2
2
10
DC 2
50 or more students
10 – 49 students
1 - 9 students
No students
Legend
PUERTORICO
1
Armed Forces
Pacific & Africa
3
Geographic Distribution by Students’ Home States

Undergraduate Demographics
Average Age: 21.6 years old
Gender: » 23% Female» 77% Male
First Generation College Students:» 2005-06: 37%
Residency:» Missouri Residents: 76%» Out-State Students: 22%» International: 2%
Ethnicity: » African-American: 4% » Asian-American: 3% » Caucasian: 83% » Hispanic: 2% » Native-American: 1% » Non-resident, International: 2%» Not Disclosed: 5%
First Generation: 36%
From a Community <40,000: 55% approx.
Average Family Income: $72,000
Average Indebtedness at Graduation: » $21,000 USD approx.
High Financial Need (Pell qualifier): 24%
Freshmen with Credit Cards:» 24%
Students with PCs:» 94%» +70% laptops» 7% Macs
Students with Cell Phones» 97%
How Did Missouri S&T Make Immediate Gains in Retention
and Graduation Rates?

Using the Scientific Process
STEP ONE: Identify the Problem
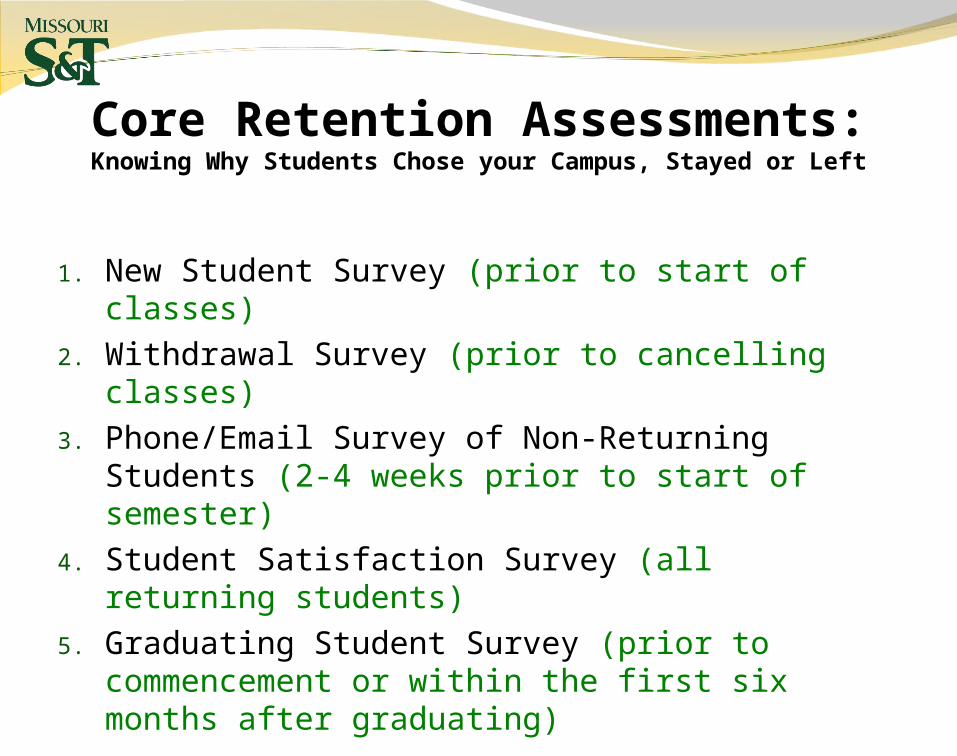
Core Retention Assessments:Knowing Why Students Chose your Campus, Stayed or Left
1. New Student Survey (prior to start of classes)
2. Withdrawal Survey (prior to cancelling classes)
3. Phone/Email Survey of Non-Returning Students (2-4 weeks prior to start of semester)
4. Student Satisfaction Survey (all returning students)
5. Graduating Student Survey (prior to commencement or within the first six months after graduating)

Class Entering % Returned or Received Degree After % Rec'd Deg After
Cohort Retention Rates by Level
1 Yr 2 Yrs 3 Yrs 4 Yrs 5 Yrs 6 Yrs
1987 75% 60% 55% 53% 51% 46%
2001 84% 74% 70% 68% 66% 64%
2002 83% 74% 70% 68% 66%
2003 85% 75% 70% 70%
2004 87% 78% 73%
2006 87% 79%
2007 87%

Direct Mail
Re-designing the bills to be easier to read: use a credit card model and provide on-line access
Re-write Academic Warning Letters Postcards for Families: Important Dates,
Parents’ Association, etc.

Send students information you know they need, but NOT TOO OFTEN
Do not send more than one e-mail every three to four weeks.

Success Chain: Focusing Student Support Programs on
the Students Most Likely to Need Them
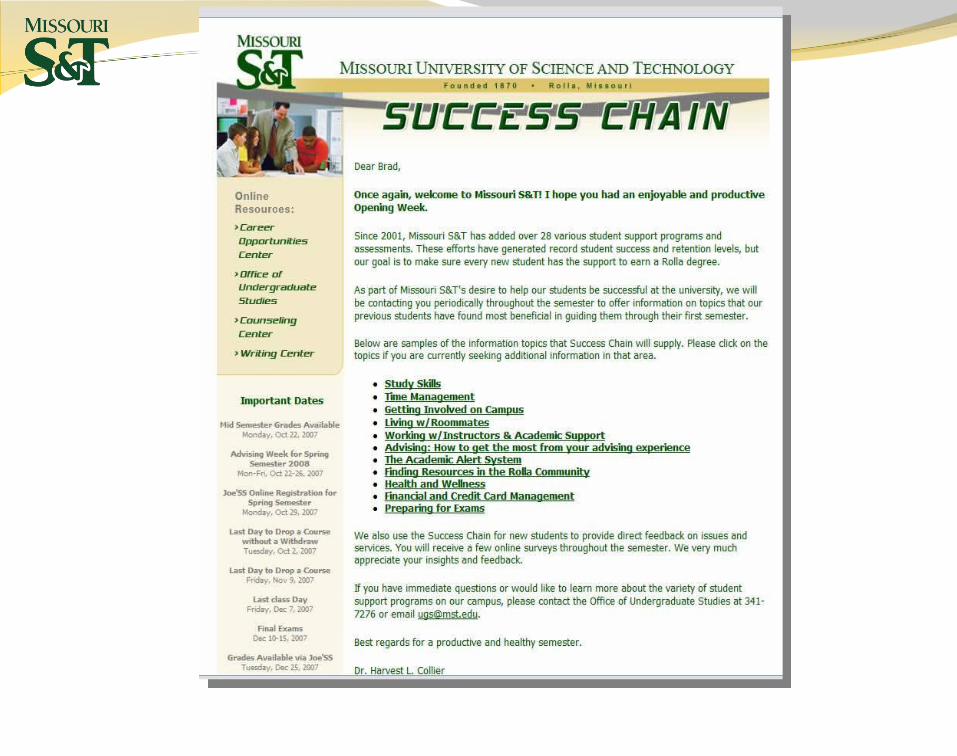

Success Chain Communication Plan

Internet – Homepages – Social Networks
Create a Help Page for Students and Parents Make sure your search engine is geared to
identify key webpages based on the student’s need (i.e. scholarships, financial aid, tutoring, suicide, depression, I need help, etc.)
Make sure that all student service pages include the names and contact info for the staff and faculty!
Social Networks(Facebook, MySpace, Friendster, etc.)
E-Birthday Cards Identify students interests Promote events and services
Phone Calls / Telecounseling
2-6% immediate improvement reported Great data and problem identification tool Relatively low expense
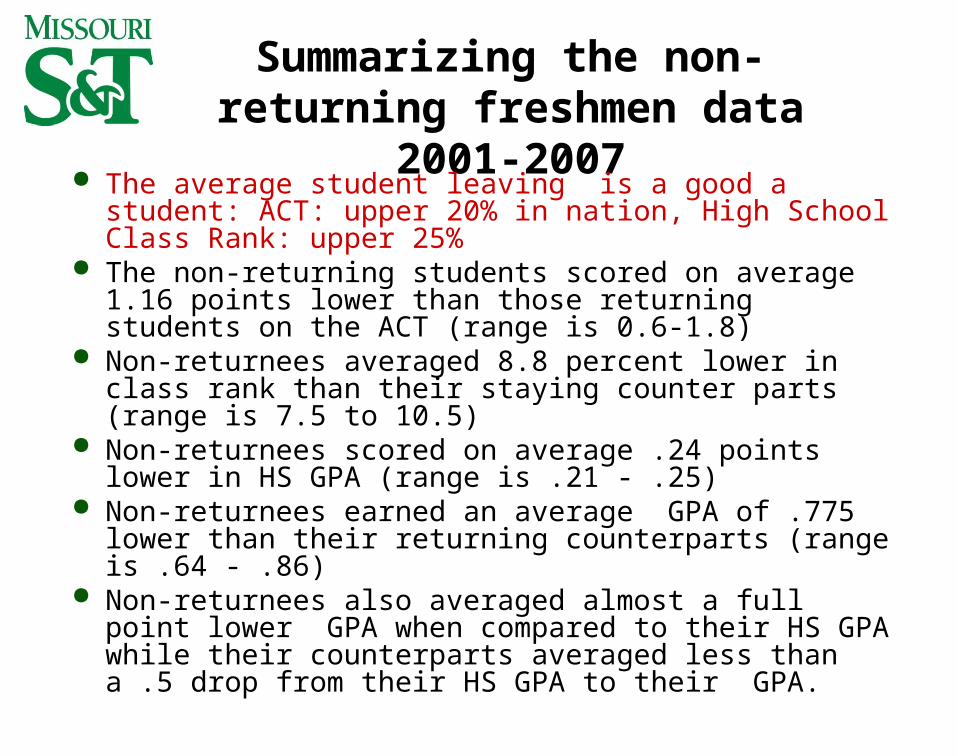
Summarizing the non-returning freshmen data 2001-
2007 The average student leaving is a good a student: ACT:
upper 20% in nation, High School Class Rank: upper 25%
The non-returning students scored on average 1.16 points lower than those returning students on the ACT (range is 0.6-1.8)
Non-returnees averaged 8.8 percent lower in class rank than their staying counter parts (range is 7.5 to 10.5)
Non-returnees scored on average .24 points lower in HS GPA (range is .21 - .25)
Non-returnees earned an average GPA of .775 lower than their returning counterparts (range is .64 - .86)
Non-returnees also averaged almost a full point lower GPA when compared to their HS GPA while their counterparts averaged less than a .5 drop from their HS GPA to their GPA.
Common Themes 2001-2007
Why did you leave?» Changed majors
» Financial / too expensive
» Low Grades
» Rolla is boring / too small

Do you plan to return to S&T?
68% students do not plan to return to S&T 25% plan to return
(“Stop-outs”: this includes students leaving for military service)
7% were not certain of their plans
What would have kept you at S&T?
» “Nothing would have kept me at S&T”
» More money or financial aid
» More majors or non-engineering degrees
» Higher or better grades

Would you recommend S&T to another student?
38% would recommend to another student unconditionally
39% would recommend for engineering/science/math only
4% would recommend with a caveat (it’s not for everyone, if they wanted to go away)
5% said no
Calling Schedule
2-8 weeks prior to start of semester/quarter
Follow-up calling after the official census date

Staff vs. Student Callers
USE STAFF!!! Preferably a staff member with the ability
to re-admit and re-enroll the student

Annual Retention Audit Report
Highlights the results of the Spring 2007 and Fall 2007 Phone Survey
Survey involves Retention of First-Time Full-Time Degree Seeking Freshmen Students

Retention Report Process
1. Registrar: Prepares list of degree-seeking, non-registered FS06 first-time, full-time Freshmen.
2. Develop spreadsheet calling list: Student’s name, email, phone #, hometown, major, S&T GPA
3. Make Telephone calls: Best contact times were from 10 am – 2 pm or 6 to 8 pm
4. Emails: Initially sent to students with incorrect or no phone numbers and students who we could not reach by phone.
5. Follow-up: Follow-up thank you letter sent to contacted students
6. Compile results: Prepared an overview PowerPoint
7. Submit results: PowerPoint was submitted to the Dean of Enrollment Management and Vice Provost of Undergraduate Studies

First-Time Full-Time Degree-Seeking Students
Total Fall 2006 first-time full-time degree-seeking students was 935.
32 (3.4%) did not return for the Spring 2007 term.
67 (7.1%) did not return for the Fall 2007 term.
14 students didn’t return due to academic deficiency
5 students withdrew during the Spring 2007 semester
4 students were enrolled at time of calling but were cancelled due to non-payment
2 students were going on a 2-year mission trip and then returning to S&T. For purposes of this survey, they were not counted as non-returning.
1 student was deceased – New cohort data is 934
First Year Retention Rate: 87%
1 of the 32 students re-enrolled for Fall 2007

Freshmen Retention After One and Six years
Status in Fall Semester After One Year
92 93 94 95 96 97 98 99 00 01 02 03 04 05 06
Stayed 80 78 78 80 79 83 84 83 83 84 83 85 87 87 87
Left 20 22 22 20 21 17 16 17 17 16 17 15 13 13 13
Numbers are all in percentages. Due to rounding, percents may not sum to 100%
• Status in Fall Semester After Six Years
92 93 94 95 96 97 98 99 00
Degree 55 55 52 57 55 60 63 64 63
Still here 5 4 5 4 4 3 3 4 4
Left 41 41 43 39 41 38 34 32 33

Full-time, Degree Seeking Freshmen
Retention after One and Six years92 93 94 95 96 97 98 99 00 01 02 03 04
Status in Fall Semester After One Year
Stayed (%) 80 78 78 80 79 83 84 83 83 84 83 85 87
Left (%) 20 22 22 20 21 17 16 17 17 16 17 15 13
Status in Fall Semester After Six Years
Degree (%) 55 55 52 57 55 60 63 64
Still here (%) 5 4 5 4 4 3 3 4
Left (%) 41 41 43 39 41 38 34 32

Statistics ComparisonFirst-time freshmen class (full-time, degree seeking)
FS97 FS98 FS99 FS00 FS01 FS02 FS03 FS04 FS05 FS06
Count 693 721 680 674 693 788 871 839 879 935
HS GPA Not tracked
Not tracked 3.52 3.53 3.46 3.48 3.55 3.59 3.58 3.62
% Rank 84.6 84.5 83.6 83.4 80.5 80.3 80.8 80.9 80.5 79.9
ACT 28.2 28.0 27.7 27.3 26.8 27.3 27.2 27.1 27.1 27.1
MST GPA 2.88 2.87 2.88 2.90 2.91 3.03 2.90 3.03 2.94 3.00
NOTE: Fewer high schools are providing class rankings. % Rank reflects the class rank % of students from high schools providing a class rank.
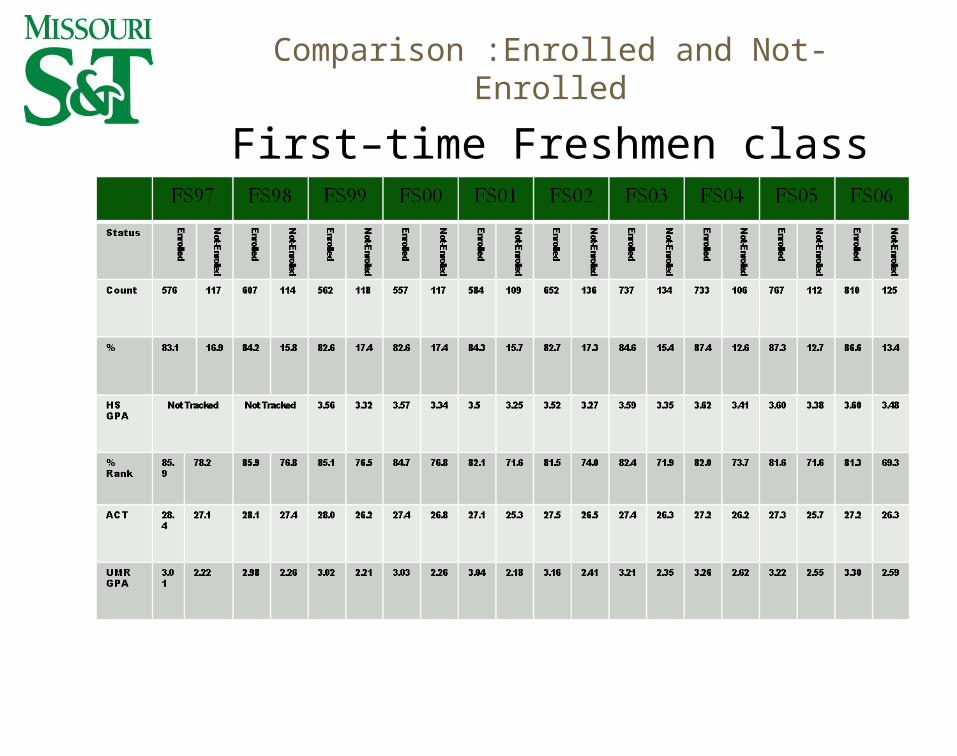
Comparison :Enrolled and Not-Enrolled
First–time Freshmen class (Full-time, Degree seeking)

First-Time Full-Time Degree-Seeking Students
That 103 comes from:» 32 that did not return for the Spring 2007 term (less 1 returning
student).» 67 that did not return for the Fall 2007 term.» 5 that withdrew during the Spring 2007 semester
Data points examined on 103 students:» Geographic Origin» Initial Major» Gender» Ethnicity» Cumulative GPA» Composite ACT» Financial Aid information

Geographic Origin First-Time Full-Time Degree-Seeking Students
Missouri
741 (79.4%)
Non-Missouri
185 (19.8%)
International
8 (0.9%)
All Fall 2006 (934) Non-Returning (103)
• Missouri76 (73.8%)
• Non-Missouri26 (25.2%)
• International1 (0.1%)
Note: Due to rounding, percentages may not total 100%.

Geographic OriginMissouri Counties
First-Time Full-Time Degree-Seeking Students
SAINT LOUIS 18 23.7% PHELPS 8 10.5% SAINT CHARLES 7 9.2% PLATTE 6 7.9% JACKSON 5 6.6% COLE 4 5.3% JEFFERSON 4 5.3% MARIES 4 5.3% PULASKI 4 5.3% SAINT LOUIS CITY 3 3.9% GREENE 2 2.6% HOWELL 2 2.6% CASS 1 1.3% CLAY 1 1.3% FRANKLIN 1 1.3% LINCOLN 1 1.3% MORGAN 1 1.3% OSAGE 1 1.3% SHELBY 1 1.3% TEXAS 1 1.3% WASHINGTON 1 1.3%
All Fall 2006 (741) Non-Returning (76)
Note: Due to rounding, percentages may not total 100%.
• SAINT LOUIS 19225.9%
• SAINT CHARLES 7510.1%
• JACKSON 516.9%
• PHELPS 425.7%
• JEFFERSON 304.0%
• CLAY 233.1%
• GREENE 223.0%
• SAINT LOUIS CITY 212.8%
• PLATTE 192.6%
• PULASKI 192.6%
• FRANKLIN 172.3%
• COLE 152.0%
• BOONE 141.9%
• CASS 111.5%
• LINCOLN 101.3%
• SAINT FRANCOIS 101.3%
• CAPE GIRARDEAU 91.2%
• CAMDEN 81.1%
• Students in Counties with 6 or fewer153
20.6%

Initial Major First-Time Full-Time Degree-Seeking Students
FR-MC ENG 146 15.6% FR-AE ENG 93 9.9% FR-CH ENG 91 9.7% FR-EL ENG 73 7.8% FR-CP ENG 67 7.2% FR-UN-ENG 65 7.0% FR-CV ENG 61 6.5% FR-ARC-ENG 60 6.4% CMP SC-BS 58 6.2% FR-NU ENG 29 3.1% BIO SC-BS 22 2.4% BUS&MS-BS 19 2.0% FR-MI ENG 18 1.9% CHEM-BS 16 1.7% FR-MT ENG 15 1.6% PHYSIC-BS 14 1.5% FR-ENG MG 13 1.4%
All Fall 2006 (934) Non-Returning (103)
Note: Due to rounding, percentages may not total 100%.
• AP MATH-BS 111.2%
• FR-PE ENG 101.1%
• PSYCH-BS 70.7%
• FR-CR ENG 60.6%
• HIST-BA 60.6%
• FR-GE ENG 50.5%
• FR-ID ENG 50.5%
• BIO SC-BA 40.4%
• GL&GPH-BS 40.4%
• IST-BS 40.4%
• ENGL-BA 30.3%
• FR-EV ENG 20.2%
• PSYCH-BA 20.2%
• UN-A&S-UN 20.2%
• CH ENG-BS 10.1%
• MT ENG-BS 10.1%
• UN-M&IS-UN 10.1%
• FR-MC ENG 19 18.4%• CMP SC-BS 10 9.7%• FR-AE ENG 10 9.7%• FR-CP ENG 9 8.7%• FR-EL ENG 6 5.8%• BUS&MS-BS 5 4.9%• FR-CV ENG 5 4.9%• CHEM-BS 4 3.9%• FR-ARC-ENG 4 3.9%• FR-NU ENG 4 3.9%• FR-UN-ENG 4 3.9%• FR-CH ENG 3 2.9%• FR-ENG MG 3 2.9%• AP MATH-BS 2 1.9%• BIO SC-BA 2 1.9%• BIO SC-BS 2 1.9%• FR-MI ENG 2 1.9%• FR-PE ENG 2 1.9%• PHYSIC-BS 2 1.9%• UN-A&S-UN 2 1.9%• FR-EV ENG 1 1.0%• FR-MT ENG 1 1.0%• GL&GPH-BS 1 1.0%
• Engineering 76181.5%
• Non-Engineering 17318.5%
• Engineering 7370.9%
• Non-Engineering 3029.1%

Gender First-Time Full-Time Degree-Seeking Students
Male
718 (76.9%)
Female
216 (23.1%)
All Fall 2006 (934) Non-Returning (103)
• Male87 (84.5%)
• Female16 (15.5%)
Note: Due to rounding, percentages may not total 100%.
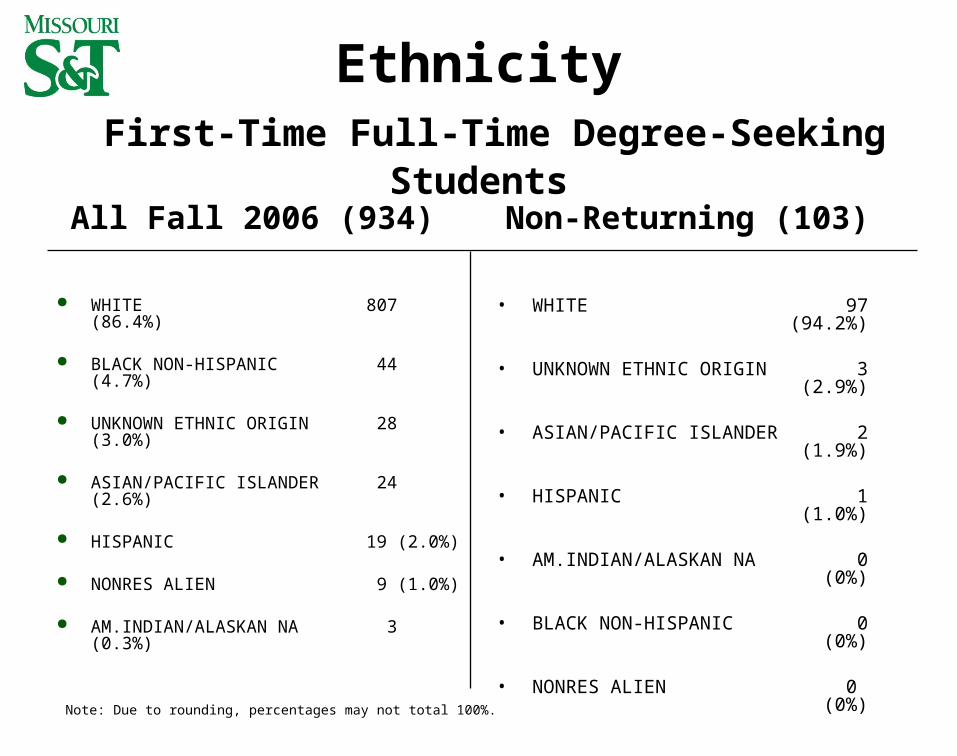
Ethnicity First-Time Full-Time Degree-Seeking Students
WHITE 807 (86.4%)
BLACK NON-HISPANIC 44 (4.7%)
UNKNOWN ETHNIC ORIGIN 28 (3.0%)
ASIAN/PACIFIC ISLANDER 24 (2.6%)
HISPANIC 19 (2.0%)
NONRES ALIEN 9 (1.0%)
AM.INDIAN/ALASKAN NA 3 (0.3%)
All Fall 2006 (934) Non-Returning (103)
Note: Due to rounding, percentages may not total 100%.
• WHITE 97(94.2%)
• UNKNOWN ETHNIC ORIGIN 3(2.9%)
• ASIAN/PACIFIC ISLANDER 2(1.9%)
• HISPANIC 1(1.0%)
• AM.INDIAN/ALASKAN NA 0 (0%)
• BLACK NON-HISPANIC 0(0%)
• NONRES ALIEN 0 (0%)

Cumulative GPA First-Time Full-Time Degree-Seeking Students
4.000 – 3.500 343 (36.7%)
3.490 – 3.000 279 (29.9%)
2.900 – 2.500 150 (16.0%)
2.490 – 2.000 85 (9.1%)
1.900 – 0.000 73 (7.8%)
N/A* 4 (0.4%)*Withdrew before completing the Fall 2006 term.
All Fall 2006 (934) Non-Returning (103)
Note: Due to rounding, percentages may not total 100%.
• 4.000 – 3.500 16 (15.6%)
• 3.490 – 3.000 24 (23.3%)
• 2.900 – 2.500 21 (20.4%)
• 2.490 – 2.000 17 (16.5%)
• 1.900 – 0.000 21 (20.4%)
• N/A* 4 (3.8%)
*Withdrew before completing the Fall 2006 term.
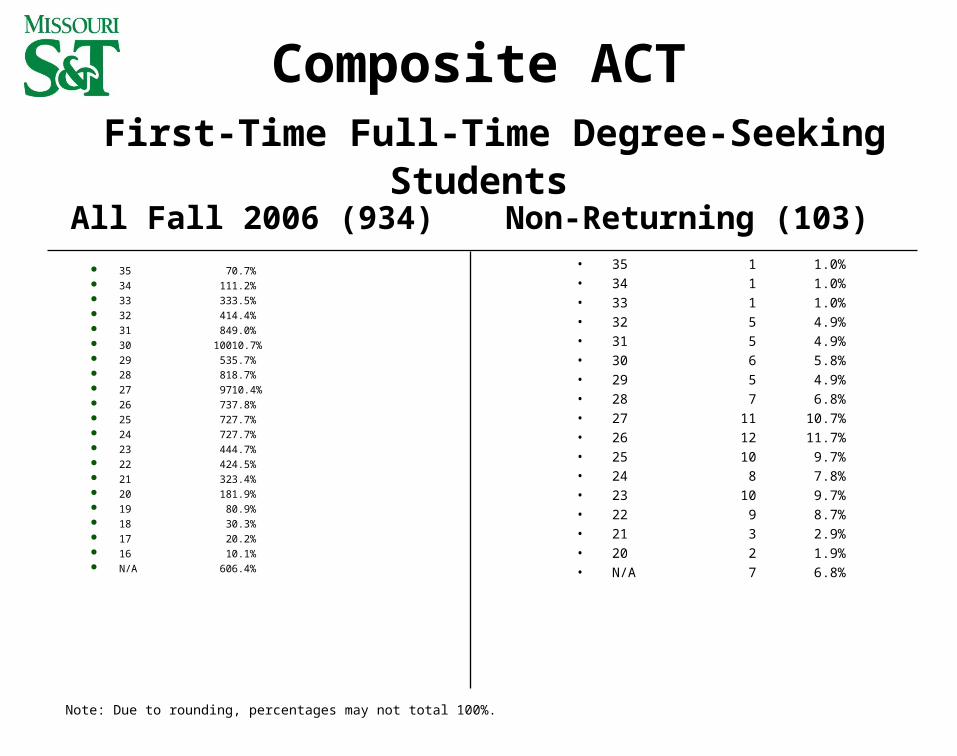
Composite ACT First-Time Full-Time Degree-Seeking Students
35 7 0.7% 34 11 1.2% 33 33 3.5% 32 41 4.4% 31 84 9.0% 30 100 10.7% 29 53 5.7% 28 81 8.7% 27 97 10.4% 26 73 7.8% 25 72 7.7% 24 72 7.7% 23 44 4.7% 22 42 4.5% 21 32 3.4% 20 18 1.9% 19 8 0.9% 18 3 0.3% 17 2 0.2% 16 1 0.1% N/A 60 6.4%
All Fall 2006 (934) Non-Returning (103)
Note: Due to rounding, percentages may not total 100%.
• 35 1 1.0%• 34 1 1.0%• 33 1 1.0%• 32 5 4.9%• 31 5 4.9%• 30 6 5.8%• 29 5 4.9%• 28 7 6.8%• 27 11 10.7%• 26 12 11.7%• 25 10 9.7%• 24 8 7.8%• 23 10 9.7%• 22 9 8.7%• 21 3 2.9%• 20 2 1.9%• N/A 7 6.8%

Financial Aid Information First-Time Full-Time Degree-Seeking Students
Non-Returning Students (103)
Yes 83 80.6% No 20 19.4%
2006/2007 FAFSA Eligible for a Pell Grant
• No 80 77.7%• Yes 18 17.5%• N/A 5 4.8%
Note: Due to rounding, percentages may not total 100%.

Financial Aid Information First-Time Full-Time Degree-Seeking Students
Non-Returning Students (103)
99999 76265 65040 62519 59737 49402 45717 45457 45052 40070 38985 37201 36314 34946 34230 33654 32439
Student’s Expected Family Contribution
20 students were N/A
• 31431• 28932• 27366• 26441• 24900• 24111• 22558• 22257• 22000• 21215• 21098• 19691• 17905• 17497• 17117• 16998• 16943
• 16663• 15958• 15090• 15053• 14567• 14510• 13957• 13859• 13366• 13330• 13230• 12692• 12642• 11692• 11567• 11220• 10917
• 10577• 9380• 8925• 8077• 7425• 6923• 6517• 6474• 6179• 6050• 5777• 5758• 4949• 4764• 3540• 3514
• 3424• 3191• 2290• 2218• 2171• 1468• 1236• 902• 676• 645• 245• 193• 5• 0• 0• 0

Questions for Phone Survey Introduction - Hello. This is (state your full name) from the University of Missouri – Rolla. May I please speak with (student’s first name). Establish Rapport and Authenticity, Verify Student’s major, city, high school Purpose of Call - Hi (student’s first name). The purpose for my call is let you know that our records indicate that you have not registered to take
classes in the (fall or spring semester. I wanted to know if there is anything I can do to assist you with registering for classes.
IF THE STUDENT IS PLANNING TO RE-ENROLL, REMIND THEM OF THE ONLINE PROCESS USING Joe’SS and PROVIDE THEM WITH A CONTACT PERSON IN THE REGISTRARS OFFICE, ALONG WITH THE PHONE NUMBER, IF THEY NEED ADDITION ASSISTANCE. CLOSE BY TELLING THE STUDENT WE LOOK FORWARD TO SEEING THEM IN AUGUST AND THAT CLASSES BEGIN ON MONDAY, AUGUST 20.
Follow-up with a thank you email, key dates and contacts.
IF THE STUDENT IS NOT RE-ENROLLING ASK THE FOLLOWING QUESTIONS AS RELEVANT:1. Are you enrolling at another school?2. Which school?3. What are you studying?4. Is this a change from what you had planned to study? (if it is an area offered at S&T: Were you aware that S&T offers that major?5. What student activities did you actively participate in?6. What would you say was the most important reason that you decided not to return to S&T?If the student had problems, and the response reflects a S&T-based problem or set of problems:
7. Did you talk to the person/office you had trouble with to try to correct this problem?8. Did you talk to anyone else to try to correct the problem?9. What would you tell us that needs to be improved?10. What would have kept you at S&T?
If the response reflects mostly problems on the student’s part vs. S&T’s:11. Did you speak with anyone to try to correct the problem?12. Was there something else that we could have done to help you that wasn’t done?
13. Do you plan to return to S&T? When? Is there someone here that you would like to call you concerning your returning?14. Would you recommend S&T to another student? Why or why not?15. Had you visited the campus before enrolling at S&T?16. How many weekends per month did you spend at home? (What activities did you engage in when you did stay on campus?) (omit for Rolla residents)17. When you initially enrolled, did you intend to graduate from S&T or transfer classes to another institution? (if graduate from S&T, ask why the change)
Gather as much relevant information as the student wants to share. Follow up with thank you letter.

Questions for Email Survey Students that weren’t able to be reached by phone were emailed.
Hello, (student name). My name is (your full name) and I work in the (office) Office at S&T. I also called and left a message a little while back. The reason that I’m calling/e-mailing is that we noticed that you were registered last semester but aren’t registered for this coming fall semester. Were you planning on returning to S&T? If you are, I’d be glad to help you get registered. Just let me know what I can do. A quick reminder, the last day to register is August 16th and classes begin on August 20th.
If you’re not returning, that’s okay, we understand, but we would really appreciate it if you could give us some feedback on what made you decide to leave and what we can do better in the future. I’ve included some questions below and if you could please let me know your response, I would greatly appreciate it. If you’d like to discuss this over the phone, either let me know a number and a good time to call or you can call me at my direct number, 573-341-XXXX, or you can call our toll-free number and just ask to be transferred to me. Our toll-free number is 1-800-522-0938. If it’s after business hours, you can call the (office) main number, 573-341-XXXX, and leave a message. I look forward to hearing from you!
Here are the survey questions that I had:Are you enrolling at another school?
If so, which school?What are you studying?Is this a change from what you had planned to study?What student activities did you actively participate in?What would you say was the most important reason that you decided not to return to S&T?What would you tell us that needs to be improved?What would have kept you at S&T?Was there something that we could have done to help you that wasn’t done?Did you have any problems with any particular department or office on campus? If so, did you talk to them or someone about it?Do you plan to return to in the future S&T? Would you recommend S&T to another student? Why or why not?Had you visited the campus before enrolling at S&T?About how many weekends per month did you spend at home?What activities did you engage in when you did stay on campus?When you initially enrolled, did you intend to graduate from S&T or transfer classes to another institution?
Again, I thank you very much for taking the time to answer these questions and we wish you all the best in your future endeavors.
Sincerely,(your name)

38 freshmen were contacted» 6 of the 38 enrolled at S&T after Jan. 10
32 of the 934 (3.4%) freshmen students enrolled in FS2006 did not return for SP2007» 1 of the 32 students re-enrolled for Fall 2007
20 of the 32 (62.5%) students completed the phone survey» 5 of the 20 did not enroll at a college/university for SP2007» 9 of the 20 transferred to another college/university
Target Population Spring 2007 Retention Report
NOTE: Hard to get an answer due to caller ID; afraid it’s a bill collector.
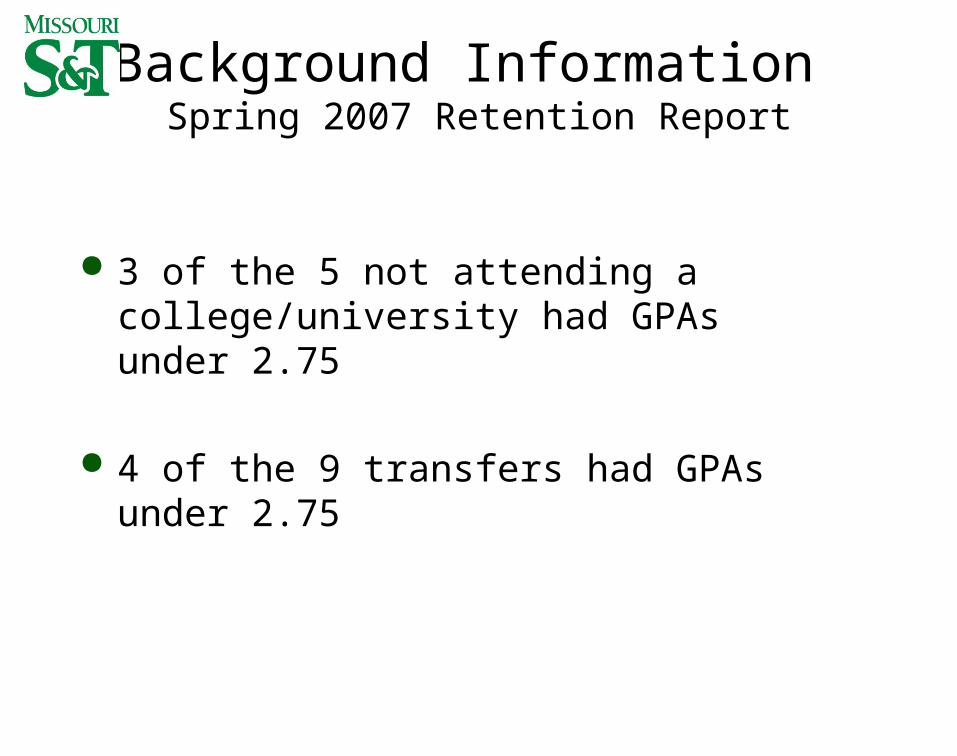
3 of the 5 not attending a college/university had GPAs under 2.75
4 of the 9 transfers had GPAs under 2.75
Background Information Spring 2007 Retention Report
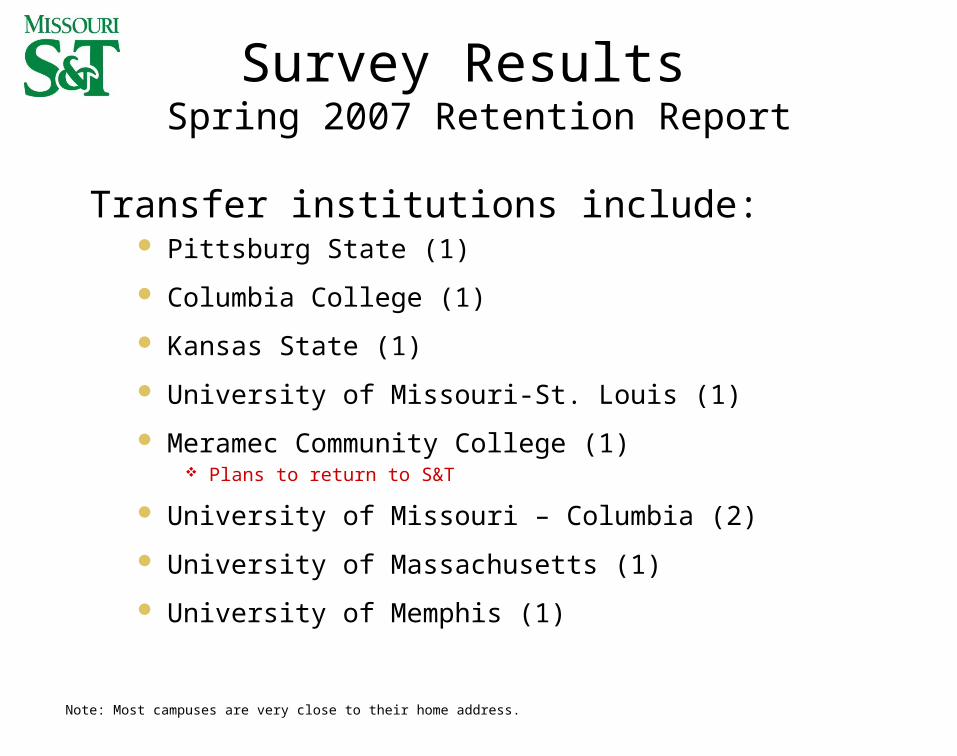
Transfer institutions include: Pittsburg State (1)
Columbia College (1)
Kansas State (1)
University of Missouri-St. Louis (1)
Meramec Community College (1) Plans to return to S&T
University of Missouri – Columbia (2)
University of Massachusetts (1)
University of Memphis (1)
Survey Results Spring 2007 Retention Report
Note: Most campuses are very close to their home address.
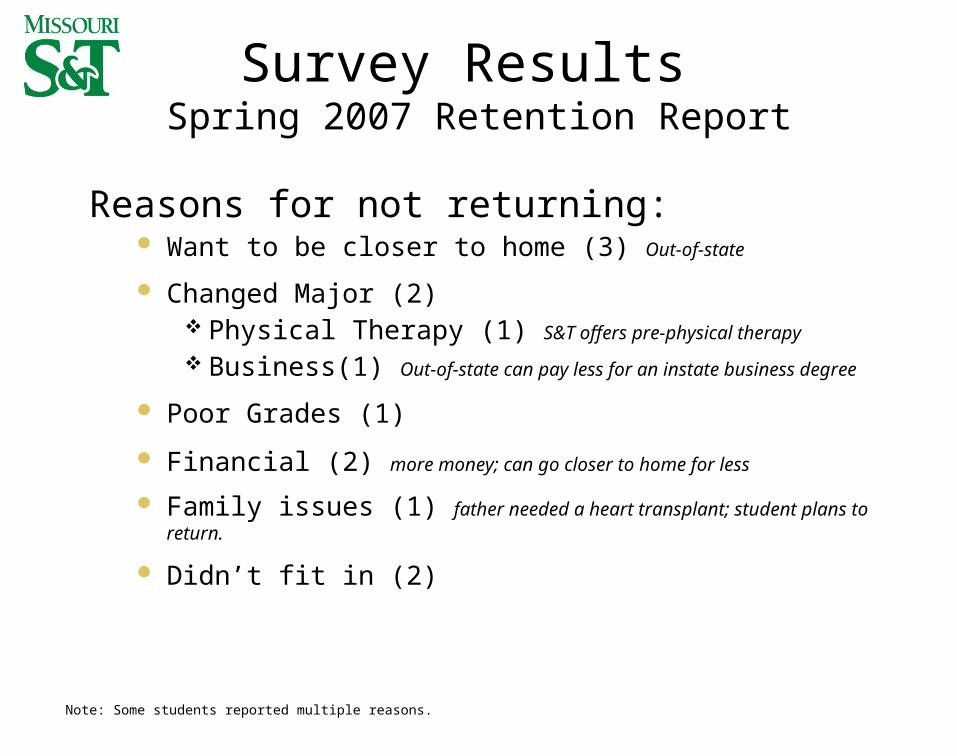
Reasons for not returning: Want to be closer to home (3) Out-of-state
Changed Major (2) Physical Therapy (1) S&T offers pre-physical therapy
Business(1) Out-of-state can pay less for an instate business degree
Poor Grades (1)
Financial (2) more money; can go closer to home for less
Family issues (1) father needed a heart transplant; student plans to return.
Didn’t fit in (2)
Survey Results Spring 2007 Retention Report
Note: Some students reported multiple reasons.

What would have kept you at S&T? More money (1)
I don’t know (3)
Nothing (2)
Not changing my major (2)
Better grades (1)
Survey Results Spring 2007 Retention Report
Note: Some students reported multiple reasons.

Additional Comments: I would recommend S&T to other students (8)
Rolla is too small (2)
I wanted to be close to home (3)
Nothing to do on weekends (1) Student was not involved in on-campus activities
S&T is great for Engineering (1)
Survey Results Spring 2007 Retention Report
Note: Some students reported multiple reasons.

77 freshmen were contacted» 8 of the 77 enrolled at S&T after July 17th
» 13 of the 77 students were enrolled but cancelled between July 16th and August 17th
67 of the 934 (7.1%) freshmen students enrolled in FS2006 did not return for FS2007» 2 of the 77 students were going on a 2-year mission trip and then
returning to S&T. For purposes of this survey, they were not counted as non-returning.
37 of the 77 (48.1%) students participated in the phone survey» 35 of the 37 transferred to another college/university in FS2007» 1 will be transferring in 2008
Target Population Fall 2007 Retention Report

Transfer institutions include:
University of Missouri – Columbia (8)
Missouri State University (6)
Saint Louis University (2)
University of Colorado (2)
University of Wyoming (2)
Driscoll in Philadelphia (1)
Augsburg College, MN (1)
California Community College (1)
Longview Community College (1)
Jefferson College (1)
Survey Results Fall 2007 Retention Report
Note: Most campuses are close to their home address.
Maple Woods Community College (1) Metropolitan Community College, Kansas
City (1) Northwest Missouri State (1) Southern Illinois Univ - Edwardsville (1) St. Louis Comm College - Meramec (1) Truman State University (1) University of Central Missouri (1) University of Kentucky (1) University of Texas at Austin (1) Webster University (1)

Reasons for Not Returning: Changed major (15) Cost/Financial (12) [6 were out-of-state, 5 transferred to community college] Bad & overpriced dorm food (6) Too small of a town/Nothing to do (5) Just not the right fit (5) Felt university was too focused on Engineering/Not enough different liberal arts
programs/classes (4) Advisor/Instructor not helpful enough (3) Too hard/Grades lower than expected (3) Wanted to get away from home [St. James, Rolla] (2) Wanted to move closer to home (2) Issue with department chair, not happy with how labs were designed and
implemented (1) Personal Reasons (1)
Survey Results Fall 2007 Retention Report
Note: Some students reported multiple reasons.

Reasons for Not Returning – Changed Major
Architecture
Biology
Biology/Psychology/Physical Therapy
Business Administration
Business Law
Chemistry/Pharmacy
Creative Writing
Survey Results Fall 2007 Retention Report
Note: Some students reported multiple reasons.
Elementary Education
English
Political Science (2)
Pre-Med with emphasis in Biology (2)
Secondary Education
Speech Pathology

What would have kept you at S&T? Nothing (7)
Money – cheaper, more scholarships, especially for out-of-state (6)
More girls, more diverse student body (3)
Larger town (2)
More options for Res Life and meal plans (2) – allow to move off campus after 1 year
Student/Faculty interest and enthusiasm for subjects other than Engineering (1)
More liberal arts activities (1)
Survey Results Fall 2007 Retention Report
Note: Some students reported multiple reasons.
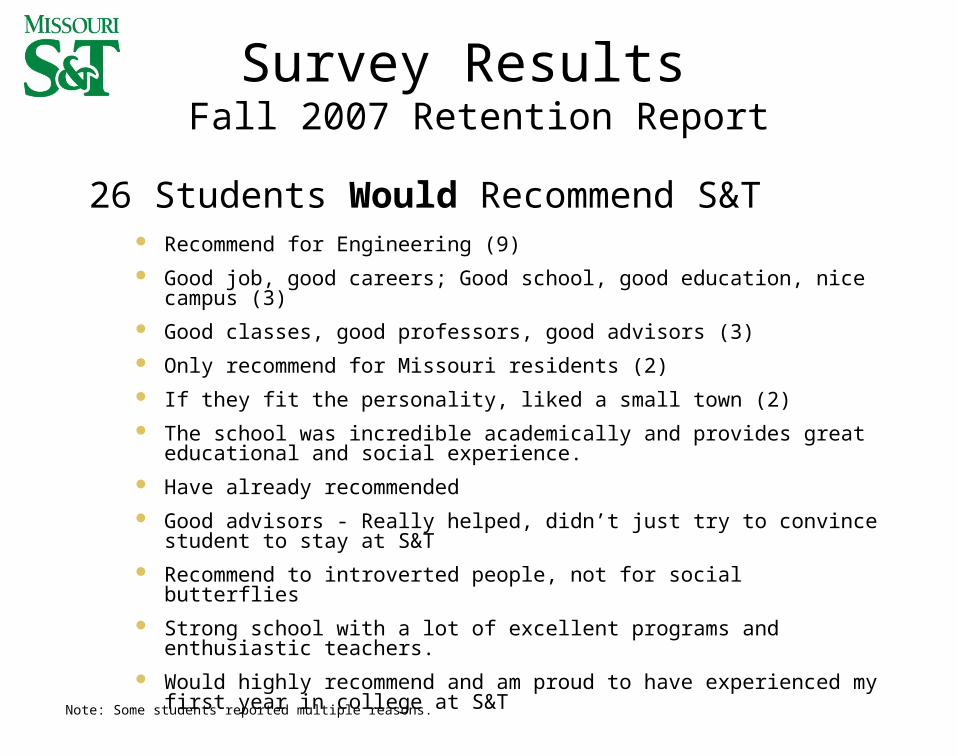
26 Students Would Recommend S&T Recommend for Engineering (9)
Good job, good careers; Good school, good education, nice campus (3)
Good classes, good professors, good advisors (3)
Only recommend for Missouri residents (2)
If they fit the personality, liked a small town (2)
The school was incredible academically and provides great educational and social experience.
Have already recommended
Good advisors - Really helped, didn’t just try to convince student to stay at S&T
Recommend to introverted people, not for social butterflies
Strong school with a lot of excellent programs and enthusiastic teachers.
Would highly recommend and am proud to have experienced my first year in college at S&T
Survey Results Fall 2007 Retention Report
Note: Some students reported multiple reasons.

Additional Student Comments: Some of the instructors were hard to understand (2)
Diversify from Engineering
Need a better variety of non-engineering classes
Need classes that help determine what to major in
Liked the name S&T better than Missouri S&T
Curriculum felt difficult & fast paced» Comp Sci Lead Session was good» Math Lead Session talked over the students
Survey Results Fall 2007 Retention Report
Note: Some students reported multiple comments.
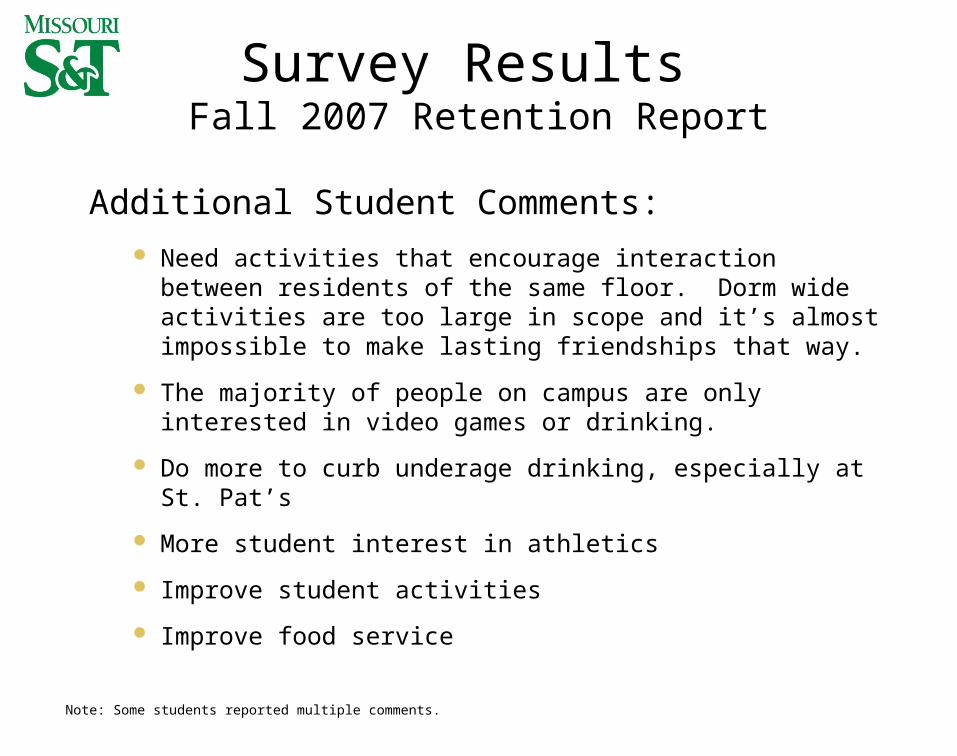
Additional Student Comments: Need activities that encourage interaction between residents
of the same floor. Dorm wide activities are too large in scope and it’s almost impossible to make lasting friendships that way.
The majority of people on campus are only interested in video games or drinking.
Do more to curb underage drinking, especially at St. Pat’s
More student interest in athletics
Improve student activities
Improve food service
Survey Results Fall 2007 Retention Report
Note: Some students reported multiple comments.

Summary of Other Survey Questions: Most students (25) did participate in some type of student
activities
Several students (11) said they would possibly return either to finish studies or for graduate studies
Majority of the students (27) did visit the campus before enrolling. Most found it to be very useful.
» Convinced one student that S&T was better than Colorado School of Mines
» Nice looking campus, grounds kept well.
» Tour didn’t go to the quad
» Didn’t feel it was representative of the campus
Survey Results Fall 2007 Retention Report
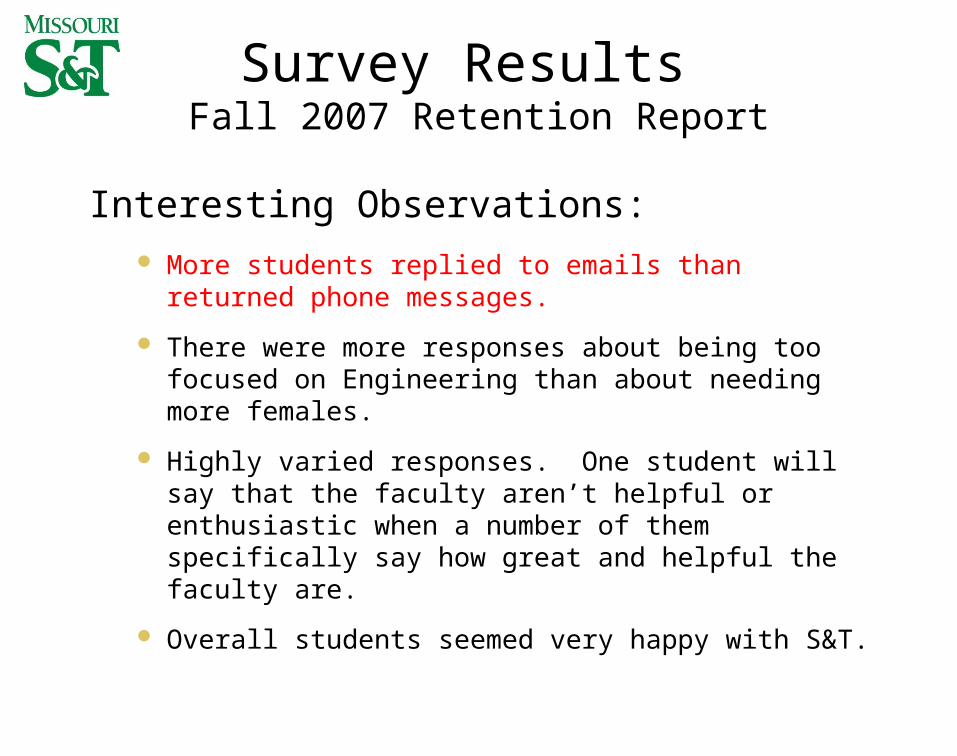
Interesting Observations: More students replied to emails than returned phone
messages.
There were more responses about being too focused on Engineering than about needing more females.
Highly varied responses. One student will say that the faculty aren’t helpful or enthusiastic when a number of them specifically say how great and helpful the faculty are.
Overall students seemed very happy with S&T.
Survey Results Fall 2007 Retention Report

QUESTIONS?
Contact Information
Jay W. GoffDean of Enrollment Management
Missouri University of Science & Technology207 Parker Hall
Rolla, MO, 65409, USAwww.enrollment.mst.edu