a curved ray camera for handling occlusions through ... curved ray camera for handling occlusions...
TRANSCRIPT

A Curved Ray Camera for Handling Occlusions through Continuous Multiperspective Visualization
Jian Cui, Paul Rosen, Voicu Popescu, Christoph Hoffmann
Abstract—Most images used in visualization are computed with the planar pinhole camera. This classic camera model has important advantages such as simplicity, which enables efficient software and hardware implementations, and similarity to the human eye, which yields images familiar to the user. However, the planar pinhole camera has only a single viewpoint, which limits images to parts of the scene to which there is direct line of sight. In this paper we introduce the curved ray camera to address the single viewpoint limitation. Rays are C1-continuous curves that bend to circumvent occluders. Our camera is designed to provide a fast 3-D point projection operation, which enables interactive visualization. The camera supports both 3-D surface and volume datasets. The camera is a powerful tool that enables seamless integration of multiple perspectives for overcoming occlusions in visualization while minimizing distortions.
Index Terms—Alleviating occlusions, camera model, curved rays, multiperspective visualization, interactive visualization.
1 INTRODUCTION Almost all images used in visualization are computed with a planar pinhole camera (PPC). One reason for this is that the PPC models the human eye well, producing images that resemble what users would see if they were actually looking at the dataset to be visualized.
Another reason is simplicity: software and hardware implementations of PPC rendering algorithms allow visualizing complex 3-D datasets at interactive rates. However, the simplicity of the PPC model also brings three important limitations. First, the PPC has a limited field of view. Second, the sampling rate of the PPC is uniform over its entire field of view. Third, the PPC has only a single viewpoint, i.e. the pinhole where all rays converge.
In this paper we address the single viewpoint limitation. The PPC can only sample data to which there is direct line of sight from the pinhole. In the context of complex 3-D datasets, occlusions hide regions of interest and reduce the visualization payload of PPC images. The problem of occlusions has been addressed in visualization using a variety of approaches. One approach is to render the occluding layers transparently, or to cut a hole into the
Figure 1. Top: conventional planar pinhole camera (PPC) street-level visualization (left), and curved ray camera (CRC) visualizations showing the left and right side streets (middle and right). Middle row, left: DNA molecule with target atom shown with wireframe bounding box occluded in PPC view (left) and disoccluded in CRC view (right). Middle row, right: block engine dataset volume rendered with a PPC (left) and CRCs with rays of increasing curvature (middle and right). Bottom: canyon terrain dataset visualized with a PPC (left) and with CRCs that preview an increasing section of the river bed ahead (middle and right).
• Jian Cui, Voicu Popescu, and Christoph Hoffmann are with the
Computer Science Department of Purdue University, E-Mail: {cui9, popescu, cmh}@purdue.edu.
• Paul Rosen is with the Scientific Computing and Imaging Institute at the University of Utah, E-Mail: [email protected].
Manuscript received 31 March 2010; accepted 1 August 2010; posted online 24 October 2010; mailed on 16 October 2010. For information on obtaining reprints of this article, please send email to: [email protected].

occluding layers to reveal the hidden data subset. Such transparency and cutaway techniques work well when the number of occluding layers is small and when a summary representation of these layers is acceptable. A second approach is to distort the 3-D dataset such that the alignment between the viewpoint, the occluder, and the data subset of interest is broken. The approach has the advantage of a clear and complete visualization, but specifying a dataset distortion that achieves the desired disocclusion effect while minimizing the visualization distortion is challenging.
Another approach is to simply rely on the user to navigate the camera around occluders interactively in order to establish a direct line of sight to data subsets of potential interest. Such sequential visualization can be inefficient. When the disoccluded data subset turns out to be of no interest, the camera path has to be retraced which is wasteful and can confuse the user. The single viewpoint limitation has also been addressed by using several PPC images simultaneously. However, the approach suffers from visualization discontinuity between individual images. The user cannot monitor all images in parallel and has to spend considerable cognitive effort to adapt sequentially to each one of the many visualization contexts.
Multiperspective visualization is a promising approach based on integrating data sampled from multiple viewpoints into a single image. The multiple viewpoints are integrated tightly which alleviates the visualization discontinuity problem of multiple individual images. Like in the case of the dataset distortion approach, multiperspective visualization amounts to a warp of global spatial relationships between data subsets. However, multiperspective visualization allows specifying the desired disocclusion effect directly in the image, as opposed to indirectly, through a dataset distortion. Finally, multiperspective visualization does not preclude but rather enhances interactive exploration of datasets. The multiperspective image provides a preview of data subsets to come which improves interactive visualization efficiency.
Multiperspective visualization has challenges of its own. The multiperspective image is computed using a non-pinhole camera model that does not project 3-D lines to image plane lines, so one challenge is achieving the desired disocclusion effect while minimizing visualization distortions. The non-pinhole camera model is considerably more complex than the PPC model, so a second challenge is to achieve adequate rendering performance to support interactive visualization and dynamic datasets. Eliminating the single viewpoint constraint of the PPC model results in a multidimensional camera model design space. Whereas for the PPC model the only intrinsic parameter of significant relevance in shaping the visualization is the focal length, optimizing multiperspective visualization requires tuning a large number of parameters. Consequently a third challenge is to specify the camera model that best visualizes a given dataset from a given location.
We introduce a novel multiperspective visualization technique based on the curved ray camera (CRC). The CRC is designed to address the challenges of multiperspective visualization described above. The CRC integrates multiple viewpoints seamlessly. The curved rays allow for a progressive transition between one viewpoint and the next. A CRC ray is a sequence of line segments connected by
conic curve segments. Each conic connects consecutive line segments with C1 continuity, which alleviates visualization distortions. The CRC provides a fast projection operation which allows rendering 3-D surface datasets efficiently by projection followed by rasterization, with the help of graphics hardware. The rays of the CRC can be traced inexpensively which enables visualization techniques that require ray casting, such as volume rendering. We have developed several CRC constructors. An interactive constructor allows the user to set the viewpoints integrated by the CRC through a graphical user interface. A second constructor builds a CRC that disoccludes a user-specified target as the view changes or as the target moves. A third constructor builds a CRC that follows a predefined path through a 3-D dataset and provides a preview of the path ahead; how much of the path ahead is visualized is under user control.
Figure 1 illustrates the use of the CRC to alleviate occlusions in visualization (also refer to the accompanying video). In the top row, a CRC is used to preview the two side streets without advancing the camera (middle and right images). The CRC samples the main street up to the intersection and then switches to a second viewpoint to sample the side streets. The CRC rays for the right image are shown in Figure 2. Each ray consists of a first line segment, a conic curve segment, and then a second line segment (see purple lines). The first line segments converge at the first viewpoint, sampling the main street, and the second line segments converge at the second viewpoint, sampling the right side street. The conic curves implement the viewpoint change over a transition region. In Figure 3 the car is located in the transition region. The car intersects a relatively small piece of the curved rays, a small piece of the ray is approximately straight, and distortions are minimized (left). Without the transition region, switching directly from the first to the second line segment (i.e. piecewise linear rays with only C0 continuity), a disturbing distortion of the car occurs (right).
The second row of Figure 1 illustrates CRC target tracking (left) and CRC volume rendering (right). Target tracking is illustrated in the context of the visualization of a DNA molecule. The user selects an atom as the target and, as the view translates, the algorithm attempts to avoid the occlusion of the target by modifying the parameters of the CRC dynamically. The third row illustrates CRC path previewing in the context of the visualization of a canyon terrain dataset. The path was chosen to correspond to the river. The CRC effectively linearizes a section of the river. The length of the linearized section is controlled with a user parameter. Evenly-spaced colored markers were added along the path in order to illustrate the path preview effect and to facilitate comparing the images.
2 PRIOR WORK We organize the review of prior work according to the main approaches developed for addressing the problem of occlusions. For additional details we refer the reader to a comprehensive taxonomy of over 50 occlusion management techniques [1].
Transparency and cutaway techniques A natural approach for removing occlusion in visualization is to
render the occluder transparently, or to remove parts of the occluder.
Figure 2. Visualization of CRC rays (see top-right image in Figure 1).
Figure 3. Comparison between CRC visualization (left) and a visualization that switches abruptly between viewpoints (right).

Such transparency [2] and cutaway [3] techniques have the advantage of an undistorted visualization that accurately conveys global spatial relationships. Transparency works best in the case of small depth complexity where the outer layers do not need to be represented in detail and only serve the purpose of providing context to the inner layers which are the focus of the visualization, as it is frequently the case for volume datasets. Cutaway techniques are typically used for opaque occluders but again outer layers are only summarily represented at the periphery of the image. Compared to transparency and cutaway, the proposed CRC technique warps global spatial relationships and requires access to the occluded data subset to route the curved rays, but the CRC scales better with depth complexity and produces clear and complete visualizations.
Dataset distortion techniques Another approach for alleviating occlusions is to distort the
dataset such that there is direct line of sight to data subsets of interest. Earlier work targeted 2-D data [4, 5, 6]. Two types of distortion have been developed to handle 3-D datasets: explosion and deformation. Explosion techniques subdivide the dataset with the help of user interaction [7], or automatically [8], and then move the parts away from each other to alleviate occlusion. Deformation techniques modify the dataset to disocclude regions of interest while preserving the original connectivity. Deformation techniques have been used for example for occlusion-free perspective visualization for car navigation systems [9] and for short route visualization [10].
The explosion approach is best suited for scenarios where the occluded subset is completely encapsulated. Explosions modify the dataset considerably and exploded views have to rely on the user’s ability to mentally reassemble the dataset. On the other hand it is clear to the user that the visualization does not show the dataset in its original configuration and that it has been exploded for visualization purposes. Deformation techniques strive to modify the dataset as little as possible. The result is a plausible dataset similar to the original dataset, which is generally an advantage but can also sometimes lead to confusion. Also deformation techniques can only achieve disocclusion if there is access to the occluded data subset.
Our CRC technique is similar in effect to deformation techniques. All CRC visualizations shown in Figure 1 could pass for conventional visualizations of plausible datasets: a town with curved streets, a DNA molecule with different angles between its bonds, an engine block with an obtuse angle between its front and left face, or a canyon dug by a river with a straighter path. The main difference between the CRC and the deformation techniques is in how the disocclusion effect is obtained. The CRC allows specifying directly the rays that sample the dataset, which guarantees the disocclusion effect, as opposed to deformation techniques which modify the dataset iteratively, measuring and minimizing the residual occlusion.
Multiperspective techniques Graphic artists have known for centuries that relaxing the single
viewpoint constraint can be used to achieve effects that strengthen artistic expression. The same effects have been pursued by artistic rendering systems [11]. Image-based rendering techniques have been developed to combine several photographs taken from different locations into a multiperspective panorama. For example street panoramas are assembled from photographs capturing the facades along a street [12, 13]. Compared to the CRC technique, street panoramas work under the simplifying assumption of a horizontal ground plane and a vertical façade plane which allows the integration of the raw data without detailed knowledge of the scene geometry. Multiple-center-of-projection (MCOP) images [14] were rendered for virtual scenes using a vertical push-broom camera that slides along a user chosen path. Like CRC images, MCOP images provide a smooth change in perspective which minimizes distortion. However rendering MCOP images is a laborious process that requires rendering the scene for each one of a large number of viewpoints along the finely discretized path. Even though its rays are curved, the CRC model provides a fast projection operation that allows computing the multiperspective image in a single pass.
Multiperspective images have also been used in cel animation [15]. Like for MCOP images, cel panoramas are rendered offline by finely discretizing the desired camera path.
Removing the PPC constraints has also been investigated as a camera model generalization problem. We will limit the discussion to prior work aimed at removing the single viewpoint constraint, most relevant in the present context, and omit work addressing the field of view and uniform sampling limitation of the PPC.
The general linear camera (GLC) relaxes the pinhole constraint by interpolating between three given non-concurrent rays [16]. The family of occlusion cameras has been introduced to shrink the occlusion shadow of foreground objects [17]. Occlusion cameras are constructed from a PPC by distorting its rays to reach around occluders and to capture samples that are barely occluded. A barely occluded sample is a sample that projects close to the silhouette of an occluder and is thus likely to become visible even for minimal viewpoint translations. Both GLCs and occlusion cameras provide fast projection so rendering is efficient. Whereas the GLC and occlusion cameras provide a local disocclusion effect, as needed for applications such as reflection rendering [18], the CRC allows defining rays that reach far from the original viewpoint in order to disocclude distant data subsets.
The non-linear ray tracing framework [19], later mapped to GPUs [20], was developed with the initial motivation of visualization of mathematical and physical systems such as the generalized theory of relativity, black holes, and neutron stars where bent light rays occur. This pioneering work makes the important contributions of introducing the concept of curved rays, of introducing the idea of distorting rays as opposed to the 3-D dataset to be visualized, and of demonstrating the feasibility and potential of rendering images with curved rays. However, the curved rays are inherent to the system that is visualized and are thus considered input for the framework. The framework does not provide flexibility or assistance for defining the rays, as is needed for the task targeted by the CRC of achieving a specific disocclusion effect. Moreover, rendering relies exclusively on ray casting and is less efficient than in the case of the CRC.
Added ray definition flexibility is brought by a framework that allows defining any single-camera projection through the use of a flexible viewing volume [21]. The framework subsumes inverted perspective projection, general linear cameras, and occlusion cameras. The major contribution of the framework is a formal foundation for the analysis and development of non-conventional projections. Rendering remains restricted to ray casting with the exception of some special cases. In essence the CRC builds upon this framework to define a camera model and construction algorithms specialized for the disocclusion application. The CRC provides specific solutions to the problems of combining two or more viewpoints, of how to modify the camera model in real time to track a target, and of how to disocclude a path.
One method of addressing the challenge of specifying the non-linear projection that achieves a desired artistic [22] or disocclusion [23] effect is based on widgets, which are image regions where special projection rules apply. The projection of a widget is specified as one of several predefined projections or it is computed from a set of user specified constraints. The widgets bring local modifications to the original image which has the advantage of preserving global spatial relationships but also the disadvantage of limited disocclusion capability. Moreover disocclusion is limited to a single occluder as it is difficult to overlap multiple widgets for the camera rays to take multiple turns. Rendering is performed in feed forward fashion but performance decreases with the number of widgets.
The graph camera [24] is a flexible camera model constructed from an initial PPC by applying a set of view frustum bending, splitting, and merging operations. Compared to the graph camera, the CRC only supports view frustum bending hence it brings less disocclusion flexibility. However, the graph camera switches perspectives abruptly using piecewise linear rays with only C0 continuity, which causes sharp distortions like the ones shown in Figure 3. Moreover graph camera construction was done either with

the help of the user or by relying on a maze with right-angle 4-way intersections, and did not support target tracking or path previewing.
3 CURVED RAY CAMERA MODEL We first describe a camera model with curved rays that achieves the goal of smoothly connecting two viewpoints. The resulting camera model is suitable for rendering by ray casting, as is required in visualization applications such as volume rendering. Then, in the next section, we describe a modification to the original camera model that enables fast projection, making it suitable for feed-forward rendering.
The design of the curved ray camera has to allow circumventing occluders and reaching deep into the dataset. By definition a camera model specifies the set of rays the camera uses to sample the dataset. In order to achieve the desired disocclusion effect we generalize the concept of a camera ray to the locus of 3-D points that project at a given image plane location, which allows for curved rays. Given a starting planar pinhole camera PPC0 with viewpoint C0, a plane t1, and a second viewpoint C1, we want to build a camera model that uses viewpoint C0 up to t1 and then switches to C1. In order to make the transition smooth we use two additional planes t0 and t2 that define a transition region where the viewpoint change occurs (Figure 4). We connect the C0 and C1 rays with a quadratic polynomial Bézier, which is the simplest curve that provides C1 continuity at both connection points. For example, the CRC ray through P0 is the C0 ray up to plane t0, then the quadratic Bézier with control points P0, P1, and P2, and then the C1 ray beyond plane t2.
In conclusion, given an image plane point P, the CRC camera ray is found by first intersecting ray C0P with planes t0 and t1 to obtain points P0 and P1, then ray C1P1 is intersected with plane t2 to obtain point P2, and then control points P0, P1, and P2 define the ray as explained above. The CRC can be extended by appending additional viewpoints, each with its own transition region.
The CRC model can be used directly to support visualization techniques that require ray casting, such as volume rendering. A CRC ray is traced by tracing the sequence of segments and arcs. The arcs are traced by iterating parameter t in the Bézier equation below.
2
210
2 )1(2)1( PtPttPtP +−+−= (1)
Equal t increments of course do not correspond to arc steps of equal length. For applications where the uniformity of the step is important one could evaluate Equation 1 with small steps in t and to use a piecewise linear approximation of the length of the arc step. In addition to the ability to trace rays, ray casting also requires the ability to clip a ray with the bounding volume of the dataset. Computing the intersection between a Bézier ray and a plane is easily done by plugging in the expression of a ray point given by Equation 1 into the plane equation, which results in a quadratic equation in parameter t.
It is straightforward to trace the CRC rays as defined, but the approach of choice for interactive visualization of 3-D surface datasets remains feed-forward rendering through projection followed by rasterization. Unfortunately, given a 3-D point P one cannot inexpensively compute the image plane projection of P with the CRC model as defined because the projection equation cannot be solved in closed form and a numerical solution is too expensive. We implemented a numerical solution based on the bisection method and found solutions with sub-pixel accuracy after an average of 10 iterations, too slow for interactive visualization of complex datasets. Fortunately a small modification to the CRC model enables fast, closed-form projection of 3-D points.
4 A CURVED RAY CAMERA MODEL WITH FAST PROJECTION We developed a fast projection operation based on the observation that it is advantageous to choose the three planes t0, t1, and t2 defining the transition region such that they intersect along a common line l. This does not come at a significant loss of generality since planes t0 and t2 simply mark the beginning and the end of the transition region. Note that line l does not have to be vertical. In other words, rays can bend in any direction (see Section 7 and Figure 12). Given a 3-D point P to be projected, let A be the intersection of l with the epipolar plane C0C1P, and let Pi be the intersection points of line AP and the bundle of Bézier arcs (Figure 5). Let Qi be the intersection points between plane t2 and the same Bézier arcs. Then lines PiQi are almost concurrent, and the near-intersection occurs close to the baseline C0C1 (see dotted circle).
If lines PiQi truly intersected at a point R on C0C1, point P could be projected by finding point R using a known ray, say the one through Qn. In other words R can be found without yet knowing the ray through P. Once R is known, Q, S, and the projection of P on the image plane are easily found by intersecting RP with t2, C1Q with t1, and C0S with the image plane. We first describe the camera model modification that achieves the desired convergence on the baseline while preserving the desired ray continuity property, and then we describe the projection algorithm in detail.
C1
t1
C0
t2
t0Image plane
P0
P1P2
P
Figure 4. CRC model visualization.
C1
t1
C0
t2
t0
P
A
Qn
Q
Q0Pn
P0
R
S
b
Figure 5. Illustration of desired fast projection operation.
C1
C0
t2
t0 A
Qn
Sn
b
Ca
P0
Q0
Cb
S0
Pn
tatb
Figure 6. CRC model modified for fast projection.

4.1 Camera model modification The modified CRC model is defined as follows (Figure 5). First, the left most ray in each epipolar plane stays the same as before; the ray through Qn remains the quadratic Bézier arc b. The other rays are constructed by rotating a line through point A from plane t0 to plane t2. For each intermediate position, the line is intersected with b to define point Pn, and then QnPn is intersected with C0C1 to find point R. The ray point P is defined by the intersection of RQ and line APn.
At a conceptual level, the modified CRC model switches gradually from C0 to C1 through a continuum of intermediate viewpoints on the baseline segment C0C1 (Figure 6). Each intermediate viewpoint Ci is used to image all 3-D points located in a plane ti of the transition region. For example Ca images points in the plane ta. ta is defined by the line l through A (i.e. the intersection of t0 and t2) and point Sn at the intersection of CaQn and b. In other words, given a point P, the viewpoint to use depends on where line PA intersects the Bézier arc b. Figure 7 shows that the modified rays are very similar to the original rays, and consequently the image differences are small as well.
4.2 Modified camera model properties We first show that the modified arcs are conic sections that connect the component rays from the transitioned PPCs with C1 continuity. Consider Figure 8 that shows the modified rays of the CRC model in a single epipolar plane through C0 and C1. Tn, Sn, and Qn are the control points of the Bézier arc b that aids with the projection of all points in the epipolar plane. Triangles TnSnQn and TkSkQk satisfy Desargues’ Theorem [25]. Since the intersections of planes t0, t1, and t2 with the epipolar plane are concurrent, all such triangles are perspective, as are triangles PnSnQn and PkSkQk. Here, A is the center and line C0C1 is the axis of perspectivity. By construction, lines QkPk intersect on the axis of perspectivity in a common point Rk and therefore points Pk are also perspective.
Now the Bézier curve b is the projected intersection of a quadratic cone in 3D, with vertex A, and a plane through a line that projects onto the axis of perspectivity. Since triangles TkSkPk are perspective, the other transition curves are also conic sections.
Again in 3D, the plane containing lines ATn and ASn is tangent to the cone, in a line projecting onto line ATn and so the conic arcs are all C1 continuous with the lines through C0. Likewise, lines through C1 are C1 continuous with the conic arcs on the other end.
Having established that the transition curves are tangent continuous and are conics, we now establish that different transition arcs cannot intersect in the transition region.
Let PkSkQk and PjSjQj be two triangles defining the intersecting transition curves. Since the control points PkPj and QkQj are distinct, the intersection must be in the interior of the arcs, say at X. The lines QkX and QjX are distinct and intersect in X. Thus they do not intersect on the line C0C1 and so the point X is not perspective on the two curves, yet the line XA establishes projective correspondence. Hence the two arcs cannot intersect in the interior. An alternative argument is as follows. There must be perspective points Yk and Yl on the intersecting curves such that X is on opposite sides of the line YkYlA that establishes the correspondence. Since this is impossible, there cannot be an intersection in the interior of the arcs either.
For the modified model lines PiQi converge on baseline C0C1 by construction and the following projection algorithm applies.
4.3 Projection operation A point P is projected with the following steps (Figure 5): 1. Intersect line AP with Bézier arc b to obtain point Pn. 2. Intersect PnQn with baseline C0C1 to obtain point R. 3. Intersect RP with plane t2 to obtain Q. 4. Intersect C1Q with plane t1 to obtain point S. 5. Intersect C0S with the image plane. The first step implies solving a single variable quadratic equation,
as discussed above (b is intersected with a plane through AP). All other steps are simple line/plane intersections. Moreover the projection of point Q onto plane t1 using C1 (step 4) and the projection of S onto the image plane (step 5) can be combined into a single projection by concatenating the projection matrices of PPC1 and PPC0. PPC1 is defined by viewpoint C1 and image plane t1. Points inside the frustum of PPC0 but outside the transition region are simply projected with PPC0. Points inside the frustum of PPC1 but outside the transition region are projected with the concatenated projection matrices of PPC1 and PPC0. The cost of projection does not increase as additional turns are added to the rays of the CRC. The matrices corresponding to the additional turns are concatenated and points are projected directly to the image plane, in one step.
5 CRC CONSTRUCTORS We have developed several CRC constructors to facilitate achieving the desired disocclusion effect in various contexts.
5.1 Interactive Constructor We have developed an interactive CRC constructor that allows the user to set all components of a two viewpoint CRC through a graphical user interface. The position of the second viewpoint C1 and of the transition region controls how much and which way the CRC rays should bend, and the size of the transition region controls how
Figure 7. Modified (black) and original (red) CRC rays.
C1
t1
C0
t2
t0A
Qn
Pn
Rk
Sn
SkQk
Tn Tk
Pk
b
Figure 8. Modified CRC model.
Figure 9. CRC image that captures all of the forward and right streets.
abrupt the transition between the two viewpoints should be. The CRC components are manipulated in a window that gives an overhead view of the scene and that also visualizes the rays of the CRC. A second window shows the corresponding CRC image for immediate feedback. The image in Figure 9 was rendered with a CRC that was designed with the interactive constructor to capture the entire forward and right street branches.
5.2 Target tracking The disocclusion capability of the CRC can be used to avoid that an object of interest, i.e. a target, becomes occluded as the view, the target, and/or other objects move. We have developed a CRC constructor that automatically computes a CRC that shows a given target (Figure 1 & video). The CRC is controlled with 3 parameters: the depth z0 from the first viewpoint C0 where rays should start to bend, a translation amplitude a that defines the maximum lateral offset of the second viewpoint C1 with respect to C0, and a fraction f between −1 and 1 that modulates the maximum offset. When f is −1/+1 the CRC rays are bent all the way left/right. When f is 0 rays are straight and the CRC is a PPC. We set both z0 and a as half the distance from C0 to the target. The ray bending fraction f is updated dynamically for every frame with the following algorithm.
1. If the target is visible for f = 0, set f to 0. 2. Else if the target is visible with current f, keep current f. 3. Else search for a new f such that the target is visible. Visibility of the target for a given value of f is determined
efficiently at bounding box level: axis aligned bounding boxes are fitted to objects and to target, the bounding boxes are projected on the CRC image, and the image aligned bounding boxes of the projections are tested for intersection. The target bounding box is enlarged a user chosen number of pixels to achieve a clear disocclusion of the target.
The rays are bent only if needed and the same bending factor is kept if possible. The search for a new f value that disoccludes the target starts at the current f value and iteratively tests f values left and right at increasing distance. If the search succeeds f is updated to the new value, else f is set to 0 (i.e. the target cannot be disoccluded). The frame to frame change of f is capped to avoid abrupt changes in the visualization. The gradual change of f comes at the cost of occluding the target for a few frames as the rays swing to the new value of f that disoccludes the target. The only state data maintained by the algorithm is the ray bending factor f, so it directly supports dynamic occluders, dynamic targets, and dynamic views.
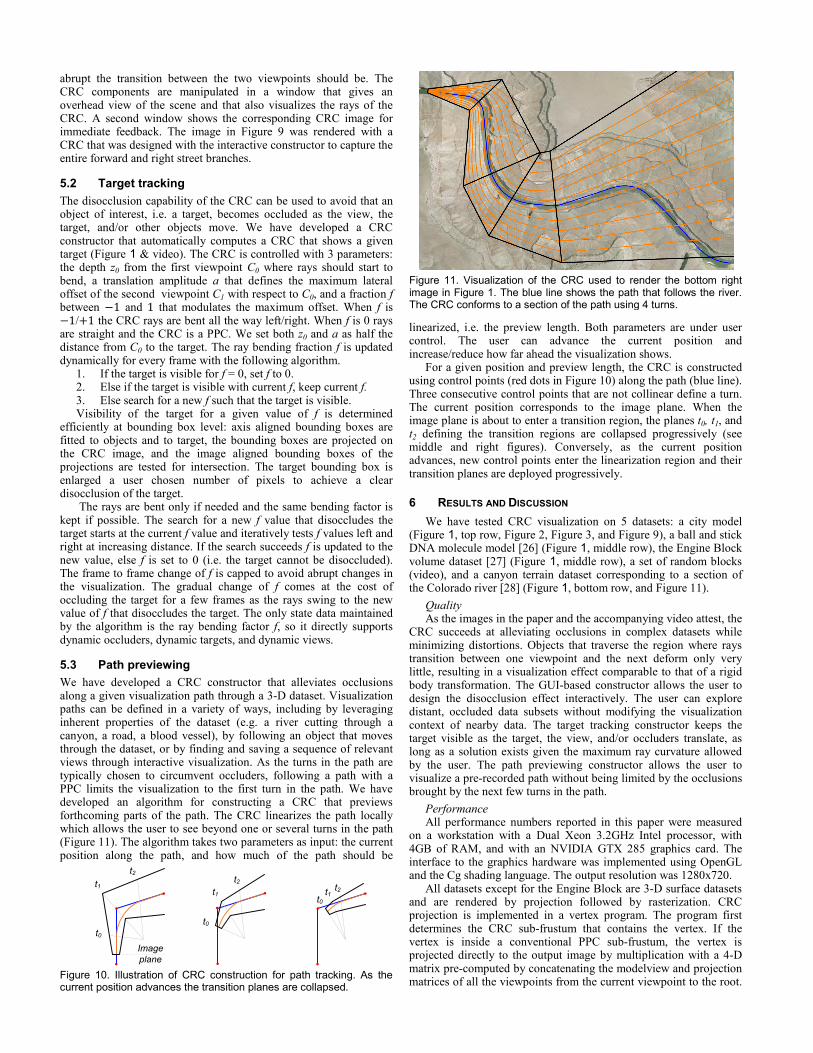
5.3 Path previewing We have developed a CRC constructor that alleviates occlusions along a given visualization path through a 3-D dataset. Visualization paths can be defined in a variety of ways, including by leveraging inherent properties of the dataset (e.g. a river cutting through a canyon, a road, a blood vessel), by following an object that moves through the dataset, or by finding and saving a sequence of relevant views through interactive visualization. As the turns in the path are typically chosen to circumvent occluders, following a path with a PPC limits the visualization to the first turn in the path. We have developed an algorithm for constructing a CRC that previews forthcoming parts of the path. The CRC linearizes the path locally which allows the user to see beyond one or several turns in the path (Figure 11). The algorithm takes two parameters as input: the current position along the path, and how much of the path should be
linearized, i.e. the preview length. Both parameters are under user control. The user can advance the current position and increase/reduce how far ahead the visualization shows.
For a given position and preview length, the CRC is constructed using control points (red dots in Figure 10) along the path (blue line). Three consecutive control points that are not collinear define a turn. The current position corresponds to the image plane. When the image plane is about to enter a transition region, the planes t0, t1, and t2 defining the transition regions are collapsed progressively (see middle and right figures). Conversely, as the current position advances, new control points enter the linearization region and their transition planes are deployed progressively.
6 RESULTS AND DISCUSSION We have tested CRC visualization on 5 datasets: a city model
(Figure 1, top row, Figure 2, Figure 3, and Figure 9), a ball and stick DNA molecule model [26] (Figure 1, middle row), the Engine Block volume dataset [27] (Figure 1, middle row), a set of random blocks (video), and a canyon terrain dataset corresponding to a section of the Colorado river [28] (Figure 1, bottom row, and Figure 11).
Quality As the images in the paper and the accompanying video attest, the
CRC succeeds at alleviating occlusions in complex datasets while minimizing distortions. Objects that traverse the region where rays transition between one viewpoint and the next deform only very little, resulting in a visualization effect comparable to that of a rigid body transformation. The GUI-based constructor allows the user to design the disocclusion effect interactively. The user can explore distant, occluded data subsets without modifying the visualization context of nearby data. The target tracking constructor keeps the target visible as the target, the view, and/or occluders translate, as long as a solution exists given the maximum ray curvature allowed by the user. The path previewing constructor allows the user to visualize a pre-recorded path without being limited by the occlusions brought by the next few turns in the path.
Performance All performance numbers reported in this paper were measured
on a workstation with a Dual Xeon 3.2GHz Intel processor, with 4GB of RAM, and with an NVIDIA GTX 285 graphics card. The interface to the graphics hardware was implemented using OpenGL and the Cg shading language. The output resolution was 1280x720.
All datasets except for the Engine Block are 3-D surface datasets and are rendered by projection followed by rasterization. CRC projection is implemented in a vertex program. The program first determines the CRC sub-frustum that contains the vertex. If the vertex is inside a conventional PPC sub-frustum, the vertex is projected directly to the output image by multiplication with a 4-D matrix pre-computed by concatenating the modelview and projection matrices of all the viewpoints from the current viewpoint to the root.
t0
t1t2
t0
t1t2
t2t1t0
Image plane
Figure 10. Illustration of CRC construction for path tracking. As the current position advances the transition planes are collapsed.
Figure 11. Visualization of the CRC used to render the bottom right image in Figure 1. The blue line shows the path that follows the river. The CRC conforms to a section of the path using 4 turns.

If the vertex is inside a transition region sub-frustum, the vertex is projected as described in Section 4. For datasets where the triangles are small, conventional rasterization is a good approximation of the non-linear rasterization mandated by the non-linear projection of the CRC. Datasets with large triangles are subdivided as a pre-process. In our case the only dataset that required subdivision was the city dataset due to large triangles used to model the ground (e.g. sidewalks, roads). We have also implemented a geometry program that performs on demand subdivision but performance is lower than in the case of off-line uniform subdivision, which we attribute to the primitive emission bottleneck of GPU geometry programs.
The side faces of the CRC frusta are planes. For the Canyon and City datasets we perform view frustum culling at primitive group level using a simple uniform 3-D grid. We avoid triangle level clipping by enlarging the frustum of the CRC and discarding any triangle for which at least one of the vertices is outside the CRC frustum. This is done with a simple geometry program that emits 1 or 0 triangles per incoming triangle. Triangles do not need to be clipped with the separation planes between CRC sub-frusta; a triangle crossing such a plane is simply handled by projecting each one of its vertices with the projection function of its sub-frustum.
Rendering performance is given in Table 1. The geometry load figures correspond to primitives that pass view frustum culling. We compare the CRC to a PPC (i.e. rendering the dataset with the root PPC0 of the CRC), and to a camera with C0 continuous rays that switches abruptly between the viewpoints of the CRC. The CRC renders all datasets comfortably except for the City dataset which is too large to fit on the graphics card, and which none of the 3 methods render quickly. The ratio between PPC and CRC performance is at most 2.08; between C0 and CRC it is at most 1.39. The CRC vertex projection performance is at least 12, 50, 222, and 83 million vertices per second for the first 4 datasets in the table, respectively. These figures were computed by multiplying the frame rate by the number of vertices, which counts the entire frame time as projection time. As such, the figures give a lower bound on projection performance.
We measured performance for the Canyon dataset for CRCs with an increasing number of viewpoints. Performance remains virtually unchanged even for as many as 8 viewpoints, which is expected since the few additional dot products needed to classify the vertex sub-frusta are a small cost compared to the vertex projection operation as a whole.
The Engine Block dataset is volume rendered by ray casting using the original CRC model with all ways being Bézier arcs. One could also ray cast using the modified CRC model, but the additional cost incurred by tracing the conic rays is unnecessary. For the transition region we derive the number of steps from the sum of the length of the original viewpoint C0 and C1 rays (i.e. P0P1 + P1P2 in Figure 4). The numbers reported in the table correspond to the left Block Engine image in Figure 1 for the PPC and to the right image for the CRC. The difference in performance is due to the fact that the volume covers a considerably larger fraction of the image for the CRC, and that the CRC rays travel longer through the volume.
Limitations Whereas for a PPC rasterization parameter variation is linear after
perspective correction, in the case of the CRC rasterization parameters vary non-linearly. Our current work takes the approach of subdividing triangles to make linear rasterization acceptable. Of course, the approximation (and subdivision) can be avoided by ray tracing which computes the intersection between a CRC ray and a triangle and evaluates the rasterization parameters in model space
using the barycentric coordinates of the intersection point. Another potential solution which we will investigate in the future is a hybrid approach that borrows from both the feed forward and the ray tracing pipelines: first an approximate bounding box of the curved CRC projection of a triangle is computed by projecting several points on the perimeter of the triangle, and then, for each pixel in the bounding box, the triangle is intersected with the corresponding CRC ray.
One of the potential strengths of the CRC model is that although it integrates multiple viewpoints, the CRC image rendering cost is independent of the number of viewpoints. For this to hold true the frustum containing a given 3-D point needs to be identified in constant time. As mentioned above, we are currently testing all sub-frusta sequentially, which is acceptable for a small number of viewpoints. To scale to hundreds of viewpoints the point to sub-frustum assignment needs to proceed hierarchically. We foresee that a binary space partitioning tree would be an adequate data structure for this task given the fact that sub-frusta are separated by planar faces and that they do not intersect.
Although the CRC minimizes small-scale distortions, the CRC does perturb global spatial relationships, which can lead to confusion. This limitation is inherent to all dataset distortion and multiperspective visualization techniques. Some applications could prefer that the data subsets that are displaced from their PPC projection location be highlighted to clearly communicate to the user the deviation from a regular PPC image.
Finally, the CRC needs an albeit indirect way of accessing the occluded data subset through which to route its rays. A CRC cannot, for example, disocclude the engine of a car with the hood closed. One option is to combine the CRC with other disocclusion management techniques such as transparency, cutaway, or explosion.
7 CONCLUSIONS AND FUTURE WORK The CRC model offers good flexibility for disoccluding complex datasets yet local distortion is minimized. Although the rays are curved, the CRC was designed to provide a fast projection operation which allows rendering 3-D surface data efficiently. Ray casting is straight forward, which enables visualization techniques such as volume rendering and ray tracing.
Whereas the previously developed non-linear ray tracing [23] and flexible view volume [21] frameworks offer the generality needed to experiment in the complex space of possible camera models, the CRC framework identifies camera models and construction algorithms well suited for the disocclusion task in terms of effectiveness and performance.
One line of future work is to develop additional CRC constructors. A constructor useful in the context of interactive visualization would be one that probes a dataset automatically, by building a CRC that bends to crawl into empty space and visualizes occluded data subsets. The CRC could be extended to support frustum splitting and merging, making it the equivalent of a graph camera with C1 frustum to frustum transitions, which would increase its disocclusion and multiperspective visualization capability. In the
Table 1. Rendering Performance for Various Datasets
Dataset Vertices x1,000
Tris x1,000
Frame rate (Hz) PPC C0 CRC
Blocks 90 43 153 136 137 DNA 2,170 4,112 48 32 23
Canyon 4,287 2,168 99 56 52 City 29,892 10,351 2.8 2.8 2.8
Engine 256×256×110 vol. res. 7.9 6.7 4.1
Figure 12. Examples of no, lateral, vertical, and diagonal ray bending.

examples shown so far, the disocclusion effect was obtained by lateral translation of the viewpoint. The CRC model supports any relative position of consecutive viewpoints (Figure 12), which can be exploited by future constructors for the added multiperspective expressivity of non-planar 3-D rays obtained by changing the bending direction from one transition region to the next.
We are in the process of conducting an extensive user study to investigate and quantify the potential benefits of multiperspective visualization like the one enabled by the CRC in the context of 3-D dataset exploration. Our study is conducted using 47 subjects whose accuracy and speed were tested for a number of basic tasks such as object finding, object counting, and path memorization (i.e. the subject is asked to remember the path taken through the dataset). The conditions we are investigating include static and dynamic datasets, as well as multiperspective images of varying complexity, i.e. images integrating from a few to tens of viewpoints.
Preliminary results are encouraging. By using multiperspective visualization, subjects are able to locate objects on average 35% faster compared to using a PPC visualization. This confirms the intuition that a multiperspective visualization that provides a preview beyond immediate occluders does accelerate the process of finding an object: the subject can tell without additional navigation whether the object is hidden or not behind the occluder. When counting objects, comprehensive multiperspective visualization resulted in an accuracy of 90% compared to only 44% when using visualization based on a comprehensive set of PPCs. This confirms the intuition that a multiperspective visualization that shows the entire 3-D data in a non-redundant and continuous image facilitates disambiguating identical objects and tracking dynamic objects. For the path memorization task, subjects performed virtually identically using multiperspective and PPC visualizations (69.8% and 66.7% accuracy, respectively), which indicates that the auxiliary viewpoints augmenting the main viewpoint do not disturb significantly the subject’s sense of orientation.
Additional user studies are needed to fully identify the types of basic tasks where CRC visualization is beneficial. Such user studies will allow deriving empirical guidelines to make best use of the flexibility of the camera model for optimizing visualization payload. The benefits of CRC visualization will have also to be studied in the context of high-level tasks performed by domain experts. CRC visualization will have to be compared to alternative approaches for overcoming occlusions. For example, in the context of computational molecular dynamics, disocclusion can be achieved using conventional graph visualization techniques, against which the CRC approach has to be compared. In addition to task performance, other possible comparison points include tractability, magnitude and effects of distortion, 2-D vs. 3-D, and rendering performance in light of interactive visualization and dynamic datasets.
Another possible direction of future work is to investigate constructing CRC visualizations of real world scenes. A piecewise linear approximation of the CRC rays can be implemented by using multiple physical video cameras. Merging the video feeds would be greatly aided by the availability of a geometric proxy of the scene. For example for the canyon shown in this paper the proxy could be provided by the terrain data.
This work is inscribed in the camera model design paradigm which advocates for the relaxation of the planar pinhole camera constraints and for the development of camera models that adapt dynamically to the data they are sampling. We believe that camera model design can be used to develop solutions to other challenging problems in visualization and beyond.
REFERENCES [1] N. Elmqvist, P. Tsigas. A Taxonomy of 3D Occlusion Management for
Visualization. IEEE TVCG. Vol 14, No. 5, pp. 1095-1109, 2008. [2] J. Kruger, J. Schneider, R, Westermann. ClearView: An interactive
context preserving hotspot vis technique. IEEE TVCG, Vol 12, No. 5, pp. 941-947, 2006.
[3] M. Burns, A. Finkelstein. Adaptive cutaways for comprehensible rendering of polygonal scenes. In ACM SIGGRAPH Asia, 2008.
[4] G.W. Furnas, Generalized fisheye views. In CHI’86 Conference on Human Factors in Computer Systems, pp. 16–23, 1986.
[5] J. Lamping, R. Rao. The Hyperbolic Browser: A focus + context technique for visualizing large hierarchies. J. of Visual Languages and Computing, Vol. 7, No. 1, pp. 33–35, 1996.
[6] N. Wong, M.S.T. Carpendale, S. Greenberg,. EdgeLens: An interactive method for managing edge congestion in graphs. In Proc of the IEEE Symp. on Info Vis, pp. 51–58. 2003.
[7] S. Bruckner, M. E. Groller, Exploded View for Volume Data. IEEE TVCG, Vol 12, No. 5, pp. 1077-1084, 2006.
[8] W. Li, M. Agrawala, B. Curless, D. Salesin. Automated generation of interactive 3D exploded view diagrams. ACM Trans. Graph. Vol. 27, No. 3, pp. 1-7, 2008.
[9] S. Takahashi, K. Yoshida, K. Shimada, T. Nishita. Occlusion-Free Animation of Driving Routes for Car Navigation Systems. IEEE TVCG. Vol 12, No.5, pp. 1141-1148. 2006.
[10] P. Degener, R. Schnabel, C. Schwartz, and R. Klein. Effective visualization of short routes. IEEE TVCG, Vol. 14, No. 6, pp. 1452-1458, 2008.
[11] M. Agrawala, D. Zorin, T. Munzner. 2000. Artistic Multiprojection Rendering. In Proc of the EG Workshop on Rendering Techniques, pp. 125-136, 2000.
[12] A. Román, G. Garg , M. Levoy. Interactive Design of Multi-Perspective Images for Visualizing Urban Landscapes. In Proc of Visualization '04, pp. 537-544, 2004.
[13] A. Agarwala, M. Agrawala, M. Cohen, D. Salesin, R. Szeliski. Photographing long scenes with multi-viewpoint panoramas. ACM Trans. on Graphics, Vol. 25, No. 3, pp. 853–861, 2006.
[14] P. Rademacher, G. Bishop. Multiple-center-of-projection images. In Proc of SIGGRAPH ‘98, pp. 199-206, 1998.
[15] D. N. Wood, A. Finkelstein, J. F. Hughes, C. E. Thayer, D. H. Salesin. Multiperspective panoramas for cel animation. In Proc of SIGGRAPH ’97, pp. 243-250, 1997.
[16] J. Yu, L. McMillan. General Linear Cameras. In Proc of the European Conference on Computer Vision (ECCV), Vol. 2, pp. 14-27, 2004.
[17] C. Mei, V. Popescu, E. Sacks. The Occlusion Camera. In proc. of EG 2005, Comp Graph Forum, vol. 24, No. 3, 2005.
[18] J. Yu, L. McMillan. Modelling Reflections via Multiperspective Imaging. In Proc. of Eurographics Symposium on Rendering, 2004.
[19] E. Groller. Nonlinear ray tracing: Visualizing strange worlds. The Visual Computer, Vol. 11, No. 5, pp. 263-274, 1995.
[20] D. Weiskopf, T. Schafhitzel, T. Ertl. GPU-based nonlinear ray tracing. Computer Graphics Forum 23, 3, pp. 625-633. 2004.
[21] J. Brosz, F. Samavati, M. Sheelagh, and M. Sousa. Single camera flexible projection. In Proc of the 5th international Symposium on Non-Photorealistic Animation and Rendering, pp. 33-42, 2007.
[22] P. Coleman, K. Singh, L. Barrett, N. Sudarsanam, and C. Grimm. 3D screen-space widgets for non-linear projection. In Proc of the 3rd international Conference on Computer Graphics and interactive Techniques in Australasia and South East Asia, pp. 221-228, 2005.
[23] N. Sudarsanam, C. Grimm, and K. Singh. Non-linear perspective widgets for creating multiple-view images. In Proc. of the 6th international Symposium on Non-Photorealistic Animation and Rendering, pp. 69-77, 2008.
[24] V. Popescu, P. Rosen, N. Adamo-Villani. The Graph Camera. International Conference on Computer Graphics and Interactive Techniques, ACM SIGGRAPH Asia, 2009.
[25] Desargues Thoerem. Wikipedia. Accessed in March 2010. http://en.wikipedia.org/wiki/Desargues'_theorem.
[26] Visual Molecular Dynamics. University of Illinois at Urbana Champaign. http://www.ks.uiuc.edu/Research/vmd/, 2010.
[27] Engine Block Volume Dataset. Stanford Univ. ftp://www-graphics.stanford.edu/pub/volpack/data/engine, 2010.
[28] United States Geological Survey. http://www.usgs.gov/, 2010.