a antibody therapy in combination with the t-cell specifi
TRANSCRIPT

Anne Jörns,1,2 Ümüs Gül Ertekin,1 Tanja Arndt,1 Taivankhuu Terbish,1
Dirk Wedekind,3 and Sigurd Lenzen1
TNF-a Antibody Therapy in CombinationWith the T-Cell–Specific AntibodyAnti-TCR Reverses the Diabetic MetabolicState in the LEW.1AR1-iddm RatDiabetes 2015;64:2880–2891 | DOI: 10.2337/db14-1866
Anti–tumor necrosis factor-a (TNF-a) therapy (5 mg/kgbody weight), alone or combined with the T-cell–specificantibody anti–T-cell receptor (TCR) (0.5 mg/kg bodyweight), was performed over 5 days immediately afterdisease manifestation to reverse the diabetic metabolicstate in the LEW.1AR1-iddm rat, an animal model of hu-man type 1 diabetes. Only combination therapy startingat blood glucose concentrations below 15 mmol/L re-stored normoglycemia and normalized C-peptide. In-creased b-cell proliferation and reduced apoptosis ledto a restoration of b-cell mass along with an immunecell infiltration–free pancreas 60 days after the endof therapy. This combination of two antibodies, anti-TCR/CD3, as a cornerstone compound in anti–T-celltherapy, and anti–TNF-a, as the most prominent andeffective therapeutic antibody in suppressing TNF-aaction in many autoimmune diseases, was able to re-verse the diabetic metabolic state. With increasingblood glucose concentrations during the disease pro-gression, however, the proapoptotic pressure on theresidual b-cell mass increased, ultimately reachinga point where the reservoir of the surviving b-cells wasinsufficient to allow a restoration of normal b-cell massthrough regeneration. The present results may opena therapeutic window for reversal of diabetic hyper-glycemia in patients, worthwhile of being tested inclinical trials.
Type 1 diabetes (T1D) is an immune cell–mediated diseasethat causes insulin dependence due to selective pancreatic
b-cell death (1–3). The infiltrate in the pancreatic islets iscomposed of different immune cell types, especially macro-phages and T cells (2–4). Upon activation, the immune cellsrelease proinflammatory cytokines and other cytotoxicmediators, causing b-cell apoptosis (3,5).
Effective prevention strategies require a combinationtherapy (6–8) to target the proinflammatory cytokines pro-duced in the different immune cell types. Of crucial impor-tance is in this context the proinflammatory cytokine tumornecrosis factor-a (TNF-a). It is expressed in all immune celltypes infiltrating the pancreatic islets in patients with T1Das well as in the spontaneous mouse (NOD mouse) and rat(BB, Komeda, and LEW.1AR1-iddm rats) models (3,9).
Cumulative evidence from studies in a variety of otherautoimmune diseases supports the contention that theinflammatory process in the affected organs always goesalong with a high TNF-a expression (9–13). Anti–TNF-atherapy is therefore an established therapeutic principle(14–16) in rheumatoid arthritis, inflammatory bowel dis-eases, lupus erythematosus, Sjögren syndrome, psoriasis,and Hashimoto thyroiditis (10,15,17).
Anti–TNF-a monotherapy in T1D is ineffective (18–21)and may even aggravate the disease (22,23). It is probablynot surprising in an autoimmune disease such as T1D, inwhich the pancreatic b-cells are so extremely vulnerable(24), that these cells not only become dysfunctional butare also quickly destroyed.
As has been documented in diabetic LEW.1AR1-iddm(IDDM) rats, as well as in pancreases from patients withT1D (3), the islet-infiltrating immune cells produce and
1Institute of Clinical Biochemistry, Hannover Medical School, Hannover, Germany2Centre for Anatomy, Hannover Medical School, Hannover, Germany3Institute for Laboratory Animal Science, Hannover Medical School, Hannover,Germany
Corresponding author: Sigurd Lenzen, [email protected].
Received 9 December 2014 and accepted 11 March 2015.
This article contains Supplementary Data online at http://diabetes.diabetesjournals.org/lookup/suppl/doi:10.2337/db14-1866/-/DC1.
A.J. and Ü.G.E. contributed equally to this work.
© 2015 by the American Diabetes Association. Readers may use this article aslong as the work is properly cited, the use is educational and not for profit, andthe work is not altered.
2880 Diabetes Volume 64, August 2015
ISLETSTUDIES

release, along with interleukin (IL)-1b, TNF-a as the dom-inating proinflammatory cytokine (3,5,25).
Combination therapies, at variance from monothera-pies, have shown promising results in T1D (25–29)and other autoimmune diseases (11,14,15). We there-fore investigated in the IDDM rat, an animal model ofhuman T1D, which mirrors the human T1D situationmost closely (3,5,30,31), whether a combination therapyof anti–TNF-a, which suppresses TNF-a release from allimmune cells, with anti–T-cell receptor (TCR), whichsuppresses proinflammatory cytokine release from ac-tivated T cells, can be successful. Anti-TCR is an anti-body against T cells that binds to an epitope of thea/b-chains of the TCR (32). It is comparable in actionto anti-CD3, which binds to the ´-chain of the CD3molecule (33). Both antibodies bind noncovalently tothe TCR/CD3 complex and modulate T cells by affect-ing the trans-signaling pathway (32,33). Anti-TCR isused in rats because anti-CD3 is available for mice(33) and humans (33,34) but not for rats (25,35). Weshow in this study that this combination therapyscheme is capable of successfully reversing the diabeticmetabolic state.
RESEARCH DESIGN AND METHODS
AnimalsCongenic rats (for details see http://www.mh-hannover.de/3642.html) were bred and maintained as described(25,30). Experimental procedures were approved by theDistrict Government of Hannover (LAVES, nos. 33-42502-05/958 and 509.6-42502-03/684).
Experimental GroupsFour experimental groups were studied. Group 1 (n = 5)comprised healthy, normoglycemic IDDM rats withouttherapy; group 2 (n = 12) comprised acutely diabeticIDDM rats treated for 5 consecutive days with rat-specific anti–TNF-a (5 mg/kg body weight [bw] i.v.; pro-vided by Janssen Research & Development, SpringHouse, PA). Group 3 (n = 12) comprised diabetic ratstreated for 5 consecutive days with anti–TNF-a and inaddition with anti-TCR (0.5 mg/kg bw i.v.) (R73; AbDSerotec, Munich, Germany). Group 4 (n = 5) compriseduntreated diabetic IDDM rats. All therapies were startedwithin 1 day after T1D onset at blood glucose concen-trations .10 mmol/L. Animals in groups 1 and 4 re-ceived 0.9% NaCl solution. Anti-TCR causes slightlymphocyte reduction in the periphery (,20%), whichdisappears within 1 week after cessation of therapy(25). Anti–TNF-a was without effect and also did notfurther reduce the lymphocyte count in combinationtherapy with anti-TCR (data not shown). The CD4-to-CD8 T-cell ratios were not affected by any of the treat-ments (Supplementary Table 1).
Pancreatic Biopsies and Tissue ProcessingBiopsies of tissue (30 mg) were obtained from the pan-creas tail of each animal under isoflurane anesthesia as
previously described (36). To identify changes in thepancreatic islets, one biopsy was collected on the dayof T1D manifestation, immediately before the start oftherapy, and another at the end of therapy; the remainingpancreas, comprising head and tail, pancreas-draininglymph nodes, and serum, were collected 60 days afterthe end of therapy (25). Tissue specimens were fixed formicroscopic analyses (25,36). Blood glucose concentrationswere determined daily (Glucometer Elite; Bayer, Leverkusen,Germany). Serum C-peptide was analyzed with a rat-specificELISA (Mercodia, Uppsala, Sweden) and serum cytokine pro-tein concentrations with a multiplex immunoassay kit (Bio-Rad, Munich, Germany) (25,36).
Morphological AnalysesSerial sections were stained with the avidin-biotin com-plex method or the double-immunofluorescence tech-nique with primary antibodies for b-cells and immunecells (3,36). The antibodies against TNF-a and T cellsrecognized epitopes other than those targeted by theantibodies used for therapy. b-Cell apoptosis was quan-tified by TUNEL (Roche, Mannheim, Germany), as wellas proliferation by a double staining with Ki67 antibody(COOH-terminal; Acris, Herford, Germany) and insulin(D3E7; AbD Serotec). At each time point, 25–40 pan-creatic islets were studied (25,36). A minimum of 1,000b-cells were counted in the proliferation and apoptosisanalyses (25,36). Islet infiltration was scored as de-scribed (25). The b-cell mass, identified by insulin andGLUT2 staining on sequential sections, was calculatedby the ratio of the b-cell area (mm2) to the whole pan-creatic area, determined four times in distances of 100mm each and multiplied by the pancreas weight. Anal-yses were performed using an Olympus BX61 micro-scope (25,36).
In Situ RT-PCRPancreatic sections from all experimental groups wereplaced on three-chamber slides. The in situ RT-PCRanalysis was performed on a special thermal cycler (MJResearch, Waltham, MA) (25,36). Primer sequences areprovided in Supplementary Table 2.
Real-time RT-PCRThe quality of the mRNA isolated from pancreas-draining lymph nodes was controlled with the Experionelectrophoresis system (Bio-Rad). mRNA was quanti-fied in real-time RT-PCR reactions performed with theDNA Engine Opticon fluorescence detection system(MJ Research) (36). Primer sequences are provided inSupplementary Table 3.
StatisticsResults are presented as mean values 6 SEM. Compari-sons among the different therapy groups and the normo-glycemic or diabetic control rats were analyzed with theMann-Whitney U test and ANOVA, and correlation coef-ficients were calculated according to Pearson with thePrism 5 program (GraphPad Inc., San Diego, CA).
diabetes.diabetesjournals.org Jörns and Associates 2881

RESULTS
Metabolic Effects of Therapy With Anti–TNF-a Alone orCombined With Anti-TCRAnti–TNF-a (5 mg/kg bw, for 5 days) was administered toIDDM rats within 1 day after T1D manifestation (bloodglucose .10 mmol/L), alone or combined with anti-TCR(0.5 mg/kg bw, for 5 days). Combination therapy resultedin an instantaneous and sustained return to normoglycemiawithin 1 day after the start of therapy in 8 of 12 rats (Fig.1A), defined as blood glucose ,10 mmol/L, compared withthe nonresponding rats. Rats (n = 12) with anti–TNF-atherapy alone after T1D manifestation remained perma-nently hyperglycemic (.15.0 mmol/L) (Fig. 1A), and se-rum C-peptide levels were not preserved (Fig. 1C). In theanimals responding to combination therapy, normoglyce-mia achieved at the end of the 5-day therapy period wasfurther maintained for another 60 days in the absence oftherapy (Fig. 1A). Thereby, combination therapy achievedglucose levels identical to those of healthy, normoglyce-mic control rats (5.4 6 0.2 vs. 5.1 6 0.1 mmol/L). Rats(n = 4) not responding to combination therapy and di-abetic rats without therapy showed no return to normo-glycemia and needed insulin supplementation soon afterthe start of therapy (Fig. 1A and B). Healthy control ratsstayed normoglycemic during the entire observation pe-riod (Fig. 1B).
In the successfully treated animals with the combina-tion therapy, serum C-peptide concentrations increased(Fig. 1C). At the end of therapy and more so 60 days later,C-peptide was significantly (P , 0.05) higher with com-bination therapy than with anti–TNF-a monotherapy.This continuous increase reached about two-thirds of con-trol values (7266 79 vs. 10236 41 pmol/L) at the end ofthe observation period (Fig. 1C). The untreated diabeticrats had C-peptide concentrations ,20% at the time ofT1D manifestation (Fig. 1C). C-peptide remained low af-ter anti–TNF-a monotherapy and in animals nonrespon-sive to combination therapy (Fig. 1C).
A detailed analysis revealed interesting results. Sixrats in the monotherapy group had blood glucose valuesat the start of therapy between 10.0 and 15.0 mmol/L(12.5 6 0.5 mmol/L), and the other six values wereabove 15.0 mmol/L (16.7 6 0.4 mmol/L) (Fig. 2A). Butin none of the 12 rats did monotherapy restore b-cellmass. In the two subgroups with combination therapy,the blood glucose concentrations were also significantly(P , 0.05) different. In all rats that responded to com-bination therapy, blood glucose values were below15 mmol/L (11.4 6 0.3 mmol/L; n = 8) but were above15 mmol/L in all nonresponding rats (16.4 6 0.4 mmol/L;n = 4) (Fig. 2B).
Morphometric Quantification of Therapy Effects onb-Cells and Pancreatic Islet Infiltration
Changes of Proliferation and Apoptosis Rates in b-CellsThe analyses of the percentage changes, as presented inFig. 3A and B, revealed drastic increases of the rates for
both parameters in the diabetic rats. At the day of T1Dmanifestation, the rats that were responsive to the com-bination therapy (8 of 12) showed significantly more thana 4-fold increase of the proliferation rate (Fig. 3A), andthe apoptosis rate analyzed by TUNEL increased morethan 15-fold (Fig. 3B) compared with normoglycemic con-trol rats. In the nonresponding rats (4 of 12), the pro-liferation rate also increased 4-fold (Fig. 3A), but theapoptosis rate increased even more than 20-fold (Fig. 3B).
The 12 rats on anti–TNF-a monotherapy, all nonres-ponding irrespective of the blood glucose concentration atstart of therapy (Fig. 2B), showed a 5-fold increase of theproliferation rate (Fig. 3A) at the day of T1D manifesta-tion and a 17-fold increase of the apoptosis rate (Fig. 3B).
Immediately after the end of combination therapy, theproliferation rate was still as high as before the start oftherapy in the responding rats (Fig. 3A). The apoptosisrate was strongly reduced, being close to that of healthycontrol animals (Fig. 3B).
In the nonresponding rats, proliferation and apoptosisrates were very low after anti–TNF-a therapy and aftercombination therapy due to the nearly complete b-cellloss in the islets (Fig. 3A and B).
At 60 days after the end of therapy, rats successfullytreated with the combination therapy showed virtuallynormal proliferation and apoptosis rates, as in healthycontrols (Fig. 3A and B). All b-cells were lost after anti–TNF-a monotherapy (Fig. 3A and B) and after combina-tion therapy in the nonresponding rats (Fig. 3A and B).
Changes in Proliferation-to-Apoptosis Ratios in b-CellsCalculation of the proliferation-to-apoptosis ratiosrevealed an increase to values in the range of the healthycontrol rats only in rats responding to therapy, but theincrease was persistent only after combination therapybut not anti-TCR monotherapy. Anti–TNF-a monother-apy did not even cause a transient ratio increase (Supple-mentary Table 4).
Infiltration ScoreOn the day of T1D manifestation, before the start oftherapy, the infiltration score of the islets was .3 (Fig.3C). The score was reduced to values of ;2 at the end ofcombination therapy for the responding and nonrespond-ing animals (Fig. 3C). At 60 days after the end of combi-nation therapy, the infiltration score in the pancreaseswith the regenerated b-cells was reduced to ,0.1, withonly single nonactivated macrophages being left in theresponding animals (Fig. 3C). In the nonrespondingrats, islet infiltration was absent after anti–TNF-a aswell as after combination therapy due to the completeloss of b-cells (Fig. 3C).
b-Cell MassOn the day of T1D manifestation, before the start oftherapy, the b-cell mass of the pancreases in all rats wasreduced to approximately one-third of the value in thecontrol rats (Fig. 3D). Immediately after the end of
2882 TNF-a/Anti-TCR Therapy Reverses Diabetic State Diabetes Volume 64, August 2015

Figure 1—Effects of combination therapy with anti–TNF-a (5 mg/kg bw) for 5 days and anti-TCR (0.5 mg/kg bw) for 5 days and effects ofmonotherapy with anti–TNF-a (5 mg/kg bw) for 5 days on the metabolic profile of IDDM rats after T1D manifestation. A: Blood glucoseconcentration (mmol/L) changes are shown for rats responding to the combination therapy (n = 8) and for rats nonresponding to themonotherapy (n = 12). B: Blood glucose concentration (mmol/L) changes are shown for healthy (n = 5) rats and untreated diabetic (n = 5)rats. The first dashed line at day 0 indicates the start of therapy, and the second dashed line at day 5 indicates the end of therapy. C: SerumC-peptide concentration changes (pmol/L) are shown for rats responding (n = 8) and not responding (n = 4) to the combination of anti–TNF-aand anti-TCR and for nonresponding rats with anti–TNF-amonotherapy (n = 12) at different times during the observation period. Data are meanvalues 6 SEM. *P < 0.05 for combination therapy compared with monotherapy.
diabetes.diabetesjournals.org Jörns and Associates 2883

anti–TNF-a monotherapy, the pancreatic b-cell mass wasreduced even more, to ,10%. But immediately after theend of successful combination therapy, the pancreaticb-cell mass had more than doubled from the value beforetherapy, reaching in the responding animals .80% ofthe value in the healthy control rats (Fig. 3D). At 60days after the end of combination therapy, the pancre-atic b-cell mass had attained normal values in these rats(Fig. 3D). In the nonresponding animals, b-cell masswas further reduced strongly already during therapy,and b-cells were completely lost 60 days thereafter(Fig. 3D).
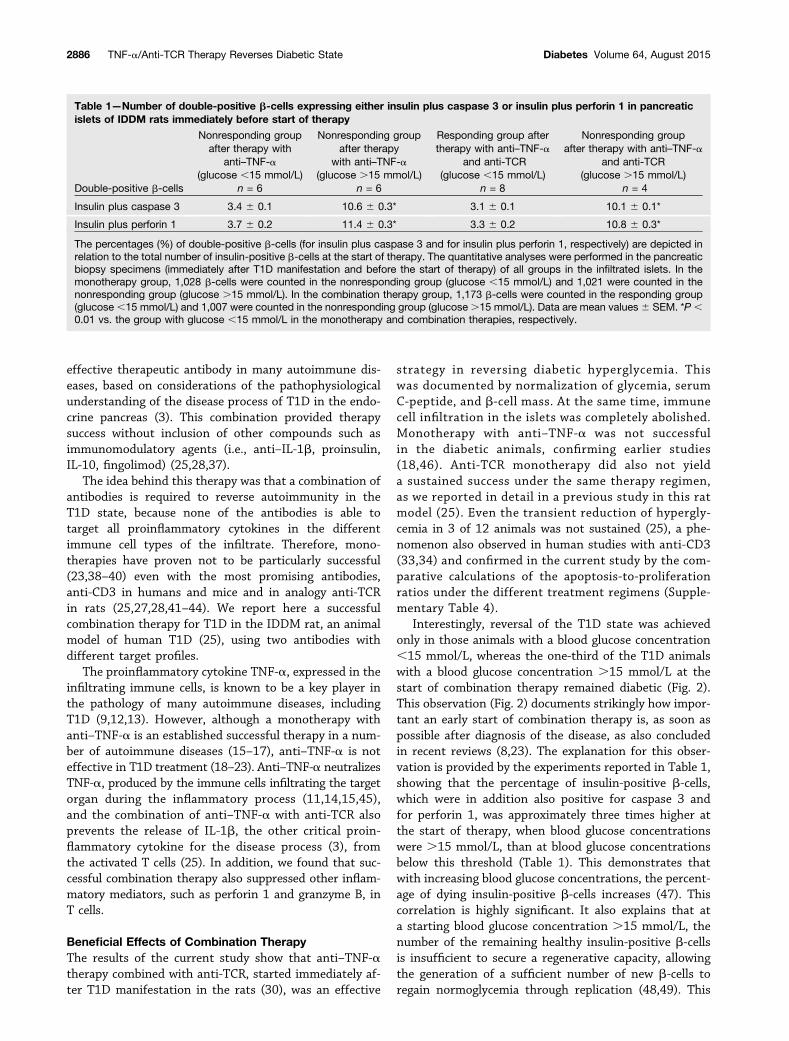
Increased Rate of b-Cell Demise at High BloodGlucose ConcentrationsA deeper analysis of the situation immediately before thestart of therapy revealed that the percentage of insulin-positive b-cells in the pancreases was comparably highin all therapy groups (Fig. 3D), irrespective of a blood
glucose value ,15 mmol/L or .15 mmol/L at the startof therapy. However, the percentage of insulin-positiveb-cells that were positive in addition for caspase 3and perforin 1 was approximately three times higherwhen the blood glucose concentration at the start oftherapy was .15 mmol/L (Table 1), indicating an ac-celerated b-cell death rate of the residual b-cells inthe islets of the pancreases of diabetic rats with bloodglucose .15 mmol/L.
The correlation coefficients between an increase ofblood glucose and an increase of caspase 3 and perforin 1were r = 0.947 and r = 0.953, respectively (both P ,0.001), for the values (n = 24) in Table 1.
Changes of the Immune Cell Infiltration Pattern inPancreatic Islets in Response to TherapyOn the day of T1D manifestation, a strong immune cellinfiltration composed of 45% CD8 T cells, 5% CD4 T cells,40% CD68 macrophages, and 10% of other immune celltypes was observed in the islets in responding andnonresponding rats, with a concomitant loss of b-cells(Fig. 4A–D and Supplementary Fig. 1A and B, respectively)(3).
Immediately after the end of combination therapy withanti–TNF-a and anti-TCR, immune cell infiltration wasstill substantially reduced by.50% in responding animalscompared with the situation before the start of therapy(Fig. 4A–D). Immune cell infiltration was also reduced inthe nonresponding rats; however, this went along witha loss of b-cells (Supplementary Fig. 1A and B). At 60 daysafter the end of therapy, islet immune cell infiltration wasentirely absent after combination therapy in the respondingrats (Fig. 4A–D) in pancreases with a normal islet b-cell massnot different from that in healthy control animals. In pan-creases of nonresponding rats with islets lacking b-cells, onlyoccasional single nonactivated immune cells were observed(Supplementary Fig. 1A and B).
Gene Expression Changes in Activated Immune Cellsin Pancreatic Islets During TherapyImmune cells were activated in diabetic rats. This wasdocumented by high gene expression levels of theproinflammatory cytokines, Tnf and Il1b (Fig. 5A and B),as well as of the CD8 marker, Gzmb, in the infiltratingimmune cells (Fig. 5C), and of the proapoptotic enzyme,Casp3, in the b-cells (Fig. 5D) before start of therapy. At60 days after the end of combination therapy, an expres-sion of these genes was virtually completely lost in thenoninfiltrated islets of the responding rats (Fig. 5A-D). Inboth groups nonresponding to therapy, a few activatedimmune cells were observed, but only in the perivascularspace, which was not surprising in view of the completeb-cell loss (Supplementary Fig. 1C and D).
Changes of Pro- and Anti-Inflammatory Cytokines andT-Cell Markers in the Circulation and in Pancreas-Draining Lymph Nodes During TherapyIn the animals responding to combination therapy, theserum protein concentrations of the proinflammatory
Figure 2—Relation between blood glucose concentration (mmol/L)at the start of therapy and b-cell mass (mg) 60 days after end oftherapy in IDDM rats after therapy with anti–TNF-a (A) and combi-nation therapy with anti–TNF-a and anti-TCR (B). b-Cell mass wassignificantly (P< 0.05) higher in animals with starting blood glucoseconcentrations <15 mmol/L compared with those >15 mmol/L. Inthe two subgroups with combination therapy, the blood glucoseconcentrations were also significantly different.
2884 TNF-a/Anti-TCR Therapy Reverses Diabetic State Diabetes Volume 64, August 2015

cytokines TNF-a and IL-1b were as low as in healthycontrol animals (Fig. 6A and B). Both in animals non-responding to monotherapy and combination therapy,TNF-a and IL-1b serum protein concentrations remainedsignificantly (P , 0.01) increased (Fig. 6A and B). Theproinflammatory cytokine interferon-g (IFN-g) was un-changed in all groups compared with the control groups(Fig. 6C). The increased levels of the immune cell–activatingcytokine IL-2 in diabetic rats decreased only in animalsresponding to combination therapy with a significant(P , 0.05) reduction compared with the animalsnonresponsive to the therapies (Fig. 6D). Only aftersuccessful combination therapy was the protein con-centration of the anti-inflammatory cytokine IL-4 in-creased, reaching levels close to those of the healthyrats (Fig. 6E). After anti–TNF-a therapy, alone and
combined with anti-TCR, the concentrations of theanti-inflammatory cytokine IL-10 were significantly(P , 0.01) increased, irrespective of therapy success(Fig. 6F).
The same changes of the pro- and anti-inflammatorycytokines as well as of the CD8 T-cell markers granzyme Band perforin 1 on the level of gene (Supplementary Table5) and protein (Supplementary Table 6) expression wereobserved in the immune cells in the pancreas-draininglymph nodes 60 days after the end of therapy in theresponding and the nonresponding rats.
DISCUSSION
This therapy combines two antibodies, anti-TCR directedagainst the TCR/CD3 complex, as a cornerstone com-pound in anti–T-cell therapy, and anti–TNF-a, the most
Figure 3—Morphometric analyses of b-cells and immune cells in IDDM rats after successful and nonsuccessful combination therapy withanti–TNF-a and anti-TCR or after nonsuccessful therapy with anti–TNF-a alone after T1D manifestation. Changes in the rate of proliferation(A), apoptosis (B), islet infiltration scores (C), and pancreas b-cell mass (D). Rats were treated with anti–TNF-a alone or combined with anti-TCR, leading to a group of animals responding with a reversal of T1D or to a group of nonresponding animals with a sustained diabeticstate compared with healthy control rats (n = 4) and untreated rats with T1D for 1 day (n = 4). Measurements were performed beforetherapy, at the end of therapy, and at 60 days after the end of therapy. Data are mean values 6 SEM. *P < 0.05 vs. healthy control rats,which showed no signs of immune cell infiltration. Numbers of pancreases analyzed as given in Fig. 1. Islet infiltration was gradedaccording to the following score: stage 0, no immune cell infiltration (control); stage 1, immune cell infiltration restricted to the periphery;stage 2, weak invasive immune cell infiltration; stage 3, strong invasive immune cell infiltration; stage 4, complete b-cell loss withoutinfiltration.
diabetes.diabetesjournals.org Jörns and Associates 2885
effective therapeutic antibody in many autoimmune dis-eases, based on considerations of the pathophysiologicalunderstanding of the disease process of T1D in the endo-crine pancreas (3). This combination provided therapysuccess without inclusion of other compounds such asimmunomodulatory agents (i.e., anti–IL-1b, proinsulin,IL-10, fingolimod) (25,28,37).
The idea behind this therapy was that a combination ofantibodies is required to reverse autoimmunity in theT1D state, because none of the antibodies is able totarget all proinflammatory cytokines in the differentimmune cell types of the infiltrate. Therefore, mono-therapies have proven not to be particularly successful(23,38–40) even with the most promising antibodies,anti-CD3 in humans and mice and in analogy anti-TCRin rats (25,27,28,41–44). We report here a successfulcombination therapy for T1D in the IDDM rat, an animalmodel of human T1D (25), using two antibodies withdifferent target profiles.
The proinflammatory cytokine TNF-a, expressed in theinfiltrating immune cells, is known to be a key player inthe pathology of many autoimmune diseases, includingT1D (9,12,13). However, although a monotherapy withanti–TNF-a is an established successful therapy in a num-ber of autoimmune diseases (15–17), anti–TNF-a is noteffective in T1D treatment (18–23). Anti–TNF-a neutralizesTNF-a, produced by the immune cells infiltrating the targetorgan during the inflammatory process (11,14,15,45),and the combination of anti–TNF-a with anti-TCR alsoprevents the release of IL-1b, the other critical proin-flammatory cytokine for the disease process (3), fromthe activated T cells (25). In addition, we found that suc-cessful combination therapy also suppressed other inflam-matory mediators, such as perforin 1 and granzyme B, inT cells.
Beneficial Effects of Combination TherapyThe results of the current study show that anti–TNF-atherapy combined with anti-TCR, started immediately af-ter T1D manifestation in the rats (30), was an effective
strategy in reversing diabetic hyperglycemia. Thiswas documented by normalization of glycemia, serumC-peptide, and b-cell mass. At the same time, immunecell infiltration in the islets was completely abolished.Monotherapy with anti–TNF-a was not successfulin the diabetic animals, confirming earlier studies(18,46). Anti-TCR monotherapy did also not yielda sustained success under the same therapy regimen,as we reported in detail in a previous study in this ratmodel (25). Even the transient reduction of hypergly-cemia in 3 of 12 animals was not sustained (25), a phe-nomenon also observed in human studies with anti-CD3(33,34) and confirmed in the current study by the com-parative calculations of the apoptosis-to-proliferationratios under the different treatment regimens (Supple-mentary Table 4).
Interestingly, reversal of the T1D state was achievedonly in those animals with a blood glucose concentration,15 mmol/L, whereas the one-third of the T1D animalswith a blood glucose concentration .15 mmol/L at thestart of combination therapy remained diabetic (Fig. 2).This observation (Fig. 2) documents strikingly how impor-tant an early start of combination therapy is, as soon aspossible after diagnosis of the disease, as also concludedin recent reviews (8,23). The explanation for this obser-vation is provided by the experiments reported in Table 1,showing that the percentage of insulin-positive b-cells,which were in addition also positive for caspase 3 andfor perforin 1, was approximately three times higher atthe start of therapy, when blood glucose concentrationswere .15 mmol/L, than at blood glucose concentrationsbelow this threshold (Table 1). This demonstrates thatwith increasing blood glucose concentrations, the percent-age of dying insulin-positive b-cells increases (47). Thiscorrelation is highly significant. It also explains that ata starting blood glucose concentration .15 mmol/L, thenumber of the remaining healthy insulin-positive b-cellsis insufficient to secure a regenerative capacity, allowingthe generation of a sufficient number of new b-cells toregain normoglycemia through replication (48,49). This
Table 1—Number of double-positive b-cells expressing either insulin plus caspase 3 or insulin plus perforin 1 in pancreaticislets of IDDM rats immediately before start of therapy
Nonresponding groupafter therapy with
anti–TNF-a(glucose ,15 mmol/L)
Nonresponding groupafter therapy
with anti–TNF-a(glucose .15 mmol/L)
Responding group aftertherapy with anti–TNF-a
and anti-TCR(glucose ,15 mmol/L)
Nonresponding groupafter therapy with anti–TNF-a
and anti-TCR(glucose .15 mmol/L)
Double-positive b-cells n = 6 n = 6 n = 8 n = 4
Insulin plus caspase 3 3.4 6 0.1 10.6 6 0.3* 3.1 6 0.1 10.1 6 0.1*
Insulin plus perforin 1 3.7 6 0.2 11.4 6 0.3* 3.3 6 0.2 10.8 6 0.3*
The percentages (%) of double-positive b-cells (for insulin plus caspase 3 and for insulin plus perforin 1, respectively) are depicted inrelation to the total number of insulin-positive b-cells at the start of therapy. The quantitative analyses were performed in the pancreaticbiopsy specimens (immediately after T1D manifestation and before the start of therapy) of all groups in the infiltrated islets. In themonotherapy group, 1,028 b-cells were counted in the nonresponding group (glucose ,15 mmol/L) and 1,021 were counted in thenonresponding group (glucose .15 mmol/L). In the combination therapy group, 1,173 b-cells were counted in the responding group(glucose ,15 mmol/L) and 1,007 were counted in the nonresponding group (glucose .15 mmol/L). Data are mean values 6 SEM. *P ,0.01 vs. the group with glucose ,15 mmol/L in the monotherapy and combination therapies, respectively.
2886 TNF-a/Anti-TCR Therapy Reverses Diabetic State Diabetes Volume 64, August 2015

Figure 4—Immune cell infiltration in pancreatic islets of IDDM rats after successful combination therapy with anti–TNF-a and anti-TCR.A–D: b-Cells (green) and immune cells (red) were examined in islets from animals successfully treated with the combination of anti–TNF-aand anti-TCR after T1D manifestation. The amount of b-cells and immune cells in the first biopsy specimen (collected before start oftherapy) was representative for spontaneous disease development without therapy. The second biopsy was collected at the end of therapy.The results obtained in the first and second biopsy samples were compared with the immune cell–free islets in the same pancreasesobtained after 60 days without therapy. Islets were immunostained for insulin (Ins) (green) and CD8 T cells (red) (A and C) or CD68macrophages (red) and counterstained with DAPI (blue) (B and D). Erythrocytes were identified by yellow color through autofluorescencein the red and green channel. A, B at low and C, D at high magnification; numbers of pancreases analyzed as given in Fig. 1.
diabetes.diabetesjournals.org Jörns and Associates 2887

capacity of the b-cells to regenerate and normalize b-cellmass in rats with blood glucose ,15 mmol/L could berecovered under combination therapy but not undermonotherapy, convincingly emphasizing the crucial im-portance of the antibody combination for therapy success.
Cytokine Profile Changes as Biomarkers for Successof Combination TherapyThe changes in different cytokines and chemokines inthe circulation, as observed under therapy in the currentstudy, mirrored the corresponding changes in theinfiltrated islets and thus represent reliable biomarkersto monitor disease progression and therapeutic successin this T1D rat model. This could not be documented sofar in patients with T1D (50). In an experimental ap-proach, such as the one used in the IDDM rat in thepresent and in previous studies for mono- and combina-tion therapies (25,36), pancreatic tissue could be directlyaccessed for b-cell analyses by biopsies. Restitution ofnormoglycemia and serum C-peptide induced by b-cellmass restoration in the pancreas correlated with a normal-ization of the cytokine and chemokine protein expressionprofile in serum and pancreas-draining lymph nodes. Thiswas documented by a reduction of the increased levels ofthe proinflammatory cytokines TNF-a and IL-1b and thechemokine (C-C motif) ligand-2 (MCP-1) as well as theT-cell markers perforin 1 and granzyme B to the normalrange typical for the healthy state along with an increase ofthe anti-inflammatory cytokine IL-4.
This profile normalization in the circulation not onlyaccompanied the loss of pancreatic islet infiltration byactivated immune cells but also went along with a nor-malization of the cytokine and chemokine protein ex-pression profile in the pancreas-draining lymph nodes.Thus, changes in the protein expression profile in serumare reliable biomarkers for documentation of therapysuccess achieved in the endocrine pancreas and in theneighboring lymph nodes.
ConclusionsThe results can be summarized as follows:
1. A sufficient number of intact b-cells is required to allowa reversal of the diabetic state through proliferation ofexisting b-cells.
2. Therefore, an immediate start of therapy after T1Ddiagnosis is necessary to secure therapy success.
3. The proinflammatory cytokines TNF-a and IL-1b, bothhighly expressed in the activated immune cells of theislet infiltrate in the T1D pancreas, are targeted,thereby securing therapy success of this combination.
4. The results show convincingly that antibodies, whichare not effective alone, can reverse T1D in combinationtherapy successfully.
Combination therapy might thus be an attractive optionin the future because monotherapy prevention studieshave been ineffective not only in the IDDM rat modelbut also in patients with T1D (30,38–40), as advocatedby several scientists recently (6–8). Because the potentialto optimize therapy success through dose increases ofanti-CD3 and anti-TCR is limited due to T-cell reductionin the circulation, which develops under this therapy,
Figure 5—Immune cell activation detected by gene expression inrepresentative pancreatic islets of IDDM rats after successful com-bination therapy with anti–TNF-a and anti-TCR. Gene expressionlevels (in situ RT-PCR) were determined for proinflammatory cyto-kines Tnf (A), Il1b (B), the CD8 marker Gzmb (C), and the apoptoticmarker Casp3 (D). Islets from rats that had returned to normogly-cemia after combination therapy with anti–TNF-a and anti-TCRwere compared with islets from untreated acutely diabetic animals.The dashed lines highlight the borders of the islets. Photomicro-graphs are representative for 80 islets analyzed in each group.Numbers of pancreases analyzed as given in Fig. 1.
2888 TNF-a/Anti-TCR Therapy Reverses Diabetic State Diabetes Volume 64, August 2015

combination with other immunomodulatory compoundsmight be the best solution to minimize such undesirableadverse effects.
The future will probably also see therapies withcombinations of more than two agents. This couldbe, for example, a combination of anti-TCR/CD3 with
Figure 6—Cytokine pattern in serum of IDDM rats after successful combination therapy with anti–TNF-a and anti-TCR or after non-successful therapy with anti–TNF-a alone after T1D manifestation. Changes in protein concentrations of cytokines measured by multiplexanalysis were examined: TNF-a (A), IL-1b (B), IFN-g (C ), IL-2 (D), IL-4 (E ), and IL-10 (F ). Results after therapy with anti–TNF-a alone orcombined with anti-TCR, subdivided by responding and nonresponding groups, were compared with those from healthy control rats anduntreated acutely diabetic rats. Cytokine protein concentrations (pg/mL) are expressed as mean values6 SEM. A–F: The dotted lines showchanges in the proinflammatory and anti-inflammatory cytokines compared with the healthy control. *P < 0.01 vs. the untreated diabeticcontrols; #P and **P < 0.05 vs. untreated diabetic control rats. Number of animals as given in Fig. 1.
diabetes.diabetesjournals.org Jörns and Associates 2889

anti–TNF-a, which both target the immune cells in theinfiltrate directly, with a compound such as fingolimod(25,36), which prevents the migration of activated lym-phocytes into the islets from the lymph nodes that sur-round the pancreas. Therapy success can thereby bemaximized along with a reduction of the doses of thedifferent compounds and a minimization of their adverseeffects. This is likely to be a better option than theattempt to identify subgroups of patients with T1Dwho might respond, even only transiently, to anti-CD3monotherapy (51).
Acknowledgments. The authors thank M. Jentzsch and D. Lischke (bothfrom the Insitute of Clinical Biochemistry, Hannover Medical School, Hannover,Germany) for skillful technical assistance.Funding. This work was supported by grants from Deutsche Forschungsge-meinschaft (JO 395/2-1) and the European Union (Collaborative Project NAIMIT inthe 7th Framework Programme, Contract No. 241447).Duality of Interest. No potential conflicts of interest relevant to this articlewere reported.Author Contributions. A.J. designed the study, performed experiments,analyzed and interpreted data, and wrote the manuscript. Ü.G.E. performedexperiments, analyzed data, and contributed to writing the manuscript. T.A.and T.T. performed experiments. D.W. provided materials and reviewed themanuscript. S.L. designed the study, analyzed and interpreted data, and wrotethe manuscript. A.J. is the guarantor of this work, and, as such, had full accessto all the data in the study and takes responsibility for the integrity of the data andthe accuracy of data analysis.
References1. Eisenbarth GS. Type I diabetes. Molecular, cellular and clinical immunology[Internet], 2012. Available from http://www.ucdenver.edu/academics/colleges/medicalschool/centers/BarbaraDavis/OnlineBooks/Pages/Type1Diabetes.aspx.
Accessed 27 March 20152. Knight RR, Kronenberg D, Zhao M, et al. Human b-cell killing by autoreactivepreproinsulin-specific CD8 T cells is predominantly granule-mediated with the potency
dependent upon T-cell receptor avidity. Diabetes 2013;62:205–2133. Jörns A, Arndt T, Meyer zu Vilsendorf A, et al. Islet infiltration, cytokine ex-
pression and beta cell death in the NOD mouse, BB rat, Komeda rat, LEW.1AR1-iddm rat and humans with type 1 diabetes. Diabetologia 2014;57:512–5214. Arnush M, Scarim AL, Heitmeier MR, Kelly CB, Corbett JA. Potential role of
resident islet macrophage activation in the initiation of autoimmune diabetes.J Immunol 1998;160:2684–26915. Jörns A, Günther A, Hedrich HJ, Wedekind D, Tiedge M, Lenzen S. Immune
cell infiltration, cytokine expression, and beta-cell apoptosis during the de-velopment of type 1 diabetes in the spontaneously diabetic LEW.1AR1/Ztm-iddmrat. Diabetes 2005;54:2041–20526. Matthews JB, Staeva TP, Bernstein PL, Peakman M, von Herrath M; ITN-JDRF Type 1 Diabetes Combination Therapy Assessment Group. Developing
combination immunotherapies for type 1 diabetes: recommendations from theITN-JDRF Type 1 Diabetes Combination Therapy Assessment Group. Clin Exp
Immunol 2010;160:176–1847. Rydén AK, Wesley JD, Coppieters KT, Von Herrath MG. Non-antigenic andantigenic interventions in type 1 diabetes. Hum Vaccin Immunother 2014;10:
838–8468. Ludvigsson J. Combination therapy for preservation of beta cell function inType 1 diabetes: new attitudes and strategies are needed! Immunol Lett 2014;
159:30–359. Koulmanda M, Bhasin M, Awdeh Z, et al. The role of TNF-a in mice withtype 1- and 2- diabetes. PLoS One 2012;7:e33254
10. Feldmann M. Development of anti-TNF therapy for rheumatoid arthritis. NatRev Immunol 2002;2:364–37111. Bandzar S, Gupta S, Platt MO. Crohn’s disease: a review of treatment
options and current research. Cell Immunol 2013;286:45–5212. Parameswaran N, Patial S. Tumor necrosis factor-a signaling in macro-
phages. Crit Rev Eukaryot Gene Expr 2010;20:87–10313. Nepom GT, Ehlers M, Mandrup-Poulsen T. Anti-cytokine therapies in T1D:concepts and strategies. Clin Immunol 2013;149:279–28514. Plevy SE, Landers CJ, Prehn J, et al. A role for TNF-alpha and mucosal Thelper-1 cytokines in the pathogenesis of Crohn’s disease. J Immunol 1997;159:
6276–628215. Kalden JR. Anti-TNF therapy: what have we learned in 12 years? ArthritisRes Ther 2011;13(Suppl. 1):S116. Murdaca G, Spanò F, Puppo F. Current therapies for the treatment ofsystemic sclerosis-related pulmonary arterial hypertension: efficacy and safety.
Expert Opin Drug Saf 2014;13:295–30517. Murdaca G, Gulli R, Spanò F, et al. TNF-a gene polymorphisms: association
with disease susceptibility and response to anti-TNF-a treatment in psoriaticarthritis. J Invest Dermatol 2014;134:2503–250918. Mastrandrea L, Yu J, Behrens T, et al. Etanercept treatment in children with
new-onset type 1 diabetes: pilot randomized, placebo-controlled, double-blindstudy. Diabetes Care 2009;32:1244–124919. Arif S, Cox P, Afzali B, et al. Anti-TNFalpha therapy—killing two birds withone stone? Lancet 2010;375:227820. Palazzi C, D’Angelo S, Leccese P, Padula A, Olivieri I. Safety of anti-tumor
necrosis factor agents in psoriatic arthritis - an update. Expert Opin Drug Saf2014;13:191–19621. Donath MY, Hess C, Palmer E. What is the role of autoimmunity in type 1diabetes? A clinical perspective. Diabetologia 2014;57:653–65522. Roep BO, Buckner J, Sawcer S, Toes R, Zipp F. The problems and promises
of research into human immunology and autoimmune disease. Nat Med 2012;18:48–5323. Roep BO, Tree TI. Immune modulation in humans: implications for type 1diabetes mellitus. Nat Rev Endocrinol 2014;10:229–24224. Lenzen S. Oxidative stress: the vulnerable beta-cell. Biochem Soc Trans
2008;36:343–34725. Jörns A, Akin M, Arndt T, et al. Anti-TCR therapy combined with fin-
golimod for reversal of diabetic hyperglycemia by b cell regeneration in theLEW.1AR1-iddm rat model of type 1 diabetes. J Mol Med (Berl) 2014;92:
743–75526. Sherry NA, Chen W, Kushner JA, et al. Exendin-4 improves reversal ofdiabetes in NOD mice treated with anti-CD3 monoclonal antibody by enhancing
recovery of beta-cells. Endocrinology 2007;148:5136–514427. Ablamunits V, Henegariu O, Hansen JB, et al. Synergistic reversal of type 1
diabetes in NOD mice with anti-CD3 and interleukin-1 blockade: evidence ofimproved immune regulation. Diabetes 2012;61:145–15428. Takiishi T, Korf H, Van Belle TL, et al. Reversal of autoimmune diabetes byrestoration of antigen-specific tolerance using genetically modified Lactococcuslactis in mice. J Clin Invest 2012;122:1717–172529. Pagni PP, Bresson D, Rodriguez-Calvo T, et al. Combination therapy with ananti-IL-1b antibody and GAD65 DNA vaccine can reverse recent-onset diabetes
in the RIP-GP mouse model. Diabetes 2014;63:2015–202530. Lenzen S, Tiedge M, Elsner M, et al. The LEW.1AR1/Ztm-iddm rat: a new
model of spontaneous insulin-dependent diabetes mellitus. Diabetologia 2001;44:1189–119631. Arndt T, Wedekind D, Weiss H, et al. Prevention of spontaneous immune-
mediated diabetes development in the LEW.1AR1-iddm rat by selective CD8+ Tcell transfer is associated with a cytokine shift in the pancreas-draining lymph
nodes. Diabetologia 2009;52:1381–139032. Hünig T, Wallny HJ, Hartley JK, Lawetzky A, Tiefenthaler G. A monoclonal
antibody to a constant determinant of the rat T cell antigen receptor that induces
2890 TNF-a/Anti-TCR Therapy Reverses Diabetic State Diabetes Volume 64, August 2015
T cell activation. Differential reactivity with subsets of immature and mature Tlymphocytes. J Exp Med 1989;169:73–8633. Chatenoud L. Immune therapy for type 1 diabetes mellitus-what is uniqueabout anti-CD3 antibodies? Nat Rev Endocrinol 2010;6:149–15734. Aronson R, Gottlieb PA, Christiansen JS, et al.; DEFEND Investigator Group.Low-dose otelixizumab anti-CD3 monoclonal antibody DEFEND-1 study: resultsof the randomized phase III study in recent-onset human type 1 diabetes. Di-abetes Care 2014;37:2746–275435. Matsumoto Y, Tsuchida M, Hanawa H, Abo T. Successful prevention andtreatment of autoimmune encephalomyelitis by short-term administration of anti-T-cell receptor alpha beta antibody. Immunology 1994;81:1–736. Jörns A, Rath KJ, Terbish T, et al. Diabetes prevention by immunomodu-latory FTY720 treatment in the LEW.1AR1-iddm rat despite immune cell acti-vation. Endocrinology 2010;151:3555–356537. Bresson D, Togher L, Rodrigo E, et al. Anti-CD3 and nasal proinsulincombination therapy enhances remission from recent-onset autoimmune di-abetes by inducing Tregs. J Clin Invest 2006;116:1371–138138. Bluestone JA, Herold K, Eisenbarth G. Genetics, pathogenesis and clinicalinterventions in type 1 diabetes. Nature 2010;464:1293–130039. Chatenoud L, Warncke K, Ziegler AG. Clinical immunologic interventions forthe treatment of type 1 diabetes. Cold Spring Harb Perspect Med 2012;2:a00771640. von Herrath M. Combination therapies for type 1 diabetes: why not now?Immunotherapy 2010;2:289–29141. Sempé P, Bédossa P, Richard MF, Villà MC, Bach JF, Boitard C. Anti-alpha/betaT cell receptor monoclonal antibody provides an efficient therapy for autoimmunediabetes in nonobese diabetic (NOD) mice. Eur J Immunol 1991;21:1163–116942. Keymeulen B, Walter M, Mathieu C, et al. Four-year metabolic outcome ofa randomised controlled CD3-antibody trial in recent-onset type 1 diabetic
patients depends on their age and baseline residual beta cell mass. Diabetologia2010;53:614–62343. Sherry N, Hagopian W, Ludvigsson J, et al.; Protégé Trial Investigators.Teplizumab for treatment of type 1 diabetes (Protégé study): 1-year results froma randomised, placebo-controlled trial. Lancet 2011;378:487–49744. Herold KC, Gitelman SE, Willi SM, et al. Teplizumab treatment may improveC-peptide responses in participants with type 1 diabetes after the new-onsetperiod: a randomised controlled trial. Diabetologia 2013;56:391–40045. Katz LH, Kopylov U, Fudim E, et al. Expression of IL-2, IL-17 and TNF-alphain patients with Crohn’s disease treated with anti-TNF antibodies. Clin ResHepatol Gastroenterol 2014;38:491–49846. Peters MJ. Etanercept treatment in children with new-onset type 1 diabetes:pilot randomized, placebo-controlled, double-blind study: response to Mastrandreaet al. Diabetes Care 2009;32:e153; author reply e15447. Liadis N, Murakami K, Eweida M, et al. Caspase-3-dependent beta-cellapoptosis in the initiation of autoimmune diabetes mellitus. Mol Cell Biol 2005;25:3620–362948. Khalaileh A, Gonen-Gross T, Magenheim J, et al. Determinants of pancreaticbeta-cell regeneration. Diabetes Obes Metab 2008;10(Suppl. 4):128–13549. Bonner-Weir S, Li WC, Ouziel-Yahalom L, Guo L, Weir GC, Sharma A. Beta-cell growth and regeneration: replication is only part of the story. Diabetes 2010;59:2340–234850. Schloot NC, Hanifi-Moghaddam P, Aabenhus-Andersen N, et al. Associationof immune mediators at diagnosis of type 1 diabetes with later clinical remission.Diabet Med 2007;24:512–52051. Demeester S, Keymeulen B, Kaufman L, et al. Preexisting insulin auto-antibodies predict efficacy of otelixizumab in preserving residual b-cell functionin recent-onset type 1 diabetes. Diabetes Care 2015;38:644–651
diabetes.diabetesjournals.org Jörns and Associates 2891