$909 million in total revenue, an increase of 22% over fiscal 2010 ...€¦ · t red hat introduced...
TRANSCRIPT

ANNUAL REPORT 2011
JAMES M. WHITEHURSTPresident and Chief Executive OfficerRed Hat, Inc.
FINANCIAL RESULTS FOR FISCAL YEAR 2011$909 million in total revenue, an increase of 22% over fiscal 2010$107 million in net income, or $0.55 per diluted share $772 million in deferred revenue at the end of fiscal 2011, an increase
of 20% over fiscal 2010$291 million in operating cash flow, an increase of 14% over fiscal 2010$1.2 billion in cash and investments at the end of fiscal 2011
Dear Red Hat Stockholder:
It is my pleasure to write to you following another strong year for Red Hat. Focused execution by our global organization, an improved IT spending environment and Red Hat’s growing market position enabled the Company to deliver accelerated growth across a number of our key financial metrics – including revenue, net income, deferred revenue and operating cash flow.
Our growth is the result of strong demand across multiple products and geographies and was driven by customers modernizing their data centers and preparing their IT infrastructure for cloud computing. As shifts in IT architecture continue to evolve, our products and services offer customers an opportunity to increase the efficiency of their existing infrastructure and provide more choice and flexibility in the future.
In fiscal 2011, we continued to invest in both sales and engineering which allowed us to expand the adoption of our portfolio of solutions in middleware, cloud computing and virtualization. While our investments and initiatives enabled Red Hat to deliver strong revenue growth, we also continued to manage our overall cost structure effectively, which resulted in operating income growth and expanded margins.
In addition to the strong financial results, here are just a few of the business highlights from fiscal 2011:
For the seventh consecutive year, Red Hat was chosen as one of the top IT vendors for delivering value in the independent Ziff Davis CIO Insight 2010 Vendor Value Study. All Red Hat associates take great pride in the trust and loyalty our customers place in us.
Red Hat launched the latest version of our flagship operating system, Red Hat Enterprise Linux 6 (RHEL 6) with broad support from strategic partners. RHEL 6 is the result of collaborative efforts from many of the top global technology companies and the vast Linux community. The architecture of RHEL 6 is designed to address the shifts in the modern IT environment, whether physical, virtual, or cloud.
Red Hat introduced Cloud Foundations, a flexible architecture for cloud computing that is based on our platform, virtualization and middleware products. Cloud Foundations provides customers with software technologies needed to support the next generation of IT infrastructure.
Red Hat acquired Makara, a developer of deployment and management solutions for applications in the cloud. Makara's technologies are being used to accelerate the development of Red Hat's platform-as-a-service offerings.
We believe that what began as a better way to build software—openness, transparency, collaboration—has shifted the balance of power in an entire industry. Today Red Hat is the world's leading provider of Linux and open source technology. Red Hat is well positioned to extend this leadership position by bringing the benefits of emerging technologies such as cloud and virtualization to the enterprise using the open source way.
Once again, I want to thank our Red Hat associates around the globe for their contributions to the past year’s great results. I would also like to thank all of the passionate contributors to the open source community, as well as customers and partners, all of whom will continue to play a key role in our collective success for many years to come. Thank you for your continued support of Red Hat.


UNITED STATESSECURITIES AND EXCHANGE COMMISSION
Washington, D.C. 20549
FORM 10-KAnnual Report Pursuant to Sections 13 or 15(d) of the Securities Exchange Act of 1934
(Mark One)È Annual Report Pursuant to Section 13 or 15(d) of the Securities Exchange Act of 1934
For the fiscal year ended February 28, 2011
OR‘ Transition Report Pursuant to Section 13 or 15(d) of the Securities Exchange Act of 1934
For the transition period from to .
Commission File Number: 001-33162
RED HAT, INC.(Exact name of registrant as specified in its charter)
Delaware(State of Incorporation)
06-1364380(I.R.S. Employer Identification No.)
1801 Varsity Drive, Raleigh, North Carolina 27606(Address of principal executive offices, including zip code)
(919) 754-3700(Registrant’s telephone number, including area code)
Securities registered pursuant to Section 12(b) of the Act:Title of each class Name of each exchange on which registered
Common Stock, $0.0001 par value New York Stock Exchange
Securities registered pursuant to Section 12(g) of the Act: NoneIndicate by check mark if the registrant is a well-known seasoned issuer, as defined in Rule 405 of the Securities Act. YesÈ No‘Indicate by check mark if the registrant is not required to file reports pursuant to Section 13 or Section 15(d) of the Act. Yes‘ NoÈIndicate by check mark whether the registrant (1) has filed all reports required to be filed by Section 13 or 15(d) of the Securities ExchangeAct of 1934 during the preceding 12 months (or for such shorter period that the registrant was required to file such reports), and (2) hasbeen subject to such filing requirements for the past 90 days. YesÈ No‘Indicate by check mark whether the registrant has submitted electronically and posted on its corporate Web site, if any, every InteractiveData File required to be submitted and posted pursuant to Rule 405 of Regulation S-T (§232.405 of this chapter) during the preceding 12months (or for such shorter period that the registrant was required to submit and post such files). YesÈ No‘Indicate by check mark if disclosure of delinquent filers pursuant to Item 405 of Regulation S-K is not contained herein and will not becontained, to the best of registrant’s knowledge, in definitive proxy or information statements incorporated by reference in Part III of thisForm 10-K or any amendment to this Form 10-K.ÈIndicate by check mark whether the registrant is a large accelerated filer, an accelerated filer, a non-accelerated filer, or a smaller reportingcompany. See the definitions of “large accelerated filer,” “accelerated filer” and “smaller reporting company” in Rule 12b-2 of theExchange Act. (Check one):Large accelerated filer È Accelerated filer ‘
Non-accelerated filer ‘(Do not check if a smaller reporting company)
Smaller reporting company ‘
Indicate by check mark whether the registrant is a shell company (as defined in Rule 12b-2 of the Exchange Act). Yes ‘ No ÈThe aggregate market value of the common equity held by non-affiliates of the registrant as of August 31, 2010 was approximately $5.5billion based on the closing price of $34.55 of our common stock as reported by the New York Stock Exchange on August 31, 2010. Forpurposes of the immediately preceding sentence, the term “affiliate” consists of each director, executive officer and greater than 10%stockholder of the registrant. There were 193,024,423 shares of common stock outstanding as of April 14, 2011.
DOCUMENTS INCORPORATED BY REFERENCEPortions of Red Hat, Inc.’s Definitive Proxy Statement to be filed with the Securities and Exchange Commission and delivered tostockholders in connection with its annual meeting of stockholders to be held on August 11, 2011 are incorporated by reference into Part IIIof this Form 10-K. With the exception of the portions of the Proxy Statement expressly incorporated into this Annual Report on Form 10-Kby reference, such documents shall not be deemed filed as part of this Annual Report on Form 10-K.

TABLE OF CONTENTS
Page No.
PART IItem 1. Business . . . . . . . . . . . . . . . . . . . . . . . . . . . . . . . . . . . . . . . . . . . . . . . . . . . . . . . . . . . . . . . . . . . . 3Item 1A. Risk Factors . . . . . . . . . . . . . . . . . . . . . . . . . . . . . . . . . . . . . . . . . . . . . . . . . . . . . . . . . . . . . . . . . 19Item 1B. Unresolved Staff Comments . . . . . . . . . . . . . . . . . . . . . . . . . . . . . . . . . . . . . . . . . . . . . . . . . . . . . 35Item 2. Properties . . . . . . . . . . . . . . . . . . . . . . . . . . . . . . . . . . . . . . . . . . . . . . . . . . . . . . . . . . . . . . . . . . . 35Item 3. Legal Proceedings . . . . . . . . . . . . . . . . . . . . . . . . . . . . . . . . . . . . . . . . . . . . . . . . . . . . . . . . . . . . 35Item 4. [Removed and Reserved] . . . . . . . . . . . . . . . . . . . . . . . . . . . . . . . . . . . . . . . . . . . . . . . . . . . . . . . 37
PART IIItem 5. Market for Registrant’s Common Equity, Related Stockholder Matters and Issuer Purchases
of Equity Securities . . . . . . . . . . . . . . . . . . . . . . . . . . . . . . . . . . . . . . . . . . . . . . . . . . . . . . . . . 38Item 6. Selected Financial Data . . . . . . . . . . . . . . . . . . . . . . . . . . . . . . . . . . . . . . . . . . . . . . . . . . . . . . . . 41Item 7. Management’s Discussion and Analysis of Financial Condition and Results of Operations . . . 42Item 7A. Quantitative and Qualitative Disclosures About Market Risk . . . . . . . . . . . . . . . . . . . . . . . . . . . 61Item 8. Financial Statements and Supplementary Data . . . . . . . . . . . . . . . . . . . . . . . . . . . . . . . . . . . . . . 63Item 9. Changes in and Disagreements With Accountants on Accounting and Financial Disclosure . . . 102Item 9A. Controls and Procedures . . . . . . . . . . . . . . . . . . . . . . . . . . . . . . . . . . . . . . . . . . . . . . . . . . . . . . . . 102Item 9B. Other Information . . . . . . . . . . . . . . . . . . . . . . . . . . . . . . . . . . . . . . . . . . . . . . . . . . . . . . . . . . . . . 102
PART IIIItem 10. Directors, Executive Officers and Corporate Governance . . . . . . . . . . . . . . . . . . . . . . . . . . . . . . 103Item 11. Executive Compensation . . . . . . . . . . . . . . . . . . . . . . . . . . . . . . . . . . . . . . . . . . . . . . . . . . . . . . . 103Item 12. Security Ownership of Certain Beneficial Owners and Management and Related Stockholder
Matters . . . . . . . . . . . . . . . . . . . . . . . . . . . . . . . . . . . . . . . . . . . . . . . . . . . . . . . . . . . . . . . . . . . 103Item 13. Certain Relationships and Related Transactions, and Director Independence . . . . . . . . . . . . . . . 103Item 14. Principal Accountant Fees and Services . . . . . . . . . . . . . . . . . . . . . . . . . . . . . . . . . . . . . . . . . . . . 103
PART IVItem 15. Exhibits and Financial Statement Schedules . . . . . . . . . . . . . . . . . . . . . . . . . . . . . . . . . . . . . . . . 104
2

ITEM 1. BUSINESS
OVERVIEW
We are a global leader in providing open source software solutions to the enterprise, including our coreenterprise operating system platform, Red Hat Enterprise Linux, our enterprise middleware platform, JBossEnterprise Middleware, our virtualization and cloud solutions and other Red Hat enterprise technologies. Weemploy an open source software development and licensing model that uses the collaborative input of aninternational community of contributors to develop and enhance software. We actively participate in thiscommunity-oriented development process, often in a leadership role, and leverage it to create our Red Hat- andJBoss-branded enterprise technologies.
We believe the open source development and licensing models offer advantages over the proprietarysoftware development and licensing models both for Red Hat and our customers. Through the open sourcedevelopment model, we leverage the community of developers and users, whose collective resources andknowledge supplement the developers we employ. As a result, we believe we are able to offer functionalityenhancements and upgrades more quickly and with less development cost than is typical of many proprietarysoftware vendors. In turn, our customers are able to take advantage of the quality and value of open sourcesoftware, which we help develop, aggregate, integrate, test, certify, deliver, maintain and support for theirenterprise use.
The collectively developed software is distributed under open source licenses, such as the GNU GeneralPublic License and GNU Lesser General Public License, permitting access to the human-readable softwaresource code. These licenses also provide relatively broad rights for licensees to use, copy, modify and distributeopen source software. These broad rights afford significant latitude for our customers to inspect, suggest changes,customize or enhance the software if they so choose.
Red Hat’s participation in the community-driven development process is illustrated by Red Hat’ssponsorship role in the Fedora Project and the JBoss.org communities. This participation enables us to leveragethe efforts of these international communities, which we believe allows us to reduce both development cost andtime and to enhance community acceptance and support of our products and technologies. Thus, we are able touse the Fedora Project and the JBoss.org communities as proving grounds and virtual laboratories for innovationsthat we can draw upon for inclusion in our enterprise technologies. Additionally, the open and transparent natureof these projects provides our customers and potential customers with access and insights into the future directionof Red Hat products and technologies.
We offer a choice of operating systems and virtualization options for mainframes, servers, work stations anddesktops that support multiple application areas, including software as a service, cloud deployments,edge-of-network applications, information technology infrastructure (applications such as database, ERP andlarge web servers), mainframe computing, data centers, technical/developer workstations and corporate desktops.
JBoss Enterprise Middleware delivers a range of middleware products for developing, integrating,deploying and managing distributed composite and web-based applications. JBoss Enterprise Middleware isbased on the Java programming language that enables the deployment of service-oriented architectures. JBossEnterprise Middleware provides an application infrastructure for building and deploying distributed applicationsthat are accessible via the Internet, corporate intranets, extranets, clouds and virtual private networks. Examplesof applications deployed on JBoss Enterprise Middleware include hotel and airline reservations, online banking,credit card processing, securities trading, healthcare systems, customer and partner portals, retail andpoint-of-sale systems and telecommunications network infrastructure.
3

We also provide other infrastructure enterprise technologies, including software development tools, higheravailability clustering of systems and services, and directory services. We intend to continue to expandcapabilities available under our open source architecture to help meet the performance, security, reliability andscalability requirements critical to the enterprise.
Our hosted content distribution offerings, such as Red Hat Network (“RHN”), permit these Red Hatenterprise technologies to be updated and configured. Our management offerings, Red Hat Network Satellite(“RHN Satellite”) and JBoss Operations Network (“JBoss ON”), permit our customers to provision, update,monitor and manage these and other technologies in an automated fashion. Red Hat’s Customer Portal providescustomers with simplified and streamlined access to Red Hat support services and tools for knowledge andtroubleshooting, software downloads and account management.
Our service offerings consist of training, consulting and support designed to meet the needs of theenterprise. Our service capabilities promote further adoption and use of open source solutions within theenterprise, as well as reinforce our Red Hat and JBoss brands. Our training services consist of an array of coursesthat are designed to cover the full range of Red Hat’s products and enable customers to leverage the benefits ofour enterprise technologies in their IT environments. We also offer the services of experienced consultants toassist with the technology needs of our customers. In addition, we provide varying levels of technical supportservices to assist customers with installing, configuring and using Red Hat and JBoss enterprise technologies.
In addition to our development and licensing models, we believe that our business model differentiates RedHat from many software companies. We provide Red Hat enterprise technologies under annual or multi-yearsubscriptions. Throughout the life of a subscription, a customer is entitled to specified levels of support as well assecurity updates, bug fixes, functionality enhancements and upgrades to the technology, when and if available,via the Red Hat Customer Portal. This business model allows the customer to access consistent improvements toand innovations in our technologies and the services it needs for the duration of the subscription.
We sell subscriptions to Red Hat enterprise technologies directly to customers and indirectly throughvarious channels of distribution. We sell directly to customers through our sales force and our web store. Ourindirect sales channels include distributors, systems integrators, value added resellers (“VARs”), telecom/network technology companies, cloud computing providers, hosting providers and independent software vendors(“ISVs”). In addition, leading global server and workstation hardware original equipment manufacturers(“OEMs”) support and pre-load Red Hat enterprise technologies on various servers and workstations and also selltheir hardware together with Red Hat Enterprise Linux as part of pre-configured solutions. Red Hat EnterpriseLinux and JBoss Enterprise Middleware technologies also have gained widespread support from many of theleading ISVs and independent hardware vendors (“IHVs”). With the support and tools we make available, manyof these companies have engineered and certified that their offerings run on or with Red Hat Enterprise Linux,JBoss Enterprise Middleware technologies and Red Hat Enterprise Virtualization or, in the case of some IHVsand ISVs, have built their products using Red Hat Enterprise Linux, JBoss Enterprise Middleware and Red HatEnterprise Virtualization. We believe widespread support from these companies helps to increase the level ofmarket acceptance and adoption of our enterprise technologies.
As the benefits of open source software become more widely recognized, acceptance of open sourcesoftware by mainstream enterprise users continues to grow. We see this growth in the number of Linux serveroperating systems in use today, the increasing number of JBoss Enterprise Middleware deployments and anincreased level of interest in open source virtualization and cloud technologies.
Red Hat, Inc. was incorporated in Connecticut in March 1993 as ACC Corp., Inc., which subsequentlychanged its name to Red Hat Software, Inc. Red Hat Software, Inc. reincorporated in Delaware in September1998 and changed its name to Red Hat, Inc. in June 1999. Except as otherwise indicated, all references in thisreport to “we”, “us”, “our”, the “Company”, the “registrant”, or “Red Hat” refers to Red Hat, Inc. and itssubsidiaries.
4

INDUSTRY BACKGROUND
Origins of open source software
The open source software development model originated in academic and research environments. Themodel is based on the collaborative development of the software’s source code, the human-readable code that isused to develop software based on open protocols and standards. Whether individually or in groups, andregardless of location, participating developers, many of whose projects are commercially funded, make theircode available over the Internet, give and receive comments on open source code and modify it accordingly. Thisdevelopment model gives open source software an inherent level of transparency and choice that contrasts withthe proprietary software development model.
Under the proprietary model of software development, a software vendor generally develops the code itselfor acquires components from other vendors, without the input from a wider community of participants. Thevendor generally licenses to the user only the machine-readable binary (or object) code, with no or limited rightsto copy, modify or redistribute that code, and does not make the source code available to the user or otherdevelopers. Moreover, peer review and collaborative enhancements are not readily possible because of the lackof access to the source code. In contrast, under the open source development model, the software vendor providesusers and other developers with access both to the binary code and the source code and permits the user to use,copy, modify and redistribute the code to others.
The growth of the Internet has greatly increased the scale and efficiency of open source softwaredevelopment through the availability of collaborative technologies such as email lists, news groups and websites.These technologies have enabled large communities of independent developers, located around the world, tocollaborate on more complex open source projects.
We believe that open source software is a viable and arguably superior alternative to traditional proprietarysoftware. As compared to the proprietary model, the open source model:
Š allows a company’s in-house development team to collaborate and innovate with a global community ofindependent developers and testers;
Š provides the user access to both binary and source code, and the right to inspect, copy, modify andredistribute the software;
Š offers greater flexibility through open rather than proprietary protocols and formats; and
Š permits the user ongoing access to improvements made to the software that are distributed by others.
Moreover, we believe open source software offers many potential benefits for software customers andvendors. Not only are customers able to take advantage of the quality and value of open source software, but theycan inspect and help diagnose problems easily, and they also may choose to customize the software to suit theirparticular needs. Vendors are able to leverage the community of open source developers, reducing developmentcosts, decreasing time-to-market and mitigating the risks associated with developing new software solutions.
Challenges to the widespread adoption of open source by the enterprise
Despite a strong initial market acceptance of Red Hat Enterprise Linux, JBoss Enterprise Middleware andother Red Hat enterprise technologies by large enterprises, a number of obstacles exist to the continued growthand adoption of these technologies within the enterprise, including:
Š competition from well-established proprietary software industry participants such as Hewlett-PackardCompany (“HP”), International Business Machines Corporation (“IBM”), Microsoft Corporation(“Microsoft”), Oracle Corporation (including Sun Microsystems, Inc., which Oracle acquired in early2010) (“Oracle”) and VMware, Inc. (“VMware”);
5

Š a limited number of established, profitable and viable open source industry participants;
Š uncertainty as to the long-term success of a development, licensing and business model not based onlimiting access to proprietary technology; and
Š potential concern over threats of intellectual property infringement claims.
OUR BUSINESS
We generally offer and provide our enterprise technologies with related services to our customers in theform of annual or multi-year subscriptions. Our subscription model is designed to provide customers with anall-inclusive software solution, incorporating product delivery, problem resolution, ongoing corrections,enhancements and new versions and compatibility with a portfolio of certified hardware and softwareapplications. In addition, Red Hat customers are eligible to participate in our Open Source Assurance program,which provides certain assurances to customers in the event there is an intellectual property infringement issuewith our enterprise products. We believe that the chief information officers of large enterprises select Red Hatenterprise technologies and choose to pay on a subscription basis because of the business value, flexibility andrapid innovation that we provide.
Our subscription business model contrasts with the typical proprietary software license model from arevenue recognition perspective. Under our subscription model, we generally defer revenue when we bill thecustomer and recognize revenue over the life of the subscription term. In contrast, under a proprietary softwarelicense model, the vendor typically recognizes license revenue in the period that the software is initially licensed.
We believe the success of our business model is influenced by:
Š the extent to which we can expand the breadth and depth of our technology and service offerings;
Š our ability to enhance the value of subscriptions for Red Hat enterprise technologies through frequentand continuing innovations to these technologies;
Š our ability to generate increasing revenue from channel partner and other strategic relationships,including distributors, OEMs, other hardware vendors, ISVs, cloud computing providers, VARs andsystems integrators;
Š the acceptance and widespread deployment of open source solutions by small, medium and largeenterprises and government agencies;
Š our ability to generate subscription revenue for Red Hat enterprise technologies; and
Š our ability to provide customers with consulting and training services that generate additional revenue.
Use of the open source development model
We have embraced the open source model in the development of our technology solutions and services. Bydeveloping under a collaborative model, we provide a mechanism for independent and commercial developersand our customers to influence our enterprise technologies and to receive the benefits of the collectivecontributions.
Our open source software operating system
One of the most widely known open source technologies is the Linux kernel, the operating system engine ofRed Hat Enterprise Linux. An operating system is the software that allows a computer and its various hardwareand software components to interact. A worldwide community of developers collaborates to improve the Linuxkernel, and we believe we are able to integrate the best of those improvements into our stable, yet innovative and
6

high-performance Red Hat Enterprise Linux platform. Moreover, as discussed below, Red Hat Enterprise Linuxenjoys the support of major OEMs and ISVs, increasing the interest of developers in adding furtherenhancements to the Linux kernel.
We seek to engineer Red Hat Enterprise Linux to be a comprehensive, technically advanced, reliable andstable operating system. Red Hat Enterprise Linux is an integrated, open source operating system that is designedto meet the performance, reliability and scalability demands of chief information officers of large and smallenterprises, from the edge of the network to cloud deployments to the data center.
Our operating system is intended to be:
Š flexible and scalable—capable of running clusters of thousands of systems in a large enterprise on asingle device;
Š functional—able to handle discrete or multiple applications accessed by multiple users;
Š adaptable—allowing the user to modify the software to meet particular needs and requirements;
Š stable and reliable—constantly reviewed and fine-tuned by developers worldwide;
Š secure—offering some of the highest levels of security in the commercial operating system market;
Š cost-effective—lowering the total cost of ownership; and
Š high performing—yielding an array of quality performance results using industry benchmarks.
Our virtualization solutions
Virtualization allows a single computer system to function as multiple virtual systems by abstractingoperating systems and application software from the underlying hardware infrastructure, thereby allowingcustomers to use a common hardware infrastructure to run multiple operating systems and applications. A majorcomponent of our virtualization technology is the Kernel Virtual Machine (“KVM”) platform, which isintegrated within the Linux kernel. Our current version of Red Hat Enterprise Linux includes integratedvirtualization.
The Red Hat Enterprise Virtualization portfolio is a set of virtualization products that includes a standalonehypervisor and management tools. Our virtualization offerings are intended to permit customers to maximizeresource allocation and operational flexibility. The combination of Red Hat Enterprise Virtualization and otherRed Hat enterprise technologies provides a foundation for enterprises to deploy both public and private clouds.
Our middleware tools and platforms
Middleware generally refers to the software that enables the development, operation and integration ofsoftware programs and applications. JBoss Enterprise Middleware combines, integrates and refines features fromthe JBoss.org communities into stable, enterprise-class platform distributions for application and service hosting,content aggregation, data integration and application integration for both the development and deployment ofapplications.
Our middleware tools and platforms are intended to be:
Š easily deployable—decreasing development complexity;
Š intuitive—improving end-user experience;
Š effective—reducing business process friction;
Š flexible—working with many different applications and enterprise environments; and
Š cost-effective—lowering the total cost of ownership.
7

Our systems management solutions
RHN, RHN Satellite, Red Hat Customer Portal and JBoss ON provide software distribution andmanagement solutions for Red Hat Enterprise Linux and JBoss Enterprise Middleware technologies. With afocus on open standards and scalability, our systems management solutions help organizations increaseproductivity, lower costs and enhance security by provisioning, managing, monitoring and updating systems.
These systems management solutions provide organizations with flexibility, security and scalability. RedHat’s customers can manage their deployments by connecting to Red Hat’s hosted servers as part of a basesubscription, or by implementing the enhanced on-site functionality of RHN Satellite and JBoss ON.
Our services
Our services offerings consist of training, consulting and support designed to meet the needs of theenterprise. With these services, our goal is to help promote customer success by sharing knowledge, experienceand advice at all stages of the information technology (“IT”) life cycle.
By providing consulting and support services that help to enable infrastructure, application integration andmiddleware solutions, we facilitate the further adoption and use of our products in the enterprise. In addition, ourtraining services help populate customers with skilled Red Hat certified architects, engineers and administratorswho often serve as internal open source advocates, increasing opportunities for the successful adoption and use ofour enterprise technologies. Our service capabilities promote and reinforce the use of open source solutions aswell as our Red Hat and JBoss brands.
Support by leading independent software and hardware vendors and systems integrators
To facilitate the widespread deployment of Red Hat Enterprise Linux, JBoss Enterprise Middleware andRed Hat Enterprise Virtualization, we have focused on gaining broad support for our technologies from theproviders of hardware, software and systems integrator services critical to the large enterprise. For example,leading software vendors with applications that run on, or with, our enterprise technologies include BMCSoftware, Inc. (“BMC”), CA, Inc. (“CA”), EMC Corporation (“EMC”), HP, IBM, Microsoft, Oracle, SAP AG(“SAP”), SAS Institute Inc. (“SAS”), Sybase, Inc. (“Sybase”), Symantec Corporation (“Symantec”) andVMware. In addition, we have certification and pre-load arrangements with leading hardware providers includingHP, IBM and Dell Inc. (“Dell”), as well as Cisco Systems, Inc. (“Cisco”), Fujitsu Limited (“Fujitsu”), Hitachi,Ltd (“Hitachi”) and NEC Corporation (“NEC”), and certification agreements with leading networking andstorage companies including Cisco, EMC, HP, NetApp, Inc., Nokia Corporation and Nokia Siemens Networks.We also have strategic alliance relationships with the leading semiconductor providers Advanced Micro Devices,Inc. (“AMD”) and Intel Corporation (“Intel”).
An online destination for the open source community
We are dedicated to helping serve the interests and needs of open source software users and developersonline. Our websites, which include redhat.com, jboss.org, fedoraproject.org and opensource.com, serve as asubstantial resource for information related to open source initiatives. These websites contain news we believe tobe of interest to open source users and developers, features for the open source community, a commerce site anda point-of-access for software downloads and upgrades. Visitors to our websites can organize and participate inuser groups, make available incremental code improvements and bug fixes and share knowledge regarding theuse and development of open source software and methods. By acting as a publisher of open source informationand by facilitating the interaction of developers, particularly through the Fedora and JBoss.org projects, webelieve our websites have become community centers for open source. Additionally, redhat.com serves as aprimary customer interface, web store and order mechanism for many of our products and services.
8

Segment reporting
Red Hat is organized primarily on the basis of three geographic business units: the Americas, EMEA(Europe, Middle East and Africa) and Asia Pacific. These business units are aggregated into one reportablesegment due to the similarity in the nature of products provided (e.g., Red Hat Enterprise Linux, JBoss EnterpriseMiddleware and Red Hat Enterprise Virtualization products), financial performance economics (e.g., revenuegrowth and gross margin), methods of distribution (direct and indirect) and customer classification and base (e.g.,distributors, resellers and enterprise).
Geographic Areas
As of February 28, 2011, Red Hat had more than 70 locations around the world, including offices in NorthAmerica, South America, Europe, Asia and Australia. As stated above, we manage our international business onthe basis of three geographic business units: the Americas, EMEA (Europe, Middle East and Africa) and AsiaPacific. See NOTE 2 and NOTE 20 to our Consolidated Financial Statements for further discussion of ourgeographic areas of operation. See Item 1A, “Risk Factors”, for a discussion of some of the risks attendant to ouroperations.
Backlog
The total value of all non-cancellable subscription and service agreements at February 28, 2011, includeddeferred revenue classified as a current liability of $572.6 million, long-term deferred revenue of $199.6 millionand backlog (the value of customer contracts to be billed in the future) not reflected in our financial statements inexcess of $190.0 million. The total value of all non-cancellable subscription and service agreements atFebruary 28, 2010, included deferred revenue classified as a current liability of $480.6 million, long-termdeferred revenue of $165.3 million and backlog not reflected in our financial statements in excess of $190.0million. The amount of backlog at February 28, 2011 that we expect to be billed during the fiscal year endingFebruary 29, 2012 is in excess of $120.0 million.
BUSINESS STRATEGY
Our business strategy is designed to (i) gain widespread adoption of Red Hat enterprise technologies,including virtualization and cloud technologies, by enterprise users globally, (ii) generate increasing revenuefrom our existing customer base by renewing existing subscriptions and providing additional value to ourcustomers, and by growing the number of enterprise technologies that comprise our open source architecture,(iii) generate increasing revenue by providing additional systems management, support and other targetedservices and (iv) generate increasing revenue from channel partner and other strategic relationships, includingdistributors, OEMs, IHVs, ISVs, cloud computing providers, VARs and systems integrators and our owninternational expansion, among other means.
The key elements of our strategy aim to:
Increase the adoption of Red Hat enterprise technologies by enterprise users globally
A growing number of enterprise users view Red Hat Enterprise Linux as a mainstream operating system andJBoss Enterprise Middleware as a viable middleware platform for mission-critical areas of their informationtechnology infrastructure. An increasing number of these users deploy JBoss Enterprise Middleware as acomprehensive middleware reference architecture and product portfolio for development, deployment andintegration of distributed applications, business processes and web services used in a service-orientedarchitecture. In addition, we see increasing interest among enterprise users for our virtualization andvirtualization management offerings. We seek to promote further adoption of our enterprise technologies byexpanding the breadth and depth of our technology and service offerings (such as messaging, high performance
9

computing, realtime and virtualization), bringing new management services to market, improving our technologyinfrastructure to ease the purchasing and renewal process, offering expanded services, focusing on newgeographic markets, and capitalizing on the success of our existing strategic relationships. We believe therelationships with our strategic partners will continue to stimulate the technical advancement and widespreaddistribution of our enterprise technologies and the growth of existing third-party enterprise applications usingRed Hat enterprise technologies. We believe that the low-cost, high-value offerings from Red Hat are a catalystfor change in the IT industry, enabling new deployments and migrations, which encourage a larger ecosystem ofcompatible hardware and software solutions.
Continue to expand cloud computing offerings
We intend to continue to expand our product offerings that optimize resource allocation and enhanceperformance and flexibility in cloud computing environments.
Continue to expand virtualization and other platform offerings
We intend to expand our enterprise virtualization suite of server, client and management product offeringsto enable customers to increase their deployments of virtualization in enterprise and mission-criticalenvironments. We also expect to continue to invest resources to further develop and market our messaging,realtime and grid product offerings.
Continue to expand routes to market
We intend to continue to grow our traditional distribution, VAR, OEM, IHV, ISV and channel partnernetworks on a global basis. In addition, we are enhancing our relationships with systems integrators in order toexpand our reach into customers who traditionally rely on system integrators for advice and recommendationsregarding their technology purchases.
Continue to pursue strategic acquisitions and alliances
We expect to continue to pursue a selective acquisition strategy as opportunities arise to complement andexpand our offerings and service capabilities. We also intend to create and extend our strategic alliances where itis beneficial to our business.
Continue to grow our presence in international markets
We have operations in a number of countries in the Americas, EMEA and Asia Pacific, with over 70 officesworldwide. We expect to continue to expand our operations geographically.
We offer our technologies and documentation in various languages. See NOTE 2 and NOTE 20 to theConsolidated Financial Statements for a discussion of our revenue by geographic area.
Continue to invest in the development of open source technologies
We intend to continue to invest significant resources in the development of new open source technologies inareas that include messaging, virtualization, cloud computing, real-time computing, middleware, management,security and identity, capitalizing on our substantial experience working with the open source model andcommunity. We expect this continued investment to take the form of expenditures on internal developmentefforts, as well as continued funding of third-party open source projects and the expansion of our developerservices.
10

PRODUCTS AND SERVICES
Red Hat’s software solutions, consisting of Red Hat enterprise technologies such as Red Hat EnterpriseLinux, JBoss Enterprise Middleware and Red Hat Enterprise Virtualization are at the center of our subscriptionstrategy and our open source architecture. Our services offerings, principally directed toward our medium andlarge enterprise customers and the leading hardware providers with whom we have strategic relationships,include technical support and maintenance, training, professional consulting services, engineering services andhardware certification.
Generally, we provide our enterprise technologies with related services in the form of annual or multi-yearsubscriptions. Our subscriptions include a bundle of services encompassing product delivery, problem resolution,ongoing corrections, enhancements and new versions, certified capability with a portfolio of hardware andsoftware applications and Red Hat’s Open Source Assurance program. The subscriptions offer varying levels ofsupport services as well as access to basic software updates and configuration management functionality via ourintegrated management technologies RHN, RHN Satellite, Red Hat Customer Portal and JBoss ON.
Red Hat Enterprise Linux technologies
Red Hat Enterprise Linux is an operating system built from various open source software packagesincluding the Linux kernel, and is designed expressly for enterprise computing. Red Hat Enterprise Linuxdelivers the features required for commercial deployments, including:
Š Support for a wide range of ISV applications from vendors such as BMC, CA, EMC, HP, IBM,Microsoft, Oracle, SAP, SAS, Sybase and Symantec;
Š Certification on multiple architectures and leading OEM platforms, including Cisco, Dell, Fujitsu, HP,Hitachi, IBM, NEC and Oracle;
Š Comprehensive technical support, with up to 24x7, one-hour response, available both from Red Hat andselected ISV/OEM partners;
Š Performance and scalability in accordance with leading industry benchmarks;
Š Stability based upon periodic upgrade cycles on a when-and-if-available basis and multiyear supportlifecycle; and
Š Virtualization capability incorporated into the core operating system.
The Red Hat Enterprise Linux platform is well-suited for a broad range of applications across the ITstructure of an enterprise. In addition, Red Hat offers a portfolio of add-ons that extends the features of Red HatEnterprise Linux. These add-ons, which are designed to tailor a customer’s computing environment to suitspecific customer requirements, include:
Š High Availability—provides on-demand failover services between nodes within a cluster intended tomake applications highly available.
Š Resilient Storage—enables a shared storage or clustered file system to access the same storage deviceover a network.
Š Network Load Balancer—provides redundancy for web serving, databases, networking and storage.
Š Scalable File System—provides support for file systems that are between 16 and 100 terabytes in sizeusing advanced features such as 64-bit journaling and advanced locking algorithms.
Š High Performance Network—delivers remote directory memory access over converged Ethernet helpingimprove network latency and capacity.
Š Smart Management—includes Red Hat Network Satellite management and provisioning modules thatallow a customer to provision, patch, configure and control Red Hat Enterprise Linux development, testand production systems.
11

Š Extended Update Support—extends the support period of a Red Hat Enterprise Linux update for up to18 months and delivers overlapping release support to give enterprise customers more flexibility.
We believe that these add-ons provide customers with increased flexibility and choice.
JBoss Enterprise Middleware
JBoss Enterprise Middleware provides a suite of products for developing, deploying, integrating andmanaging distributed, composite and web-based applications and services. JBoss products are based on the Javaprogramming language, are deployed on a variety of leading operating systems and support a distributed,modular, reusable and open standards-based “Service Oriented Architecture” or “SOA” deployment forapplications and data. JBoss Enterprise Middleware offerings consist of a number of deployment platforms, toolsand development frameworks, including:
Š JBoss Enterprise Application Platform—provides an environment for building, hosting and deployingJava-based applications and services. It includes JBoss Application Server, Seam, Hibernate, JBossCache, JBoss Transactions, JBoss Messaging and JBoss Web services.
Š JBoss Enterprise Web Platform—leverages the Java Enterprise Edition Web Profile concept to providea standards-based environment for building light Java applications.
Š JBoss Enterprise Web Server—a single enterprise open source solution for large scale websites andlightweight applications that utilize Apache Tomcat and Apache Web Server.
Š JBoss Enterprise SOA Platform—provides the environment for deploying and integrating SOAs andbusiness processes.
Š JBoss Enterprise Portal Platform—provides a Java-based platform for deploying standards-basedportals.
Š JBoss Enterprise BRMS—a business rules management system that enables business policy and rulesdevelopment, access and change management.
Š JBoss Developer Studio—provides an Eclipse-based application development environment fordeveloping Java applications and development tools for building rich web-based applications and SOAservices.
Š JBoss Enterprise Data Services Platform—provides an environment integrating distributed data sourcesand provides for data federation, data abstraction, data transformation and metadata management.
Š JBoss Web Framework Kit—an integrated bundle of open source frameworks that are used for buildinglight Java applications.
Red Hat Enterprise Virtualization
Red Hat Enterprise Virtualization for Servers is designed to enhance the capital and operational efficienciesof our customers by increasing server utilization and deployment flexibility. Our virtualization solution forservers includes the following components:
Š Red Hat Enterprise Virtualization Hypervisor—a hypervisor based on KVM technology that essentiallyconverts the Red Hat Enterprise Linux kernel into a virtualization platform.
Š Red Hat Enterprise Virtualization Manager—a server virtualization management system that providesadvanced capabilities for both host and guest operating systems, including high availability, livemigration, power manager, storage manager and system scheduler.
Red Hat Enterprise Virtualization for Servers is designed to be compatible with Red Hat Enterprise Linux and itswide ecosystem of certified hardware systems and software applications. Our virtualization solution allowsenterprises to centrally manage virtual environments.
12

Additional Red Hat enterprise technologies
Red Hat enterprise technologies also include other technology infrastructure, including software forsoftware development, high availability clusters of Linux systems and storage, directory server services andauthentication of users. These applications broaden customer choice and are components of our open sourcearchitecture vision for the enterprise. These technologies include:
Š Red Hat MRG—integrates open and scalable messaging, a real-time kernel with predictableperformance and grid management tools for high-performance distributed computing solutions,including virtualization, cloud computing and bare-metal mission-critical applications.
Š Red Hat Developer Offering—provides integrated development environments and support forapplication developers.
Š Red Hat Directory Server—centralizes application settings, user profiles, group data, policies and accesscontrol information into an operating system-independent, network-based registry.
Red Hat systems management solutions
RHN, RHN Satellite, Red Hat Customer Portal and JBoss ON provide management and software deliveryservices for Red Hat Enterprise Linux and JBoss Enterprise Middleware technologies. With a focus on openstandards and scalability, our management solutions help organizations increase productivity, lower costs andenhance security by provisioning, managing, monitoring and updating systems.
Services for Red Hat Enterprise Linux and JBoss Enterprise Middleware are available to provideorganizations with flexibility, security and scalability based on their size and needs. Red Hat’s customers canmanage their deployments by connecting to Red Hat’s hosted servers or by implementing the enhancedfunctionality of RHN Satellite and JBoss ON.
Red Hat Network—Through RHN, Red Hat provides an on-line method for its customers to obtain certifiedsoftware and upgrades and to manage, provision and monitor deployments of Red Hat Enterprise Linux.
RHN Update Module—The RHN Update Module is an entry-level offering included with each subscriptionfor Red Hat Enterprise Linux, providing functionality enhancements and upgrades to individual systems. TheRHN Update Module includes functionality such as a graphical user interface, priority notification, erratainformation, and Red Hat Package Manager dependency checking and auto update. RHN Update Module alsogives customers access to electronic delivery of software related to their Red Hat subscriptions. This is thedefault method for accessing subscription services for Red Hat Enterprise Linux.
Customers may purchase entitlements to the following additional RHN modules on an annual subscriptionbasis:
RHN Satellite—RHN Satellite provides RHN functionality, such as managing system profiles and reportingdata, locally on a customer’s system behind its IT firewall. A customer’s RHN Satellite server connects withRHN over the Internet to download updates and upgrades. RHN Satellite offers customers greater control andflexibility over the management of their Red Hat Enterprise Linux systems and may also be used to distributecustom or third party content to their Red Hat Enterprise Linux systems, and monitor the health of their systems.Additional RHN Proxy Servers can be added to an RHN Satellite deployment to improve performance andpackage downloads for remote locations.
RHN Smart Management—RHN Smart Management allows customers to provision and manage systemsrunning Red Hat enterprise technology. Designed to enable scalable enterprise administration, RHN SmartManagement features systems grouping, role-based administration and scheduled actions.
13

RHN Monitoring Module—The RHN Monitoring Module, only available for RHN Satellite deployments,adds performance-tracking capabilities. Users can configure monitoring checks based on numerous pre-builtprobes, or they can create their own. Email or pager warnings send alerts when defined performance thresholdsare crossed.
Red Hat Customer Portal—Through RHCP, Red Hat provides an online method for Red Hat EnterpriseLinux and JBoss Enterprise Middleware customers to obtain certified software, access to a knowledge base andsoftware update alerts and advisories, as well as interact with our technical support engineers.
JBoss ON—JBoss ON is deployed in a manner similar to RHN Satellite and allows the customer to manageits JBoss Enterprise Middleware environments. Similar to RHN Satellite, JBoss ON functionality includesinventory, software update, administration, configuration management and resource deployment. JBoss ON alsoprovides an extended module for monitoring and alert notifications on the status of JBoss Enterprise Middlewaredeployments.
Red Hat training, consulting and support services
Red Hat offers a range of services that are designed to help our customers derive additional value from RedHat enterprise technologies.
Training—Our training services consist of an array of performance-based courses designed to meet thediverse needs of our customers. We deliver more than 30 Red Hat Enterprise Linux and JBoss EnterpriseMiddleware courses worldwide in classroom, corporate on-site and online settings. These courses span topicssuch as system administration and advanced enterprise development, deployment security, middleware and role-based offerings. Certification paths include Red Hat Certified Technician, Red Hat Certified Engineer, Red HatCertified Data Specialist, Red Hat Certified Security Specialist, Red Hat Certified Virtualization Administrator,Red Hat Certified Architect and JBoss Certified Application Administrator.
Consulting—We offer the services of experienced consultants to assist with the technology infrastructureneeds of our customers. Our offerings include assessments, installations, upgrade planning, platform migrations,solution integration and application development.
Support—Our Red Hat subscriptions generally include varying levels of technical support to assistcustomers with installing, configuring and using Red Hat enterprise technologies. Additionally, we offer atechnical account management (“TAM”) service for customers that require a more personalized supportrelationship. The TAM service is designed to offer a highly skilled, proactive support engineer who understandsa customer’s IT infrastructure and serves as a primary point of contact for technical support that is tailored to thecustomer’s business.
COMPETITION
In the operating systems market, we compete with a number of large and well-established companies thathave significantly greater financial resources, larger development staffs and more extensive marketing anddistribution capabilities. These competitors include Microsoft and Oracle, each of which offers hardware-independent, multi-user operating systems, and various virtualization software for Intel platforms that competeswith Red Hat’s offerings. Moreover, HP, IBM, Oracle and Unisys Corporation each offer the UNIX operatingsystem. Many of these competitors bundle competitive operating systems, such as UNIX, with their ownhardware and additional software offerings, thereby making it more difficult for us to penetrate their customerbases. In addition, with virtualization emerging as an important element of the operating environment, softwarecompanies like VMware, Microsoft and Citrix Systems, Inc. (“Citrix”) that offer virtualization solutions are alsocompetitors to Red Hat. No assurance can be given that our efforts to compete effectively will be sufficient.
14
Within the specific category of Linux operating systems, our chief competitor has historically been Novell,Inc. (“Novell”), with its SUSE brand of Linux. In 2006, Oracle, a large and well-capitalized company, also beganto sell support for its version of the Linux operating system. See Item 1A, “Risk Factors”. Other, less well-capitalized, Linux brands include Ubuntu, Debian, Mandriva, and other regionally-specific distributions. Thefinancial and legal barriers to creating a new Linux distribution are relatively low because the open sourcelicense governing Linux distributions permits copying, modification and redistribution.
In the middleware market, we compete with a number of large and well-established companies that havesignificantly greater financial resources, larger development staffs and more extensive marketing and distributioncapabilities. These competitors include, but are not limited to, IBM, Microsoft, Oracle and VMware, all of whichoffer portfolios of enterprise Java and non-Java middleware products. All of these vendors offer the majority oftheir middleware products under a typical proprietary software license model. IBM and Oracle often bundlehardware and software for their customers, making it more difficult to penetrate these customer bases. Ourmiddleware offering is heavily dependent on the Java programming language, which is controlled by Oracle.
In the virtualization market, we compete with a number of large and well-established companies that havesignificantly greater financial resources, larger development staffs and more extensive marketing and distributioncapabilities. These competitors include, but are not limited to, VMware, Microsoft, Citrix, Novell and Oracle,and in the case of VMware and Microsoft, have virtualization technologies that are certified and supported withRed Hat Enterprise Linux operating system offerings.
With our services offerings, we face competition in the market for services related to the deployment of ourenterprise technologies and the development and integration of applications. Our competitors in the marketinclude HP, IBM and Oracle, as well as other technology consulting companies.
For our management offerings, we compete with a number of large companies that have significantlygreater financial resources, larger development staffs and more extensive marketing and distribution capabilities.These competitors include, but are not limited to, BMC, CA, HP, IBM, Microsoft, Novell and Oracle, all ofwhich offer support for heterogeneous operating system environments, such as Linux, Solaris, AIX, HP-UX andWindows. Many of these competitors have legacy client/server offerings that require relatively longimplementation cycles and are difficult to displace in enterprise customers due to, among other reasons,switching costs. There are numerous other companies that focus exclusively on management offerings that arelikely to support Linux-based systems as well as non-Linux-based systems.
The open source software market is not characterized by the traditional barriers to entry that are found in theproprietary software model due to the nature of open source technology. For example, anyone can use, copy,modify and redistribute Red Hat Enterprise Linux, JBoss Enterprise Middleware and our other open sourceproducts. However, they are not permitted to refer to these products as “Red Hat” or “JBoss” products unlessthey have a formal business relationship with us that allows such references. Moreover, as it relates to ourenterprise technologies and management offerings, our customers agree that during their support relationshipwith Red Hat, they will purchase a support subscription for each computer system, CPU or other unit on whichthey deploy Red Hat’s software. In addition, the primary means by which customers can receive a certifiedversion of Red Hat enterprise software and receive certified functionality enhancements and upgrades to a copyof Red Hat enterprise software is to purchase and maintain a current subscription directly from us or our partnerswith whom we have agreements.
We believe that the major factors affecting the competitive landscape for our products include:
Š the name and reputation of the vendor;
Š the ability to adapt development, sales, marketing and support to the open source model;
Š the product price, performance, reliability and functionality;
15

Š the alliances of the vendor with major industry hardware and/or software providers;
Š the quality of support and consulting services;
Š the financial and value relationship of subscription services;
Š the number of Global 2000 reference accounts;
Š the number of cloud computing partners and reference accounts;
Š the availability of third-party enterprise infrastructure applications that are compatible with thetechnology;
Š the breadth of hardware and software ecosystem compatibility;
Š the management framework for administering the software technologies;
Š the distribution strength and number of distribution partners of the vendor; and
Š the strength of the vendor’s relationships and reputation in the open source community.
Although we believe that overall we generally compete on par or favorably with many of our competitors ina number of respects, including product performance, price and breadth of hardware and software compatibility,we believe that a number of our key competitors currently have superior distribution capabilities. In addition,there are significantly more enterprise infrastructure applications available for competing operating systemstechnologies, such as Windows, than there are for Red Hat Enterprise Linux. An integral part of our strategy hasbeen to help address these shortcomings by, among other methods, strengthening our existing strategicrelationships and entering into new ones to expand our distribution capabilities and by attracting more attentionto the open source movement. Also, increasing the volume of installed subscriptions of Red Hat enterprisetechnologies should create additional opportunities and incentives for software developers to write moreapplications that are compatible with Red Hat enterprise technologies.
SOFTWARE ENGINEERING AND DEVELOPMENT
We have invested, and intend to continue to invest, significant resources in product and technologydevelopment. We expended $171.3 million, $148.4 million and $130.2 million, in our fiscal years endedFebruary 28, 2011, February 28, 2010 and February 28, 2009, respectively, in research and development costs.We focus and modify our product development efforts based on the needs of users and changes in themarketplace. We are currently focusing our development efforts on improving or adding the functionality to ourofferings that are needed by the Global 2000 or required for leading third-party applications upon which theGlobal 2000 are dependent. However, any upgrades and enhancements are offered on a when-and-if-availablebasis.
Our software engineers collaborate with open source software development teams working across theInternet and through open source communities such as the Fedora Project and JBoss.org. This involvementenables us to remain abreast of, and in some instances lead, certain technical advances, plans for development ofnew features and timing of releases, as well as other information related to the development of open sourceprojects.
Our software engineers make development contributions to many components comprising the Red HatEnterprise Linux operating system, JBoss Enterprise Middleware and Red Hat Enterprise Virtualization andprovide leadership within the various open source communities across many of the core components.
16

Our software development engineers perform extensive testing of Red Hat Enterprise Linux, JBossEnterprise Middleware, Red Hat Enterprise Virtualization, RHN, RHN Satellite, Red Hat Customer Portal, JBossON, JBoss Developer Studio and other Red Hat enterprise technologies. We use various industry methods ofquality assurance testing to help ensure that our enterprise technologies are solidly engineered and ready for useby our customers when delivered. We also work closely with leading hardware and software vendors to helpensure that their hardware and applications will operate effectively with Red Hat enterprise platforms.
In addition, we continue to invest substantial resources in the development and commercialization of opensource technologies that provide added value in addition to the operating system.
INTELLECTUAL PROPERTY
Most of our products, such as Red Hat Enterprise Linux and JBoss Enterprise Middleware, are builtprimarily from software components licensed to the general public under various open source licenses. Whilesome components are developed by our own employees, Red Hat obtains many components from softwaredeveloped and released by contributors to independent open source software development projects. Open sourcelicenses grant the licensee broad permissions to use, copy, modify and distribute the software. Certain opensource licenses, such as the GNU General Public License (“GPL”), impose significant limits on a distributor’sability to license derivative works under more restrictive terms and generally require the distributor to disclosethe source code of such works. The inclusion of software components governed by such licenses in our productslimits our ability to use traditional proprietary commercial software licensing models for those products. As aresult, while we have substantial copyright interests in our software products, open source development andproduct licensing practices may have the effect of limiting the value of our software copyright assets.Consequently, our trademarks may represent our most valuable intellectual property. We also generally enter intoconfidentiality and nondisclosure agreements with our employees and consultants and seek to control access toand distribution of our confidential documentation and other proprietary information.
We pursue registration of some of our trademarks in the United States and in other countries. We haveregistered the trademark “Red Hat” and the Red Hat Shadowman logo in countries in North America, SouthAmerica, Europe, Asia and Africa as well as in Australia.
Despite our efforts to protect our trademark rights, unauthorized third parties have in the past attempted, andin the future may attempt, to misappropriate our trademark rights. We cannot be certain that we will succeed inpreventing such misappropriation of our trade name and trademarks. The laws of some foreign countries do notprotect or deter misappropriation of our trademark rights to the same extent as do the laws of the United States.In addition, while we engage in certain enforcement activity, policing unauthorized use of our trademark rights isdifficult, expensive and time consuming, and our efforts may be inadequate. The loss of any material trademarkor trade name could have a material adverse effect on our business, operating results and financial condition.
Red Hat also seeks patent protection of some of the innovative ideas of our software developers. Not all ofthese inventions are applicable to our current technologies. Some provide protection to new and othertechnologies. Moreover, our principal objectives in seeking patent protection are to provide a measure ofdeterrence against the potential patent infringement claims of third parties and to help ensure that newtechnologies and innovations covered by our patents remain open. As part of Red Hat’s commitment to the opensource community, we provide our Patent Promise, an undertaking, subject to certain limitations, not to enforceour patent rights against users of open source software. This permits the development and distribution of opensource applications by third parties that could otherwise infringe on our patents. For these reasons, it is unlikelythat our patents will, of themselves, provide us substantial revenue. We are also a founding member and activeparticipant, along with other industry leaders (including IBM, NEC, Philips, Sony and Novell) in the OpenInvention Network LLC, which acquires patents with the goal of promoting innovation in open source for theLinux platform.
17

Third parties have in the past asserted, and may in the future assert, infringement claims against us whichmay result in costly litigation or require us to obtain a license to third-party intellectual property rights. SeeItem 3, “Legal Proceedings”. There can be no assurance that such licenses will be available on reasonable termsor at all, which could have a material adverse effect on our business, operating results and financial condition.Red Hat regularly commits to its subscription customers that if portions of our enterprise products are found toinfringe third-party intellectual property rights we will, at our expense and option: (i) obtain the right for thecustomer to continue to use the product consistent with their subscription agreement with us; (ii) modify theproduct so that its use is non-infringing; or (iii) replace the infringing component with a non-infringingcomponent, and indemnify them against specified infringement claims. Although we cannot predict whether wewill need to satisfy these commitments and often have limitations on these commitments, satisfying thesecommitments could be costly and time-consuming and could materially and adversely affect our business,operating results and financial condition.
EMPLOYEES
As of February 28, 2011, Red Hat had more than 3,700 employees. From time to time, we also employindependent contractors. Our employees are not represented by any labor union and are not recognized under acollective bargaining agreement, and we have never experienced a work stoppage. We believe our relations withour employees are generally good.
AVAILABLE INFORMATION
We maintain a website at www.redhat.com. We make available, free of charge on our website, our AnnualReport on Form 10-K, Quarterly Reports on Form 10-Q, Current Reports on Form 8-K, and amendments to thosereports filed or furnished pursuant to Section 13(a) or 15(d) of the Securities Exchange Act of 1934, as amended(the “Securities Exchange Act”), as soon as reasonably practicable after we electronically file those reports with,or furnish them to the Securities and Exchange Commission (the “SEC”). We also similarly make available, freeof charge on our website, the reports filed with the SEC by our executive officers, directors and 10%stockholders pursuant to Section 16 under the Securities Exchange Act as soon as reasonably practicable aftercopies of those filings are provided to us by those persons. We are not including the information contained atwww.redhat.com, or at any other Internet address, as part of, or incorporating it by reference into, this AnnualReport on Form 10K.
18
ITEM 1A.RISK FACTORS
Set forth below are certain risks and cautionary statements, which supplement other disclosures in thisreport.
Moreover, certain statements contained in this report and the documents incorporated by reference in thisreport, including in Management’s Discussion and Analysis of Financial Condition and Results of Operations,constitute “forward-looking statements” within the meaning of the Private Securities Litigation Reform Act of1995. Forward-looking statements provide current expectations of future events based on certain assumptionsand include any statement that is not strictly a historical statement (for example, statements regarding current orfuture financial performance, management’s plans and objectives for future operations, product plans andperformance, management’s expectations regarding market risk and market penetration, management’sassessment of market factors or strategies, objectives and plans of Red Hat and its partners). Words such as“anticipates,” “believes,” “expects,” “estimates,” “intends,” “plans,” “projects,” and similar expressions, mayalso identify such forward-looking statements. Investors are cautioned that these forward-looking statements arenot guarantees of Red Hat’s future performance and are subject to a number of risks and uncertainties that couldcause Red Hat’s actual results to differ materially from those found in the forward-looking statements and fromhistorical trends. These risks and uncertainties include the risks and cautionary statements detailed below andelsewhere in this report as well as in Red Hat’s other filings with the Securities and Exchange Commission(“SEC”), copies of which may be accessed through the SEC’s web site at http://www.sec.gov. Readers are urgedto carefully review these risks and cautionary statements. The forward-looking statements included in this reportrepresent our views as of the date of this report. We specifically disclaim any obligation to update these forward-looking statements in the future. These forward-looking statements should not be relied upon as representing ourviews as of any date subsequent to the date of this report.
RISKS RELATED TO BUSINESS UNCERTAINTY
Ongoing uncertainty regarding the duration and extent of the recent economic downturn and in globaleconomic and market conditions generally could adversely affect our business, financial condition andresults of operations.
Economic weakness and uncertainty, tightened credit markets and constrained IT spending from time totime contribute to slowdowns in the technology industry, as well as in the specific segments and markets inwhich we operate, which may result in reduced demand and increased price competition for our products andservices. Our operating results in one or more geographic regions may also be affected by uncertain or changingeconomic conditions within that region, such as the challenges that are currently affecting economic conditions inthe United States and elsewhere. Continuing uncertainty about future economic conditions may, among otherthings, negatively impact our current and prospective customers and result in delays or reductions in technologypurchases or lengthen our sales cycle. Adverse economic conditions also may negatively impact our ability toobtain payment for outstanding debts owed to us by our customers or other parties with whom we do business. Inaddition, these conditions may impact our investment portfolio, and we could determine that some of ourinvestments have experienced an other-than-temporary decline in fair value, requiring an impairment charge thatcould adversely impact our financial condition and results of operations. Also, these conditions may make itmore difficult to forecast operating results. If global economic and market conditions, or economic conditions inthe United States or other key markets, remain uncertain or persist, spread or deteriorate further, companies maydelay or reduce their IT spending, which could adversely affect our business, financial condition and results ofoperations.
19

If we fail to continue to establish and maintain strategic distribution and other collaborative relationshipswith industry-leading companies, we may not be able to attract and retain a larger customer base.
Our success depends in part on our ability to continue to establish and maintain strategic distribution andother collaborative relationships with industry-leading hardware manufacturers, distributors, software vendorsand enterprise solutions providers such as Cisco Systems, Inc. (“Cisco”), Dell Inc. (“Dell”), Fujitsu Limited(“Fujitsu”), Hewlett-Packard Co. (“HP”), International Business Machines Corporation (“IBM”), NECCorporation (“NEC”), Oracle Corporation (“Oracle”), SAP AG (“SAP”) and others. These relationships allow usto offer our products and services to a much larger customer base than we would otherwise be able through ourdirect sales and marketing efforts. We may not be able to maintain these relationships or replace them onattractive terms. In addition, our existing strategic relationships do not, and any future strategic relationships maynot, afford us any exclusive marketing or distribution rights. Some of our channel partners offer competingproducts and services. As a result of these factors, many of the companies with which we have strategic alliancesmay choose to pursue alternative technologies and develop alternative products and services in addition to or inlieu of our products and services, either on their own or in collaboration with others, including our competitors.Moreover, we cannot guarantee that the companies with which we have strategic relationships will market ourproducts effectively or continue to devote the resources necessary to provide us with effective sales, marketingand technical support.
We rely, to a significant degree, on indirect sales channels for the distribution of our products andservices, and disruption within these channels could adversely affect our business and results ofoperations.
We use a variety of different indirect distribution methods to sell our products and services, includingchannel partners such as OEMs, distributors and resellers. A number of these partners in turn distribute via theirown networks of channel partners with whom we have no direct relationship. We rely, to a significant degree, oneach of our channel partners to select, screen and maintain relationships with its distribution network and for thedistribution of our products and services in a manner that is consistent with Red Hat’s quality standards. Ourchannel partners may not distribute and market our products and services effectively.
Recruiting and retaining qualified channel partners and training them in the use of our enterprisetechnologies requires significant time and resources. If we fail to devote sufficient resources to support andexpand our network of channel partners, our results of operations may be adversely affected. In addition, becausewe rely on channel partners for the indirect distribution of our enterprise technologies, we may have little or nocontact with the ultimate end-users of our products, thereby making it more difficult for us to establish brandawareness, ensure proper delivery and installation of our products, support ongoing customer requirements,estimate end-user demand, respond to evolving customer needs and obtain subscription renewals from end-users.
If our indirect distribution channel is disrupted, we may be required to devote more resources to distributeour products directly and support our customers, which may not be as effective and could lead to higher costs,reduced revenue and growth that is slower than expected.
We have entered into and may continue to enter into or seek to enter into business combinations andacquisitions, which may be difficult to complete and integrate, disrupt our business, divert management’sattention, adversely affect our financial condition or results of operations and dilute stockholder value.
As part of our business strategy, we have in the past entered into business combinations and acquisitions,and we may continue to do so in the future. Acquisitions present significant challenges and risks, including:
Š The difficulty of integrating the operations, systems, technology and personnel of the acquired business;
Š The difficulty of gathering full information regarding a company or technology prior to an acquisition,including the identification and assessment of liabilities, claims or other circumstances that could resultin litigation or regulatory exposure, unfavorable accounting treatment, unexpected tax implications andother adverse effects on our business;
20

Š The maintenance of acceptable standards, controls, procedures and policies;
Š The potential disruption of our ongoing business and distraction of management;
Š The impairment of relationships with our employees and customers as a result of any integration of newmanagement and other personnel;
Š The inability to maintain relationships with customers of the acquired business;
Š Cultural challenges associated with integrating employees from the acquired company into ourorganization;
Š The potential loss of key employees of the acquired business;
Š Challenges in maintaining good and effective relations with existing business partners or of those of theacquired business, including as a result of the changes in the competitive landscape effected by theacquisition;
Š The difficulty and expense of incorporating and further developing acquired technology and rights intoour products and services and of maintaining quality standards consistent with our brand;
Š The potential failure to achieve the expected benefits of the combination or acquisition;
Š Expenses related to the acquisition;
Š Claims and liabilities we may assume from the acquired business or technology, or that are otherwiserelated to the acquisition;
Š Operating expenses related to the acquired business or technology;
Š The risk of entering new markets in which we have little or no experience;
Š Potential impairment of tangible assets and intangible assets and goodwill acquired in acquisitions;
Š For foreign transactions, additional risks related to the integration of operations across different culturesand languages, and the economic, political, and regulatory risks associated with specific countries; and
Š The dilutive impact on our current stockholders’ percentage of ownership as a result of issuing shares ofour common stock in connection with an acquisition or business combination.
There can be no assurance that we will manage these challenges and risks successfully. Moreover, if we arenot successful in completing acquisitions that we have pursued or may pursue, our business may be adverselyaffected, and we may incur substantial expenses and divert significant management time and resources. Inaddition, in pursuing such acquisitions, we could use substantial portions of our available cash as all or a portionof the purchase price. We could also issue additional securities as consideration for these acquisitions, whichcould cause our stockholders to suffer significant dilution, or we may incur substantial debt. Any acquisition maynot generate additional revenue or profit for us, which may adversely affect our operating results.
If we fail to effectively manage our growth, our operations and financial results could be adverselyaffected.
We have expanded our operations rapidly in recent years. For example, our total revenue increased from$748.2 million for the fiscal year ended February 28, 2010 to $909.3 million for the fiscal year endedFebruary 28, 2011. Moreover, the total number of our employees increased from over 3,200 as of February 28,2010 to over 3,700 as of February 28, 2011 and is expected to generally increase in the foreseeable future. Inaddition, we continue to explore ways to extend our product and service offerings and geographic reach. Ourgrowth has placed and will likely continue to place a strain on our management systems, information systems,resources and internal controls. Our ability to successfully offer products and services and implement ourbusiness plan requires adequate information systems and resources and oversight from our senior management.
21

As we expand in international markets, these challenges increase as a result of the need to support a growingbusiness in an environment of multiple languages, cultures, customs, legal systems, dispute resolution systems,regulatory systems and commercial practices. As we grow, we must also continue to hire, train, supervise andmanage new employees. We may not be able to adequately screen and hire or adequately train, supervise andmanage sufficient personnel or develop management, or effectively manage and develop our controls andoversight functions and information systems to adequately manage our expansion effectively. If we are unable toadequately manage our growth and expansion, our business, operating results and financial condition could bematerially adversely affected.
We include software licensed from other parties in our enterprise technology offerings, the loss of whichcould increase our costs and delay software shipments.
We utilize various types of software licensed from unaffiliated third parties in our enterprise technologyofferings. Aspects of our business could be disrupted if any of the software we license from others or functionalequivalents of this software were no longer available to us, no longer offered to us on commercially reasonableterms or changed in ways or included defects that made the third-party software unsuitable for our use. In thesecases, we would be required to either redesign our products to function with software available from otherparties, develop these components ourselves or eliminate the functionality, which could result in increased costs,the need to mitigate customer issues, delays in our product shipments and the release of new product offeringsand limit the features available in our current or future products.
We may not be able to continue to attract and retain capable management.
Our future success depends on the continued services and effectiveness of a number of key managementpersonnel, including our CEO, who assumed his role on January 1, 2008. Our ability to retain key managementpersonnel or hire capable new management personnel as we grow may be challenged to the extent the technologysector performs well and/or if companies with more generous compensation packages or greater perceivedgrowth opportunities compete for the same personnel. In addition, historically we have used share-basedcompensation as a key component of our compensation packages. Changes in the accounting for share-basedcompensation could adversely affect our earnings or force us to use more cash compensation to attract and retaincapable personnel. If the price of our common stock falls, the value of our share-based awards to the recipient isreduced. Such events, or if we are unable to secure shareholder approval for increases in the number of shareseligible for share-based compensation grants, could adversely affect our ability to successfully attract and retainkey management personnel. Effective succession planning is also important to our long-term success. Failure toensure effective transfer of knowledge and smooth transitions involving key management personnel could hinderour strategic planning and execution.
We depend on our key non-management employees, the loss of which could adversely affect our businessor stock price and diminish the Red Hat brand.
Competition in our industry for qualified employees, especially technical employees, is intense and fromtime to time our competitors directly target our employees. The loss of the technical knowledge and industryexpertise of any of these individuals could seriously impede our success. Moreover, the loss of these individuals,particularly to a competitor, some of which may be in a position to offer greater compensation, and any resultingloss of customers could reduce our market share and diminish the Red Hat brand and adversely affect ourbusiness or stock price. We have from time to time in the past experienced, and we may experience in the future,difficulty in hiring and retaining highly skilled employees with appropriate qualifications.
A number of our key employees have become, or will soon become, vested in a significant amount of theirequity compensation awards. Employees may be more likely to leave us after a significant portion of their equitycompensation awards fully vest, especially if the shares underlying the equity awards have significantlyappreciated in value. If we do not succeed in retaining and motivating our key employees and attracting new keypersonnel, our business, its financial performance and our stock price may decline.
22

Our corporate culture has contributed to our success, and if we cannot maintain this culture as we grow,we could lose the innovation, creativity and teamwork fostered by our culture, and our business may beharmed.
We believe that a critical contributor to our success has been our corporate culture, which we believe fostersinnovation, creativity and teamwork. As our organization grows, and we are required to implement morecomplex organizational management structures, we may find it increasingly difficult to maintain beneficialaspects of our corporate culture. If we are unable to maintain our corporate culture, we may find it difficult toattract and retain motivated employees.
Our subscription-based contract model may encounter customer resistance or we may experience a declinein the demand for our products.
We provide Red Hat enterprise technologies under annual or multi-year subscriptions. Through the life of asubscription, a customer is entitled to specified levels of support as well as security updates, bug fixes,functionality enhancements and upgrades to the technology, when and if available, via the Red Hat CustomerPortal. While we believe this practice complies with the requirements of the GNU General Public License, andwhile we have reviewed this practice with the Free Software Foundation, the organization that maintains andprovides interpretations of the GNU General Public License, we may still encounter customer resistance to thisdistribution model or customers may fail to honor the terms of our subscription agreements. To the extent we areunsuccessful in promoting or defending this distribution model, our business and operating results could bematerially and adversely affected. In addition, our customers generally undertake a significant evaluation processthat may result in a lengthy sales cycle. We spend substantial time, effort, and money on our sales efforts withoutany assurance that our efforts will produce any sales. As technologies and the markets for our enterprise offeringschange, our subscription-based contract model may no longer meet the needs of our customers. If we are unableto adapt our contract model to changes in the marketplace, our business and operating results could be adverselyimpacted.
If our current and future customers do not renew their subscription agreements with us, our operatingresults may be adversely impacted.
Our customers may not renew their subscriptions for our services after the expiration of their subscriptionagreements and in fact, some customers elect not to do so. In addition, our customers may opt for a lower-pricededition of our offerings or for fewer subscriptions. We have limited historical data with respect to rates ofcustomer subscription renewals, so we cannot accurately predict customer renewal rates. Our customers’ renewalrates may decline or fluctuate as a result of a number of factors, including their level of satisfaction with ourservices and their ability to continue their operations and spending levels. Government contracts could be subjectto future funding that may affect the extension or termination of programs and generally are subject to the rightof the government to terminate for convenience or non-appropriation. If we experience a decline in the renewalrates for our customers or they opt for lower-priced editions of our offerings or fewer subscriptions, our operatingresults may be adversely impacted.
If open source software programmers, most of whom we do not employ, do not continue to develop andenhance open source technologies, we may be unable to develop new products, adequately enhance ourexisting products or meet customer requirements for innovation, quality and price.
We rely to a significant degree on a number of largely informal communities of independent open sourcesoftware programmers to develop and enhance our products. For example, Linus Torvalds, a prominent opensource software developer, and a relatively small group of software engineers, many of whom are not employedby us, are primarily responsible for the development and evolution of the Linux kernel, which is the heart of theRed Hat Enterprise Linux operating system. If these groups of programmers fail to adequately further developand enhance open source technologies, we would have to rely on other parties to develop and enhance our
23

products or we would need to develop and enhance our products with our own resources. We cannot predictwhether further developments and enhancements to these technologies would be available from reliablealternative sources. In either event, our development expenses could be increased and our product release andupgrade schedules could be delayed. Moreover, if third-party software programmers fail to adequately furtherdevelop and enhance open source technologies, the development and adoption of these technologies could bestifled and our products could become less competitive. Delays in developing, completing or shipping new orenhanced products could result in delayed or reduced revenue for those products and could also adversely affectcustomer acceptance of those offerings.
If third-party enterprise hardware and software providers do not continue to make offerings compatiblewith our offerings, our software may cease to be competitive and our business and financial performancemay be adversely affected.
The competitive position of our offerings is dependent on their compatibility with offerings of third-partyenterprise hardware and software companies. To the extent that a software or hardware vendor might have ordevelop products that compete with ours, the vendor may have an incentive to seek to limit the performance,functionality or compatibility of our offerings when used with one or more of the vendor’s offerings. In addition,these vendors may fail to support or issue statements of compatibility or certification of our offerings when usedwith their offerings. We intend to encourage the development of additional applications that operate on bothcurrent and new versions of our offerings by, among other means, attracting third-party developers to Red HatEnterprise Linux and JBoss Enterprise middleware technologies, providing open source tools to create theseapplications and maintaining our existing developer relationships through marketing and technical support. Weintend to encourage the compatibility of our software with various third-party hardware and software offeringsby maintaining and expanding our relationships, both business and technical, with relevant independent hardwareand software vendors. If we are not successful in achieving these goals, however, our products may not becompetitive and our business and financial performance may be adversely affected.
We may be unable to predict the future course of open source technology development, which couldreduce the market appeal of our products and damage our reputation.
We do not exercise control over many aspects of the development of open source technology. Differentgroups of open source software programmers compete with one another to develop new technology. Typically,the technology developed by one group will become more widely used than that developed by others. If weacquire or adopt new technology and incorporate it into our products but competing technology becomes morewidely used or accepted, the market appeal of our products may be reduced and that could harm our reputation,diminish the Red Hat brand and result in decreased revenue.
Because of the characteristics of open source software, there are few technology barriers to entry in theopen source market by new competitors and it may be relatively easy for competitors, some of which mayhave greater resources than we have, to enter our markets and compete with us.
One of the characteristics of open source software is that anyone can modify and redistribute the existingopen source software and use it to compete with us. Such competition can develop without the degree ofoverhead and lead time required by traditional proprietary software companies. It is possible for new competitorswith greater resources than ours to develop their own open source solutions, potentially reducing the demand for,and putting price pressure on, our solutions. For example, Oracle Corporation (“Oracle”) has developed its ownversion of the Linux operating system and sells support both for its version of the Linux operating system and forRed Hat Enterprise Linux. In addition, some competitors make their open source software available for freedownload and use on an ad hoc basis or may position their open source software as a loss leader. We cannotguarantee that we will be able to compete successfully against current and future competitors or that competitivepressure and/or the availability of open source software will not result in price reductions, reduced operatingmargins and loss of market share, any one of which could seriously harm our business.
24
Industry consolidation may lead to increased competition and may harm our operating results.
There has been a trend in industry consolidation in our markets for several years. We expect this trend tocontinue as companies attempt to strengthen or hold their market positions in an evolving industry and ascompanies are acquired or are unable to continue operations. For example, in early 2010, Oracle completed itsacquisition of Sun Microsystems, Inc. (“Sun”). Oracle’s acquisition of Sun creates a large, integrated supplier ofenterprise software that also provides hardware optimized for these software products. We believe that industryconsolidation may result in stronger competitors that are better able to compete as sole-source vendors forcustomers. This could have a material adverse effect on our business, financial condition and results ofoperations.
Our continued success depends on our ability to adapt to a rapidly changing industry. Investment in newbusiness strategies and initiatives could disrupt our ongoing business and may present risks not originallycontemplated.
We operate in highly competitive markets that are characterized by rapid technological change and frequentnew product and service announcements. We must continue to invest significant resources in research anddevelopment in order to enhance our existing products and services and introduce new high-quality products andservices. If we are unable to ensure that our users and customers have a high-quality experience with ourproducts and services, then they may become dissatisfied and move to competitors’ products and services. Inaddition, if we are unable to predict user preferences or industry changes, or if we are unable to modify ourproducts and services on a timely basis, we may lose customers.
Our future success will depend on our ability to adapt to rapidly changing technologies, to adapt ourservices to evolving industry standards and to improve the performance and reliability of our services. Ourfailure to adapt to such changes could harm our business. In addition, the widespread adoption of othertechnological changes could require substantial expenditures to modify or adapt our services or infrastructure.Delays in developing, completing or shipping new or enhanced offerings and technologies could result in delayedor reduced revenue for those offerings and could also adversely affect customer acceptance of those offerings andtechnologies. The success of new and enhanced offering introductions depends on several factors, including ourability to develop and complete new products in a timely manner, successfully promote the offerings, manage therisks associated with the offerings, make sufficient resources available to support them and address any quality orother defects in the early stages of introduction.
Moreover, we believe that our continued success depends on our investing in new business strategies orinitiatives that complement our strategic direction and product road map. Such endeavors may involve significantrisks and uncertainties, including distraction of management’s attention away from other business operations, andinsufficient revenue generation to offset liabilities and expenses undertaken with such strategies and initiatives.Because these endeavors may be inherently risky, no assurance can be given that such endeavors will notmaterially adversely affect our business, operating results or financial condition.
Our continued success depends on our ability to maintain and enhance a strong brand.
We believe that the brand identity that we have developed has contributed significantly to the success of ourbusiness. We also believe that maintaining and enhancing the Red Hat brand is important to expanding ourcustomer base and attracting talented employees. In order to maintain and enhance our brand, we may berequired to make substantial investments that may not be successful. If we fail to promote and maintain ourbrand, or if we incur excessive costs in doing so, our business, operating results and financial condition may bematerially and adversely affected. Maintaining our brand will depend in part on our ability to remain a leader inopen source technology and our ability to continue to provide high-quality products and services.
25

Our Red Hat Enterprise Virtualization and cloud computing offerings are based on emerging technologies,and the potential market for these offerings remains uncertain.
Our Red Hat Enterprise Virtualization and cloud computing product offerings and related services are basedon emerging technologies, the success of which will depend on the perceived technological and operationalbenefits and cost savings associated with the adoption of these technologies. The market for these products andservices remains uncertain. In addition, we may make errors in predicting and reacting to relevant businesstrends. To the extent that the adoption of virtualization and cloud computing offerings occurs more slowly or lesspervasively than we expect, the revenue growth associated with these products and services may be slower thancurrently expected, which could adversely affect our business, operating results and financial condition.
If our growth rate slows, our stock price could be adversely impacted.
As the markets for our products mature and the scale of our business increases, the rate of growth in ourproduct sales will likely be lower than those we have experienced in earlier periods. In addition, to the extent thatthe adoption of our products and services occurs more slowly or is less pervasive than we expect, our revenuegrowth rates may slow materially or our revenue may decline substantially, which could adversely affect ourstock price.
Security and privacy breaches may expose us to liability and harm our reputation and business.
Our security and testing measures may not prevent security breaches that could harm our business.Advances in computer capabilities, new discoveries in the field of cryptography, inadequate technology orfacility security measures or other factors may result in a compromise or breach of our systems and the data weprocess. Our security measures may be breached as a result of actions by third parties or employee error ormalfeasance. Any compromise of our systems or the data we process could harm our reputation or financialcondition and, therefore, our business. In addition, a party who is able to circumvent our security measures orexploit inadequacies in our security measures, could, among other effects, misappropriate proprietaryinformation, cause interruptions in our operations or expose customers to computer viruses or other disruptionsor vulnerabilities. Actual or perceived vulnerabilities may lead to claims against us by customers, partners orother third parties, which could be material. While our customer agreements typically contain provisions thatseek to limit our liability, there is no assurance these provisions will be enforceable and effective underapplicable law. In addition, the cost and operational consequences of implementing further data protectionmeasures could be significant.
We are vulnerable to system failures, which could harm our reputation and business.
We rely on our technology infrastructure for many functions, including selling our products and services,supporting our partners, fulfilling orders and billing, collecting and making payments. Our systems arevulnerable to damage or interruption from natural disasters, power loss, telecommunication failures, terroristattacks, computer intrusions and viruses, software errors, computer denial-of-service attacks and other events. Asignificant number of our systems are not redundant, and our disaster recovery planning is not sufficient forevery eventuality. Our systems are also subject to break-ins, sabotage and intentional acts of vandalism byinternal employees, contractors and third parties. Despite any precautions we may take, such problems couldresult in, among other consequences, interruptions in our services, which could harm our reputation, business andfinancial condition. We do not carry business interruption insurance sufficient to protect us from all losses thatmay result from interruptions in our services as a result of system failures or to cover all contingencies. Anyinterruption in the availability of our websites and on-line interactions with customers and partners would createa large volume of user questions and complaints that would need to be addressed by our support personnel. If oursupport personnel cannot meet this demand, customer and partner satisfaction levels may fall, which in turncould cause additional claims, reduced revenue or loss of customers.
26

A decline in or reprioritization of funding in the U.S. government budget or delays in the budget processcould adversely affect our business and future financial performance.
We derive, and expect to continue to derive, a portion of our revenue from U.S. government agencies.Concerns about increased deficit spending, along with continued economic challenges, continue to place pressureon U.S. government spending. The termination of, or delayed or reduced funding for, programs or contracts fromwhich we derive revenue could adversely affect our business and financial performance.
If we fail to comply with our customer contracts or government contracting regulations, our businesscould suffer.
Our contracts with our customers may include unique and specialized performance requirements. Inparticular, our contracts with federal, state, provincial and local governmental customers are subject to variousprocurements regulations, contract provisions and other requirements relating to their formation, administrationand performance. Any failure by us to comply with the specific provisions in our customer contracts or anyviolation of government contracting regulations could result in the imposition of various civil and criminalpenalties, which may include termination of contracts, forfeiture of profits, suspension of payments and, in thecase of our government contracts, fines and suspension from future government contracting. In addition, we maybe subject to qui tam litigation, the process by which a private individual sues or prosecutes on behalf of thegovernment relating to government contracts and shares in the proceeds of any successful litigation or settlement,which could include claims for up to treble damages. Further, any negative publicity related to our customercontracts or any proceedings surrounding them, regardless of its accuracy, may damage our business and affectour ability to compete for new contracts. There is increased pressure for governments and their agencies, bothdomestically and internationally, to reduce spending. If our customer contracts are terminated, if we aresuspended from government work, or if our ability to compete for new contracts is adversely affected, we couldsuffer an adverse effect on our business, operating results or financial condition.
RISKS RELATED TO LEGAL UNCERTAINTY
If our products are found or alleged to infringe third-party intellectual property rights, we could berequired to redesign our products, replace components of our products, enter into license agreements withthird parties and provide infringement indemnification.
We regularly commit to our subscription customers that if portions of our enterprise products are found toinfringe any third-party intellectual property rights we will, at our expense and option: (i) obtain the right for thecustomer to continue to use the product consistent with their subscription agreement with us; (ii) modify theproduct so that it is non-infringing; or (iii) replace the infringing component with a non-infringing component,and indemnify them against specified infringement claims. Although we cannot predict whether we will need tosatisfy these commitments and often have limitations on these commitments, satisfying the commitments couldbe costly and time consuming and could materially and adversely affect our operating results and financialcondition. In addition, our insurance policies would likely not adequately cover our exposure to this type ofclaim.
We are vulnerable to claims that our products infringe third-party intellectual property rights because ourproducts are comprised of software components, many of which are developed by numerous independentparties, and an adverse legal decision affecting our intellectual property could materially harm ourbusiness.
We are vulnerable to claims that our products infringe third-party intellectual property rights, includingpatent, copyright and trade secrets because our products are comprised of software components, many of whichare developed by numerous independent parties. Moreover, because the scope of software patent protection isoften not well defined or readily determinable, patent applications in the United States are not publicly disclosed
27

at the time of filing, and the number of software patents that are issued each year is significant and growing, wemay be unable to assess the relevance of patents to our products, or take appropriate responsive action, in atimely or economic manner. These risks have been amplified by the increase in third parties whose sole orprimary business is to assert such claims. In the past, our products have been subject to intellectual propertyinfringement claims. We expect these claims to increase as the size of our business and market share grow, thenumber of products and competitors in our industry segment grows and the functionality of products in differentindustry segments overlaps. Defending patent infringement, copyright infringement and/or trade secret claims,even claims without significant merit, can be time consuming, expensive and divert the attention of technical andmanagement personnel.
An adverse legal decision regarding the intellectual property in and to our technology and other offeringscould harm our business and may do so materially. See “Legal Proceedings”.
Our activities, or the activities of our partners, may violate anticorruption laws and regulations that applyto us.
In many foreign countries, particularly in certain developing economies, it is not uncommon to engage inbusiness practices that are prohibited by regulations that may apply to us, such as the U.S. Foreign CorruptPractices Act and similar laws. Although we have policies and procedures designed to promote compliance withthese laws, our employees, contractors, partners and agents, as well as those companies to which we outsourcecertain of our business operations, may take actions in violation of our policies and procedures. Any violation ofour policies and procedures could result in a violation of applicable law and adversely affect our business andfinancial performance.
We could be prevented from selling or developing our software if the GNU General Public License andsimilar licenses under which our products are developed and licensed are not enforceable or are modifiedso as to become incompatible with other open source licenses.
A number of our offerings, including Red Hat Enterprise Linux, have been developed and licensed under theGNU General Public License and similar open source licenses. These licenses state that any program licensedunder them may be liberally copied, modified and distributed. It is possible that a court would hold these licensesto be unenforceable or that someone could assert a claim for proprietary rights in a program developed anddistributed under them. Any ruling by a court that these licenses are not enforceable, or that open sourcecomponents of our product offerings may not be liberally copied, modified or distributed, may have the effect ofpreventing us from distributing or developing all or a portion of our products. In addition, licensors of opensource software employed in our offerings may, from time to time, modify the terms of their license agreementsin such a manner that those license terms may no longer be compatible with other open source licenses in ourofferings or our end user license agreement, and thus could, among other consequences, prevent us fromcontinuing to distribute the software code subject to the modified license.
Our products may contain defects that may be costly to correct, delay market acceptance of our productsand expose us to claims and litigation.
Despite our testing procedures, errors have been and will continue to be found in our products aftercommencement of commercial shipments. This risk is exacerbated by the fact that much of the code in ourproducts is developed by independent parties over whom we exercise no supervision or control. If errors arediscovered, we may have to make significant expenditures of capital and devote significant technical resources toanalyze, correct, eliminate or work around them and may not be able to successfully do so in a timely manner orat all. Errors and failures in our products could result in a loss of, or delay in, market acceptance of our products,loss of existing or potential customers and delayed or lost revenue and could damage our reputation and ourability to convince commercial users of the benefits of Linux-based operating systems and other open sourcesoftware products.
In addition, failures in our products could cause system or other failures for our customers who may assertwarranty and other claims for substantial damages against us. Although our agreements with our customers often
28

contain provisions which seek to limit our exposure to potential product liability claims, it is possible that theseprovisions may not be effective or enforceable under the laws of some jurisdictions. In addition, our insurancepolicies may not adequately limit our exposure to this type of claim. These claims, even if unsuccessful, could becostly and time consuming to defend and could materially harm our business.
Our efforts to protect our trademarks may not be adequate to prevent third parties frommisappropriating our intellectual property rights in our trademarks.
Our collection of trademarks is valuable and important to our business. The protective steps we have takenin the past have been, and may in the future continue to be, inadequate to protect and deter misappropriation ofour trademark rights. We may be unable to detect the unauthorized use of, or take appropriate steps to enforce,our trademark rights in a timely manner. We have registered some of our trademarks in countries in NorthAmerica, South America, Europe, Asia, Africa and Australia and have other trademark applications pending invarious countries around the world. Effective trademark protection may not be available in every country inwhich we offer or intend to offer our products and services. We may be unable to prevent third parties fromacquiring domain names that are similar to, infringe upon, or diminish the value of our trademarks and otherproprietary rights. Failure to adequately protect our trademark rights could damage or even destroy the Red Hatbrand and impair our ability to compete effectively. Furthermore, defending or enforcing our trademark rightscould result in the expenditure of significant financial and managerial resources.
Efforts to assert intellectual property ownership rights in our products could impact our standing in theopen source community, which could limit our product innovation capabilities and adversely affect ourbusiness.
When we undertake actions to protect and maintain ownership and control over our intellectual property,including patents, copyrights and trademark rights, our standing in the open source community could beadversely affected, which in turn could limit our ability to continue to rely on this community, upon which weare dependent, as a resource to help develop and improve our products and further our research and developmentefforts, and could adversely affect our business.
We are, and may become, involved in disputes and lawsuits that could have a material adverse affect onour performance or stock price.
Lawsuits or legal proceedings may be commenced against us. These disputes and proceedings may involvesignificant expense and divert the attention of management and other employees. If we do not prevail in thesematters, we could be required to pay substantial damages or settlement costs, which could have a materialadverse affect on our financial condition or results of operations. See “Legal Proceedings” for additionalinformation on this and other certain matters that may affect our performance or stock price.
Our business is subject to a variety of U.S. and international laws regarding data protection.
Our business is subject to federal, state and international laws regarding privacy and protection of user data.We post, on our website, our privacy policies and practices concerning the use and disclosure of user data. Anyfailure by us to comply with our posted privacy policies or other federal, state or international privacy-related ordata protection laws and regulations could result in proceedings against us by governmental entities or otherswhich could have a material adverse effect on our business, results of operations and financial condition.
It is possible that these laws may be interpreted and applied in a manner that is inconsistent with our datapractices. If so, in addition to the possibility of fines and penalties, a governmental order requiring that wechange our data practices could result, which in turn could have a material adverse effect on our business.Compliance with these regulations may involve significant costs or require changes in business practices thatresult in reduced revenue. Noncompliance could result in penalties being imposed on us or orders that we ceaseconducting the noncompliant activity.
29

RISKS RELATED TO FINANCIAL UNCERTAINTY
Our quarterly and annual operating results may not be a reliable indicator of our future financialperformance.
Due to the unpredictability of the technology spending environment, among other reasons, our revenue andoperating results have fluctuated and may continue to fluctuate. We base our current and projected futureexpense levels, in part, on our estimates of future revenue. Our expenses are, to a large extent, fixed in the shortterm. Accordingly, we may not be able to adjust our spending quickly enough to protect our projected operatingresults for a quarter if our revenue in that quarter falls short of our expectations. If, among other considerations,our future financial performance falls below the expectations of securities analysts or investors or we are unableto increase or maintain profitability, the market price of our common stock may decline.
Our stock price has been volatile historically and may continue to be volatile. Further, the sale of ourcommon stock by significant stockholders may cause the price of our common stock to decrease.
The trading price of our common stock has been and may continue to be subject to wide fluctuations. Ourstock price may fluctuate in response to a number of events and factors, such as quarterly variations in operatingresults, announcements of technological innovations or new products by us or our competitors, announcementsrelating to strategic decisions, announcements related to key personnel, customer purchase delays, servicedisruptions, changes in financial estimates and recommendations by securities analysts, the operating and stockprice performance of other companies that investors may deem comparable to us, news reports relating to trendsin our markets, general economic conditions and other risks listed herein.
In addition, several of our stockholders own significant portions of our common stock. If these stockholderswere to sell all or a portion of their holdings of our common stock, then the market price of our common stockcould be negatively impacted. The effect of such sales, or of significant portions of our stock being offered ormade available for sale, could result in strong downward pressure on our stock price. Investors should be awarethat they could experience significant short-term volatility in our stock if such stockholders decide to sell all or aportion of their holdings of our common stock at once or within a short period of time.
We may lack the financial and operational resources needed to increase our market share and competeeffectively.
In the market for operating systems, we face significant competition from larger companies with greaterfinancial, operational and technical resources and name recognition than we have. Competitors, which offerhardware-independent multi-user operating systems for Intel platforms and/or Linux and UNIX-based operatingsystems, include Microsoft Corporation (“Microsoft”), Oracle, Novell, Inc. (“Novell”), IBM and HP.
In the market for middleware offerings, we face significant competition from larger companies with greaterfinancial, operational and technical resources and name recognition than we have. These competitors include, butare not limited to, IBM, Microsoft and Oracle, all of which offer broad portfolios of enterprise Java and non-Javamiddleware products. IBM and Oracle bundle hardware and software for their customers, making it moredifficult to penetrate these customer bases.
In the market for virtualization and cloud offerings, we face significant competition from larger companieswith greater financial, operational and technical resources and name recognition than we have. These competitorsinclude, but are not limited to, VMware, Microsoft, Citrix Systems, Inc. and Oracle.
In the market for services offerings, we face significant competition from larger companies with greaterfinancial, operational and technical resources and name recognition than we have, including those that currentlyprovide service and training related to the Linux operating system as well as other operating systems, particularlyUNIX-based operating systems, due to the fact that Linux-and UNIX-based operating systems share many commonfeatures. These larger companies, including IBM, Oracle and HP, may be able to leverage their existing serviceorganizations and provide higher levels of consulting and training on a more cost-effective basis than we can.
30

We may lack the resources needed to compete successfully with our current competitors as well as potentialnew competitors. Moreover, we compete in certain areas with our strategic partners and potential strategicpartners, and this may adversely impact our relationship with an individual partner or a number of partners.Competitive pressures could affect prices or demand for our products and services, resulting in reduced profitmargins and loss of market opportunity. We may have to lower the prices of our products and services to staycompetitive, which could affect our margins and financial condition. In addition, if our pricing and other factorsare not sufficiently competitive, we may lose market share. Industry consolidation may also effect competitionby creating larger and potentially stronger competitors in the markets in which we compete, which may have anadverse effect on our business.
We may not be able to meet the financial and operational challenges that we will encounter as ourinternational operations, which represented approximately 43.7% of our total revenue for the fiscal yearended February 28, 2011, continue to expand.
Our international operations accounted for approximately 43.7% of total revenue for the fiscal year endedFebruary 28, 2011. As we expand our international operations, we may have difficulty managing andadministering a globally dispersed business and we may need to expend additional funds to, among otheractivities, reorganize our sales force and technical support services team, outsource or supplement general andadministrative functions, staff key management positions, obtain additional information technology infrastructureand successfully localize software products for a significant number of international markets, which maynegatively affect our operating results.
Additional challenges associated with the conduct of our business overseas that may negatively affect ouroperating results include:
Š Fluctuations in exchange rates;
Š Different pricing environments;
Š Longer payment cycles and less financial stability of customers;
Š Compliance with a wide variety of foreign laws;
Š Difficulty selecting and monitoring channel partners outside of the United States;
Š Lower levels of availability or use of the internet, through which our software is often delivered;
Š Difficulty protecting our intellectual property rights overseas due to, among other reasons, theuncertainty of laws and enforcement in certain countries relating to the protection of intellectualproperty rights;
Š Difficulty in staffing, developing and managing foreign operations as a result of distance, language,legal, cultural and other differences;
Š Difficulty maintaining quality standards consistent with the Red Hat brand;
Š Export control regulations could prevent us from shipping our products into and out of certain markets;
Š Public health risks and natural disasters, particularly in areas in which we have significant operations;
Š Limitations on the repatriation and investment of funds and foreign currency exchange restrictions;
Š Changes in import/export duties, quotas or other trade barriers could affect the competitive pricing ofour products and services and reduce our market share in some countries; and
Š Economic or political instability or terrorist acts in some international markets could result in the loss orforfeiture of some foreign assets and the loss of sums spent developing and marketing those assets andthe revenue associated with them.
Any failure by us to effectively manage the challenges associated with the international expansion of ouroperations could adversely affect our business, operating results and financial condition.
31

We may be subject to greater tax liabilities.
We are subject to income and other taxes in the U.S. and in numerous foreign jurisdictions. Our domesticand foreign tax liabilities are subject to the allocation of revenue and expenses in different jurisdictions.Additionally, the amount of taxes paid is subject to our interpretation of applicable tax laws in the jurisdictions inwhich we operate. Significant judgment is required in determining our worldwide provision for income taxes. Inthe ordinary course of our business, there are many transactions and calculations where the ultimate taxdetermination is uncertain. We are regularly subject to audits by tax authorities. Although we believe our taxestimates are reasonable, the final determination of tax audits and any related litigation could be materiallydifferent from our historical income tax provisions and accruals. The results of an audit or litigation could have amaterial effect on our financial statements in the period or periods for which that determination is made.
We earn a significant amount of our operating income from outside the U.S., and any repatriation of fundscurrently held in foreign jurisdictions may result in higher effective tax rates for the company. In addition, therehave been proposals to change U.S. tax laws that would significantly impact how U.S. multinational corporationsare taxed on foreign earnings. Although we cannot predict whether or in what form this proposed legislation willpass, if enacted it could have a material adverse impact on our tax expense and cash flow.
Because we recognize revenue from subscriptions for our service over the term of the subscription,downturns or upturns in sales may not be immediately reflected in our operating results.
We generally recognize subscription revenue from customers ratably over the term of their subscriptionagreements, which are generally 12 to 36 months. As a result, much of the revenue we report in each quarter isdeferred revenue from subscription agreements entered into during previous quarters. Consequently, a decline insubscriptions in any one quarter will not necessarily be fully reflected in the revenue in that quarter and willnegatively affect our revenue in future quarters. In addition, we may be unable to adjust our cost structure toreflect this reduced revenue. Accordingly, the effect of significant downturns in sales and market acceptance ofour service, and potential changes in our rate of renewals, may not be fully reflected in our results of operationsuntil future periods. Our subscription model also makes it difficult for us to rapidly increase our revenue throughadditional sales in any period, as revenue from new customers must be recognized over the applicablesubscription term.
If our goodwill or amortizable intangible assets become impaired, we may be required to record asignificant charge to earnings.
Under generally accepted accounting principles, we review our amortizable intangible assets for impairmentwhen events or changes in circumstances indicate the carrying value may not be recoverable. Goodwill isrequired to be tested for impairment at least annually. Factors that may be considered a change in circumstancesindicating that the carrying value of our goodwill or amortizable intangible assets may not be recoverable includea decline in stock price and market capitalization, reduced future cash flow estimates and slower growth rates inour industry. We may be required to record a significant charge to earnings in our financial statements during theperiod in which any impairment of our goodwill or amortizable intangible assets is determined resulting in anadverse impact on our results of operations.
We may be exposed to potential risks if we do not have an effective system of disclosure controls orinternal controls
We must comply, on an on-going basis, with the requirements of the Sarbanes-Oxley Act of 2002, includingthose provisions that establish the requirements for both management and auditors of public companies withrespect to reporting on internal control over financial reporting. We cannot be certain that measures we havetaken, and will take, will be sufficient or timely completed to meet these requirements on an on-going basis, orthat we will be able to implement and maintain adequate disclosure controls and controls over our financial
32

processes and reporting in the future, particularly in light of our rapid growth, international expansion andchanges in our products and services, which are expected to result in on-going changes to our control systemsand areas of potential risk.
If we fail to maintain an effective system of disclosure controls or internal control over financial reporting,including satisfaction of the requirements of the Sarbanes-Oxley Act, we may not be able to accurately or timelyreport on our financial results or adequately identify and reduce fraud. As a result, the financial position of ourbusiness could be harmed; current and potential future shareholders could lose confidence in us and/or ourreported financial results, which may cause a negative effect on our trading price; and we could be exposed tolitigation or regulatory proceedings, which may be costly or divert management attention.
Changes in accounting principles and guidance, or their interpretation, could result in unfavorableaccounting charges or effects, including changes to previously filed financial statements, which could causeour stock to decline.
We prepare our consolidated financial statements in accordance with accounting principles generallyaccepted in the U.S. These principles are subject to interpretation by the SEC and various bodies formed tointerpret and create appropriate accounting principles and guidance. A change in these principles or guidance, orin their interpretations, may have a significant effect on our reported results and may retroactively affectpreviously reported results.
Our investment portfolio is subject to credit and illiquidity risks and fluctuations in the market value ofour investments and interest rates. These risks may result in an impairment in or the loss of all or aportion of the value of our investments, an inability to sell our investments or a decline in interest income.
We maintain an investment portfolio of various holdings, types and maturities. Our portfolio as ofFebruary 28, 2011 consisted primarily of money market funds, U.S. government securities, certificates ofdeposit, agency securities, corporate securities and equity securities. Although we follow an establishedinvestment policy and seek to minimize the risks associated with our investments by investing primarily ininvestment grade, highly liquid securities and by limiting the amounts invested with any one institution, type ofsecurity or issuer, we cannot give assurances that the assets in our investment portfolio will not lose value orbecome impaired, or that our interest income will not decline.
We may be required to record impairment charges for other-than-temporary declines in fair market value inour investments. Future fluctuations in economic and market conditions could adversely affect the market valueof our investments, and we could record additional impairment charges and lose some or all of the principalvalue of investments in our portfolio. A total loss of an investment or a significant decline in the value of ourinvestment portfolio could adversely affect our operating results and financial condition. For informationregarding the sensitivity of and risks associated with the market value of portfolio investments and interest rates,see “Quantitative and Qualitative Disclosures About Market Risk”.
Our investments in private companies are subject to risk of loss of investment capital. Some of theseinvestments may have been made to further our strategic objectives and support our key business initiatives. Ourinvestments in private companies are inherently risky because the markets for the technologies they have underdevelopment are typically in the early stages and may never materialize. We could lose the value of our entireinvestment in these companies.
We are subject to risks of currency fluctuations and related hedging operations.
A portion of our business is conducted in currencies other than the U.S. dollar. Changes in exchange ratesamong other currencies and the U.S. dollar will affect our net revenue, operating expenses and operatingmargins. We cannot predict the impact of future exchange rate fluctuations. As we expand international
33

operations, our exposure to exchange rate fluctuations increases. We use financial instruments, primarily forwardpurchase contracts, to economically hedge U.S. dollar and other currency commitments arising from tradeaccounts receivable, trade accounts payable and fixed purchase obligations. If these hedging activities are notsuccessful or we change or reduce these hedging activities in the future, we may experience significantunexpected expenses from fluctuations in exchange rates. For information regarding our hedging activity, see“Quantitative and Qualitative Disclosures About Market Risk”.
Natural disasters and geo-political events could adversely affect our financial performance.
The occurrence of one or more epidemics or natural disasters, such as the recent earthquakes in Japan andrelated events, or geo-political events, such as civil unrest or terrorist attacks in a country in which we operate orin which our suppliers or our customers are located, could disrupt and adversely affect our operations andfinancial performance. Such events could result in physical damage to, or the complete loss of, one or more ofour facilities, the lack of an adequate work force in a market, the inability of our associates to reach or havetransportation to our facilities directly affected by such events, the evacuation of the populace from areas inwhich our facilities are located, changes in the purchasing patterns of our customers, the temporary or long-termdisruption in the supply of computer hardware and related components, the disruption or delay in themanufacture and transport of goods overseas, the disruption of utility services to our facilities or to suppliers,partners or customers, and disruption in our communications with our customers.
34

ITEM 1B.UNRESOLVED STAFF COMMENTS
None.
ITEM 2. PROPERTIES
Our headquarters is currently located in a leased facility in Raleigh, North Carolina, which consists ofapproximately 120,000 square feet. In January 2002, we assumed this lease from an unrelated third-party. Thelease, which has an original term of 20 years, will expire on June 10, 2020. The annual rental expense under thislease is approximately $1.7 million. In March 2006, we assumed a second lease in Raleigh, North Carolina aspart of our headquarters facilities which consisted of approximately 25,000 square feet. In 2007, 2008, 2009 and2010, we acquired under this second lease an additional 25,000 square feet, 10,000 square feet, 8,000 square feetand 5,500 square feet, respectively, further expanding our headquarters facilities. The term for this second lease,as amended, will expire on February 28, 2017. The term for 8,000 and 5,500 square feet on the second lease, asamended, will expire on January 31, 2015 and May 31, 2015 respectively. The annual rental expense under thissecond lease is approximately $1.8 million.
In addition to our headquarters, we have leased office facilities in 30 countries and more than 70 locations.Significant locations in North America include Atlanta, Georgia; Dallas, Texas; Mountain View, California;Richmond, Virginia; Toronto, Canada; Tyson’s Corner, Virginia and Westford, Massachusetts. Significantlocations in Latin America include Buenos Aires, Argentina and Sao Paulo, Brazil. Significant locations inEMEA (Europe, Middle East and Africa) include Brno, Czech Republic; Cork, Ireland; Farnborough, UnitedKingdom; Madrid, Spain; Munich, Germany; Puteaux, France; Ra’anana, Israel; Stockholm, Sweden andStuttgart, Germany. Significant locations in Asia Pacific include Beijing, China; Brisbane, Australia; Melbourne,Australia; Mumbai, India; Pune, India; Singapore; Sydney, Australia and Tokyo, Japan. We believe that in allmaterial respects our properties have been satisfactorily maintained, are in good condition and are suitable forour operations.
ITEM 3. LEGAL PROCEEDINGS
Commencing on or about March 2001, the Company and certain of its officers and directors were named asdefendants in a series of purported class action suits arising out of the Company’s initial public offering andsecondary offering. Approximately 310 other IPO issuers were named as defendants in similar class actioncomplaints (together, the “IPO Allocation Actions”). On August 8, 2001, Chief Judge Michael Mukasey of theU.S. District Court for the Southern District of New York issued an order that transferred all of the IPOAllocation Actions, including the complaints involving the Company, to one judge for coordinated pre-trialproceedings (Case No. 21 MC 92). The plaintiffs contend that the defendants violated federal securities laws byissuing registration statements and prospectuses that contained materially false and misleading information andfailed to disclose material information. Plaintiffs also challenge certain IPO allocation practices by underwritersand the lack of disclosure thereof in initial public offering documents. On April 19, 2002, plaintiffs filedamended complaints in each of the 310 consolidated actions, including the Red Hat action. The relief soughtconsists of unspecified damages, attorneys’ and expert fees and other unspecified costs. In October of 2002, theindividual director and officer defendants of the Company were dismissed from the case without prejudice. InOctober of 2004, the District Court certified a class in six of the 310 actions (the “focus cases”) and noted thatthe decision is intended to provide strong guidance to all parties regarding class certification in the remainingcases. The Company’s action is not one of the focus cases. On December 5, 2006, the U.S. Court of Appeals forthe Second Circuit vacated the District Court’s class certification with respect to the focus cases and remandedthe matter for further consideration. In September 2007, discovery moved forward in the focus cases and plaintifffiled and amended complaints against the focus case issuer and underwriter defendants. Defendants in the focuscases filed motions to dismiss the second amended complaints in November 2007 and filed their oppositions toplaintiffs’ motion for class certification in December 2007. The motions to dismiss in the focus cases weregranted in part. On April 2, 2009, the plaintiffs’ executive committee on behalf of the proposed class filed a
35

motion for preliminary approval of a settlement agreement to resolve the lawsuit, to which the Company hasconsented and for which payments called for by the settlement agreement are to be paid by the defendantinsurers. The trial court heard arguments on September 10, 2009 on the fairness of the settlement. In an opinionand order filed October 5, 2009, the trial court approved the class, granted plaintiffs’ motion for approval of thesettlement and directed the clerk of the court to close the action. Appeals have been filed and briefed before theCourt of Appeals for the Second Circuit.
In the summer of 2004, 14 class action lawsuits were filed against the Company and several of its formerofficers on behalf of investors who purchased the Company’s securities during various periods from June 19,2001 through July 13, 2004. All 14 suits were filed in the U.S. District Court for the Eastern District of NorthCarolina. In each of the actions, plaintiffs sought to represent a class of purchasers of the Company’s commonstock during some or all of the period from June 19, 2001 through July 13, 2004. All of the claims arose inconnection with the Company’s announcement on July 13, 2004 that it would restate certain of its financialstatements (the “Restatement”). One or more of the plaintiffs asserted that certain former officers (the“Individual Defendants”) and the Company violated Sections 10(b) and 20(a) of the Securities Exchange Act of1934, as amended (the “Securities Exchange Act”), and Rule 10b-5 thereunder by issuing the financial statementsthat the Company subsequently restated. One or more of the plaintiffs sought unspecified damages, interest,costs, attorneys’ and experts’ fees, an accounting of certain profits obtained by the Individual Defendants fromtrading in the Company’s common stock, disgorgement by the Company’s former chief executive officer andformer chief financial officer of certain compensation and profits from trading in the Company’s common stockpursuant to Section 304 of the Sarbanes-Oxley Act of 2002 and other relief. As of September 8, 2004, all of theseclass action lawsuits were consolidated into a single action referenced as Civil Action No. 5:04-CV-473BR andtitled In re Red Hat, Inc. Securities Litigation. On May 6, 2005, the plaintiffs filed an amended consolidated classaction complaint. On July 29, 2005, the Company, on behalf of itself and the Individual Defendants, filed amotion to dismiss the action for failure to state a claim upon which relief may be granted. Also on that date,PricewaterhouseCoopers LLP (“PwC”), another defendant, filed a separate motion to dismiss. On May 12, 2006,the Court issued an order granting the motion to dismiss the Securities Exchange Act claims against several ofthe Individual Defendants, but denying the motion to dismiss the Securities Exchange Act claims against theCompany, its former chief executive officer and former chief financial officer. The Court dismissed the claimsunder the Sarbanes-Oxley Act in their entirety, and also granted PwC’s motion to dismiss. On November 6, 2006,the plaintiffs filed a motion for class certification. Subsequent to the filing of that motion, several plaintiffswithdrew as potential class representatives, and the Company opposed the certification of the remainingproposed class representatives. On May 11, 2007, the Court entered an order denying class certification anddenying all other pending motions as moot. Thereafter, on July 13, 2007 Charles Gilbert filed a renewed motionfor appointment as lead plaintiff and approval of selection of lead counsel. On November 13, 2007, the Courtentered an Order allowing Gilbert’s motion, appointing him lead plaintiff, adding him as a party plaintiff andappointing lead counsel. On January 14, 2008, Gilbert’s counsel filed a motion to certify the action as a classaction. On August 28, 2009, the Court entered an Order certifying the action as a class action, appointing Gilbertas the class representative, and defining the class as “all purchasers of the common stock of Red Hat, Inc.between December 17, 2002, and July 12, 2004, inclusive and who were damaged thereby,” excluding Companyinsiders. On December 15, 2009, the Company announced that it had reached an agreement in principle to settlethis matter, subject, among other matters, to completion of a final written settlement agreement and courtapproval. The Company recorded, for its quarter ended November 30, 2009, an estimated liability in the amountof $8.8 million for its portion of the proposed settlement. On March 29, 2010, counsel for the class filed a Motionfor Preliminary Approval of the Settlement and, on June 11, 2010, a United States Magistrate Judge issued aMemorandum and Recommendation to the presiding judge that the motion be approved. On July 8, 2010, thepresiding judge approved the motion and set the hearing for the final fairness hearing on December 7, 2010. Thesettlement was approved by the District Court in an order dated December 10, 2010.
On December 9, 2009, the Company filed a complaint in the Eastern District of Texas (Civil ActionNo. 6:09-cv-00549) against Bedrock Computer Technologies LLC (“Bedrock”) seeking a declaratory judgmentthat United States Patent No. 5,893,120 (the “‘120 Patent”) is invalid, unenforceable and not infringed. The
36

complaint states that Bedrock brought an action in which it wrongly accused some customers of the Company ofinfringing the ‘120 Patent based on their use of computer equipment configured with or utilizing software basedon various versions of the Linux operating system. The complaint seeks a declaration that anyone’s use, sale, oroffer for sale of the Linux kernel distributed by the Company has not and does not in any manner infringe anyclaim of the ‘120 patent or otherwise infringe or violate any rights of Bedrock and that the ‘120 Patent is invalidand unenforceable. On January 29, 2010, Bedrock responded denying the contentions in the complaint andasserting a counterclaim alleging that Red Hat has directly and indirectly infringed the ‘120 Patent. OnFebruary 22, 2010, Red Hat replied to the counterclaim denying the allegations of infringement and assertingaffirmative defenses. On March 26, 2010, Bedrock filed its first amended answer and counterclaim withcrossclaims against fifteen parties. The claim construction hearing has been scheduled for May 12, 2011 and trialin the case has been scheduled for October 11, 2011. Based on information available to date, the Companybelieves it has meritorious defenses to the counterclaims and intends to vigorously defend itself. There can be noassurance, however, that the Company will be successful in its defense, and an adverse resolution of thecounterclaims could have a material adverse effect on its business, financial position and results of operations,including its ability to continue to commercialize the technologies implicated in the litigation.
The Company also experiences routine litigation in the normal course of its business, including patentlitigation. The Company presently believes that the outcome of this routine litigation will not have a materialadverse effect on its financial position and results of operations.
ITEM 4. [REMOVED AND RESERVED]
37

PART II
ITEM 5. MARKET FOR REGISTRANT’S COMMON EQUITY, RELATED STOCKHOLDERMATTERS AND ISSUER PURCHASES OF EQUITY SECURITIES
Market Information
Our common stock trades on the New York Stock Exchange under the symbol “RHT”. The chart below setsforth the high and low sales information for each of the quarters of the fiscal years ended February 28, 2011 andFebruary 28, 2010.
FY 2011 FY 2010
Quarter High Low High Low
First . . . . . . . . . . . . . . . . . . . . . . . . . . . . . . . . . . . . . . . . . . . . . $32.19 $26.69 $20.39 $12.98Second . . . . . . . . . . . . . . . . . . . . . . . . . . . . . . . . . . . . . . . . . . . $35.27 $27.82 $23.72 $18.11Third . . . . . . . . . . . . . . . . . . . . . . . . . . . . . . . . . . . . . . . . . . . . $43.79 $35.04 $28.94 $22.20Fourth . . . . . . . . . . . . . . . . . . . . . . . . . . . . . . . . . . . . . . . . . . . $49.00 $39.42 $31.76 $26.52
Holders
As of April 14, 2011, we estimate that there were 1,824 registered stockholders of record of our commonstock.
Dividends
We have never declared or paid any cash dividends on our common stock. We anticipate that our futureearnings will be retained for the operation and expansion of our business and do not anticipate paying cashdividends in the foreseeable future.
38

Stock Performance Graph
The following graph shows a comparison of cumulative total return (equal to dividends plus stockappreciation) during the period from February 28, 2006 through February 28, 2011 for:
Š Red Hat, Inc.;
Š A peer group consisting of Akamai Technologies, Inc., Ansys, Inc., Autodesk, Inc., BMC, CadenceDesign Systems, Inc., Citrix, Compuware Corporation, Jack Henry & Associates, Inc., McAfee, Inc.,Micros Systems, Inc., Novell, Progress Software Corporation, RealNetworks, Inc., Salesforce.com, Inc.,TIBCO Software, Inc., VMWare, Inc. and Verisign, Inc. (the “Stock Performance Peer Group”); and
Š the S&P 500 Index.
We are required to provide a line-graph presentation comparing cumulative, five-year stockholder returns onan indexed basis with a broad equity market index and either a published industry index or an index of peercompanies selected by Red Hat. In our index of peer group companies, we have selected peer companiesconsidered to be peers for purposes of benchmarking executive compensation during the fiscal year endingFebruary 28, 2011.
COMPARISON OF FIVE-YEAR CUMULATIVETOTAL RETURN AMONG RED HAT,
STOCK PERFORMANCE PEER GROUP AND S&P 500 INDEX
2006 2007 2008 2009 2010 2011$0
$50
$100
$150
$200
RED HAT INC PEER GROUP S&P 500 INDEX
2/28/06 2/28/07 2/29/08 2/28/09 2/28/10 2/28/11
RED HAT, INC. . . . . . . . . . . . . . . . . . . . . . . . . . . . $100.00 $ 83.55 $ 66.36 $50.95 $104.39 $153.63PEER GROUP . . . . . . . . . . . . . . . . . . . . . . . . . . . . . $100.00 $116.70 $113.18 $66.43 $111.47 $129.86S&P 500 INDEX . . . . . . . . . . . . . . . . . . . . . . . . . . . $100.00 $111.96 $107.93 $61.21 $ 93.99 $115.22
Notes:
Š Assumes initial investment of $100.00 on February 28, 2006. Total return includes reinvestment ofdividends.
Š The lines represent monthly index levels derived from compounded daily returns that include alldividends.
39

Š If the monthly interval, based on the fiscal year-end, ends on a day that is not a trading day, thepreceding trading day is used.
Š The index level for all series was set to $100.00 on February 28, 2006.
Š The information included under the heading “Stock Performance Graph” in Item 5 of this AnnualReport on Form 10-K is “furnished” and not “filed” and shall not be deemed to be “soliciting material”or subject to Rule 14A, shall not be deemed “filed” for purposes of Section 18 of the SecuritiesExchange Act of 1934, as amended (the “Exchange Act”) or otherwise subject to the limitations of thatsection, and shall not be deemed incorporated by reference in any filing of the Company under theSecurities Act of 1933, as amended, or the Exchange Act, whether made before or after the date of thisreport and irrespective of any general incorporation by reference language in any such filing.
Š The stock price performance shown in the graph is not necessarily indicative of future priceperformance.
Issuer Purchases of Equity Securities
The table below sets forth information regarding the Company’s purchases of its common stock during itsfourth fiscal quarter ended February 28, 2011:
Issuer Purchases of Equity Securities
Period
Total Numberof SharesPurchased
(1)
WeightedAveragePrice Paidper Share
Total Number ofShares Purchasedas Part of PubliclyAnnounced Plansor Programs (2)
Maximum Number (orApproximate DollarValue) of Shares thatMay Yet Be PurchasedUnder the Plans or
Programs (2)
December 1, 2010 – December 31, 2010 . . . . — $ — — $230.4 millionJanuary 1, 2011 – January 31, 2011 . . . . . . . . 317,198 $43.99 248,300 $219.6 millionFebruary 1, 2011 – February 28, 2011 . . . . . . 4,700 $39.52 4,700 $219.4 million
Total . . . . . . . . . . . . . . . . . . . . . . . . . . . . 321,898 $43.92 253,000 $219.4 million
(1) During the three months ended February 28, 2011, the Company withheld an aggregate of 68,898 shares ofcommon stock from employees to satisfy minimum tax withholding obligations relating to the vesting ofrestricted share awards. These shares were not withheld pursuant to the program described in Note 2 below.
(2) On March 24, 2010, the Company announced that its Board of Directors had authorized the repurchase of upto an aggregate of $300.0 million of the Company’s common stock from time to time in open market orprivately negotiated transactions, as applicable. The program will expire on the earlier of (i) March 31, 2012or (ii) a determination by the Board of Directors, Chief Executive Officer or Chief Financial Officer todiscontinue the program. See NOTE 17 to the Consolidated Financial Statements for information regardingthe Company’s $300.0 million stock repurchase program announced on March 24, 2010.
40

ITEM 6. SELECTED FINANCIAL DATA
The following table sets forth selected financial data for each of the Company’s fiscal years in the five-yearperiod ended February 28, 2011. The selected balance sheet data as of February 28, 2011 and February 28, 2010and the selected statement of operations data for the fiscal years ended February 28, 2011, February 28, 2010 andFebruary 28, 2009 are derived from our Consolidated Financial Statements contained in this Annual Report onForm 10-K and should be read in conjunction with the Consolidated Financial Statements, related notes and otherfinancial information included herein. The selected statement of operations data for the fiscal years endedFebruary 29, 2008 and February 28, 2007 and the selected balance sheet data as of February 28,2009, February 29, 2008 and February 28, 2007, are derived from our Consolidated Financial Statementscontained in the Annual Reports on Form 10-K for the years ended February 28, 2009 and February 29, 2008.
Year Ended
February 28,2011
February 28,2010
February 28,2009
February 29,2008
February 28,2007
(in thousands, except per share data)SELECTED STATEMENT OFOPERATIONS DATA
Revenue:Subscriptions . . . . . . . . . . . . . . . . . . . . . . . $773,404 $638,654 $541,210 $449,811 $341,206Training and services . . . . . . . . . . . . . . . . . 135,873 109,582 111,362 73,205 59,418
Total subscription and training andservices revenue . . . . . . . . . . . . . $909,277 $748,236 $652,572 $523,016 $400,624
Gross profit . . . . . . . . . . . . . . . . . . . . . . . . . . . $758,990 $634,391 $546,446 $442,363 $335,888Income from operations . . . . . . . . . . . . . . . . . $145,676 $100,349 $ 82,521 $ 70,372 $ 52,289Interest income . . . . . . . . . . . . . . . . . . . . . . . . $ 6,743 $ 10,381 $ 36,473 $ 58,541 $ 43,738Other income (expense), net . . . . . . . . . . . . . . $ 1,275 $ 10,772 $ 2,538 $ (4,373) $ (5,568)Net income . . . . . . . . . . . . . . . . . . . . . . . . . . . $107,278 $ 87,253 $ 78,721 $ 76,667 $ 59,907Basic net income per common share . . . . . . . $ 0.56 $ 0.46 $ 0.41 $ 0.40 $ 0.32Diluted net income per common share . . . . . . $ 0.55 $ 0.45 $ 0.39 $ 0.36 $ 0.29Weighted average shares outstandingBasic . . . . . . . . . . . . . . . . . . . . . . . . . . . . . . 190,294 187,845 190,772 193,485 189,347Diluted . . . . . . . . . . . . . . . . . . . . . . . . . . . . 196,353 193,546 211,344 221,313 218,823
(1) For the years ended February 28, 2009, February 29, 2008 and February 28, 2007, other income (expense),net included interest expense of $4.8 million, $6.3 million and $6.0 million, respectively, related to theCompany’s then outstanding convertible debt.
As of
February 28,2011
February 28,2010
February 28,2009
February 29,2008
February 28,2007
(in thousands)SELECTED BALANCE SHEET DATATotal cash and investments in debt andequity securities (available-for-sale, short-and long-term) . . . . . . . . . . . . . . . . . . . . . . $1,192,391 $ 970,185 $ 846,089 $1,331,943 $1,156,094
Working capital (1) . . . . . . . . . . . . . . . . . . . . $ 504,757 $ 436,852 $ 444,183 $ 222,608 $ 706,702Total assets . . . . . . . . . . . . . . . . . . . . . . . . . . $2,199,322 $1,870,872 $1,753,636 $2,079,982 $1,785,854Convertible debentures (1) . . . . . . . . . . . . . . $ — $ — $ — $ 570,000 $ 570,000Stockholders’ equity . . . . . . . . . . . . . . . . . . . $1,290,699 $1,111,052 $1,106,053 $ 951,191 $ 821,236
(1) Convertible debentures with an aggregate face amount of $570.0 million were reclassified from non-currentto current during the fourth quarter of the fiscal year ended February 29, 2008, and as a result are includedin working capital as of February 29, 2008. All of the debentures were repurchased or redeemed by theCompany during the fiscal year ended February 28, 2009 and as a result, no balance was outstanding as ofFebruary 28, 2009.
41

ITEM 7. MANAGEMENT’S DISCUSSION AND ANALYSIS OF FINANCIAL CONDITION ANDRESULTS OF OPERATIONS
OVERVIEW
We are a global leader in providing open source software solutions to the enterprise, including our coreenterprise operating system platform, Red Hat Enterprise Linux (“RHEL”), our enterprise middleware platform,JBoss Enterprise Middleware, our virtualization and cloud solutions and other Red Hat enterprise technologies.
Open source software is an alternative to proprietary software and represents a different model for thedevelopment and licensing of commercial software code than that typically used for proprietary software.Because open source software code is often freely shared, there are customarily no licensing fees for thedistribution of open source software. Therefore, we do not recognize revenue from the licensing of the codeitself. We provide value to our customers through the aggregation, integration, testing, certification, delivery,maintenance and support of our Red Hat enterprise technologies, and by providing a level of scalability, stabilityand accountability for the enterprise technologies we package and distribute. Moreover, because communities ofdevelopers not employed by us assist with the creation of our open source offerings, opportunities for furtherinnovation of our offerings are supplemented by these communities.
We sell our enterprise technologies through subscriptions, and we recognize revenue over the period of thesubscription agreements with our customers. We market our offerings primarily to enterprise customers includinglarge enterprises, government organizations, small- and medium-size businesses and educational institutions.
We have focused on introducing and gaining acceptance for Red Hat enterprise technologies that compriseour open source architecture. Since introducing our initial enterprise open source operating system platform, RedHat Enterprise Linux, it has gained widespread independent software vendor (“ISV”) and independent hardwarevendor (“IHV”) support. We have continued to build our open source architecture by expanding our enterpriseofferings and introducing new systems management services, middleware, integrated virtualization andclustering capability, file management systems, directory and certificate technologies and enhanced securityfunctionality. We intend to bring the value of open source technology to other key areas of the enterpriseinfrastructure as the development community efforts support and customer needs dictate.
We derive our revenue and generate cash from customers primarily from two sources: (i) subscriptionrevenue and (ii) training and services revenue. The arrangements with our customers that produce this revenueand cash are explained in further detail under “Critical Accounting Policies and Estimates” below and in NOTE 2to the Consolidated Financial Statements. These arrangements typically involve subscriptions to Red Hatenterprise technologies. Our revenue is affected by, among other factors, corporate, government and consumerspending levels. In evaluating the performance of our business, we consider a number of factors, including totalrevenue, deferred revenue, operating income, operating margin and cash flows from operations.
Revenue. For the year ended February 28, 2011, total revenue increased 21.5% or $161.0 million to $909.3million from $748.2 million for the year ended February 28, 2010. Subscription revenue increased 21.1% or$134.8 million, driven primarily by additional subscriptions related to our principal RHEL technologies, whichcontinue to gain broader market acceptance in mission-critical areas of computing, and our expansion of saleschannels and geographic footprint. The increase is, in part, a result of the continued migration of enterprises inindustries such as telecommunications, government and financial services to our open source solutions fromproprietary technologies. Training and services revenue increased 24.0% or $26.3 million for the year endedFebruary 28, 2011 as compared to the year ended February 28, 2010. The increase is driven primarily by animproving economic environment in which enterprises are increasing discretionary spending in areas such as ITtraining and consulting.
42

We believe the success of our business model is influenced by:
Š the extent to which we can expand the breadth and depth of our technology and service offerings;
Š our ability to enhance the value of subscriptions for Red Hat enterprise technologies through frequentand continuous innovations to these technologies;
Š the acceptance and widespread deployment of open source solutions by small, medium and largeenterprises and government agencies;
Š our ability to generate increasing revenue from channel partner and other strategic relationships,including distributors, OEMs, other hardware partners, ISVs, cloud computing providers, VARs andsystem integrators;
Š our ability to generate subscription revenue for Red Hat enterprise technologies; and
Š our ability to provide customers with consulting and training services that generate additional revenue.
Deferred Revenue. Our deferred revenue, current and long-term, balance at February 28, 2011 was $772.3million. Because of our subscription model and revenue recognition policies, deferred revenue improvespredictability of future revenue. Deferred revenue at February 28, 2011 increased $126.4 million or 19.6% ascompared to the balance at February 28, 2010 of $645.9 million.
The change in deferred revenue reported on our Consolidated Balance Sheets of $126.4 million differs fromthe $112.7 million change in deferred revenue we reported on our Consolidated Statement of Cash Flows for theyear ended February 28, 2011 due to changes in foreign currency exchange rates used to translate deferredrevenue balances from our foreign subsidiaries’ functional currency into U.S. dollars.
Subscriptions. Our enterprise technologies are sold under subscription agreements. These agreementstypically have a one- or three-year subscription period. The subscription entitles the end user to maintenance,which generally consists of a specified level of support, as well as security updates, bug fixes, functionalityenhancements and upgrades to the technology, when and if available, during the term of the subscription. Ourcustomers have the ability to purchase higher levels of subscriptions that increase the level of support thecustomer is entitled to receive. Subscription revenue increased sequentially for each quarter of fiscal 2011, 2010and 2009 and is being driven primarily by the increased market acceptance and use of open source software bythe enterprise and our expansion of sales channels and geographic footprint during these periods.
Revenue by geography. We operate our business in three geographic regions: the Americas (U.S., LatinAmerica and Canada); EMEA (Europe, Middle East and Africa); and Asia Pacific (principally Japan, Singapore,India, Australia, South Korea and China). During the year ended February 28, 2011, approximately $397.0million or 43.7% of our revenue was generated outside the United States compared to approximately $324.9million or 43.4% for the year ended February 28, 2010. Our international operations are expected to continue togrow as our international sales force and channels become more mature and as we enter new locations or expandour presence in existing locations. As of February 28, 2011, we had offices in more than 70 locations throughoutthe world.
Gross profit margin. Primarily as a result of investments made during our current fiscal year in processand technology infrastructure enhancements to support the delivery of our training and professional servicesacross a growing geographic footprint, gross profit margin decreased to 83.5% for the year ended February 28,2011 from 84.8% for the year ended February 28, 2010. For fiscal 2012, we intend to continue investing in ourglobal training and professional services business.
Income from operations. Operating income was 16.0% and 13.4% of total revenue for the years endedFebruary 28, 2011 and February 28, 2010, respectively. Operating income as a percentage of revenue for the yearended February 28, 2010, includes the impact of an $8.8 million expense representing our portion of thesettlement of a class action lawsuit brought on behalf of certain shareholders in connection with the restatement
43

of our financial results announced in July 2004. Excluding the impact of the litigation settlement expense duringthe year ended February 28, 2010, the remaining increase in operating income as a percentage of revenue is aresult of the decrease in operating expenses relative to revenue as we continued to focus on managingdiscretionary spending and leveraging existing resources within corporate functions. Overall operating expensesas a percentage of revenue decreased to 67.5% for the year ended February 28, 2011 from 71.4% for the yearended February 28, 2010.
Business combinations. On November 19, 2010, we acquired Makara, a developer of deployment andmanagement solutions for applications in the cloud. For further discussion, see NOTE 3 to the ConsolidatedFinancial Statements.
On September 4, 2008, we announced our acquisition of Qumranet, including its Kernel Virtual Machine(“KVM”) and SolidICE virtualization technologies, for approximately $104.8 million in cash. The acquisitionprovides server and desktop virtualization technologies and expertise, related virtualization managementcapabilities, communities of development and use, and additional influence in, and acceptance of, virtualizationtechnology in the Linux kernel, upon which our Red Hat Linux platform is based. For further discussion, seeNOTE 3 to the Consolidated Financial Statements.
Cash, cash equivalents, investments in debt and equity securities and cash flow from operations. Cash,cash equivalents and short-term and long-term available-for-sale investments in securities balances atFebruary 28, 2011 totaled $1.2 billion. Cash generated from operating activities for the year ended February 28,2011 totaled $290.7 million, primarily as a result of the increase in subscription revenue and billings during thesame period. Additionally, employees’ exercise of stock options generated $84.4 million of cash proceeds for theyear ended February 28, 2011.
Our significant cash balance gives us a measure of flexibility to take advantage of opportunities such asacquisitions, increasing investment in international areas and repurchasing our own common stock.
Foreign currency exchange rates’ impact on results of operations. Approximately 43.7% of our revenuefor the year ended February 28, 2011 was produced by sales outside the United States. We are exposed tosignificant risks of foreign currency fluctuation primarily from receivables denominated in foreign currency andare subject to transaction gains and losses, which are recorded as a component in determining net income. Theincome statements of our non-U.S. operations are translated into U.S. dollars at the average exchange rates foreach applicable month in a period. To the extent the U.S. dollar weakens against foreign currencies, thetranslation of these foreign-currency-denominated transactions results in increased revenue and operatingexpenses from operations for our non-U.S. operations. Similarly, our revenue and operating expenses willdecrease for our non-U.S. operations if the U.S. dollar strengthens against foreign currencies.
Using the average foreign currency exchange rates from our prior fiscal year ended February 28, 2010, ourrevenue and operating expenses from non-U.S. operations for the year ended February 28, 2011 would have beenhigher than we reported using the average exchange rates for the current fiscal year ending February 28, 2011 byapproximately $0.9 million and $2.5 million, respectively, which would have resulted in income from operationsbeing lower by $1.6 million.
In our fiscal year ended February 28, 2011, we have focused and expect in our fiscal year endingFebruary 29, 2012 to continue to focus on, among other things, (i) gaining widespread acceptance anddeployment of Red Hat enterprise technologies by enterprise users globally, (ii) generating increasing revenuefrom our existing customer base by renewing existing subscriptions, providing additional value to our customersand by growing the number of enterprise technologies that comprise our open source architecture, (iii) generatingincreased revenue by providing additional systems management, developer support and other targeted servicesand (iv) generating increasing revenue from additional market penetration through a broader and deeper set ofchannel partner relationships, including OEMs, VARs and systems integrators and our own internationalexpansion, among other means.
44

CRITICAL ACCOUNTING POLICIES AND ESTIMATES
Our critical accounting policies and estimates include the following:
Š Revenue recognition;
Š Impairment of goodwill and other long-lived assets;
Š Share-based compensation; and
Š Deferred taxes and uncertain tax positions.
Revenue recognition
We establish persuasive evidence of a sales arrangement for each type of revenue transaction based oneither a signed contract with the end customer, a click-through contract on our website whereby the customeragrees to our standard subscription terms, signed or click-through distribution contracts with OEMs and otherresellers, or, in the case of individual training seats, through receipt of payment which indicates acceptance of ourtraining agreement terms.
Subscription revenue
Subscription revenue is comprised of direct and indirect sales of Red Hat enterprise technologies. Accountsreceivable and deferred revenue are recorded at the time a customer enters into a binding subscription agreementfor the purchase of a subscription, subscription services are made available to the customer and the customer isbilled. The deferred revenue amount is recognized as revenue ratably over the life of the subscription. Red Hatenterprise technologies are generally offered with either one or three-year base subscription periods; the majorityof our subscriptions have one-year terms. Under these subscription agreements, renewal rates are generallyspecified for one or three-year renewal terms. The base subscription generally entitles the end user to thetechnology itself and post-contract customer support (“PCS”), generally consisting of a specified level ofcustomer support and security errata, bug fixes, functionality enhancements to the technology and upgrades tonew versions of the technologies, each on a when-and-if available basis, during the term of the subscription. Wesell our technology offerings through two principal channels: (1) direct, which includes sales by our sales forceas well as web store sales, and (2) indirect, which includes distributors, resellers, systems integrators and OEMs.We recognize revenue from the sale of Red Hat enterprise technologies ratably over the period of thesubscription beginning on the commencement date of the subscription agreement.
Subscription arrangements with large enterprise customers often have contracts with multiple elements (e.g.,software technology, maintenance, training, consulting and other services). We allocate revenue to each elementof the arrangement based on vendor-specific objective evidence of each element’s fair value when we candemonstrate sufficient evidence of the fair value of at least those elements that are undelivered. The fair value ofeach element in multiple element arrangements is created by either (i) providing the customer with the abilityduring the term of the arrangement to renew that element at the same rate paid for the element included in theinitial term of the agreement or (ii) selling the element on a stand-alone basis.
Training and services revenue
Training and services revenue is comprised of revenue for consulting, engineering and customer trainingand education services. Consulting services consist of time-based arrangements, and revenue is recognized asthese services are performed. Engineering services represent revenue earned under fixed fee arrangements withour OEM partners and other customers to provide for significant modification and customization of our Red Hatenterprise technologies. We recognize revenue for these fixed fee engineering services using the percentage ofcompletion basis of accounting, provided we have the ability to make reliable estimates of progress towardscompletion, the fee for such services is fixed or determinable and collection of the resulting receivable is
45

probable. Under the percentage of completion method, earnings under the contract are recognized based on theprogress toward completion as estimated using the ratio of labor hours incurred to total expected project hours.Changes in estimates are recognized in the period in which they are known. Revenue for customer training andeducation services is recognized on the dates the services are complete.
Goodwill and other long-lived assets
We test goodwill for impairment annually and whenever events or circumstances indicate an impairmentmay exist. We test goodwill at least annually using a two-step process that begins with identifying any potentialimpairment. Potential impairment is identified if the fair value of the reporting unit to which goodwill applies isless than the recognized or book value of the related reporting entity, including such goodwill. Where the bookvalue of a reporting entity, including related goodwill, is greater than the reporting entity’s fair value, the secondstep of the goodwill impairment test is performed to measure the amount of impairment loss, if any. For the threeyears ended February 28, 2011, we did not identify any potential impairment related to our goodwill.
We evaluate the recoverability of our property and equipment and other long-lived assets whenever eventsor changes in circumstances indicate that an impairment may have occurred. An impairment loss is recognizedwhen the net book value of such assets exceeds the estimated future undiscounted cash flows attributable to theassets or the business to which the assets relate. Impairment losses are measured as the amount by which thecarrying value exceeds the fair value of the assets. For the three years ended February 28, 2011, no significantimpairment losses related to our long-lived assets were identified. For further discussion, see NOTE 2 to theConsolidated Financial Statements.
Share-based compensation
We account for share-based compensation under the provisions of FASB ASC Section 718 Compensation-Stock Compensation (formerly referenced as Statement of Financial Accounting Standards No. 123 (revised2004), Share-Based Payment) (“ASC 718). In applying ASC 718, we are required to make estimates andassumptions with regards to the number of share-based awards that we expect will ultimately vest and theamount of tax benefits we expect will ultimately be realized, among other things. The amount of share-basedawards that actually vest and the amount of tax benefits from share-based awards actually realized may differsignificantly from our estimates. For further discussion, see NOTE 2 and NOTE 13 to the Consolidated FinancialStatements.
Deferred taxes and uncertain tax positions
We account for income taxes using the liability method in which deferred tax assets or liabilities arerecognized for the temporary differences between financial reporting and tax bases of our assets and liabilitiesand for tax carryforwards at enacted statutory tax rates in effect for the years in which the differences areexpected to reverse.
We continue to assess the realizability of our deferred tax assets, which primarily consist of share-basedcompensation expense deductions, tax credit carryforwards and deferred revenue. In assessing the realizability ofthese deferred tax assets, management considers whether it is more likely than not that some portion or all of thedeferred tax assets will be realized. As of February 28, 2011, deferred tax assets totaled $113.8 million, of which$5.8 million was offset by a valuation allowance. We continue to maintain a valuation allowance against ourdeferred tax assets with respect to certain foreign net operating loss (“NOL”) carryforwards. For furtherdiscussion regarding deferred income taxes see NOTE 2 and NOTE 11 to the Consolidated Financial Statements.
With respect to foreign earnings, it is our policy to invest the earnings of foreign subsidiaries indefinitelyoutside the U.S. From time to time, however, we may remit a portion of these earnings to the extent we incur noadditional U.S. tax and it is otherwise feasible.
46

Because tax laws are complex and subject to different interpretations, significant judgment is required. As aresult, we make certain estimates and assumptions, in (i) calculating our income tax expense, deferred tax assetsand deferred tax liabilities, (ii) determining any valuation allowance recorded against deferred tax assets and(iii) evaluating the amount of unrecognized tax benefits, as well as the interest and penalties related to suchuncertain tax positions. Our estimates and assumptions may differ significantly from tax benefits ultimatelyrealized. For further discussion regarding uncertain tax positions see NOTE 11 to the Consolidated FinancialStatements.
47
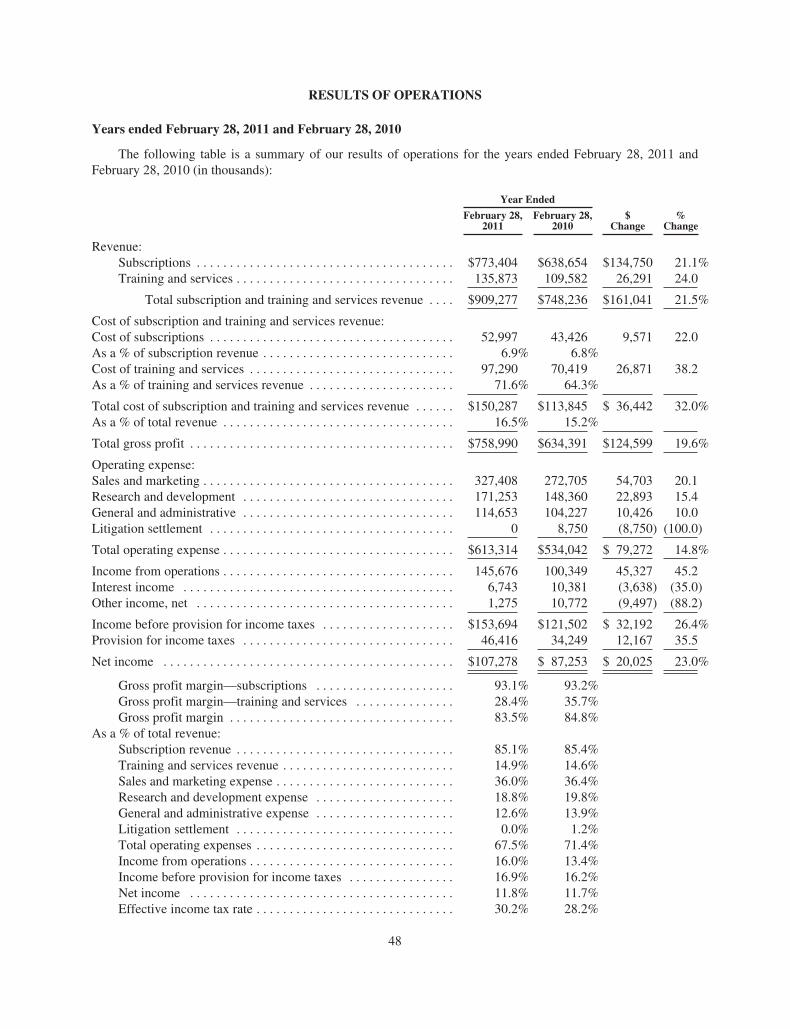
RESULTS OF OPERATIONS
Years ended February 28, 2011 and February 28, 2010
The following table is a summary of our results of operations for the years ended February 28, 2011 andFebruary 28, 2010 (in thousands):
Year Ended
February 28,2011
February 28,2010
$Change
%Change
Revenue:Subscriptions . . . . . . . . . . . . . . . . . . . . . . . . . . . . . . . . . . . . . . . $773,404 $638,654 $134,750 21.1%Training and services . . . . . . . . . . . . . . . . . . . . . . . . . . . . . . . . . 135,873 109,582 26,291 24.0
Total subscription and training and services revenue . . . . $909,277 $748,236 $161,041 21.5%
Cost of subscription and training and services revenue:Cost of subscriptions . . . . . . . . . . . . . . . . . . . . . . . . . . . . . . . . . . . . . 52,997 43,426 9,571 22.0As a % of subscription revenue . . . . . . . . . . . . . . . . . . . . . . . . . . . . . 6.9% 6.8%Cost of training and services . . . . . . . . . . . . . . . . . . . . . . . . . . . . . . . 97,290 70,419 26,871 38.2As a % of training and services revenue . . . . . . . . . . . . . . . . . . . . . . 71.6% 64.3%
Total cost of subscription and training and services revenue . . . . . . $150,287 $113,845 $ 36,442 32.0%As a % of total revenue . . . . . . . . . . . . . . . . . . . . . . . . . . . . . . . . . . . 16.5% 15.2%
Total gross profit . . . . . . . . . . . . . . . . . . . . . . . . . . . . . . . . . . . . . . . . $758,990 $634,391 $124,599 19.6%
Operating expense:Sales and marketing . . . . . . . . . . . . . . . . . . . . . . . . . . . . . . . . . . . . . . 327,408 272,705 54,703 20.1Research and development . . . . . . . . . . . . . . . . . . . . . . . . . . . . . . . . 171,253 148,360 22,893 15.4General and administrative . . . . . . . . . . . . . . . . . . . . . . . . . . . . . . . . 114,653 104,227 10,426 10.0Litigation settlement . . . . . . . . . . . . . . . . . . . . . . . . . . . . . . . . . . . . . 0 8,750 (8,750) (100.0)
Total operating expense . . . . . . . . . . . . . . . . . . . . . . . . . . . . . . . . . . . $613,314 $534,042 $ 79,272 14.8%
Income from operations . . . . . . . . . . . . . . . . . . . . . . . . . . . . . . . . . . . 145,676 100,349 45,327 45.2Interest income . . . . . . . . . . . . . . . . . . . . . . . . . . . . . . . . . . . . . . . . . 6,743 10,381 (3,638) (35.0)Other income, net . . . . . . . . . . . . . . . . . . . . . . . . . . . . . . . . . . . . . . . 1,275 10,772 (9,497) (88.2)
Income before provision for income taxes . . . . . . . . . . . . . . . . . . . . $153,694 $121,502 $ 32,192 26.4%Provision for income taxes . . . . . . . . . . . . . . . . . . . . . . . . . . . . . . . . 46,416 34,249 12,167 35.5
Net income . . . . . . . . . . . . . . . . . . . . . . . . . . . . . . . . . . . . . . . . . . . . $107,278 $ 87,253 $ 20,025 23.0%
Gross profit margin—subscriptions . . . . . . . . . . . . . . . . . . . . . 93.1% 93.2%Gross profit margin—training and services . . . . . . . . . . . . . . . 28.4% 35.7%Gross profit margin . . . . . . . . . . . . . . . . . . . . . . . . . . . . . . . . . . 83.5% 84.8%
As a % of total revenue:Subscription revenue . . . . . . . . . . . . . . . . . . . . . . . . . . . . . . . . . 85.1% 85.4%Training and services revenue . . . . . . . . . . . . . . . . . . . . . . . . . . 14.9% 14.6%Sales and marketing expense . . . . . . . . . . . . . . . . . . . . . . . . . . . 36.0% 36.4%Research and development expense . . . . . . . . . . . . . . . . . . . . . 18.8% 19.8%General and administrative expense . . . . . . . . . . . . . . . . . . . . . 12.6% 13.9%Litigation settlement . . . . . . . . . . . . . . . . . . . . . . . . . . . . . . . . . 0.0% 1.2%Total operating expenses . . . . . . . . . . . . . . . . . . . . . . . . . . . . . . 67.5% 71.4%Income from operations . . . . . . . . . . . . . . . . . . . . . . . . . . . . . . . 16.0% 13.4%Income before provision for income taxes . . . . . . . . . . . . . . . . 16.9% 16.2%Net income . . . . . . . . . . . . . . . . . . . . . . . . . . . . . . . . . . . . . . . . 11.8% 11.7%Effective income tax rate . . . . . . . . . . . . . . . . . . . . . . . . . . . . . . 30.2% 28.2%
48

Revenue
Subscription revenue
Subscription revenue increased by 21.1% or $134.8 million to $773.4 million for the year endedFebruary 28, 2011 from $638.7 million for the year ended February 28, 2010. The increase in subscriptionrevenue is primarily due to increases in volumes sold, including additional subscriptions attributable togeographic expansion, and continuing innovation, which attracts new customers and helps to drive renewals fromexisting customers.
Training and services revenue
Total training and services revenue increased by 24.0% or $26.3 million to $135.9 million for the yearended February 28, 2011 from $109.6 million for the year ended February 28, 2010. Training revenue increased8.8% or $3.7 million as some enterprises began to increase overall spending on discretionary items such astraining and related travel in response to a better overall economic environment. Our services revenue increasedby 33.3% or $22.6 million as a result of both a better overall economic environment and increased subscriptionsales. Combined training and services revenue as a percentage of total revenue was 14.9% and 14.6% for the yearended February 28, 2011 and February 28, 2010, respectively.
Cost of revenue
Cost of subscription revenue
Cost of subscription revenue increased by 22.0% or $9.6 million to $53.0 million for the year endedFebruary 28, 2011 from $43.4 million for the year ended February 28, 2010. The increase is partially the result ofcontinued additions to our technical support staff to meet the demands of our growing subscriber base for supportand maintenance, and includes additional compensation of $4.3 million. The remaining increase relates primarilyto process and technology infrastructure investments which increased by $4.1 million. As the number of opensource technology subscriptions continues to increase, we expect associated support cost will continue toincrease, although we anticipate this will occur at a overall slower rate than that of subscription revenue growthdue to economies of scale. Gross profit margin on subscriptions was 93.1% and 93.2% for the year endedFebruary 28, 2011 and February 28, 2010, respectively.
Cost of training and services revenue
Cost of training and services revenue increased by 38.2% or $26.9 million to $97.3 million for the yearended February 28, 2011 from $70.4 million for the year ended February 28, 2010. The cost to deliver trainingincreased 21.1% or $5.6 million to $32.3 million for the year ended February 28, 2011 compared to $26.7 millionfor the year ended February 28, 2010. The increase in training costs was primarily due to the use of outsidecontractors and off-site training facilities to deliver training services, which increased training costs by $2.6million for the year ended February 28, 2011. The remaining increase was primarily due to increased employeecompensation and related travel expense of $0.9 million and investments in process and technology infrastructureenhancements which totaled approximately $2.0 million. Costs to deliver our services revenue increased by47.8% or $21.3 million and primarily relate to the use of outside contractors and additional employeecompensation expense associated with additions to our staff to support increased services revenue. Total costs todeliver training and services as a percentage of training and services revenue increased to 71.6% for the yearended February 28, 2011 from 64.3% for the year ended February 28, 2010.
Gross profit
Primarily as a result of investments made during our current fiscal year in process and technologyinfrastructure enhancements to support the delivery of our training and professional services across a growinggeographic footprint, gross profit margin decreased to 83.5% for the year ended February 28, 2011 from 84.8%for the year ended February 28, 2010. For fiscal 2012, we intend to continue investing in our global training andprofessional services business.
49

Operating expenses
Sales and marketing
Sales and marketing expense increased by 20.1% or $54.7 million to $327.4 million for the year endedFebruary 28, 2011 from $272.7 million for the year ended February 28, 2010. Selling costs increased$43.2 million and includes $35.2 million of additional employee compensation and travel related expenseattributable to the expansion of our sales force from the prior year. Marketing costs grew $11.5 million or 20.2%for the year ended February 28, 2011 as compared to the year ended February 28, 2010. The increase inmarketing costs includes $6.0 million related to increased headcount to support our expanding marketing efforts.The remaining increase in sales and marketing costs primarily relates to incremental advertising costs andprocess and technology infrastructure enhancements which increased $2.1 million and $6.9 million, respectivelyfor the year ended February 28, 2011 as compared to the year ended February 28, 2010. Sales and marketingexpense as a percentage of revenue decreased to 36.0% for the year ended February 28, 2011 from 36.4% for theyear ended February 28, 2010 as we continue to leverage our existing infrastructure to generate increased sales.
Research and development
Research and development expense increased by 15.4% or $22.9 million to $171.3 million for the yearended February 28, 2011 from $148.4 million for the year ended February 28, 2010. The increase in research anddevelopment costs primarily resulted from the expansion of our engineering group through direct hires.Employee compensation increased by $17.9 million. The remaining increase in research and development costsrelates primarily to process and technology infrastructure enhancements, which increased $3.6 million. Researchand development expense was 18.8% and 19.8% of total revenue for the year ended February 28, 2011 andFebruary 28, 2010, respectively.
General and administrative
General and administrative expense increased by 10.0% or $10.4 million to $114.7 million for the yearended February 28, 2011 from $104.2 million for the year ended February 28, 2010. The increase in general andadministrative expenses is due to outside professional services fees, which were primarily for outside legalservices. General and administrative expense decreased as a percentage of revenue to 12.6% for the year endedFebruary 28, 2011 from 13.9% for the year ended February 28, 2010 as we continued to leverage our corporatefunctions.
Litigation settlement
On December 15, 2009, we announced that we had reached an agreement in principle to settle the classaction lawsuit, then pending in the United States District Court for the Eastern District of North Carolina,brought on behalf of a class of shareholders in connection with the restatement of our financial results announcedin July 2004. The $8.8 million expense we recorded for the year ended February 28, 2010 represents our portionof the payment pursuant to such settlement.
Interest income
Interest income decreased by 35.0% or $3.6 million to $6.7 million for the year ended February 28, 2011from $10.4 million for the year ended February 28, 2010. The decrease in interest income for the year endedFebruary 28, 2011 is attributable to lower yields on our investments due to an overall lower interest rateenvironment.
Other income, net
Other income, net decreased $9.5 million for the year ended February 28, 2011 as compared to the yearended February 28, 2010. Gains realized from the sale of our investments in available-for-sale equity securities
50

totaled $3.7 million for the year ended February 28, 2011 which was $9.0 million lower than the $12.7 million ofgains realized from the sale of equity securities during the year ended February 28, 2010. The remaining decreaseis the result of increased losses resulting from changes in foreign currency exchange rates for the year endedFebruary 28, 2011.
Income taxes
During the year ended February 28, 2011 and February 28, 2010, the Company recorded $46.4 million and$34.2 million, respectively of income tax expense. Tax expense for the year ended February 28, 2011 of $46.4million resulted in an effective tax rate of 30.2%. Our effective tax rate of 30.2% differs from the U.S. federalstatutory rate of 35.0% primarily due to foreign income taxed at different rates and foreign tax credits whichwere partially offset by state income tax expense. The provision for income tax for the year ended February 28,2011 consists of $35.7 million of U.S. income tax expense and $10.7 million of foreign income tax expense.
During the year ended February 28, 2010, we recorded $34.2 million of income tax expense, which resultedin an annual effective tax rate of 28.2%. Our income tax expense for the year ended February 28, 2010 includes adiscrete tax benefit from research tax credits, net of a corresponding reduction of NOLs, which resulted in a netreduction of income tax expense of $7.3 million. Excluding the impact of the discrete tax benefit, our annualeffective tax rate was 34.2%, which differs from the U.S. federal statutory rate of 35.0% primarily due to foreignincome taxed at different rates and foreign tax credits which were partially offset by state income tax expense.The provision for income tax for the year ended February 28, 2010 consisted of $24.8 million of U.S. income taxexpense and $9.4 million of foreign income tax expense.
51

Years ended February 28, 2010 and February 28, 2009
The following table is a summary of our results of operations for the years ended February 28, 2010 andFebruary 28, 2009 (in thousands):
Year Ended
February 28,2010
February 28,2009
$Change
%Change
Revenue:Subscriptions . . . . . . . . . . . . . . . . . . . . . . . . . . . . . . . . . . . . . . . $638,654 $541,210 $ 97,444 18.0%Training and services . . . . . . . . . . . . . . . . . . . . . . . . . . . . . . . . 109,582 111,362 (1,780) (1.6)
Total subscription and training and services revenue . . . . $748,236 $652,572 $ 95,664 14.7
Cost of subscription and training and services revenue:Cost of subscriptions . . . . . . . . . . . . . . . . . . . . . . . . . . . . . . . . . . . . . 43,426 37,267 6,159 16.5As a % of subscription revenue . . . . . . . . . . . . . . . . . . . . . . . . . . . . . 6.8% 6.9%Cost of training and services . . . . . . . . . . . . . . . . . . . . . . . . . . . . . . . 70,419 68,859 1,560 2.3As a % of training and services revenue . . . . . . . . . . . . . . . . . . . . . . 64.3% 61.8%
Total cost of subscription and training and services revenue . . . . . . $113,845 $106,126 $ 7,719 7.3As a % of total revenue . . . . . . . . . . . . . . . . . . . . . . . . . . . . . . . . . . . 15.2% 16.3%
Total gross profit . . . . . . . . . . . . . . . . . . . . . . . . . . . . . . . . . . . . . . . . $634,391 $546,446 $ 87,945 16.1
Operating expense:Sales and marketing . . . . . . . . . . . . . . . . . . . . . . . . . . . . . . . . . . . . . 272,705 238,552 34,153 14.3Research and development . . . . . . . . . . . . . . . . . . . . . . . . . . . . . . . . 148,360 130,177 18,183 14.0General and administrative . . . . . . . . . . . . . . . . . . . . . . . . . . . . . . . . 104,227 95,196 9,031 9.5Litigation settlement . . . . . . . . . . . . . . . . . . . . . . . . . . . . . . . . . . . . . 8,750 — 8,750 —
Total operating expense . . . . . . . . . . . . . . . . . . . . . . . . . . . . . . . . . . $534,042 $463,925 $ 70,117 15.1
Income from operations . . . . . . . . . . . . . . . . . . . . . . . . . . . . . . . . . . 100,349 82,521 17,828 21.6Interest income . . . . . . . . . . . . . . . . . . . . . . . . . . . . . . . . . . . . . . . . . 10,381 36,473 (26,092) (71.5)Other income, net . . . . . . . . . . . . . . . . . . . . . . . . . . . . . . . . . . . . . . . 10,772 2,538 8,234 324.4
Income before provision for income taxes . . . . . . . . . . . . . . . . . . . . $121,502 $121,532 $ (30) —Provision for income taxes . . . . . . . . . . . . . . . . . . . . . . . . . . . . . . . . 34,249 42,811 (8,562) (20.0)
Net income . . . . . . . . . . . . . . . . . . . . . . . . . . . . . . . . . . . . . . . . . . . . $ 87,253 $ 78,721 $ 8,532 10.8%
Gross profit margin—subscriptions . . . . . . . . . . . . . . . . . . . . . 93.2% 93.1%Gross profit margin—training and services . . . . . . . . . . . . . . . 35.7% 38.2%Gross profit margin . . . . . . . . . . . . . . . . . . . . . . . . . . . . . . . . . . 84.8% 83.7%
As a % of total revenue:Subscription revenue . . . . . . . . . . . . . . . . . . . . . . . . . . . . . . . . . 85.4% 82.9%Training and services revenue . . . . . . . . . . . . . . . . . . . . . . . . . . 14.6% 17.1%Sales and marketing expense . . . . . . . . . . . . . . . . . . . . . . . . . . . 36.4% 36.6%Research and development expense . . . . . . . . . . . . . . . . . . . . . 19.8% 19.9%General and administrative expense . . . . . . . . . . . . . . . . . . . . . 13.9% 14.6%Litigation settlement . . . . . . . . . . . . . . . . . . . . . . . . . . . . . . . . . 1.2% —Total operating expenses . . . . . . . . . . . . . . . . . . . . . . . . . . . . . . 71.4% 71.1%Income from operations . . . . . . . . . . . . . . . . . . . . . . . . . . . . . . 13.4% 12.6%Interest income . . . . . . . . . . . . . . . . . . . . . . . . . . . . . . . . . . . . . 1.4% 5.6%Other income, net . . . . . . . . . . . . . . . . . . . . . . . . . . . . . . . . . . . 1.4% 0.3%Income before provision for income taxes . . . . . . . . . . . . . . . . 16.2% 18.6%Net income . . . . . . . . . . . . . . . . . . . . . . . . . . . . . . . . . . . . . . . . 11.7% 12.1%Effective income tax rate . . . . . . . . . . . . . . . . . . . . . . . . . . . . . 28.2% 35.2%
52

Revenue
Subscription revenue
Subscription revenue increased by 18.0% or $97.4 million to $638.7 million for the year ended February 28,2010 from $541.2 million for the year ended February 28, 2009. The increase in subscription revenue wasprimarily due to increases in volumes sold, including additional subscriptions attributable to geographicexpansion, and continuing innovation, which attracted new customers and helped to drive renewals from existingcustomers.
Training and services revenue
Training and services revenue decreased by 1.6% or $1.8 million to $109.6 million for the year endedFebruary 28, 2010 from $111.4 million for the year ended February 28, 2009. Training revenue decreased 8.3%or $3.7 million as some enterprises reduced overall spending on discretionary items such as training and relatedtravel in response to the challenging overall economic environment. Services revenue, which increased 3.0% or$2.0 million over the prior year, partially offset the reduction in training revenue. Combined training and servicesrevenue decreased as a percentage of total revenue to 14.6% for the year ended February 28, 2010 from 17.1%for the year ended February 28, 2009.
Cost of revenue
Cost of subscription revenue
Cost of subscription revenue increased by 16.5% or $6.2 million to $43.4 million for the year endedFebruary 28, 2010 from $37.3 million for the year ended February 28, 2009. The increase was primarily theresult of continued additions to our technical support staff to meet the demands of our growing subscriber basefor support and maintenance. Gross profit margin on subscriptions increased to 93.2% for the year endedFebruary 28, 2010 from 93.1% for the year ended February 28, 2009 as we leveraged existing infrastructure todeliver support and maintenance to our growing subscriber base.
Cost of training and services revenue
Cost of training and services revenue increased by 2.3% or $1.6 million to $70.4 million for the year endedFebruary 28, 2010 from $68.9 million for the year ended February 28, 2009. The cost to deliver trainingdecreased 2.8% or $0.8 million to $26.7 million for the year ended February 28, 2010 compared to $27.5 millionfor the year ended February 28, 2009. The overall decrease in training costs was driven by a decrease in externaltraining costs such as rental expense for offsite training rooms and outsourced instructors in response to reduceddemand for our training services during the first half of fiscal 2010. Costs to deliver our services revenueincreased by 5.6% or $2.3 million primarily as a result of increased travel and internal facilities costs. Because asignificant portion of our costs to deliver both training and professional services are fixed in nature, as comparedto our training and services revenue, overall costs to deliver training and services as a percentage of training andservices revenue increased to 64.3% for the year ended February 28, 2010 from 61.8% for the year endedFebruary 28, 2009.
Gross profit
Primarily as a result of changes in mix, with a greater proportion of our total revenue generated bysubscription revenue, gross profit margin increased to 84.8% for the year ended February 28, 2010 from 83.7%for the year ended February 28, 2009. Training and services revenue decreased as a percentage of total revenue to14.6% for the year ended February 28, 2010 from 17.1% for the year ended February 28, 2009.
53

Operating expenses
Sales and marketing
Sales and marketing expense increased by 14.3% or $34.2 million to $272.7 million for the year endedFebruary 28, 2010 from $238.6 million for the year ended February 28, 2009. This increase was partially due to a$23.3 million increase in selling costs, primarily related to increased employee compensation attributable to theexpansion of our sales force from the prior year. The remaining increase related to marketing costs, which grew$10.8 million or 23.4% for the year ended February 28, 2010 as compared to the year ended February 28, 2009.The increase in marketing costs included $6.3 million related to increased advertising and tradeshowexpenditures. Sales and marketing expense as a percentage of revenue decreased to 36.4% for the year endedFebruary 28, 2010 from 36.6% for the year ended February 28, 2009 as we leveraged our existing infrastructureto generate increased sales.
Research and development
Research and development expense increased by 14.0% or $18.2 million to $148.4 million for the yearended February 28, 2010 from $130.2 million for the year ended February 28, 2009. The increase in research anddevelopment costs primarily resulted from the expansion of our engineering group through direct hires and theacquisition of businesses and technologies. Employee compensation increased by $13.7 million. The remainingincrease in research and development costs relates primarily to process and technology infrastructureenhancements, which increased $4.1 million. Research and development expense was 19.8% and 19.9% of totalrevenue for the year ended February 28, 2010 and February 28, 2009, respectively.
General and administrative
General and administrative expense increased by 9.5% or $9.0 million to $104.2 million for the year endedFebruary 28, 2010 from $95.2 million for the year ended February 28, 2009. Increased headcount across allfunctions to help the business scale increased employee compensation costs by $2.4 million for the year endedFebruary 28, 2010 as compared to the year ended February 28, 2009. The remaining net increase in general andadministrative expenses of $6.6 million for the year ended February 28, 2010 as compared to the year endedFebruary 28, 2009, relates to increased outside services fees of $3.1 million, which were primarily for outsidelegal services, and $3.6 million for process and technology infrastructure enhancements, including incrementaldepreciation and amortization charges. General and administrative expense decreased as a percentage of revenueto 13.9% for the year ended February 28, 2010 from 14.6% for the year ended February 28, 2009 as we continuedto leverage our corporate functions.
Litigation settlement
On December 15, 2009, we announced that we had reached an agreement in principle to settle the classaction lawsuit, then pending in the United States District Court for the Eastern District of North Carolina,brought on behalf of a class of shareholders in connection with the restatement of our financial results announcedin July 2004. The $8.8 million expense we recorded for the year ended February 28, 2010 represents our portionof the payment pursuant to such settlement.
Interest income
Interest income decreased by 71.5% or $26.1 million to $10.4 million for the year ended February 28, 2010from $36.5 million for the year ended February 28, 2009. The decrease in interest income for the year endedFebruary 28, 2010 was attributable to (i) lower yields on our investments due to an overall lower interest rateenvironment and (ii) lower cash balances, which were reduced by outlays for acquisitions and the repurchase andredemption of our convertible debentures and repurchases of our common stock.
54

Other income, net
Other income, net increased by 324.4% or $8.2 million to $10.8 million for the year ended February 28,2010 from $2.5 million for the year ended February 28, 2009. The increase was primarily due to an increase ingains realized from the sale of our investments in available-for-sale equity securities for the year endedFebruary 28, 2010 which increased $8.8 million as compared to gains realized during the year endedFebruary 28, 2009.
Income taxes
During the year ended February 28, 2010, we recorded $34.2 million of income tax expense, which resultedin an annual effective tax rate of 28.2%. Our income tax expense for the year ended February 28, 2010 includes adiscrete tax benefit from research tax credits, net of a corresponding reduction of NOLs, which resulted in a netreduction of income tax expense of $7.3 million. Excluding the impact of the discrete tax benefit, our annualeffective tax rate was 34.2%, which differs from the U.S. federal statutory rate of 35.0% primarily due to foreignincome taxed at different rates and foreign tax credits which were partially offset by state income tax expense.
The provision for income tax for the year ended February 28, 2010 consists of $24.8 million of U.S. incometax expense and $9.4 million of foreign income tax expense. During the year ended February 28, 2009, werecorded $42.8 million of income tax expense, which resulted in an annual effective tax rate of 35.2%. Oureffective tax rate differed from the U.S. federal statutory rate of 35.0% primarily due to state income taxes whichwere partially offset by foreign income taxed at different rates and certain nonrecurring income tax deductions.The provision for income tax for the year ended February 28, 2009 consisted of $41.2 million of U.S. income taxexpense and $1.6 million of foreign income tax expense.
LIQUIDITY AND CAPITAL RESOURCES
We have historically derived a significant portion of our liquidity and operating capital from cash flowsfrom operations as well as the sale of equity securities, including private sales of preferred stock and the sale ofcommon stock in our initial and follow-on public offerings, the issuance of convertible debentures andborrowings under working capital lines of credit. At February 28, 2011, we had total cash and investments of$1.2 billion, which was comprised of $642.6 million in cash and cash equivalents, $213.5 million of short-term,available-for-sale fixed-income investments, $2.7 million of available-for-sale equity securities, $331.8 millionof long-term, available-for-sale fixed-income investments, and $1.8 million in certificates of deposit withmaturity dates greater than 30 days. This compares to total cash and investments of $970.2 million atFebruary 28, 2010.
With $642.6 million in cash and cash equivalents on hand, we believe our cash and cash equivalent balancesshould be sufficient to satisfy our cash requirements for the next twelve months and for the foreseeable future.We presently do not intend to liquidate our short and long-term investments in debt securities prior to theirscheduled maturity dates. However, in the event that we did liquidate these investments prior to their scheduledmaturities and there were adverse changes in market interest rates or the overall economic environment, we couldbe required to recognize a realized loss on those investments when we liquidate. At February 28, 2011, we havean accumulated unrealized loss of $0.5 million on our investments in debt securities compared to an accumulatedunrealized gain of $1.7 million at February 28, 2010. At February 28, 2011 and February 28, 2010, accumulatedunrealized gains related to short-term equity securities available for sale totaled $2.6 million and $4.4 million,respectively.
Year ended February 28, 2011
Cash flows—overview
At February 28, 2011, cash and cash equivalents totaled $642.6 million, an increase of $254.5 million ascompared to February 28, 2010. The increase in cash and cash equivalents for the year ended February 28, 2011
55

is primarily the result of cash provided by operations which generated $290.7 million. Also contributing to theincrease in cash was proceeds from employees’ exercise of stock options which totaled $84.4 million for the yearended February 28, 2011. Partially offsetting cash provided by operating activities and stock option proceeds wascash used to repurchase 2,921,275 shares of our common stock at a total cost of $90.1 million and investments intangible assets and a business which totaled $32.8 million and $31.4 million, respectively. Net cash generated byoperating activities and used for investing and financing activities is further described below.
Cash flows from operations
Cash provided by operations of $290.7 million during the year ended February 28, 2011 includes net incomeof $107.3 million, adjustments to exclude the impact of non-cash revenues and expenses, which totaled $97.9million net source of cash, and changes in working capital, which totaled an $85.6 million net source of cash.Cash provided by changes in operating assets and liabilities for the year ended February 28, 2011 was primarilythe result of an increase in deferred revenue which generated operating cash flow of $112.7 million. The increasein deferred revenue is due to growth in billings as we generally bill our customers in advance of subscriptionperiods. Cash generated from deferred income taxes of $33.8 million was primarily due to share-basedcompensation deductions which were in excess of amounts originally recognized in our consolidated statementsof operations. Excess tax benefits from share-based compensation, which totaled $42.3 million, is considered afinancing source of cash.
Cash flows from investing
Cash used in investing activities of $54.9 million for the year ended February 28, 2011 includes cash used topurchase Makara, a developer of deployment and management solutions for applications in the cloud, whichtotaled $31.4 million, net of cash acquired; investments in property and equipment, primarily related to processand information technology infrastructure enhancements, which totaled $32.8 million for the year endedFebruary 28, 2011; and investments in other intangible assets, primarily patents, which totaled $14.1 million forthe year ended February 28, 2011. Partially offsetting these uses were net maturities of debt securities whichtotaled $19.4 million for the year ended February 28, 2011.
Cash flows from financing
Cash provided by financing activities of $9.8 million for the year ended February 28, 2011 includesproceeds from employees’ exercise of common stock options which totaled $84.4 million and proceeds fromexcess tax benefits related to share-based employee compensation which totaled $42.3 million. Partiallyoffsetting cash provided by employees’ exercise of stock options was cash of $90.1 million used to repurchase2,921,275 shares of our common stock at an average price of $30.92 per share, including transaction costs.Payments made in return for common shares received from employees to satisfy employees’ minimum taxwithholding obligations related to restricted share awards vesting during the year ended February 28, 2011totaled $26.3 million.
Year ended February 28, 2010
Cash flows—overview
At February 28, 2010, cash and cash equivalents totaled $388.1 million, a decrease of $127.4 million ascompared to February 28, 2009. The decrease in cash and cash equivalents for the year ended February 28, 2010is a result of net cash used for investing and financing activities. During the year ended February 28, 2010, werepurchased 10,014,022 shares of our common stock at an average price of $23.61 per share totaling$236.4 million, including transaction costs. Purchases of available-for-sale debt securities, net of proceeds fromsales and maturities, totaled $254.4 million for the year ended February 28, 2010. These investing and financinguses of cash were partially offset by cash generated from operating activities and equity transactions related to
56

employee share-based compensation awards, which totaled $255.2 million and $127.0 million, respectively forthe year ended February 28, 2010. Net cash generated by operating activities and used for investing and financingactivities is further described below.
Cash flows from operations
Cash provided by operations of $255.2 million during the year ended February 28, 2010 includes net incomeof $87.3 million, adjustments to exclude the impact of non-cash revenues and expenses, which totaled a $67.8million net source of cash, and changes in working capital, which totaled a $100.2 million net source of cash.Cash provided by changes in operating assets and liabilities for the year ended February 28, 2010 was primarilythe result of an increase in our deferred revenue which generated operating cash flow of $82.6 million. Theincrease in deferred revenue is due to growth in billings as we generally bill our customers in advance ofsubscription periods. This increase in deferred revenue of $82.6 million excludes the impact of foreign currencytranslation which increased our total consolidated deferred revenue by $20.2 million for the year endedFebruary 28, 2010.
Cash flows from investing
Cash used in investing activities of $276.2 million for the year ended February 28, 2010 includes netpurchases of investments in available-for-sale debt securities of $254.4 million. Investments in property andequipment, primarily related to process and information technology infrastructure enhancements, totaled $28.4million for the year ended February 28, 2010. Investments in patents and externally developed technology totaled$4.7 million for the year ended February 28, 2010. Partially offsetting these investments were proceeds from thesale of available-for-sale equity securities which totaled $13.1 million for the year ended February 28, 2010.
Cash flows from financing
Cash used in financing activities of $110.2 million for the year ended February 28, 2010 includes $236.4million used to repurchase 10,014,022 shares of our common stock at an average price of $23.61 per share,including transaction costs. Payments made in return for common shares received from employees to satisfyemployees’ minimum tax withholding obligations related to restricted share awards vesting during the year endedFebruary 28, 2010 totaled $11.9 million. Partially offsetting financing activities using cash were excess taxbenefits related to share-based employee compensation which totaled $35.6 million and proceeds fromemployees’ exercise of common stock options which totaled $103.3 million. Payments on other borrowingstotaled $0.9 million for the year ended February 28, 2010.
Year ended February 28, 2009
Cash flows—overview
At February 28, 2009, cash and cash equivalents totaled $515.5 million, a decrease of $162.2 million ascompared to February 29, 2008. The decrease in cash and cash equivalents for the year ended February 28, 2009was a result of net cash used for investing and financing activities. During the year ended February 28, 2009, werepurchased and redeemed for $565.6 million our convertible debentures with an aggregate face amount of$570.0 million and repurchased 2,875,052 million shares of our common stock at an average price of $14.70 pershare totaling $42.3 million. Additionally, during the third quarter of fiscal 2009 we acquired Qumranet for netcash of $101.3 million. These significant investing and financing uses of cash were partially offset by cashgenerated from operating activities, which totaled $236.4 million for the year ended February 28, 2009, andproceeds from sales and maturities of our available-for-sale securities which, net of purchases, totaled $317.2million for the year ended February 28, 2009. Net cash generated by operating activities and investing and usedfor financing activities are further described below.
57

Cash flows from operations
Cash provided by operations of $236.4 million during the year ended February 28, 2009 includes net incomeof $78.7 million, adjustments to exclude the impact of non-cash revenues and expenses, which totaled a $71.9million net source of cash, and changes in working capital, which totaled a $85.8 million net source of cash. Cashprovided by changes in operating assets and liabilities for the year ended February 28, 2009 was primarily theresult of an increase in our deferred revenue which generated operating cash flow of $97.9 million. The increasein deferred revenue is due to growth in billings as we generally bill our customers in advance of subscriptionperiods. This increase in deferred revenue of $97.9 million excludes the impact of foreign currency translationwhich reduced our total consolidated reported deferred revenue by $27.7 million for the year ended February 28,2009.
Cash flows from investing
Cash provided by investing activities of $146.2 million for the year ended February 28, 2009 includes netproceeds from sales and maturities of investments in debt securities of $317.2 million and proceeds from the saleof investments in equity securities of $5.6 million. Partially offsetting these proceeds from the sale and maturityof investments were acquisitions of businesses and technologies which totaled $148.1 million, including ouracquisition of Qumranet during the third quarter of fiscal 2009 for net cash of $101.3 million. The remaining$46.8 million of investment relates to businesses and technologies we acquired during the first and secondquarters of fiscal 2009 to enhance our services capabilities in the middleware and security management markets.Investments in property and equipment, primarily related to process and information technology infrastructureenhancements, totaled $24.5 million for the year ended February 28, 2009. Investments in patents and externallydeveloped technology totaled $3.9 million for the year ended February 28, 2009.
Cash flows from financing
Cash used in financing activities of $539.2 million for the year ended February 28, 2009 is comprised of$565.6 million used to repurchase and redeem our convertible debentures with an aggregate face amount of$570.0 million. Additionally, under our common stock repurchase program we repurchased 2,875,052 of ourcommon stock at an average price of $14.70 per share using $42.3 million of cash. Purchases of treasury sharesfrom employees to satisfy employee minimum tax withholding obligations related to restricted share awardsvesting during the year ended February 28, 2009 totaled $2.7 million. Partially offsetting financing activitiesusing cash were proceeds from excess tax benefits related to share-based employee compensation which totaled$51.1 million, proceeds from employees’ exercise of common stock options which totaled $18.4 million andproceeds from a structured stock repurchase transaction which totaled $2.0 million for the year endedFebruary 28, 2009.
Investments in debt and equity securities
Our investments are comprised primarily of debt securities that are classified as available for sale andrecorded at their fair market values. At February 28, 2011 and February 28, 2010, the vast majority of ourinvestments were priced by pricing vendors. These pricing vendors use the most recent observable marketinformation in pricing these securities or, if specific prices are not available for these securities, use otherobservable inputs. In the event observable inputs are not available, we assess other factors to determine thesecurities’ market value, including broker quotes or model valuations. Independent price verifications of all ofour holdings are performed by the pricing vendors, which we review. In the event a price fails a pre-establishedtolerance check, it is researched so that we can assess the cause of the variance to determine what we believe isthe appropriate fair market value.
58

Capital requirements
We have experienced a substantial increase in our operating expenses since our inception in connection withthe growth of our operations, the development of our enterprise technologies, the expansion of our servicesoperations and our acquisition activity. Our capital requirements during the year ending February 29, 2012 willdepend on numerous factors, including the amount of resources we devote to:
Š funding the continued development of our enterprise technology offerings;
Š accelerating the development of our systems management services;
Š improving and extending our services and the technologies used to deliver these services to ourcustomers and support our business;
Š pursuing strategic acquisitions and alliances; and
Š investing in businesses, products and technologies.
We have utilized, and will continue from time to time to utilize, cash and investments to fund, among otherpotential uses, purchases of our common stock, purchases of fixed assets and mergers and acquisitions.
Given our historically strong operating cash flow and the $1.2 billion of cash and investments held atFebruary 28, 2011, we do not presently anticipate the need to raise cash to fund our operations, either through thesale of additional equity or through the issuance of debt, in the foreseeable future. However, we may takeadvantage of favorable capital market situations that may arise from time to time to raise additional capital.
We believe that cash flow from operations will continue to improve; however, there can be no assurancesthat we will improve our cash flow from operations from the current rate or that such cash flows will be adequateto fund other investments or acquisitions that we may choose to make. We may choose to accelerate theexpansion of our business from our current plans, which may require us to raise additional funds through the saleof equity or debt securities or through other financing means. There can be no assurances that any such financingwould occur in amounts or on terms favorable to us, if at all.
Off-balance sheet arrangements
As of February 28, 2011 and February 28, 2010, we have no off-balance sheet financing arrangements anddo not utilize any “structured debt”, “special purpose” or similar unconsolidated entities for liquidity or financingpurposes.
Contractual obligations
The following table summarizes our principal contractual obligations at February 28, 2011 (in thousands):
TotalLess than1 Year 1-3 Years 3-5 Years
More than5 Years
Operating lease obligations . . . . . . . . . . . . . . . . . . . . . . . . . $87,426 $21,851 $28,595 $18,010 $18,970Purchase obligations . . . . . . . . . . . . . . . . . . . . . . . . . . . . . . . — — — — —Other debt obligations, including related interest . . . . . . . . . 575 575 — — —
Total . . . . . . . . . . . . . . . . . . . . . . . . . . . . . . . . . . . . . . . . . . . $88,001 $22,426 $28,595 $18,010 $18,970
Because we are unable to reasonably estimate the timing of settlements and any future payments related touncertain tax positions, such liabilities are not included in the above table. However, as of February 28, 2011, wehave recognized a total of $23.8 million related to such liabilities, which are included in other long-termobligations on our Consolidated Balance Sheet.
59

RECENT ACCOUNTING PRONOUNCEMENTS
In January 2010, the FASB issued guidance amending disclosure requirements related to Fair ValueMeasurements and Disclosures-Overall Subtopic 820-10 of the FASB Accounting Standards Codification (“ASC820-10”) originally issued as FASB Statement No. 157, Fair Value Measurements. The amended guidancerequires companies to disclose separately the amounts of significant transfers in and out of Level 1 and Level 2fair value measurements and describe the reasons for such transfers. These additional disclosure requirementswere effective for reporting periods beginning March 1, 2010. For the year ended February 28, 2011, we did nothave any transfers in and out of Level 1 and Level 2 fair value measurements. The amended guidance alsorequires additional disclosures related to Level 3 fair value measurements. We do not currently have Level 3 fairvalue measurements.
60

ITEM 7A. QUANTITATIVE AND QUALITATIVE DISCLOSURES ABOUTMARKET RISK
We are exposed to the impact of interest rate changes, foreign currency exchange rate fluctuations andchanges in the market value of our investments.
Interest Rate Risk
Our exposure to market rate risk for changes in interest rates relates primarily to our investment portfolio.The primary objective of our investment activities is to preserve principal and liquidity while at the same timemaximizing yields without significantly increasing risk. To achieve this objective, we maintain our portfolio ofcash equivalents and short-term and long-term investments in a variety of fixed-income securities, including bothgovernment and corporate obligations and money market funds. Investments in both fixed rate and floating rateinterest earning instruments carry a degree of interest rate risk. Fixed rate securities may have their fair marketvalue adversely impacted due to a rise in prevailing interest rates, while floating rate securities may produce lessincome than expected if interest rates fall. Due in part to these factors, our future investment income may fallshort of expectations due to changes in interest rates, or we may suffer losses in principal if forced to sellsecurities which have declined in market value due to changes in interest rates or perceived credit risk related tothe securities’ issuers. A hypothetical one percentage point change in interest rates, assuming a parallel shift ofall interest rates, would result in an $8.0 million change in annual interest income derived from investments inour portfolio as of February 28, 2011. For further discussion related to our investments as of February 28, 2011and February 28, 2010, see NOTE 2 and NOTE 18 to the Consolidated Financial Statements.
Investment Risk
The fair market value of our investment portfolio is subject to interest rate risk. Based on a sensitivityanalysis performed on this investment portfolio, a hypothetical one percentage point increase in prevailinginterest rates would result in an approximate $10.2 million decrease in the fair value of our available-for-saleinvestment securities as of February 28, 2011. For further discussion related to our investments as ofFebruary 28, 2011 and February 28, 2010, see NOTE 2 and NOTE 18 to the Consolidated Financial Statements.
Credit Risk
The fair market values of our investment portfolio and cash balances are exposed to counterparty credit risk.Accordingly, while we periodically review our portfolio in an effort to mitigate counterparty risk, the principalvalues of our cash balances, money market accounts and investments in available-for-sale securities could suffera loss of value.
Foreign Currency Risk
Approximately 43.7% of our revenue for the year ended February 28, 2011 was produced by sales outsidethe United States. We are exposed to significant risks of foreign currency fluctuation primarily from receivablesdenominated in foreign currency and are subject to transaction gains and losses, which are recorded as acomponent in determining net income. The income statements of our non-U.S. operations are translated into U.S.dollars at the average exchange rates for each applicable month in a period. To the extent the U.S. dollar weakensagainst foreign currencies, the translation of these foreign currency statements results in increased revenue andoperating expenses for our non-U.S. operations. Similarly, our revenue and operating expenses for our non-U.S.operations decreases if the U.S. dollar strengthens against foreign currencies.
Using the average foreign currency exchange rates from the year ended February 28, 2010, our revenuefrom non-U.S. operations for the year ended February 28, 2011 would have been higher than we reported usingthe average exchange rates for the year ending February 28, 2011 by approximately $0.9 million. Under the sameassumptions, operating expenses would have been higher than we reported by approximately $2.5 million, whichwould have resulted in income from operations being lower by approximately $1.6 million. For furtherdiscussion, see NOTE 2 and NOTE 10 to the Consolidated Financial Statements.
61

Derivative Instruments
We transact business in various foreign countries and are, therefore, subject to risk of foreign currencyexchange rate fluctuations. We sometimes enter into forward contracts to economically hedge transactionalexposure associated with commitments arising from trade accounts receivable, trade accounts payable and fixedpurchase obligations denominated in a currency other than the functional currency of the respective operatingentity. All derivative instruments are recorded on the Consolidated Balance Sheets at their respective fair marketvalues in accordance with FASB ASC Section 815 (formerly referenced as Statement of Financial AccountingStandards No. 133, Accounting for Derivative Instruments and Hedging Activities). The Company has electednot to prepare and maintain the documentation required to qualify its forward contracts for hedge accountingtreatment and, therefore, changes in fair value are recorded in the Consolidated Statements of Operations.
The aggregate notional amount of outstanding forward contracts at February 28, 2011 was $64.5 million.The fair value of these outstanding contracts at February 28, 2011 was a gross $0.4 million asset and a gross $0.1million liability, and is recorded in other current assets and accrued expenses, respectively on the ConsolidatedBalance Sheets. The forward contracts generally expire within three months of the period ended February 28,2011. The forward contracts will settle in Japanese yen, Swiss francs, Swedish krona, Czech koruna, Canadiandollars, Singapore dollars and Australian dollars.
The aggregate notional amount of outstanding forward contracts at February 28, 2010 was $8.4 million. Thefair value of these outstanding contracts at February 28, 2010 was, gross, a less than $0.1 million asset and a lessthan $0.1 million liability, and is recorded in other current assets and accrued expenses, respectively on theConsolidated Balance Sheets.
62

ITEM 8. FINANCIAL STATEMENTS AND SUPPLEMENTARY DATA
INDEX TO CONSOLIDATED FINANCIAL STATEMENTS
Page
Report of Management on Internal Control Over Financial Reporting . . . . . . . . . . . . . . . . . . . . . . . . . . . . . . 64
Report of Independent Registered Public Accounting Firm . . . . . . . . . . . . . . . . . . . . . . . . . . . . . . . . . . . . . . 65
Financial Statements:
Consolidated Balance Sheets at February 28, 2011 and February 28, 2010 . . . . . . . . . . . . . . . . . . . . . . 66
Consolidated Statements of Operations for the years ended February 28, 2011, February 28, 2010 andFebruary 28, 2009 . . . . . . . . . . . . . . . . . . . . . . . . . . . . . . . . . . . . . . . . . . . . . . . . . . . . . . . . . . . . . . . . . 67
Consolidated Statements of Stockholders’ Equity and Comprehensive Income for the years endedFebruary 28, 2011, February 28, 2010 and February 28, 2009 . . . . . . . . . . . . . . . . . . . . . . . . . . . . . . 68
Consolidated Statements of Cash Flows for the years ended February 28, 2011, February 28, 2010and February 28, 2009 . . . . . . . . . . . . . . . . . . . . . . . . . . . . . . . . . . . . . . . . . . . . . . . . . . . . . . . . . . . . . 69
Notes to Consolidated Financial Statements . . . . . . . . . . . . . . . . . . . . . . . . . . . . . . . . . . . . . . . . . . . . . . 70
63

REPORT OF MANAGEMENT ON INTERNAL CONTROL OVER FINANCIAL REPORTING
Our management is responsible for establishing and maintaining adequate internal control over financialreporting (as defined in Rules 13a-15(f) and 15d-15(f) under the Exchange Act). Internal control over financialreporting is a process designed to provide reasonable assurance regarding the reliability of financial reporting andthe preparation of financial statements for external purposes in accordance with accounting principles generallyaccepted in the United States of America. The Company’s internal control over financial reporting includes thosepolicies and procedures that: (i) pertain to the maintenance of records that, in reasonable detail, accurately andfairly reflect the transactions and dispositions of the assets of the Company; (ii) provide reasonable assurance thattransactions are recorded as necessary to permit preparation of financial statements in accordance withaccounting principles generally accepted in the United States of America, and that receipts and expenditures ofthe Company are being made only in accordance with authorizations of management and directors of theCompany; and (iii) provide reasonable assurance regarding prevention or timely detection of unauthorizedacquisition, use, or disposition of the Company’s assets that could have a material effect on the financialstatements.
Our management conducted an evaluation of the effectiveness of our internal control over financialreporting as of the end of the period covered by this report based on the framework in Internal Control—Integrated Framework issued by the Committee of Sponsoring Organizations of the Treadway Commission.Based on this evaluation, management concluded that the Company’s internal control over financial reportingwas effective as of the end of the period covered by this report.
Our independent registered public accounting firm, which has audited the financial statements included inPart II, Item 8 of this report, has also audited the effectiveness of the Company’s internal control over financialreporting as of February 28, 2011, as stated in their report, which is included below.
64

REPORT OF INDEPENDENT REGISTERED PUBLIC ACCOUNTING FIRM
To the Board of Directors and Shareholders of Red Hat, Inc.:
In our opinion, the accompanying consolidated balance sheets and the related consolidated statements ofoperations, of stockholders’ equity and comprehensive income and of cash flows present fairly, in all materialrespects, the financial position of Red Hat, Inc. and its subsidiaries at February 28, 2011 and February 28, 2010,and the results of their operations and their cash flows for each of the three years in the period endedFebruary 28, 2011 in conformity with accounting principles generally accepted in the United States of America.Also in our opinion, the Company maintained, in all material respects, effective internal control over financialreporting as of February 28, 2011, based on criteria established in Internal Control—Integrated Frameworkissued by the Committee of Sponsoring Organizations of the Treadway Commission (COSO). The Company’smanagement is responsible for these financial statements, for maintaining effective internal control over financialreporting and for its assessment of the effectiveness of internal control over financial reporting, included inManagement’s Report on Internal Control over Financial Reporting appearing in Item 8. Our responsibility is toexpress opinions on these financial statements and on the Company’s internal control over financial reportingbased on our integrated audits. We conducted our audits in accordance with the standards of the Public CompanyAccounting Oversight Board (United States). Those standards require that we plan and perform the audits toobtain reasonable assurance about whether the financial statements are free of material misstatement and whethereffective internal control over financial reporting was maintained in all material respects. Our audits of thefinancial statements included examining, on a test basis, evidence supporting the amounts and disclosures in thefinancial statements, assessing the accounting principles used and significant estimates made by management,and evaluating the overall financial statement presentation. Our audit of internal control over financial reportingincluded obtaining an understanding of internal control over financial reporting, assessing the risk that a materialweakness exists, and testing and evaluating the design and operating effectiveness of internal control based onthe assessed risk. Our audits also included performing such other procedures as we considered necessary in thecircumstances. We believe that our audits provide a reasonable basis for our opinions.
A company’s internal control over financial reporting is a process designed to provide reasonable assuranceregarding the reliability of financial reporting and the preparation of financial statements for external purposes inaccordance with generally accepted accounting principles. A company’s internal control over financial reportingincludes those policies and procedures that (i) pertain to the maintenance of records that, in reasonable detail,accurately and fairly reflect the transactions and dispositions of the assets of the company; (ii) provide reasonableassurance that transactions are recorded as necessary to permit preparation of financial statements in accordancewith generally accepted accounting principles, and that receipts and expenditures of the company are being madeonly in accordance with authorizations of management and directors of the company; and (iii) provide reasonableassurance regarding prevention or timely detection of unauthorized acquisition, use, or disposition of thecompany’s assets that could have a material effect on the financial statements.
Because of its inherent limitations, internal control over financial reporting may not prevent or detectmisstatements. Also, projections of any evaluation of effectiveness to future periods are subject to the risk thatcontrols may become inadequate because of changes in conditions, or that the degree of compliance with thepolicies or procedures may deteriorate.
/s/ PricewaterhouseCoopers LLP
Raleigh, North Carolina
April 22, 2011
65
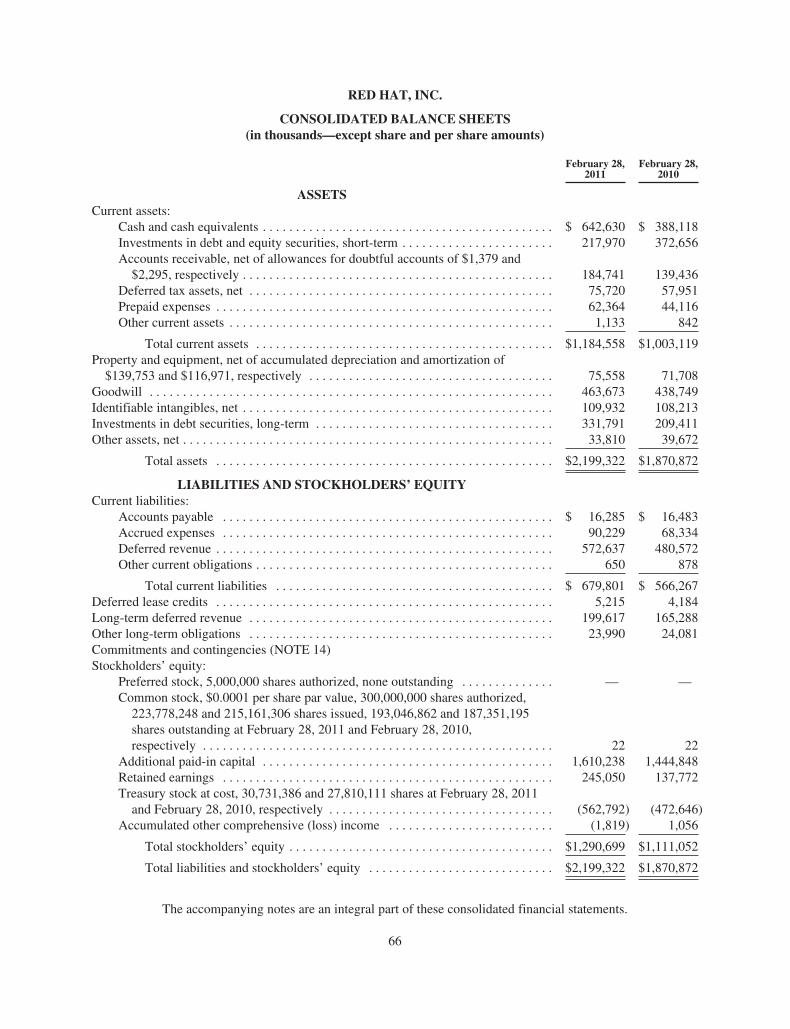
RED HAT, INC.
CONSOLIDATED BALANCE SHEETS(in thousands—except share and per share amounts)
February 28,2011
February 28,2010
ASSETSCurrent assets:
Cash and cash equivalents . . . . . . . . . . . . . . . . . . . . . . . . . . . . . . . . . . . . . . . . . . . . $ 642,630 $ 388,118Investments in debt and equity securities, short-term . . . . . . . . . . . . . . . . . . . . . . . 217,970 372,656Accounts receivable, net of allowances for doubtful accounts of $1,379 and$2,295, respectively . . . . . . . . . . . . . . . . . . . . . . . . . . . . . . . . . . . . . . . . . . . . . . . 184,741 139,436
Deferred tax assets, net . . . . . . . . . . . . . . . . . . . . . . . . . . . . . . . . . . . . . . . . . . . . . . 75,720 57,951Prepaid expenses . . . . . . . . . . . . . . . . . . . . . . . . . . . . . . . . . . . . . . . . . . . . . . . . . . . 62,364 44,116Other current assets . . . . . . . . . . . . . . . . . . . . . . . . . . . . . . . . . . . . . . . . . . . . . . . . . 1,133 842
Total current assets . . . . . . . . . . . . . . . . . . . . . . . . . . . . . . . . . . . . . . . . . . . . . $1,184,558 $1,003,119Property and equipment, net of accumulated depreciation and amortization of$139,753 and $116,971, respectively . . . . . . . . . . . . . . . . . . . . . . . . . . . . . . . . . . . . . 75,558 71,708
Goodwill . . . . . . . . . . . . . . . . . . . . . . . . . . . . . . . . . . . . . . . . . . . . . . . . . . . . . . . . . . . . . 463,673 438,749Identifiable intangibles, net . . . . . . . . . . . . . . . . . . . . . . . . . . . . . . . . . . . . . . . . . . . . . . . 109,932 108,213Investments in debt securities, long-term . . . . . . . . . . . . . . . . . . . . . . . . . . . . . . . . . . . . 331,791 209,411Other assets, net . . . . . . . . . . . . . . . . . . . . . . . . . . . . . . . . . . . . . . . . . . . . . . . . . . . . . . . . 33,810 39,672
Total assets . . . . . . . . . . . . . . . . . . . . . . . . . . . . . . . . . . . . . . . . . . . . . . . . . . . $2,199,322 $1,870,872
LIABILITIES AND STOCKHOLDERS’ EQUITYCurrent liabilities:
Accounts payable . . . . . . . . . . . . . . . . . . . . . . . . . . . . . . . . . . . . . . . . . . . . . . . . . . $ 16,285 $ 16,483Accrued expenses . . . . . . . . . . . . . . . . . . . . . . . . . . . . . . . . . . . . . . . . . . . . . . . . . . 90,229 68,334Deferred revenue . . . . . . . . . . . . . . . . . . . . . . . . . . . . . . . . . . . . . . . . . . . . . . . . . . . 572,637 480,572Other current obligations . . . . . . . . . . . . . . . . . . . . . . . . . . . . . . . . . . . . . . . . . . . . . 650 878
Total current liabilities . . . . . . . . . . . . . . . . . . . . . . . . . . . . . . . . . . . . . . . . . . $ 679,801 $ 566,267Deferred lease credits . . . . . . . . . . . . . . . . . . . . . . . . . . . . . . . . . . . . . . . . . . . . . . . . . . . 5,215 4,184Long-term deferred revenue . . . . . . . . . . . . . . . . . . . . . . . . . . . . . . . . . . . . . . . . . . . . . . 199,617 165,288Other long-term obligations . . . . . . . . . . . . . . . . . . . . . . . . . . . . . . . . . . . . . . . . . . . . . . 23,990 24,081Commitments and contingencies (NOTE 14)Stockholders’ equity:
Preferred stock, 5,000,000 shares authorized, none outstanding . . . . . . . . . . . . . . — —Common stock, $0.0001 per share par value, 300,000,000 shares authorized,223,778,248 and 215,161,306 shares issued, 193,046,862 and 187,351,195shares outstanding at February 28, 2011 and February 28, 2010,respectively . . . . . . . . . . . . . . . . . . . . . . . . . . . . . . . . . . . . . . . . . . . . . . . . . . . . . 22 22
Additional paid-in capital . . . . . . . . . . . . . . . . . . . . . . . . . . . . . . . . . . . . . . . . . . . . 1,610,238 1,444,848Retained earnings . . . . . . . . . . . . . . . . . . . . . . . . . . . . . . . . . . . . . . . . . . . . . . . . . . 245,050 137,772Treasury stock at cost, 30,731,386 and 27,810,111 shares at February 28, 2011and February 28, 2010, respectively . . . . . . . . . . . . . . . . . . . . . . . . . . . . . . . . . . (562,792) (472,646)
Accumulated other comprehensive (loss) income . . . . . . . . . . . . . . . . . . . . . . . . . (1,819) 1,056
Total stockholders’ equity . . . . . . . . . . . . . . . . . . . . . . . . . . . . . . . . . . . . . . . . $1,290,699 $1,111,052
Total liabilities and stockholders’ equity . . . . . . . . . . . . . . . . . . . . . . . . . . . . $2,199,322 $1,870,872
The accompanying notes are an integral part of these consolidated financial statements.
66
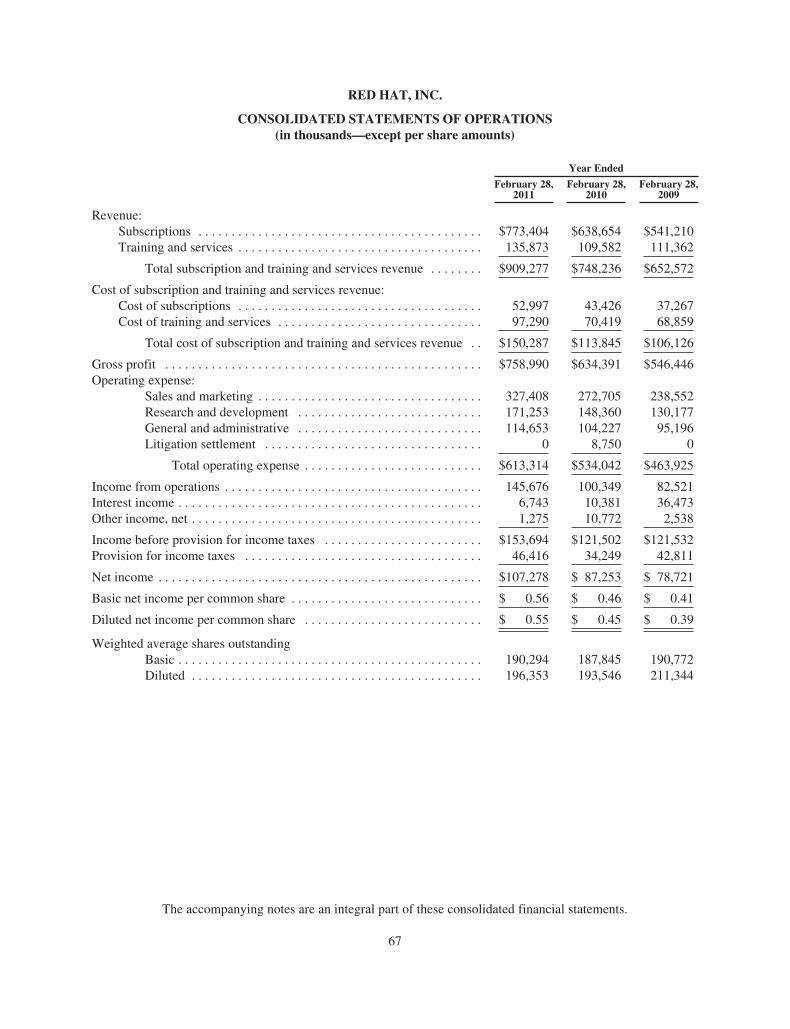
RED HAT, INC.
CONSOLIDATED STATEMENTS OF OPERATIONS(in thousands—except per share amounts)
Year Ended
February 28,2011
February 28,2010
February 28,2009
Revenue:Subscriptions . . . . . . . . . . . . . . . . . . . . . . . . . . . . . . . . . . . . . . . . . . . $773,404 $638,654 $541,210Training and services . . . . . . . . . . . . . . . . . . . . . . . . . . . . . . . . . . . . . 135,873 109,582 111,362
Total subscription and training and services revenue . . . . . . . . $909,277 $748,236 $652,572
Cost of subscription and training and services revenue:Cost of subscriptions . . . . . . . . . . . . . . . . . . . . . . . . . . . . . . . . . . . . . 52,997 43,426 37,267Cost of training and services . . . . . . . . . . . . . . . . . . . . . . . . . . . . . . . 97,290 70,419 68,859
Total cost of subscription and training and services revenue . . $150,287 $113,845 $106,126
Gross profit . . . . . . . . . . . . . . . . . . . . . . . . . . . . . . . . . . . . . . . . . . . . . . . . $758,990 $634,391 $546,446Operating expense:
Sales and marketing . . . . . . . . . . . . . . . . . . . . . . . . . . . . . . . . . . 327,408 272,705 238,552Research and development . . . . . . . . . . . . . . . . . . . . . . . . . . . . 171,253 148,360 130,177General and administrative . . . . . . . . . . . . . . . . . . . . . . . . . . . . 114,653 104,227 95,196Litigation settlement . . . . . . . . . . . . . . . . . . . . . . . . . . . . . . . . . 0 8,750 0
Total operating expense . . . . . . . . . . . . . . . . . . . . . . . . . . . $613,314 $534,042 $463,925
Income from operations . . . . . . . . . . . . . . . . . . . . . . . . . . . . . . . . . . . . . . . 145,676 100,349 82,521Interest income . . . . . . . . . . . . . . . . . . . . . . . . . . . . . . . . . . . . . . . . . . . . . . 6,743 10,381 36,473Other income, net . . . . . . . . . . . . . . . . . . . . . . . . . . . . . . . . . . . . . . . . . . . . 1,275 10,772 2,538
Income before provision for income taxes . . . . . . . . . . . . . . . . . . . . . . . . $153,694 $121,502 $121,532Provision for income taxes . . . . . . . . . . . . . . . . . . . . . . . . . . . . . . . . . . . . 46,416 34,249 42,811
Net income . . . . . . . . . . . . . . . . . . . . . . . . . . . . . . . . . . . . . . . . . . . . . . . . . $107,278 $ 87,253 $ 78,721
Basic net income per common share . . . . . . . . . . . . . . . . . . . . . . . . . . . . . $ 0.56 $ 0.46 $ 0.41
Diluted net income per common share . . . . . . . . . . . . . . . . . . . . . . . . . . . $ 0.55 $ 0.45 $ 0.39
Weighted average shares outstandingBasic . . . . . . . . . . . . . . . . . . . . . . . . . . . . . . . . . . . . . . . . . . . . . . 190,294 187,845 190,772Diluted . . . . . . . . . . . . . . . . . . . . . . . . . . . . . . . . . . . . . . . . . . . . 196,353 193,546 211,344
The accompanying notes are an integral part of these consolidated financial statements.
67
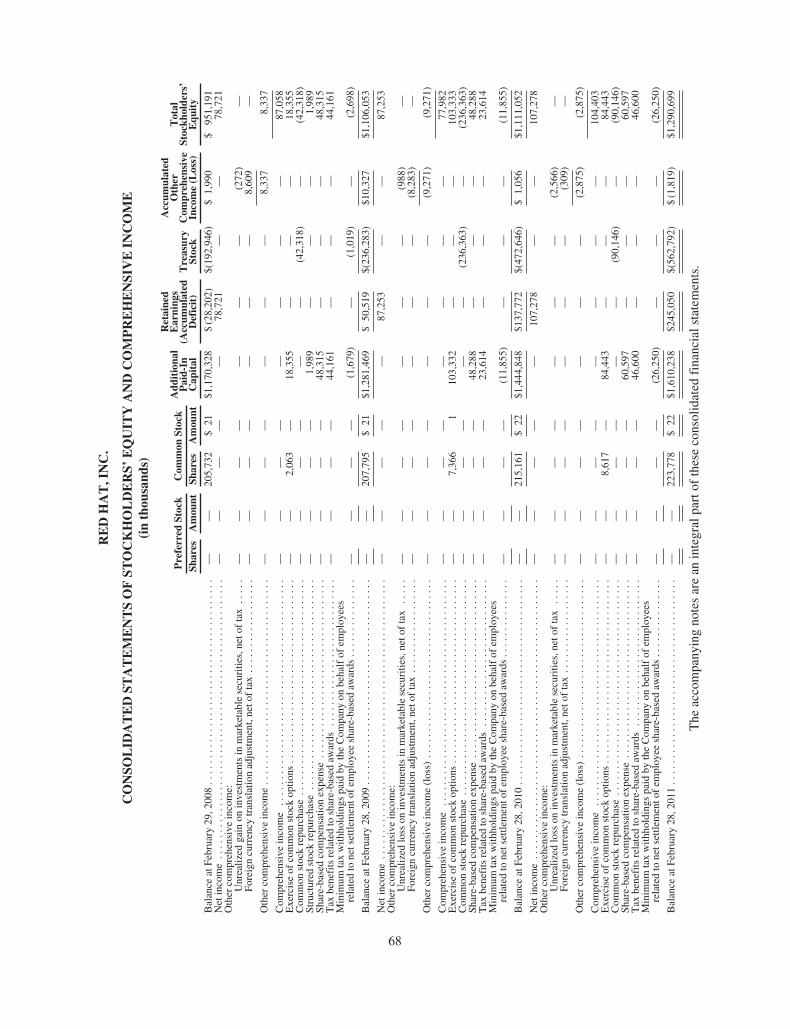
REDHAT,INC.
CONSO
LID
ATEDST
ATEMENTSOFST
OCKHOLDERS’
EQUIT
YANDCOMPREHENSIVEIN
COME
(inthou
sand
s)
Preferred
Stock
Com
mon
Stock
Add
itiona
lPaid-In
Cap
ital
Retained
Earning
s(A
ccum
ulated
Deficit)
Treasury
Stock
Accum
ulated
Other
Com
prehensive
Income(Loss)
Total
Stockh
olders’
Equ
ity
Shares
Amou
ntSh
ares
Amou
nt
Balance
atFebruary
29,2008.......................................
——
205,732
$21
$1,170,328
$(28,202)
$(192,946)
$1,990
$951,191
Netincome..................................
...................
——
——
—78,721
——
78,721
Other
comprehensive
income:
Unrealized
gain
oninvestmentsin
marketablesecurities,neto
ftax.....
——
——
——
—(272)
—Fo
reigncurrency
translationadjustment,neto
ftax..................
——
——
——
—8,609
—
Other
comprehensive
income.......................................
——
——
——
—8,337
8,337
Com
prehensive
income
...........................................
——
——
——
——
87,058
Exerciseof
common
stockoptio
ns................
...................
——
2,063
—18,355
——
—18,355
Com
mon
stockrepurchase
......................
...................
——
——
——
(42,318)
—(42,318)
Structured
stockrepurchase
....................
....................
——
——
1,989
——
—1,989
Share-basedcompensationexpense..............
....................
——
——
48,315
——
—48,315
Tax
benefitsrelatedto
share-basedaw
ards
........
....................
——
——
44,161
——
—44,161
Minim
umtaxwith
holdings
paid
bytheCom
pany
onbehalfof
employees
relatedto
netsettlemento
fem
ployee
share-basedaw
ards
...............
——
——
(1,679)
—(1,019)
—(2,698)
Balance
atFebruary
28,2009.......................................
——
207,795
$21
$1,281,469
$50,519
$(236,283)
$10,327
$1,106,053
Netincome.....................................................
——
——
—87,253
——
87,253
Other
comprehensive
income:
Unrealized
loss
oninvestmentsin
marketablesecurities,neto
ftax
.....
——
——
——
—(988)
—Fo
reigncurrency
translationadjustment,neto
ftax..................
——
——
——
—(8,283)
—
Other
comprehensive
income(loss)
..................................
——
——
——
—(9,271)
(9,271)
Com
prehensive
income
...........................................
——
——
——
——
77,982
Exerciseof
common
stockoptio
ns................
...................
——
7,366
1103,332
——
—103,333
Com
mon
stockrepurchase
......................
...................
——
——
——
(236,363)
—(236,363)
Share-basedcompensationexpense..............
....................
——
——
48,288
——
—48,288
Tax
benefitsrelatedto
share-basedaw
ards
........
....................
——
——
23,614
——
—23,614
Minim
umtaxwith
holdings
paid
bytheCom
pany
onbehalfof
employees
relatedto
netsettlemento
fem
ployee
share-basedaw
ards
...............
——
——
(11,855)
——
—(11,855)
Balance
atFebruary
28,2010.......................................
——
215,161
$22
$1,444,848
$137,772
$(472,646)
$1,056
$1,111,052
Netincome.....................................................
——
——
—107,278
——
107,278
Other
comprehensive
income:
Unrealized
loss
oninvestmentsin
marketablesecurities,neto
ftax
.....
——
——
——
—(2,566)
—Fo
reigncurrency
translationadjustment,neto
ftax..................
——
——
——
—(309)
—
Other
comprehensive
income(loss)
..................................
——
——
——
—(2,875)
(2,875)
Com
prehensive
income
...........................................
——
——
——
——
104,403
Exerciseof
common
stockoptio
ns................
...................
——
8,617
—84,443
——
—84,443
Com
mon
stockrepurchase
......................
...................
——
——
——
(90,146)
—(90,146)
Share-basedcompensationexpense..............
....................
——
——
60,597
——
—60,597
Tax
benefitsrelatedto
share-basedaw
ards
........
....................
——
——
46,600
——
—46,600
Minim
umtaxwith
holdings
paid
bytheCom
pany
onbehalfof
employees
relatedto
netsettlemento
fem
ployee
share-basedaw
ards
...............
——
——
(26,250)
——
—(26,250)
Balance
atFebruary
28,2011.......................................
——
223,778
$22
$1,610,238
$245,050
$(562,792)
$(1,819)
$1,290,699
The
accompanyingnotesarean
integralpartof
theseconsolidated
financialstatements.
68

RED HAT, INC.
CONSOLIDATED STATEMENTS OF CASH FLOWS(in thousands)
Year Ended
February 28,2011
February 28,2010
February 28,2009
Cash flows from operating activities:Net income . . . . . . . . . . . . . . . . . . . . . . . . . . . . . . . . . . . . . . . . . . . . . . . . . . . $ 107,278 $ 87,253 $ 78,721
Adjustments to reconcile net income to net cash provided by operating activities:Depreciation and amortization . . . . . . . . . . . . . . . . . . . . . . . . . . . . . . . . . . . . 47,997 45,861 40,309Deferred income taxes . . . . . . . . . . . . . . . . . . . . . . . . . . . . . . . . . . . . . . . . . . 33,848 20,636 38,979Excess tax benefits from share-based payment arrangements . . . . . . . . . . . . (42,291) (35,569) (51,137)Share-based compensation expense . . . . . . . . . . . . . . . . . . . . . . . . . . . . . . . . 60,597 48,288 48,315Gain from repurchase of convertible debentures . . . . . . . . . . . . . . . . . . . . . . 0 0 (4,129)Amortization of debt issuance costs . . . . . . . . . . . . . . . . . . . . . . . . . . . . . . . . 0 0 2,319Gain on sale of available-for-sale securities . . . . . . . . . . . . . . . . . . . . . . . . . . (3,746) (12,656) (3,848)Other . . . . . . . . . . . . . . . . . . . . . . . . . . . . . . . . . . . . . . . . . . . . . . . . . . . . . . . . 1,505 1,248 1,094
Changes in operating assets and liabilities net of effects of acquisitions:Accounts receivable . . . . . . . . . . . . . . . . . . . . . . . . . . . . . . . . . . . . . . . . . . . . (41,512) (7,290) (2,341)Prepaid expenses . . . . . . . . . . . . . . . . . . . . . . . . . . . . . . . . . . . . . . . . . . . . . . . (17,220) (630) (18,606)Accounts payable . . . . . . . . . . . . . . . . . . . . . . . . . . . . . . . . . . . . . . . . . . . . . . (381) 6,569 (7,275)Accrued expenses . . . . . . . . . . . . . . . . . . . . . . . . . . . . . . . . . . . . . . . . . . . . . . 29,915 15,423 17,056Deferred revenue . . . . . . . . . . . . . . . . . . . . . . . . . . . . . . . . . . . . . . . . . . . . . . . 112,724 82,625 97,861Other . . . . . . . . . . . . . . . . . . . . . . . . . . . . . . . . . . . . . . . . . . . . . . . . . . . . . . . . 2,034 3,491 (879)
Net cash provided by operating activities . . . . . . . . . . . . . . . . . . . . . . . . $ 290,748 $ 255,249 $ 236,439
Cash flows from investing activities:Purchase of investment in debt securities available-for-sale . . . . . . . . . . . . . (751,420) (666,890) (396,810)Proceeds from sales and maturities of investment in debt securitiesavailable-for-sale . . . . . . . . . . . . . . . . . . . . . . . . . . . . . . . . . . . . . . . . . . . . . 770,860 412,514 714,015
Acquisitions of businesses, net of cash acquired . . . . . . . . . . . . . . . . . . . . . . (31,381) 0 (148,140)Proceeds from sales of investment in equity securities available for sale . . . 3,938 13,053 5,568Purchase of strategic equity investments . . . . . . . . . . . . . . . . . . . . . . . . . . . . 0 (1,768) 0Purchase of developed software and other intangible assets . . . . . . . . . . . . . (14,093) (4,692) (3,932)Purchase of property and equipment . . . . . . . . . . . . . . . . . . . . . . . . . . . . . . . . (32,759) (28,420) (24,485)
Net cash provided by (used in) investing activities . . . . . . . . . . . . . . . . $ (54,855) $(276,203) $ 146,216
Cash flows from financing activities:Excess tax benefits from share-based payment arrangements . . . . . . . . . . . . 42,291 35,569 51,137Redemption and repurchase of convertible debentures . . . . . . . . . . . . . . . . . 0 0 (565,558)Proceeds from exercise of common stock options . . . . . . . . . . . . . . . . . . . . . 84,443 103,332 18,355Purchase of treasury stock . . . . . . . . . . . . . . . . . . . . . . . . . . . . . . . . . . . . . . . (90,146) (236,393) (42,319)Structured stock repurchase . . . . . . . . . . . . . . . . . . . . . . . . . . . . . . . . . . . . . . 0 0 1,989Proceeds from other borrowings . . . . . . . . . . . . . . . . . . . . . . . . . . . . . . . . . . . 318 0 0Payments on other borrowings . . . . . . . . . . . . . . . . . . . . . . . . . . . . . . . . . . . . (876) (900) (69)Payments related to settlement of employee shared-based awards . . . . . . . . (26,250) (11,855) (2,698)
Net cash provided by (used in) financing activities . . . . . . . . . . . . . . . . $ 9,780 $(110,247) $(539,163)
Effect of foreign currency exchange rates on cash and cash equivalents . . . . . . . . $ 8,839 $ 3,771 $ (5,664)
Net increase (decrease) in cash and cash equivalents . . . . . . . . . . . . . . . . . . . . . . . $ 254,512 $(127,430) $(162,172)Cash and cash equivalents at beginning of year . . . . . . . . . . . . . . . . . . . . . . . . . . . 388,118 515,548 677,720
Cash and cash equivalents at end of year . . . . . . . . . . . . . . . . . . . . . . . . . . . . . . . . $ 642,630 $ 388,118 $ 515,548
Supplemental cash flow information:Cash paid during the year for:
Interest . . . . . . . . . . . . . . . . . . . . . . . . . . . . . . . . . . . . . . . . . . . . . . . . . . . . . . . $ 122 $ 129 $ 2,475Income taxes . . . . . . . . . . . . . . . . . . . . . . . . . . . . . . . . . . . . . . . . . . . . . . . . . . $ 8,121 $ 5,730 $ 4,950
The accompanying notes are an integral part of these consolidated financial statements.
69

RED HAT, INC.
NOTES TO CONSOLIDATED FINANCIAL STATEMENTS
NOTE 1—Company
Red Hat, Inc., incorporated in Delaware, together with its subsidiaries (“Red Hat” or the “Company”) is aglobal leader in providing open source software solutions to the enterprise. The Company is also the marketleader in providing enterprise-ready open source operating system platforms. The Company applies itstechnology leadership to create its: enterprise operating platform, Red Hat Enterprise Linux; enterprisemiddleware platform, JBoss Enterprise Middleware; virtualization solutions and other infrastructure technologysolutions, based on open source technology. The Company’s enterprise solutions are intended to meet thefunctionality requirements and performance demands of the enterprise and third-party computer hardware andsoftware applications that are critical to the enterprise. The Company provides these solutions through contentdistribution and management services, Red Hat Network, RHN Satellite and JBoss Operations Network, whichallow various Red Hat enterprise technologies to be updated and configured and the performance of these andother technologies to be monitored in an automated fashion. These solutions reflect the Company’s continuingcommitment to provide an enterprise-wide infrastructure platform and developer solutions based on open sourcetechnology. The Company derives its revenue and generates its cash from customers primarily from two sources:(i) subscriptions for its enterprise technologies and (ii) training and services revenue, as further described belowin NOTE 2, Summary of Significant Accounting Policies.
NOTE 2—Summary of Significant Accounting Policies
Principles of Consolidation
The accompanying Consolidated Financial Statements include the accounts of the Company and all of itswholly-owned subsidiaries. All significant inter-company accounts and transactions are eliminated inconsolidation. There are no significant foreign exchange restrictions on the Company’s foreign subsidiaries.
Use of Estimates
The preparation of financial statements in conformity with accounting principles generally accepted in theUnited States of America requires management to make estimates and assumptions that affect the reportedamounts of assets and liabilities and disclosure of contingent assets and liabilities at the balance sheet dates andthe reported amounts of revenue and expenses during the reporting periods. Actual results could differ from suchestimates.
Revenue Recognition
The Company establishes persuasive evidence of a sales arrangement for each type of revenue transactionbased on either a signed contract with the end customer, a click-through contract on the Company’s websitewhereby the customer agrees to the Company’s standard subscription terms, signed or click-through distributioncontracts with original equipment manufacturers (“OEMs”) and other resellers, or, in the case of individualtraining seats, through receipt of payment which indicates acceptance of the Company’s training agreementterms.
Subscription Revenue
Subscription revenue is comprised of direct and indirect sales of Red Hat enterprise technologies. Accountsreceivable and deferred revenue are recorded at the time a customer enters into a binding subscription agreementfor the purchase of a subscription, subscription services are made available to the customer and the customer isbilled. The deferred revenue amount is recognized as revenue ratably over the life of the subscription. Red Hat
70

RED HAT, INC.
NOTES TO CONSOLIDATED FINANCIAL STATEMENTS—(Continued)
enterprise technologies are generally offered with either one or three-year base subscription periods; the majorityof the Company’s subscriptions have one-year terms. Under these subscription agreements, renewal rates aregenerally specified for one or three-year renewal terms. Subscriptions generally entitle the end user to thetechnology itself and post-contract customer support (“PCS”), generally consisting of varying levels of supportservices as well as access to security errata, bug fixes, functionality enhancements to the technology andupgrades to new versions of the technologies, each on a when-and-if available basis, during the term of thesubscription. The Company sells its offerings through two principal channels: (1) direct, which includes sales bythe Company’s sales force as well as web store sales, and (2) indirect, which includes distributors, resellers,systems integrators and OEMs. The Company recognizes revenue from the sale of Red Hat enterprisetechnologies ratably over the period of the subscription beginning on the commencement date of the subscriptionagreement.
Subscription arrangements with large enterprise customers often have contracts with multiple elements(e.g., software technology, maintenance, training, consulting and other services). The Company allocates revenueto each element of the arrangement based on vendor-specific objective evidence of each element’s fair valuewhen the Company can demonstrate sufficient evidence of the fair value of at least those elements that areundelivered. The fair value of each element in multiple element arrangements is created by either (i) providingthe customer with the ability during the term of the arrangement to renew that element at the same rate paid forthe element included in the initial term of the agreement or (ii) selling the element on a stand-alone basis.
Training and Services Revenue
Training and services revenue is comprised of revenue for consulting, engineering and customer trainingand education services. Consulting services consist of time-based arrangements, and revenue is recognized asthese services are performed. Engineering services represent revenue earned under fixed fee arrangements withthe Company’s OEM partners and other customers to provide for significant modification and customization ofthe Company’s Red Hat enterprise technologies. The Company recognizes revenue for these fixed feeengineering services using the percentage of completion basis of accounting, provided the Company has theability to make reliable estimates of progress towards completion, the fee for such services is fixed ordeterminable and collection of the resulting receivable is probable. Under the percentage of completion method,earnings under the contract are recognized based on the progress toward completion as estimated using the ratioof labor hours incurred to total expected project hours. Changes in estimates are recognized in the period inwhich they are known. Revenue for customer training and education services is recognized on the dates theservices are complete.
Deferred Commissions
Deferred commissions are the incremental costs that are directly associated with non-cancelablesubscription contracts with customers and consist of sales commissions paid to the Company’s sales force. Thecommissions are deferred and amortized over a period that approximates the period of the subscription term. Thecommission payments are paid in full subsequent to the month in which the customer’s service commences. Thedeferred commission amounts are recoverable through the future revenue streams under the non-cancelablecustomer contracts. In addition, the Company has the ability and intent under the commission plans with its salesforce to recover commissions previously paid to its sales force in the event that customers breach the terms oftheir subscription agreements and do not fully pay for their subscription agreements. Deferred commissions areincluded in prepaid expenses on the accompanying Consolidated Balance Sheets. Amortization of deferredcommissions is included in sales and marketing expense in the accompanying Consolidated Statements ofOperations.
71

RED HAT, INC.
NOTES TO CONSOLIDATED FINANCIAL STATEMENTS—(Continued)
Goodwill and Other Long-Lived Assets
The Company tests goodwill for impairment annually and whenever events or circumstances indicate that animpairment may have occurred. Accounting principles generally accepted in the U.S. require goodwill be testedat least annually using a two-step process that begins with identifying potential impairment. Potential impairmentis identified if the fair value of the reporting unit to which goodwill applies is less than the recognized or bookvalue of the related reporting entity, including such goodwill. Where the book value of a reporting entity,including related goodwill, is greater than the reporting entity’s fair value, the second step of the goodwillimpairment test is performed to measure the amount of impairment loss, if any. The annual impairment test isperformed during the Company’s fourth quarter. For the years ended February 28, 2011, February 28, 2010 andFebruary 28, 2009, the Company did not identify any potential impairment related to its goodwill.
The Company evaluates the recoverability of its property and equipment and other long-lived assetswhenever events or changes in circumstances indicate that an impairment may have occurred. An impairmentloss is recognized when the net book value of such assets exceeds the estimated future undiscounted cash flowsattributable to the assets or the business to which the assets relate. Impairment losses, if any, are measured as theamount by which the carrying value exceeds the fair value of the assets. For the years ended February 28,2011, February 28, 2010 and February 28, 2009, no significant impairment losses related to the Company’s long-lived assets were identified.
Cash and Cash Equivalents
The Company considers liquid investments purchased with a maturity period of three months or less at thedate of purchase to be cash equivalents.
Accounts Receivable and Allowance for Doubtful Accounts
Trade accounts receivable are recorded at the invoiced amount and do not bear interest. The allowance fordoubtful accounts is the Company’s estimate of the amount of probable credit losses in the Company’s existingaccounts receivable. The Company determines the allowance based on historical write-off experience. TheCompany reviews its allowance for doubtful accounts monthly. Past due balances over 90 days and over aspecified amount are reviewed individually for collectability. All other balances are reviewed on a pooled basisby type of receivable. Account balances are charged off against the allowance when the Company determines itis probable the receivable will not be recovered. The Company does not have off-balance-sheet credit exposurerelated to its customers.
Fair Value Measurements
Fair value is defined as the exchange price that would be received for the purchase of an asset or paid totransfer a liability (an exit price) in the principal or most advantageous market for such asset or liability in anorderly transaction between market participants on the measurement date. Valuation techniques used to measurefair value should maximize the use of observable inputs and minimize the use of unobservable inputs. Tomeasure fair value, the Company uses the following fair value hierarchy based on three levels of inputs, of whichthe first two are considered observable and the last unobservable:
Level 1—Quoted prices in active markets for identical assets or liabilities.
Level 2—Inputs other than Level 1 that are observable, either directly or indirectly, such as quoted pricesfor similar assets or liabilities; quoted prices in markets that are not active; or other inputs that are observable orcan be corroborated by observable market data for substantially the full term of the assets or liabilities.
72

RED HAT, INC.
NOTES TO CONSOLIDATED FINANCIAL STATEMENTS—(Continued)
Level 3—Unobservable inputs that are supported by little or no market activity and are significant to the fairvalue of the assets or liabilities.
The Company’s investments are comprised primarily of debt securities that are classified as available forsale and recorded at their fair market values. Liquid investments with effective original maturities of 90 days orless from the balance sheet date are classified as cash equivalents. Investments with remaining effectivematurities of twelve months or less from the balance sheet date are classified as short-term investments.Investments with remaining effective maturities of more than twelve months from the balance sheet date areclassified as long-term investments. The Company’s Level 1 financial instruments are valued using quoted pricesin active markets for identical instruments. The Company’s Level 2 financial instruments, including derivativeinstruments, are valued using quoted prices for identical instruments in less active markets or using otherobservable market inputs for comparable instruments.
Unrealized gains and temporary losses on investments classified as available for sale are included withinaccumulated other comprehensive income, net of any related tax effect. Upon realization, such amounts arereclassified from accumulated other comprehensive income to other income, net. Realized gains and losses andother than temporary impairments, if any, are reflected in the statements of operations as other income, net. TheCompany does not recognize changes in the fair value of its investments in income unless a decline in value isconsidered other-than-temporary. The vast majority of the Company’s investments are priced by pricing vendors.These pricing vendors use the most recent observable market information in pricing these securities or, if specificprices are not available for these securities, use other observable inputs. In the event observable inputs are notavailable, the Company assesses other factors to determine the security’s market value, including broker quotesor model valuations. Independent price verifications of all holdings are performed by pricing vendors which arethen reviewed by the Company. In the event a price fails a pre-established tolerance check, it is researched sothat the Company can assess the cause of the variance to determine what the Company believes is the appropriatefair market value. See NOTE 18 for further discussion on fair value measurements.
The Company minimizes its credit risk associated with investments by investing primarily in investmentgrade, liquid securities. The Company’s policy is designed to limit exposures to any one issuer depending oncredit quality. Periodic evaluations of the relative credit standing of those issuers are considered in theCompany’s investment strategy.
Internal Use Software
The Company capitalizes costs related to the development of internal use software for its website, enterpriseresource planning system and systems management applications. The Company amortizes the costs of computersoftware developed for internal use on a straight-line basis over an estimated useful life of five years. Thecarrying value of internal use software is included in property and equipment on the Company’s ConsolidatedBalance Sheets.
Capitalized Software Costs
Capitalization of software development costs for products to be sold to third parties begins upon theestablishment of technological feasibility and ceases when the product is available for general release. Theestablishment of technological feasibility and the ongoing assessment of recoverability of capitalized softwaredevelopment costs require considerable judgment by management concerning certain external factors including,but not limited to, technological feasibility, anticipated future gross revenue, estimated economic life andchanges in software and hardware technologies. As a result of the Company’s practice of releasing source code
73

RED HAT, INC.
NOTES TO CONSOLIDATED FINANCIAL STATEMENTS—(Continued)
that it has developed on a weekly basis for unrestricted download on the Internet, there is generally no passage oftime between achievement of technological feasibility and the availability of the Company’s product for generalrelease. Therefore, at February 28, 2011 and February 28, 2010, the Company had no internally developedcapitalized software costs for products to be sold to third parties.
Property and Equipment
Property and equipment is primarily comprised of furniture, computer equipment, computer software andleasehold improvements which are recorded at cost and depreciated or amortized using the straight-line methodover their estimated useful lives as follows: furniture and fixtures, seven years; computer equipment, three to fouryears; computer software, five years; leasehold improvements, over the lesser of the estimated remaining usefullife of the asset or the remaining term of the lease. Expenditures for maintenance and repairs are charged tooperations as incurred; major expenditures for renewals and betterments are capitalized and depreciated. Propertyand equipment acquired under capital leases are depreciated over the lesser of the estimated remaining useful lifeof the asset or the remaining term of the lease.
Share-Based Compensation
The Company measures share-based compensation cost at grant date, based on the estimated fair value ofthe award and recognizes the cost over the employee requisite service period typically on a straight-line basis, netof estimated forfeitures. The Company estimates the fair value of stock options using the Black-Scholes-Mertonvaluation model. The fair value of nonvested share awards, nonvested share units and performance share unitsare measured at their underlying closing share price on the date of grant. The Company’s share-basedcompensation is described further in NOTE 13.
Sales and Marketing Expenses
Sales and marketing expenses consist of costs, including salaries, sales commissions and related expenses,such as travel, of all personnel involved in the sales and marketing process. Sales and marketing expenses alsoinclude costs of advertising, sales lead generation programs, cooperative marketing arrangements and tradeshows. Payments made to resellers or other customers are reported in accordance with Financial AccountingStandards Board (“FASB”) Accounting Standards Codification (“ASC”) Section 605-50 Customer Payments andIncentives (formerly referenced as Emerging Issues Task Force Issue Number 01-09, Accounting forConsideration Given by a Vendor to a Customer (Including a Reseller of the Vendor’s Products)) (“ASC605-50”). All costs of advertising, to the extent allowable by ASC 605-50, are expensed as incurred.
Advertising expense totaled $25.5 million, $23.5 million, and $18.1 million for the years ended February 28,2011, February 28, 2010 and February 28, 2009, respectively.
Research and Development Expenses
Research and development expenses include all direct costs, primarily salaries for Company personnel andoutside consultants, related to the development of new software products, significant enhancements to existingsoftware products, and the portion of costs of development of internal use software required to be expensed.Research and development costs are charged to operations as incurred with the exception of those softwaredevelopment costs that may qualify for capitalization.
74

RED HAT, INC.
NOTES TO CONSOLIDATED FINANCIAL STATEMENTS—(Continued)
Deferred Taxes
The Company accounts for income taxes using the liability method in which deferred tax assets or liabilitiesare recognized for the temporary differences between financial reporting and tax bases of the Company’s assetsand liabilities and for tax carryforwards at enacted statutory tax rates in effect for the years in which thedifferences are expected to reverse.
The Company continues to assess the realizability of its deferred tax assets, which primarily consist ofshare-based compensation expense deductions, tax credit carryforwards and deferred revenue. In assessing therealizability of these deferred tax assets, management considers whether it is more likely than not that someportion or all of the deferred tax assets will be realized. The Company continues to maintain a valuationallowance against its deferred tax assets with respect to certain foreign net operating loss (“NOL”) carryforwards.
With respect to foreign earnings, it is the Company’s policy to invest the earnings of foreign subsidiariesindefinitely outside the U.S. From time to time, however, the Company may remit a portion of these earnings tothe extent it incurs no additional U.S. tax and it is otherwise feasible.
Because tax laws are complex and subject to different interpretations, significant judgment is required. As aresult, the Company makes certain estimates and assumptions in (i) calculating its income tax expense, deferredtax assets and deferred tax liabilities, (ii) determining any valuation allowance recorded against deferred taxassets and (iii) evaluating the amount of unrecognized tax benefits, as well as the interest and penalties related tosuch uncertain tax positions. The Company’s estimates and assumptions may differ significantly from taxbenefits ultimately realized. The Company’s income tax expense and deferred taxes are described further inNOTE 11.
Foreign Currency Translation
The Euro has been determined to be the primary functional currency for the Company’s Europeanoperations and local currencies have been determined to be the functional currencies for the Company’s AsiaPacific and South American operations. Foreign exchange gains and losses, which result from the process ofremeasuring foreign currency transactions into the appropriate functional currency, are included in other income,net in the Company’s Consolidated Statements of Operations.
The impact of changes in foreign currency exchange rates resulting from the translation of foreign currencyfinancial statements into U.S. dollars for financial reporting purposes is included in other comprehensive income,which is a separate component of stockholders’ equity. Assets and liabilities are translated into U.S. dollars atexchange rates in effect at the balance sheet date. Income and expense items are translated at average rates for theperiod.
Significant Customers and Credit Risk
Financial instruments which potentially subject the Company to concentrations of credit risk consistprincipally of cash, cash equivalents, investments and trade receivables. The Company primarily places its cash,cash equivalents and investments with high-credit quality financial institutions which invest predominantly inU.S. government instruments, investment grade corporate bonds and certificates of deposit guaranteed by bankswhich are members of the FDIC. Cash deposits are primarily in financial institutions in the United States.However, cash for monthly operating costs of international operations are deposited in banks outside the UnitedStates.
75

RED HAT, INC.
NOTES TO CONSOLIDATED FINANCIAL STATEMENTS—(Continued)
The Company performs credit evaluations to reduce credit risk and generally requires no collateral from itscustomers. Management estimates the allowance for uncollectible accounts based on their historical experienceand credit evaluation. The Company’s standard credit terms are net 30 days in North America, net 30 to 45 daysin EMEA, Central America and South America, and range from net 30 to net 60 days in Asia Pacific.
Net Income Per Common Share
The Company computes basic net income per common share by dividing net income available to commonstockholders by the weighted average number of common shares outstanding. Diluted net income per commonshare is computed by dividing net income by the weighted average number of common shares and dilutivepotential common share equivalents then outstanding. Potential common share equivalents consist of sharesissuable upon the exercise of stock options or vesting of share-based awards.
For the year ended February 28, 2009, the Company’s diluted net income was adjusted for interest expenseand amortization of debt issuance costs associated with the Company’s convertible debentures which had beenoutstanding during the year ended February 28, 2009. Potential common share equivalents for the year endedFebruary 28, 2009, consisted of shares issuable upon the exercise of stock options, vesting of share-based awardsand conversion of convertible securities such as the Company’s convertible debentures. Diluted net income pershare for the year ended February 28, 2009, assumes the conversion of the convertible debentures using the “ifconverted” method. See NOTE 19 for the reconciliation of the calculation of net income per common share.
Segment Reporting
The Company is organized primarily on the basis of three geographic business units: the Americas, EMEA(Europe, Middle East and Africa) and Asia Pacific. These business units are aggregated into one reportablesegment due to the similarity in nature of products provided, financial performance economics (e.g., revenuegrowth and gross margin), methods of distribution (direct and indirect) and customer classification(e.g., distributors, resellers and enterprise).
The Company has offices in more than 70 locations around the world. The Company manages itsinternational business on an Americas-wide, EMEA-wide and Asia Pacific-wide basis. See NOTE 20 for furtherdiscussion.
76

RED HAT, INC.
NOTES TO CONSOLIDATED FINANCIAL STATEMENTS—(Continued)
Recent Accounting Pronouncements
In January 2010, the FASB issued guidance amending disclosure requirements related to Fair ValueMeasurements and Disclosures-Overall Subtopic 820-10 of the FASB Accounting Standards Codification (“ASC820-10”) originally issued as FASB Statement No. 157, Fair Value Measurements. The amended guidancerequires companies to disclose separately the amounts of significant transfers in and out of Level 1 and Level 2fair value measurements and describe the reasons for such transfers. These additional disclosure requirementswere effective for reporting periods beginning March 1, 2010. For the year ended February 28, 2011, theCompany did not have any transfers in and out of Level 1 and Level 2 fair value measurements. The amendedguidance also requires additional disclosures related to Level 3 fair value measurements. The Company does notcurrently have Level 3 fair value measurements.
NOTE 3—Business Combinations
Acquisition of Qumranet, Inc.
On September 4, 2008, the Company completed its acquisition of Qumranet, Inc. (“Qumranet”), a privatelyheld software company that produced and sold virtualization technologies. The acquisition of Qumranetbroadened the Company’s technology solutions, communities of development and use, and additional influencein, and acceptance of, virtualization technology in the Linux kernel, upon which the Company’s Red HatEnterprise Linux platform is based. Under the terms of the purchase agreement the Company paid approximately$104.8 million in cash. The total consideration paid by the Company in connection with the acquisition issummarized in the following table (in thousands):
TotalConsideration
Cash consideration paid to and/or on behalf of Qumranet stockholders . . . . . . . . . . . . . . . . . . . . . . . $104,772Transaction costs . . . . . . . . . . . . . . . . . . . . . . . . . . . . . . . . . . . . . . . . . . . . . . . . . . . . . . . . . . . . . . . . . 703
Total consideration . . . . . . . . . . . . . . . . . . . . . . . . . . . . . . . . . . . . . . . . . . . . . . . . . . . . . . . . . . . . . . . $105,475
The table below represents the allocation of the total consideration to the Company’s tangible andidentifiable intangible assets and liabilities (in thousands) based on management’s assessment of their respectivefair values as of the date of the acquisition:
TotalConsiderationAllocated
Identifiable intangible assets at fair value (see detail below) . . . . . . . . . . . . . . . . . . . . . . . . . . . . . . . $ 21,200Cash . . . . . . . . . . . . . . . . . . . . . . . . . . . . . . . . . . . . . . . . . . . . . . . . . . . . . . . . . . . . . . . . . . . . . . . . . . . 4,333Accounts receivable at fair value . . . . . . . . . . . . . . . . . . . . . . . . . . . . . . . . . . . . . . . . . . . . . . . . . . . . . 28Fixed assets at fair value . . . . . . . . . . . . . . . . . . . . . . . . . . . . . . . . . . . . . . . . . . . . . . . . . . . . . . . . . . . 959Other assets at fair value . . . . . . . . . . . . . . . . . . . . . . . . . . . . . . . . . . . . . . . . . . . . . . . . . . . . . . . . . . . 247Accrued liabilities at fair value . . . . . . . . . . . . . . . . . . . . . . . . . . . . . . . . . . . . . . . . . . . . . . . . . . . . . . (1,069)Goodwill . . . . . . . . . . . . . . . . . . . . . . . . . . . . . . . . . . . . . . . . . . . . . . . . . . . . . . . . . . . . . . . . . . . . . . . 79,777
Total consideration allocated . . . . . . . . . . . . . . . . . . . . . . . . . . . . . . . . . . . . . . . . . . . . . . . . . . . . . . . . $105,475
The following table summarizes the allocation of estimated identifiable intangible assets resulting from theacquisition (in thousands). For purposes of this allocation, the Company has assessed a fair value of Qumranetidentifiable intangible assets related to employee covenants not to compete, developed technology andtradenames and trademarks based on the net present value of the projected income stream of these identifiable
77

RED HAT, INC.
NOTES TO CONSOLIDATED FINANCIAL STATEMENTS—(Continued)
intangible assets. The resulting fair value is being amortized over the estimated useful life of each identifiableintangible asset on a straight-line basis which approximates the economic pattern of benefits (in thousands):
Expense TypeEstimated Life
(Years) Total
Developed technology . . . . . . . . . . . . . . . . . . . . . . . . . . . . Research and development 6 $17,000Employee covenants not to compete . . . . . . . . . . . . . . . . . Research and development 3 2,600Tradenames and trademarks . . . . . . . . . . . . . . . . . . . . . . . . General and administrative 10 1,600
Total identifiable intangible assets . . . . . . . . . . . . . . . . . . . . . . . . . . . . . . . . . . . . . . . . . . . . . . . . . . . $21,200
Pro forma consolidated financial information
The following unaudited pro forma consolidated financial information reflects the results of operations (inthousands, except per share amounts) of the Company for the year ended February 28, 2009 as if the acquisitionof Qumranet had occurred at the beginning of the year, after giving effect to certain purchase accountingadjustments. These pro forma results are not necessarily indicative of what the Company’s operating resultswould have been had the acquisition actually taken place at the beginning of the year.
Year EndedFebruary 28, 2009
Revenue . . . . . . . . . . . . . . . . . . . . . . . . . . . . . . . . . . . . . . . . . . . . . . . . . . . . . . . . . . . . $652,697Net income . . . . . . . . . . . . . . . . . . . . . . . . . . . . . . . . . . . . . . . . . . . . . . . . . . . . . . . . . . $ 73,048Basic net income per common share . . . . . . . . . . . . . . . . . . . . . . . . . . . . . . . . . . . . . . $ 0.38Diluted net income per common share . . . . . . . . . . . . . . . . . . . . . . . . . . . . . . . . . . . . . $ 0.36
Goodwill and other business combinations
The Company completed its annual goodwill impairment test in February 2011. No goodwill impairmentwas deemed to have occurred. The following is a summary of goodwill for the years ended February 28,2011, February 28, 2010 and February 28, 2009 (in thousands):
Balance at February 29, 2008 . . . . . . . . . . . . . . . . . . . . . . . . . . . . . . . . . . . . . . . . . . . . . . . . . . . . . . . . . . $340,314Add: acquisition of Qumranet . . . . . . . . . . . . . . . . . . . . . . . . . . . . . . . . . . . . . . . . . . . . . . . . . . . . . . . . . 80,030Add: acquisition of other businesses (1) . . . . . . . . . . . . . . . . . . . . . . . . . . . . . . . . . . . . . . . . . . . . . . . . . 19,723Impact of foreign currency fluctuations and other . . . . . . . . . . . . . . . . . . . . . . . . . . . . . . . . . . . . . . . . . . (1,958)
Balance at February 28, 2009 . . . . . . . . . . . . . . . . . . . . . . . . . . . . . . . . . . . . . . . . . . . . . . . . . . . . . . . . . . $438,109Less: adjustment to Qumranet purchase price for finalization of allocation . . . . . . . . . . . . . . . . . . . . . . (253)Impact of foreign currency fluctuations . . . . . . . . . . . . . . . . . . . . . . . . . . . . . . . . . . . . . . . . . . . . . . . . . . 893
Balance at February 28, 2010 . . . . . . . . . . . . . . . . . . . . . . . . . . . . . . . . . . . . . . . . . . . . . . . . . . . . . . . . . . $438,749Add: acquisition of Makara (2) . . . . . . . . . . . . . . . . . . . . . . . . . . . . . . . . . . . . . . . . . . . . . . . . . . . . . . . . 24,681Impact of foreign currency fluctuations . . . . . . . . . . . . . . . . . . . . . . . . . . . . . . . . . . . . . . . . . . . . . . . . . . 243
Balance at February 28, 2011 . . . . . . . . . . . . . . . . . . . . . . . . . . . . . . . . . . . . . . . . . . . . . . . . . . . . . . . . . . $463,673
(1) During the year ended February 28, 2009, goodwill additions represent the excess of purchase price overtangible and identifiable intangible assets of businesses acquired which provide the Company additionalservices capability within the middleware and security management markets. The aggregate purchase pricepaid for these businesses, net of cash acquired, totaled $46.8 million.
(2) During the year ended February 28, 2011, goodwill additions represent the excess of purchase price overtangible and identifiable intangible assets of Makara, a developer of deployment and management solutionsfor applications in the cloud. The purchase price paid for the business, net of cash acquired, totaled $31.4million.
78
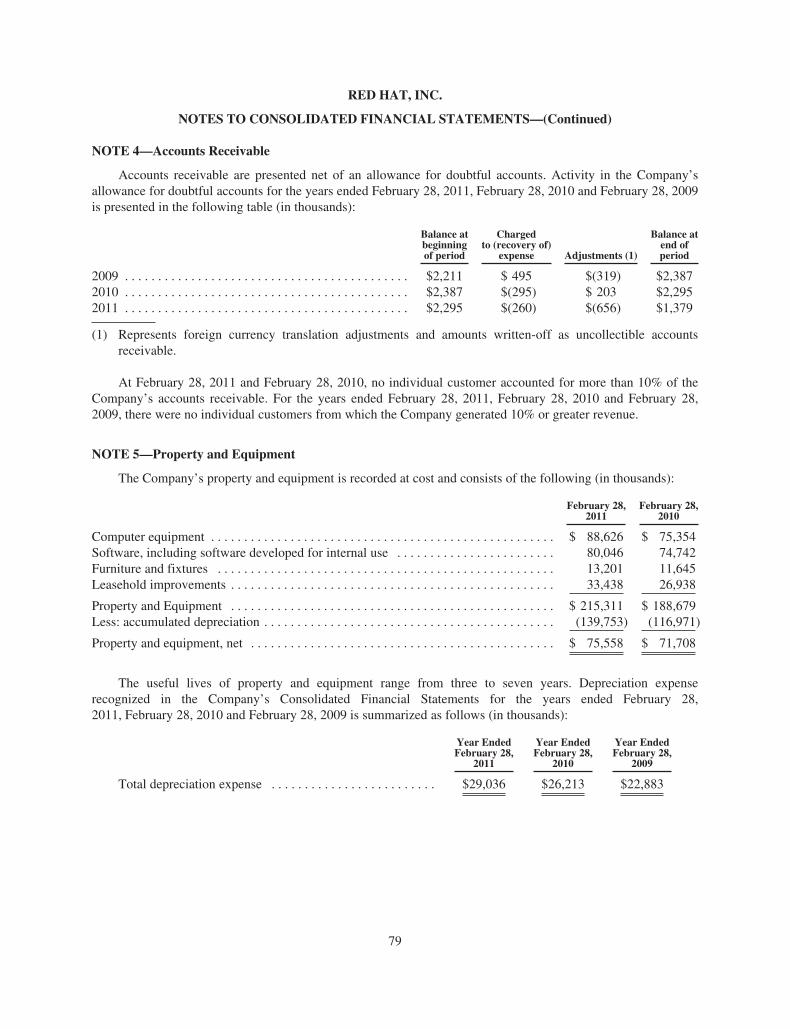
RED HAT, INC.
NOTES TO CONSOLIDATED FINANCIAL STATEMENTS—(Continued)
NOTE 4—Accounts Receivable
Accounts receivable are presented net of an allowance for doubtful accounts. Activity in the Company’sallowance for doubtful accounts for the years ended February 28, 2011, February 28, 2010 and February 28, 2009is presented in the following table (in thousands):
Balance atbeginningof period
Chargedto (recovery of)
expense Adjustments (1)
Balance atend ofperiod
2009 . . . . . . . . . . . . . . . . . . . . . . . . . . . . . . . . . . . . . . . . . . . $2,211 $ 495 $(319) $2,3872010 . . . . . . . . . . . . . . . . . . . . . . . . . . . . . . . . . . . . . . . . . . . $2,387 $(295) $ 203 $2,2952011 . . . . . . . . . . . . . . . . . . . . . . . . . . . . . . . . . . . . . . . . . . . $2,295 $(260) $(656) $1,379
(1) Represents foreign currency translation adjustments and amounts written-off as uncollectible accountsreceivable.
At February 28, 2011 and February 28, 2010, no individual customer accounted for more than 10% of theCompany’s accounts receivable. For the years ended February 28, 2011, February 28, 2010 and February 28,2009, there were no individual customers from which the Company generated 10% or greater revenue.
NOTE 5—Property and Equipment
The Company’s property and equipment is recorded at cost and consists of the following (in thousands):
February 28,2011
February 28,2010
Computer equipment . . . . . . . . . . . . . . . . . . . . . . . . . . . . . . . . . . . . . . . . . . . . . . . . . . . . $ 88,626 $ 75,354Software, including software developed for internal use . . . . . . . . . . . . . . . . . . . . . . . . 80,046 74,742Furniture and fixtures . . . . . . . . . . . . . . . . . . . . . . . . . . . . . . . . . . . . . . . . . . . . . . . . . . . 13,201 11,645Leasehold improvements . . . . . . . . . . . . . . . . . . . . . . . . . . . . . . . . . . . . . . . . . . . . . . . . . 33,438 26,938
Property and Equipment . . . . . . . . . . . . . . . . . . . . . . . . . . . . . . . . . . . . . . . . . . . . . . . . . $ 215,311 $ 188,679Less: accumulated depreciation . . . . . . . . . . . . . . . . . . . . . . . . . . . . . . . . . . . . . . . . . . . . (139,753) (116,971)
Property and equipment, net . . . . . . . . . . . . . . . . . . . . . . . . . . . . . . . . . . . . . . . . . . . . . . $ 75,558 $ 71,708
The useful lives of property and equipment range from three to seven years. Depreciation expenserecognized in the Company’s Consolidated Financial Statements for the years ended February 28,2011, February 28, 2010 and February 28, 2009 is summarized as follows (in thousands):
Year EndedFebruary 28,
2011
Year EndedFebruary 28,
2010
Year EndedFebruary 28,
2009
Total depreciation expense . . . . . . . . . . . . . . . . . . . . . . . . . $29,036 $26,213 $22,883
79

RED HAT, INC.
NOTES TO CONSOLIDATED FINANCIAL STATEMENTS—(Continued)
NOTE 6—Identifiable Intangible Assets
Identifiable intangible assets consist primarily of purchased technologies, customer and resellerrelationships, trademarks, copyrights and patents, which are amortized over the estimated useful life, generallyon a straight-line basis with the exception of customer contracts and relationships which are generally amortizedover the greater of straight-line or the related asset’s pattern of economic benefit. Useful lives range from three toten years. As of February 28, 2011 and February 28, 2010, trademarks with an indefinite estimated useful lifetotaled $9.1 million and $9.0 million, respectively. The following is a summary of identifiable intangible assets(in thousands):
February 28, 2011 February 28, 2010
GrossAmount
AccumulatedAmortization
NetAmount
GrossAmount
AccumulatedAmortization
NetAmount
Trademarks, copyrights and patents . . . . $ 58,122 $(16,817) $ 41,305 $ 52,204 $(13,504) $ 38,700Purchased technologies . . . . . . . . . . . . . . 59,233 (32,081) 27,152 44,483 (25,632) 18,851Customer and reseller relationships . . . . 80,768 (39,293) 41,475 80,760 (30,098) 50,662
Total identifiable intangible assets . . . . . $198,123 $(88,191) $109,932 $177,447 $(69,234) $108,213
Amortization expense associated with identifiable intangible assets recognized in the Company’sConsolidated Financial Statements for the years ended February 28, 2011, February 28, 2010 and February 28,2009 is summarized as follows (in thousands):
Year EndedFebruary 28,
2011
Year EndedFebruary 28,
2010
Year EndedFebruary 28,
2009
Total amortization expense . . . . . . . . . . . . . . . . . . . . . . . . . $18,961 $19,648 $17,426
As of February 28, 2011, amortization expense on existing intangibles for the next five fiscal years is asfollows (in thousands):
2012 . . . . . . . . . . . . . . . . . . . . . . . . . . . . . . . . . . . . . . . . . . . . . . . . . . . . . . . . . . . . . $18,5862013 . . . . . . . . . . . . . . . . . . . . . . . . . . . . . . . . . . . . . . . . . . . . . . . . . . . . . . . . . . . . . $16,0462014 . . . . . . . . . . . . . . . . . . . . . . . . . . . . . . . . . . . . . . . . . . . . . . . . . . . . . . . . . . . . . $13,4622015 . . . . . . . . . . . . . . . . . . . . . . . . . . . . . . . . . . . . . . . . . . . . . . . . . . . . . . . . . . . . . $10,5602016 . . . . . . . . . . . . . . . . . . . . . . . . . . . . . . . . . . . . . . . . . . . . . . . . . . . . . . . . . . . . . $ 7,181
NOTE 7—Other Assets, Net
Other assets, net were comprised of the following (in thousands):
February 28,2011
February 28,2010
Equity-method investment . . . . . . . . . . . . . . . . . . . . . . . . . . . . . . . . . . . . . . . . . . . . . . . . $15,815 $17,252Cost-basis investments . . . . . . . . . . . . . . . . . . . . . . . . . . . . . . . . . . . . . . . . . . . . . . . . . . 2,232 2,732Net non-current deferred tax assets (see NOTE 11) . . . . . . . . . . . . . . . . . . . . . . . . . . . . 10,610 14,967Security deposits . . . . . . . . . . . . . . . . . . . . . . . . . . . . . . . . . . . . . . . . . . . . . . . . . . . . . . . 5,153 4,721
Total . . . . . . . . . . . . . . . . . . . . . . . . . . . . . . . . . . . . . . . . . . . . . . . . . . . . . . . . . . . . . . . . . $33,810 $39,672
80

RED HAT, INC.
NOTES TO CONSOLIDATED FINANCIAL STATEMENTS—(Continued)
The Company reviews its non-marketable cost-basis investments in equity securities for other thantemporary declines in fair value based on prices recently paid for shares in that company, as well as changes inmarket conditions. The carrying values are not necessarily representative of the amounts that the Company couldrealize in a current transaction. During the years ended February 28, 2011, February 28, 2010 and February 28,2009, no significant losses were recognized for equity investments in other companies.
Equity-method investment represents the Company’s investment in Open Inventions Network LLC (“OIN”)and the related share of OIN’s accumulated deficit. The Company uses the equity method to account for itsinvestment in OIN. The equity method requires the Company to increase or decrease the carrying amount of itsinvestment in OIN to reflect the Company’s pro rata share of OIN’s gains and losses, respectively.
NOTE 8—Prepaid Expenses
Prepaid expenses include sales commissions, taxes and insurance. Sales commissions are the incrementalcosts that are directly associated with non-cancelable subscription contracts with customers and consist of salescommissions paid to the Company’s sales force. The commissions are deferred and amortized over a period toapproximate the period of the subscription term. For further discussion on deferred commissions see NOTE 2 tothe Consolidated Financial Statements. Prepaid expenses, including sales commissions, were comprised of thefollowing (in thousands):
February 28,2011
February 28,2010
Sales commissions . . . . . . . . . . . . . . . . . . . . . . . . . . . . . . . . . . . . . . . . . . . . . . . . . . . . . . $50,134 $30,782Taxes . . . . . . . . . . . . . . . . . . . . . . . . . . . . . . . . . . . . . . . . . . . . . . . . . . . . . . . . . . . . . . . . 5,034 4,598Insurance . . . . . . . . . . . . . . . . . . . . . . . . . . . . . . . . . . . . . . . . . . . . . . . . . . . . . . . . . . . . . 762 390Other . . . . . . . . . . . . . . . . . . . . . . . . . . . . . . . . . . . . . . . . . . . . . . . . . . . . . . . . . . . . . . . . 6,434 8,346
Total . . . . . . . . . . . . . . . . . . . . . . . . . . . . . . . . . . . . . . . . . . . . . . . . . . . . . . . . . . . . . . . . . $62,364 $44,116
NOTE 9—Accrued Expenses
Accrued expenses were comprised of the following (in thousands):
February 28,2011
February 28,2010
Wages and other compensation related expenses . . . . . . . . . . . . . . . . . . . . $59,400 $41,990Other trade payables . . . . . . . . . . . . . . . . . . . . . . . . . . . . . . . . . . . . . . . . . . 22,541 14,885Income and other taxes payable . . . . . . . . . . . . . . . . . . . . . . . . . . . . . . . . . . 7,251 10,375Other . . . . . . . . . . . . . . . . . . . . . . . . . . . . . . . . . . . . . . . . . . . . . . . . . . . . . . 1,037 1,084
Total accrued expenses . . . . . . . . . . . . . . . . . . . . . . . . . . . . . . . . . . . . . . . . $90,229 $68,334
NOTE 10—Foreign Currency Exchange Rate Risk
The Company transacts business in various foreign countries and is, therefore, subject to risk of foreigncurrency exchange rate fluctuations. The Company from time to time enters into forward contracts to hedgetransactional exposure associated with commitments arising from trade accounts receivable, trade accountspayable and fixed purchase obligations denominated in a currency other than the functional currency of therespective operating entity. All derivative instruments are recorded on the Consolidated Balance
81

RED HAT, INC.
NOTES TO CONSOLIDATED FINANCIAL STATEMENTS—(Continued)
Sheets at their respective fair market values. The Company has elected not to prepare and maintain thedocumentation required to qualify for hedge accounting treatment and, therefore, changes in fair value arerecorded in the Consolidated Statements of Operations.
The effects of derivative instruments on the Company’s Consolidated Financial Statements are as follows asof February 28, 2011 and for the year then ended (in thousands):
Year Ended February 28, 2011
As of February 28, 2011 Location of Gain(Loss) Recognized
in Income onDerivative
Amount of Gain(Loss) Recognized
in Income onDerivativeBalance Sheet Location
FairValue
NotionalValue
Assets—foreign currencyforward contracts notdesignated as hedges . . . . . . . Prepaid expenses and
other current assets$434 $47,457 Other income, net $ 1,631
Liabilities—foreign currencyforward contracts notdesignated as hedges . . . . . . . Accrued expenses (96) 17,005 Other income, net (1,583)
TOTAL . . . . . . . . . . . . . . . . . . . $338 $64,462 $ 48
The effects of derivative instruments on the Company’s Consolidated Financial Statements are as follows asof February 28, 2010 and for the year then ended (in thousands):
Year Ended February 28, 2010
As of February 28, 2010 Location of Gain(Loss) Recognized
in Income onDerivative
Amount of Gain(Loss) Recognized
in Income onDerivativeBalance Sheet Location
FairValue
NotionalValue
Assets—foreign currencyforward contracts notdesignated as hedges . . . . . . . . Prepaid expenses and
other current assets$77 $3,888 Other income, net $ 387
Liabilities—foreign currencyforward contracts notdesignated as hedges . . . . . . . . Accrued expenses (4) 4,548 Other income, net (442)
TOTAL . . . . . . . . . . . . . . . . . . . . $73 $8,436 $ (55)
NOTE 11—Income Taxes
The U.S. and foreign components of the Company’s income before provision for income taxes consisted ofthe following (in thousands):
February 28,2011
February 28,2010
February 28,2009
U.S. . . . . . . . . . . . . . . . . . . . . . . . . . . . . . . . . . . . . . . . . . . . . . . . . . . $109,044 $ 92,130 $116,293Foreign . . . . . . . . . . . . . . . . . . . . . . . . . . . . . . . . . . . . . . . . . . . . . . . . 44,650 29,372 5,239
Income before provision for income taxes . . . . . . . . . . . . . . . . . . . . . . . . $153,694 $121,502 $121,532
82

RED HAT, INC.
NOTES TO CONSOLIDATED FINANCIAL STATEMENTS—(Continued)
The components of the Company’s provision for income taxes consisted of the following (in thousands):
February 28,2011
February 28,2010
February 282009
Current:Foreign . . . . . . . . . . . . . . . . . . . . . . . . . . . . . . . . . . . . . . . . . . . . . . . . $ 7,675 $10,445 $ 3,206Federal . . . . . . . . . . . . . . . . . . . . . . . . . . . . . . . . . . . . . . . . . . . . . . . . 14,553 13,615 (1,642)State . . . . . . . . . . . . . . . . . . . . . . . . . . . . . . . . . . . . . . . . . . . . . . . . . . 760 4,368 775
Current tax expense . . . . . . . . . . . . . . . . . . . . . . . . . . . . . . . . . . . . . . $22,988 $28,428 $ 2,339Deferred:
Foreign . . . . . . . . . . . . . . . . . . . . . . . . . . . . . . . . . . . . . . . . . . . . . . . . 3,037 (998) (1,628)Federal . . . . . . . . . . . . . . . . . . . . . . . . . . . . . . . . . . . . . . . . . . . . . . . . 16,810 9,119 39,298State . . . . . . . . . . . . . . . . . . . . . . . . . . . . . . . . . . . . . . . . . . . . . . . . . . 3,581 (2,300) 2,802
Deferred tax expense . . . . . . . . . . . . . . . . . . . . . . . . . . . . . . . . . . . . . $23,428 $ 5,821 $40,472
Net provision for income taxes . . . . . . . . . . . . . . . . . . . . . . . . . . . . . . . . . . $46,416 $34,249 $42,811
Significant components of the Company’s deferred tax assets and liabilities at February 28, 2011 andFebruary 28, 2010, consist of the following (in thousands):
February 28,2011
February 28,2010
Deferred tax assets:Foreign net operating loss carryforwards . . . . . . . . . . . . . . . . . . . . . . . . . . . . . . . . . . . . $ 7,034 $ 14,620Domestic credit carryforwards . . . . . . . . . . . . . . . . . . . . . . . . . . . . . . . . . . . . . . . . . . . . 44,203 26,955Goodwill . . . . . . . . . . . . . . . . . . . . . . . . . . . . . . . . . . . . . . . . . . . . . . . . . . . . . . . . . . . . . 7,275 3,163Share-based compensation . . . . . . . . . . . . . . . . . . . . . . . . . . . . . . . . . . . . . . . . . . . . . . . . 19,044 22,668Deferred revenue and costs . . . . . . . . . . . . . . . . . . . . . . . . . . . . . . . . . . . . . . . . . . . . . . . 33,318 34,396Other . . . . . . . . . . . . . . . . . . . . . . . . . . . . . . . . . . . . . . . . . . . . . . . . . . . . . . . . . . . . . . . . 2,877 7,459
Total deferred tax assets . . . . . . . . . . . . . . . . . . . . . . . . . . . . . . . . . . . . . . . . . . . . . . . . . $113,751 $109,261Valuation allowance for deferred tax assets . . . . . . . . . . . . . . . . . . . . . . . . . . . . . . . . . . (5,751) (6,770)
Total deferred tax assets, net of valuation allowance . . . . . . . . . . . . . . . . . . . . . . . . . . . $108,000 $102,491
Deferred tax liabilities:Fixed and intangible assets . . . . . . . . . . . . . . . . . . . . . . . . . . . . . . . . . . . . . . . . . . . . . . . 20,171 26,218Other . . . . . . . . . . . . . . . . . . . . . . . . . . . . . . . . . . . . . . . . . . . . . . . . . . . . . . . . . . . . . . . . 1,499 3,355
Total deferred tax liabilities . . . . . . . . . . . . . . . . . . . . . . . . . . . . . . . . . . . . . . . . . . . . . . . $ 21,670 $ 29,573
Net deferred tax asset . . . . . . . . . . . . . . . . . . . . . . . . . . . . . . . . . . . . . . . . . . . . . . . . . . . . $ 86,330 $ 72,918
Net current deferred tax asset . . . . . . . . . . . . . . . . . . . . . . . . . . . . . . . . . . . . . . . . . . . . . $ 75,720 $ 57,951Net non-current deferred tax asset, recorded in other assets, net . . . . . . . . . . . . . . . . . . 10,610 14,967
Net deferred tax asset . . . . . . . . . . . . . . . . . . . . . . . . . . . . . . . . . . . . . . . . . . . . . . . . . . . . $ 86,330 $ 72,918
83

RED HAT, INC.
NOTES TO CONSOLIDATED FINANCIAL STATEMENTS—(Continued)
As of February 28, 2011, the Company continues to maintain a valuation allowance against its deferred taxassets with respect to certain foreign NOLs. The following is a summary of the Company’s valuation allowancefor the three years ended February 28, 2011 (in thousands):
Balance at February 29, 2008 . . . . . . . . . . . . . . . . . . . . . . . . . . . . . . . . . . . . . . . . . . . . . . . . . . . . . . . . . . $ 58,805Add: Provisions for valuation allowance . . . . . . . . . . . . . . . . . . . . . . . . . . . . . . . . . . . . . . . . . . . . . . . . . 1,572Less: Release of valuation allowance . . . . . . . . . . . . . . . . . . . . . . . . . . . . . . . . . . . . . . . . . . . . . . . . . . . . (47,993)
Balance at February 28, 2009 . . . . . . . . . . . . . . . . . . . . . . . . . . . . . . . . . . . . . . . . . . . . . . . . . . . . . . . . . . $ 12,384Add: Provisions for valuation allowance . . . . . . . . . . . . . . . . . . . . . . . . . . . . . . . . . . . . . . . . . . . . . . . . . 2,622Less: Release of valuation allowance . . . . . . . . . . . . . . . . . . . . . . . . . . . . . . . . . . . . . . . . . . . . . . . . . . . . (8,236)
Balance at February 28, 2010 . . . . . . . . . . . . . . . . . . . . . . . . . . . . . . . . . . . . . . . . . . . . . . . . . . . . . . . . . . $ 6,770Add: Provisions for valuation allowance . . . . . . . . . . . . . . . . . . . . . . . . . . . . . . . . . . . . . . . . . . . . . . . . . 33Less: Release of valuation allowance . . . . . . . . . . . . . . . . . . . . . . . . . . . . . . . . . . . . . . . . . . . . . . . . . . . . (1,052)
Balance at February 28, 2011 . . . . . . . . . . . . . . . . . . . . . . . . . . . . . . . . . . . . . . . . . . . . . . . . . . . . . . . . . . $ 5,751
As of February 28, 2011, the Company had U.S. federal and state NOL carryforwards of $32.5 million and$83.1 million, respectively. These NOLs consist of share-based compensation expense deductions which were inexcess of amounts recognized in the Company’s results from financial operations. Accordingly, the resultingexcess tax benefit will be recognized as an increase to additional paid in capital when realized. The NOLcarryforwards expire in varying amounts beginning in 2012. As of February 28, 2011, the Company had a U.S.research tax credit carryforward of $36.2 million and a U.S. foreign tax credit of $22.3 million. These tax creditcarryforwards expire in varying amounts beginning in 2012.
Taxes computed at the statutory federal income tax rates are reconciled to the provision for income taxes forthe years ended February 28, 2011, February 28, 2010 and February 28, 2009, respectively, as follows(in thousands):
February 28,2011
February 28,2010
February 28,2009
Effective rate . . . . . . . . . . . . . . . . . . . . . . . . . . . . . . . . . . . . . . . . . . . . . . . 30.2% 28.2% 35.2%Provision at federal statutory rate, 35% . . . . . . . . . . . . . . . . . . . . . . . . . . . $ 53,834 $42,526 $42,543State tax (net of federal tax benefit) . . . . . . . . . . . . . . . . . . . . . . . . . . . . . . 4,341 2,068 3,576Foreign rate differential . . . . . . . . . . . . . . . . . . . . . . . . . . . . . . . . . . . . . . . (5,280) (2,173) (2,276)Israel tax holiday (1) . . . . . . . . . . . . . . . . . . . . . . . . . . . . . . . . . . . . . . . . . (2,671) 0 0Deemed foreign dividend . . . . . . . . . . . . . . . . . . . . . . . . . . . . . . . . . . . . . . 5,348 0 0Nondeductible items . . . . . . . . . . . . . . . . . . . . . . . . . . . . . . . . . . . . . . . . . 5,625 875 832Research and development tax credit . . . . . . . . . . . . . . . . . . . . . . . . . . . . (3,690) (7,800) 0Foreign tax credit . . . . . . . . . . . . . . . . . . . . . . . . . . . . . . . . . . . . . . . . . . . . (11,357) (1,577) (2,406)Other . . . . . . . . . . . . . . . . . . . . . . . . . . . . . . . . . . . . . . . . . . . . . . . . . . . . . 266 330 542
Provision for income taxes . . . . . . . . . . . . . . . . . . . . . . . . . . . . . . . . . . . . $ 46,416 $34,249 $42,811
(1) The Company qualifies for a tax holiday in Israel which began during the fiscal year ended February 28,2011 and is scheduled to terminate as of the fiscal year ending February 29, 2020. The tax holiday providesfor an exemption from income tax in the first two years, and for a reduced rate of taxation on incomegenerated in Israel for the subsequent eight years. Tax savings realized from this holiday for the year endedFebruary 28, 2011 totaled $2.9 million, which increased the Company’s diluted earnings per share by $0.01.
84

RED HAT, INC.
NOTES TO CONSOLIDATED FINANCIAL STATEMENTS—(Continued)
The Company has not provided U.S. deferred taxes on the cumulative earnings of foreign subsidiaries thathave been reinvested outside the U.S. indefinitely; these earnings were $46.0 million at February 28, 2011.Determination of the deferred tax liability, if any, on these earnings reinvested indefinitely outside the U.S. is notpracticable because of available foreign tax credits. It is the Company’s policy to invest the earnings of foreignsubsidiaries indefinitely outside the U.S. From time to time, however, the Company remits a portion of theseearnings to the extent it does not incur additional U.S. tax and it is otherwise feasible. The Company hasprovided U.S. income taxes on the earnings of certain foreign subsidiaries that are not considered as permanentlyreinvested outside the U.S. The U.S. income tax on such earnings is completely offset by U.S. foreign tax credits.
Unrecognized tax benefits
The following table reconciles unrecognized tax benefits for the three years ended February 28, 2011(in thousands):
Balance at February 29, 2008 . . . . . . . . . . . . . . . . . . . . . . . . . . . . . . . . . . . . . . . . . . . . . . . . . . . . . . . . . . . $35,880Additions based on tax positions related to the current year . . . . . . . . . . . . . . . . . . . . . . . . . . . . . . . . . . . 2,627
Balance at February 28, 2009 . . . . . . . . . . . . . . . . . . . . . . . . . . . . . . . . . . . . . . . . . . . . . . . . . . . . . . . . . . . $38,507Additions based on tax positions related to the current year . . . . . . . . . . . . . . . . . . . . . . . . . . . . . . . . . . . 2,320Additions based on tax positions related to prior years . . . . . . . . . . . . . . . . . . . . . . . . . . . . . . . . . . . . . . . 2,977Reductions related to settlements with tax authorities . . . . . . . . . . . . . . . . . . . . . . . . . . . . . . . . . . . . . . . . (430)
Balance at February 28, 2010 . . . . . . . . . . . . . . . . . . . . . . . . . . . . . . . . . . . . . . . . . . . . . . . . . . . . . . . . . . . $43,374Additions based on tax positions related to the current year . . . . . . . . . . . . . . . . . . . . . . . . . . . . . . . . . . . 3,782Additions based on tax positions related to prior years . . . . . . . . . . . . . . . . . . . . . . . . . . . . . . . . . . . . . . . 2,292Reductions related to change in effective tax rate . . . . . . . . . . . . . . . . . . . . . . . . . . . . . . . . . . . . . . . . . . . (7,365)
Balance at February 28, 2011 . . . . . . . . . . . . . . . . . . . . . . . . . . . . . . . . . . . . . . . . . . . . . . . . . . . . . . . . . . . $42,083
The Company’s unrecognized tax benefits as February 28, 2011 and February 28, 2010, which, ifrecognized, would affect the Company’s effective tax rate were $38.1 million and $36.1 million, respectively.
It is the Company’s policy to recognize interest and penalties related to uncertain tax positions as incometax expense. Accrued interest and penalties related to unrecognized tax benefits totaled $3.1 million and $1.1million as of February 28, 2011 and February 28, 2010, respectively.
The results and timing of the resolution of tax audits is highly uncertain and the Company is unable toestimate the range of the possible changes to the balance of unrecognized tax benefits. However, the Companydoes not anticipate that within the next 12 months that the total amount of unrecognized tax benefits willsignificantly increase or decrease as a result of any such potential tax audit resolutions.
85
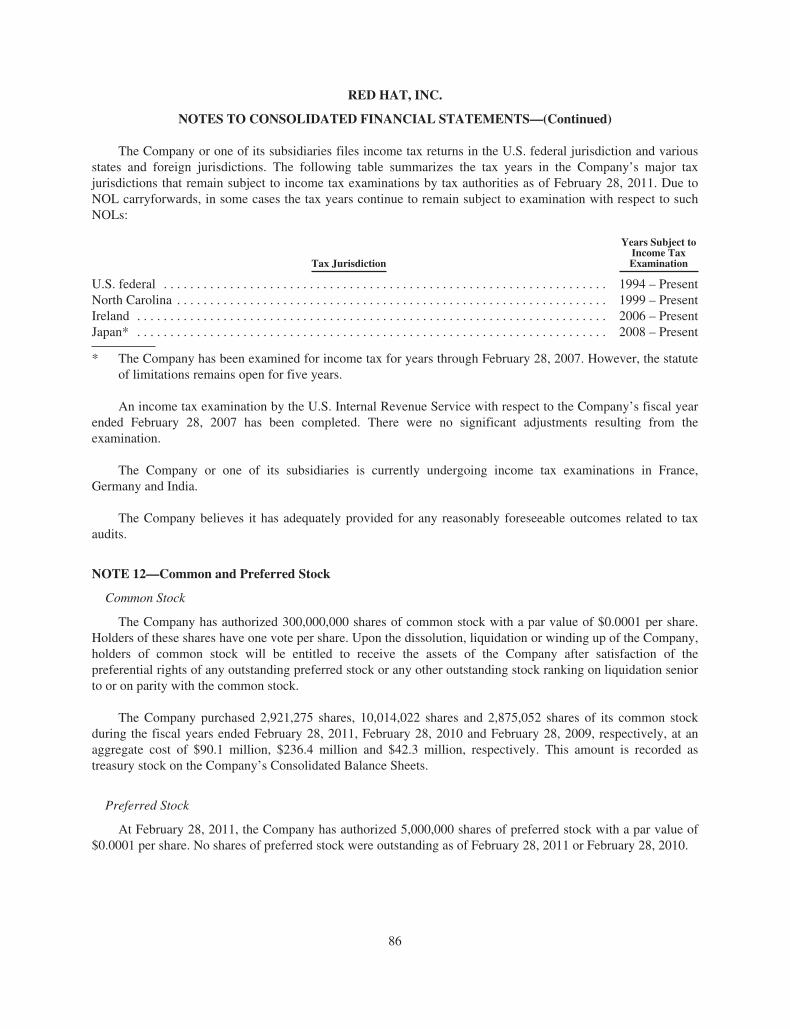
RED HAT, INC.
NOTES TO CONSOLIDATED FINANCIAL STATEMENTS—(Continued)
The Company or one of its subsidiaries files income tax returns in the U.S. federal jurisdiction and variousstates and foreign jurisdictions. The following table summarizes the tax years in the Company’s major taxjurisdictions that remain subject to income tax examinations by tax authorities as of February 28, 2011. Due toNOL carryforwards, in some cases the tax years continue to remain subject to examination with respect to suchNOLs:
Tax Jurisdiction
Years Subject toIncome TaxExamination
U.S. federal . . . . . . . . . . . . . . . . . . . . . . . . . . . . . . . . . . . . . . . . . . . . . . . . . . . . . . . . . . . . . . . . . . . 1994 – PresentNorth Carolina . . . . . . . . . . . . . . . . . . . . . . . . . . . . . . . . . . . . . . . . . . . . . . . . . . . . . . . . . . . . . . . . . 1999 – PresentIreland . . . . . . . . . . . . . . . . . . . . . . . . . . . . . . . . . . . . . . . . . . . . . . . . . . . . . . . . . . . . . . . . . . . . . . . 2006 – PresentJapan* . . . . . . . . . . . . . . . . . . . . . . . . . . . . . . . . . . . . . . . . . . . . . . . . . . . . . . . . . . . . . . . . . . . . . . . 2008 – Present
* The Company has been examined for income tax for years through February 28, 2007. However, the statuteof limitations remains open for five years.
An income tax examination by the U.S. Internal Revenue Service with respect to the Company’s fiscal yearended February 28, 2007 has been completed. There were no significant adjustments resulting from theexamination.
The Company or one of its subsidiaries is currently undergoing income tax examinations in France,Germany and India.
The Company believes it has adequately provided for any reasonably foreseeable outcomes related to taxaudits.
NOTE 12—Common and Preferred Stock
Common Stock
The Company has authorized 300,000,000 shares of common stock with a par value of $0.0001 per share.Holders of these shares have one vote per share. Upon the dissolution, liquidation or winding up of the Company,holders of common stock will be entitled to receive the assets of the Company after satisfaction of thepreferential rights of any outstanding preferred stock or any other outstanding stock ranking on liquidation seniorto or on parity with the common stock.
The Company purchased 2,921,275 shares, 10,014,022 shares and 2,875,052 shares of its common stockduring the fiscal years ended February 28, 2011, February 28, 2010 and February 28, 2009, respectively, at anaggregate cost of $90.1 million, $236.4 million and $42.3 million, respectively. This amount is recorded astreasury stock on the Company’s Consolidated Balance Sheets.
Preferred Stock
At February 28, 2011, the Company has authorized 5,000,000 shares of preferred stock with a par value of$0.0001 per share. No shares of preferred stock were outstanding as of February 28, 2011 or February 28, 2010.
86

RED HAT, INC.
NOTES TO CONSOLIDATED FINANCIAL STATEMENTS—(Continued)
NOTE 13—Share-based Awards
Overview
The Company’s 2004 Long-Term Incentive Plan, as amended and restated (the “2004 Plan”), provides forthe granting of stock options, service-based share awards and performance-based share awards, among otherawards. As of February 28, 2011, there were 6.7 million shares of common stock reserved for issuance underfuture share-based awards to be granted to any employee, officer or director or consultant of the Company atterms and prices to be determined by the Board of Directors.
The following table summarizes share-based awards, by type, granted during the years ended February 28,2011, February 28, 2010 and February 28, 2009:
Awards GrantedYear Ended
February 28, 2011
Awards GrantedYear Ended
February 28, 2010
Awards GrantedYear Ended
February 28, 2009
Shares andShares
UnderlyingAwards
WeightedAveragePer ShareAward
Fair Value
Shares andShares
UnderlyingAwards
WeightedAveragePer ShareAward
Fair Value
Shares andShares
UnderlyingAwards
WeightedAveragePer ShareAward
Fair Value
Stock options . . . . . . . . . . . . . . . . . . . . . . 83,891 $19.92 100,080 $10.63 84,460 $ 4.66Service-based shares and share units . . . 2,542,479 $37.98 2,598,916 $27.71 3,557,434 $14.21Performance-based shares and shareunits—target . . . . . . . . . . . . . . . . . . . . 313,336 $29.31 343,334 $19.68 202,500 $23.82
Total share-based awards . . . . . . . . . . . . 2,939,706 $36.54 3,042,330 $26.24 3,844,394 $14.51
The following summarizes share-based compensation expense recognized in the Company’s ConsolidatedFinancial Statements for the years ended February 28, 2011, February 28, 2010 and February 28, 2009 (inthousands):
Year EndedFebruary 28,
2011
Year EndedFebruary 28,
2010
Year EndedFebruary 28,
2009
Cost of revenue . . . . . . . . . . . . . . . . . . . . . . . . . . . . . . . . . . $ 6,053 $ 3,630 $ 3,065Sales and marketing . . . . . . . . . . . . . . . . . . . . . . . . . . . . . . . 18,971 14,041 13,826Research and development . . . . . . . . . . . . . . . . . . . . . . . . . 15,639 13,614 14,027General and administrative . . . . . . . . . . . . . . . . . . . . . . . . . 19,934 17,003 17,397
Total share-based compensation expense . . . . . . . . . . . . . . $60,597 $48,288 $48,315
Share-based compensation expense qualifying for capitalization was insignificant for each of theCompany’s fiscal years ended February 28, 2011, February 28, 2010 and February 28, 2009. Accordingly, noshare-based compensation expense was capitalized during these years.
Estimated annual forfeitures—During the fourth quarter of fiscal 2011, the Company reassessed itsestimated forfeiture rate. Based on recent historical trends and management’s expectations regarding futuretrends, the Company has adjusted its estimated forfeiture rate to 10.0% per annum from 15.0% per annum. Theimpact of the adjustment on current year’s financial results totaled $0.6 million additional expense. The forfeiturerate is applied to awards of options and service-based share units. Award expense is adjusted to reflect actualforfeiture rates at vesting. The Company reassesses its estimated forfeiture rate annually.
87

RED HAT, INC.
NOTES TO CONSOLIDATED FINANCIAL STATEMENTS—(Continued)
Stock Options
The 2004 Plan provides that the purchase price per share for each option shall not be less than the fairmarket value of the underlying share on the date of grant. Options granted under the 2004 Plan to date includecontract terms of five years and generally vest 25% upon completion of one full year of service and 6.25% on thefirst day of each subsequent three-month period of service. The maximum contract term for an option grantedunder the 2004 Plan is seven years from the date of grant.
The total fair value of stock options recognized in the Consolidated Financial Statements for the years endedFebruary 28, 2011, February 28, 2010 and February 28, 2009 was as follows (in thousands):
Year EndedFebruary 28,
2011
Year EndedFebruary 28,
2010
Year EndedFebruary 28,
2009
Total fair value of stock options recognized . . . . . . . . . . . . $6,038 $11,381 $20,124
The following table summarizes the activity for the Company’s stock options for the years endedFebruary 28, 2011, February 28, 2010 and February 28, 2009:
Shares UnderlyingOptions
Weighted AverageExercise Price Per
Share
Outstanding at February 29, 2008 . . . . . . . . . . . . . . . . . . . . . . . . . . . . . . . . . . 18,439,416 $15.73
Granted . . . . . . . . . . . . . . . . . . . . . . . . . . . . . . . . . . . . . . . . . . . . . . . . . . . 84,460 13.15Exercised . . . . . . . . . . . . . . . . . . . . . . . . . . . . . . . . . . . . . . . . . . . . . . . . . (1,583,329) 11.59Forfeited . . . . . . . . . . . . . . . . . . . . . . . . . . . . . . . . . . . . . . . . . . . . . . . . . . (1,135,185) 20.32
Outstanding at February 28, 2009 . . . . . . . . . . . . . . . . . . . . . . . . . . . . . . . . . . 15,805,362 $15.80
Granted . . . . . . . . . . . . . . . . . . . . . . . . . . . . . . . . . . . . . . . . . . . . . . . . . . . 100,080 27.40Exercised . . . . . . . . . . . . . . . . . . . . . . . . . . . . . . . . . . . . . . . . . . . . . . . . . (6,217,251) 16.62Forfeited . . . . . . . . . . . . . . . . . . . . . . . . . . . . . . . . . . . . . . . . . . . . . . . . . . (463,882) 62.97
Outstanding at February 28, 2010 . . . . . . . . . . . . . . . . . . . . . . . . . . . . . . . . . . 9,224,309 $13.03
Granted (1) . . . . . . . . . . . . . . . . . . . . . . . . . . . . . . . . . . . . . . . . . . . . . . . . 83,891 33.59Exercised . . . . . . . . . . . . . . . . . . . . . . . . . . . . . . . . . . . . . . . . . . . . . . . . . (7,071,001) 11.94Forfeited . . . . . . . . . . . . . . . . . . . . . . . . . . . . . . . . . . . . . . . . . . . . . . . . . . (207,711) 19.25
Outstanding at February 28, 2011 . . . . . . . . . . . . . . . . . . . . . . . . . . . . . . . . . . 2,029,488 $16.88
(1) Amount includes 10,129 partially vested options assumed as part of a business combination.
As described above, options are typically granted with an exercise price equal to the fair market value of theCompany’s common stock on the date of grant. No options were granted during the three years endedFebruary 28, 2011 with exercise prices less than the grant date fair value of the Company’s common stock.
88

RED HAT, INC.
NOTES TO CONSOLIDATED FINANCIAL STATEMENTS—(Continued)
The following summarizes information, as of February 28, 2011, about the Company’s outstanding andexercisable stock options:
Options Outstanding Options Exercisable
Exercise PricesNumber
Outstanding
WeightedAverage
RemainingContractual Life
WeightedAverage
Exercise PriceNumber
Exercisable
WeightedAverage
Exercise Price
$ 0.00 – $10.00 . . . . . . . . . . . . . . . . . . . . . 590,230 1.8 $ 5.91 570,687 $ 6.00$10.01 – $20.00 . . . . . . . . . . . . . . . . . . . . 954,525 1.7 $19.09 788,072 $ 19.20$20.01 – $30.00 . . . . . . . . . . . . . . . . . . . . 423,136 1.7 $23.54 298,265 $ 22.99$30.01 and over . . . . . . . . . . . . . . . . . . . . 61,597 4.6 $41.85 502 $341.37
Total . . . . . . . . . . . . . . . . . . . . . . . . . . . . . 2,029,488 1.8 $16.88 1,657,526 $ 15.43
The following summarizes the intrinsic value, as of February 28, 2011, of the Company’s outstanding,exercisable and expected to vest stock options:
Intrinsic Value of Stock OptionsNumber of
Stock Options
Weighted AverageRemaining
Contractual Life
Intrinsic Value atFebruary 28, 2011(in thousands)
Outstanding . . . . . . . . . . . . . . . . . . . . . . . . . . . . . . . . . . . . . . . . 2,029,488 1.8 $49,685Exercisable . . . . . . . . . . . . . . . . . . . . . . . . . . . . . . . . . . . . . . . . . 1,657,526 1.6 $42,987Expected to vest (assuming annual forfeiture rate of 10%) . . . . 330,780 2.9 $ 6,054
The intrinsic value of stock options exercised during the years ended February 28, 2011, February 28, 2010and February 28, 2009 was as follows (in thousands):
Year EndedFebruary 28,
2011
Year EndedFebruary 28,
2010
Year EndedFebruary 28,
2009
Total intrinsic value of stock options exercised . . . . . . . . . . $161,796 $62,804 $13,210
As of February 28, 2011, compensation cost related to unvested stock options not yet recognized in theCompany’s Consolidated Financial Statements totaled $3.2 million. The weighted average period over whichthese unvested stock options are expected to be recognized is approximately 1.0 years.
The fair values of options granted during the years ended February 28, 2011, February 28, 2010 andFebruary 28, 2009 were estimated on the date of grant using the Black-Scholes-Merton option-pricing modelbased on the following weighted average assumptions:
Year EndedFebruary 28,
2011
Year EndedFebruary 28,
2010
Year EndedFebruary 28,
2009
Expected dividend yield . . . . . . . . . . . . . . . . . . . . . . . . . . . . . . . . . . . . . . . 0.00% 0.00% 0.00%Risk-free interest rate . . . . . . . . . . . . . . . . . . . . . . . . . . . . . . . . . . . . . . . . . 0.70% 1.59% 2.01%Expected volatility (1) . . . . . . . . . . . . . . . . . . . . . . . . . . . . . . . . . . . . . . . . 46.84% 53.51% 47.45%Expected life (in years) (2) . . . . . . . . . . . . . . . . . . . . . . . . . . . . . . . . . . . . 3.27 3.27 3.27Weighted average fair value of options granted during the period . . . . . . $17.32 $10.63 $ 4.66
(1) The expected volatility rates for options granted during the years ended February 28, 2011, February 28,2010 and February 28, 2009 were estimated based on an approximate equal weighting of the historical
89

RED HAT, INC.
NOTES TO CONSOLIDATED FINANCIAL STATEMENTS—(Continued)
volatility of the Company’s common stock over a period of approximately 3.27 years and the impliedvolatility of publicly traded options for the Company’s common stock.
(2) The expected term for options granted during the years ended February 28, 2011, February 28, 2010 andFebruary 28, 2009 was determined based on the Company’s historical exercise data. The Companyreassesses its estimate of expected term annually or when new information indicates a change is appropriate.
Service-based Share Awards
Service-based share awards include nonvested shares, nonvested share units and deferred share units grantedunder the 2004 Plan. Nonvested shares and share units generally vest, subject to continued service to theCompany, 25% on the first anniversary of the date of grant and (i) 6.25% on the first day of each subsequentthree-month period for nonvested shares and (ii) 25% each year over a four-year period beginning on the date ofgrant for nonvested share units. Nonvested shares and nonvested share units are generally amortized to expenseon a straight-line basis over four years. Deferred share units are awarded to directors and generally vest withinone year when issued in lieu of annual share awards or immediately when issued in lieu of cash.
The total fair value of service-based share awards recognized in the Company’s Consolidated FinancialStatements for the three years ended February 28, 2011 was as follows (in thousands):
Year EndedFebruary 28,
2011
Year EndedFebruary 28,
2010
Year EndedFebruary 28,
2009
Total fair value of service-based awards recognized . . . . . . $44,050 $28,419 $16,954
The following table summarizes the activity for the Company’s service-based share awards for the yearsended February 28, 2011, February 28, 2010 and February 28, 2009:
NonvestedShares andShare Units
Weighted AverageGrant-dateFair Value
Service-based share awards at February 29, 2008 . . . . . . . . . . . . . . . . . . . . . . . . . . 2,014,367 $20.57
Granted . . . . . . . . . . . . . . . . . . . . . . . . . . . . . . . . . . . . . . . . . . . . . . . . . . . . . . . 3,557,434 14.21Vested . . . . . . . . . . . . . . . . . . . . . . . . . . . . . . . . . . . . . . . . . . . . . . . . . . . . . . . . (517,810) 20.24Forfeited . . . . . . . . . . . . . . . . . . . . . . . . . . . . . . . . . . . . . . . . . . . . . . . . . . . . . . (191,942) 18.55
Service-based share awards at February 28, 2009 . . . . . . . . . . . . . . . . . . . . . . . . . . 4,862,049 $16.06
Granted . . . . . . . . . . . . . . . . . . . . . . . . . . . . . . . . . . . . . . . . . . . . . . . . . . . . . . . 2,598,916 27.71Vested . . . . . . . . . . . . . . . . . . . . . . . . . . . . . . . . . . . . . . . . . . . . . . . . . . . . . . . . (1,414,665) 16.79Forfeited . . . . . . . . . . . . . . . . . . . . . . . . . . . . . . . . . . . . . . . . . . . . . . . . . . . . . . (261,374) 17.92
Service-based share awards at February 28, 2010 . . . . . . . . . . . . . . . . . . . . . . . . . . 5,784,926 $21.03
Granted . . . . . . . . . . . . . . . . . . . . . . . . . . . . . . . . . . . . . . . . . . . . . . . . . . . . . . . 2,542,479 37.98Vested . . . . . . . . . . . . . . . . . . . . . . . . . . . . . . . . . . . . . . . . . . . . . . . . . . . . . . . . (1,800,281) 20.43Forfeited . . . . . . . . . . . . . . . . . . . . . . . . . . . . . . . . . . . . . . . . . . . . . . . . . . . . . . (733,786) 21.52
Service-based share awards at February 28, 2011 . . . . . . . . . . . . . . . . . . . . . . . . . . 5,793,338 $28.60
90

RED HAT, INC.
NOTES TO CONSOLIDATED FINANCIAL STATEMENTS—(Continued)
The following summarizes the intrinsic value, as of February 28, 2011, of the Company’s service-basedawards outstanding and expected to vest:
Intrinsic Value ofService-based Awards
Number ofShares andShare Units
Weighted AverageRemaining
Vesting Period
Intrinsic Value atFebruary 28, 2011(in thousands)
Outstanding . . . . . . . . . . . . . . . . . . . . . . . . . . . . . . . . . . . . . . . . . . 5,793,338 1.6 $239,149Expected to vest (assuming annual forfeiture rate of 10%) . . . . . 4,934,307 1.6 $203,688
The intrinsic value of service-based awards vesting during the three years ended February 28, 2011 was asfollows (in thousands):
Year EndedFebruary 28,
2011
Year EndedFebruary 28,
2010
Year EndedFebruary 28,
2009
Total fair value of service-based awards vesting . . . . . . . . . $70,493 $38,297 $7,244
As of February 28, 2011, compensation cost related to service-based share awards not yet recognized in theCompany’s Consolidated Financial Statements totaled $145.1 million. The weighted average period over whichthese nonvested awards are expected to be recognized is approximately 1.6 years.
Performance-based Share Awards
Under the 2004 Plan, certain executive officers were awarded a target number of performance share units(“PSUs”) PSUs. The PSU payouts are either based on (i) the Company’s financial performance (“performancecondition”) or (ii) the performance of the Company’s common stock (“market condition”). Following are generaldescriptions of the two types of performance-based awards granted to certain executive officers.
PSUs with Performance Conditions
Depending on the Company’s financial performance relative to the financial performance of specified peercompanies, executives may earn up to 200% of the target number of PSUs (the “Maximum PSUs”) over aperformance period with three separate performance segments corresponding to three fiscal years of theCompany. Up to 25% of the Maximum PSUs may be earned in respect of the first performance segment; up to50% of the Maximum PSUs may be earned in respect of the second performance segment, less the amountearned in the first performance segment; and up to 100% of the Maximum PSUs may be earned in respect of thethird performance segment, less the amount earned in the first and second performance segments.
PSUs with Market Conditions
Depending on the performance of the Company’s common stock over a performance period ofapproximately three years, executives may earn up to 200% of the target number of PSUs. The number of PSUsearned is determined based on a comparison of the performance of the Company’s stock price relative to theperformance of the stock price of specified peer companies during the performance period. Each executiveofficer will receive a number of shares of common stock equal to the number of PSUs earned in a single payoutfollowing the end of the performance period.
91

RED HAT, INC.
NOTES TO CONSOLIDATED FINANCIAL STATEMENTS—(Continued)
The following table summarizes the activity for the Company’s PSUs for the years ended February 28,2011, February 28, 2010 and February 28, 2009:
At Target Potential
Activity
SharesUnderlyingPerformanceShare Units
Weighted AverageGrant DateFair Value
Underlying SharesVesting and Available
to Vest (1)
Outstanding at February 29, 2008 . . . . . . . . . . 232,625 $21.00 465,250
Granted . . . . . . . . . . . . . . . . . . . . . . . . . . . . . . . 202,500 $23.82 405,000Vested . . . . . . . . . . . . . . . . . . . . . . . . . . . . . . . . (46,525) $21.00 (93,050)Forfeited . . . . . . . . . . . . . . . . . . . . . . . . . . . . . . 0 — 0
Outstanding at February 28, 2009 . . . . . . . . . . 388,600 $22.47 777,200
Granted . . . . . . . . . . . . . . . . . . . . . . . . . . . . . . . 343,334 $19.68 686,668Vested . . . . . . . . . . . . . . . . . . . . . . . . . . . . . . . . (120,413) $22.20 (190,200)Forfeited . . . . . . . . . . . . . . . . . . . . . . . . . . . . . . 0 — 0
Outstanding at February 28, 2010 . . . . . . . . . . 611,521 $20.96 1,273,668
Granted . . . . . . . . . . . . . . . . . . . . . . . . . . . . . . . 313,336 $29.31 626,672Vested . . . . . . . . . . . . . . . . . . . . . . . . . . . . . . . . (209,856) $21.43 (451,725)Forfeited . . . . . . . . . . . . . . . . . . . . . . . . . . . . . . 0 — (18,610)
Outstanding at February 28, 2011 . . . . . . . . . . 715,001 $24.48 1,430,005
(1) Vested and forfeited amounts represent the actual number of shares vesting and forfeited during the year.Outstanding represents the remaining maximum potential shares available to vest as of the period ended.
The total fair value of performance-based share awards recognized in the Company’s ConsolidatedFinancial Statements for the three years ended February 28, 2011 was as follows (in thousands):
Year EndedFebruary 28,
2011
Year EndedFebruary 28,
2010
Year EndedFebruary 28,
2009
Total fair value of performance-based awardsrecognized . . . . . . . . . . . . . . . . . . . . . . . . . . . . . . . . . . . . $10,509 $8,488 $11,237
The total fair value of performance-based share awards vesting during the three years ended February 28,2011 was as follows (in thousands):
Year EndedFebruary 28,
2011
Year EndedFebruary 28,
2010
Year EndedFebruary 28,
2009
Total fair value of performance-based awards vesting . . . . $13,904 $3,380 $1,964
As of February 28, 2011, the number of shares subject to PSU awards expected to vest and the relatedintrinsic value was 1,390,838 and $57.4 million, respectively. Compensation expense related to PSUs expected tovest but not yet recognized in the Consolidated Financial Statements totaled $11.2 million as of February 28,2011. The weighted average period over which these awards are expected to be recognized is approximately 1.0year.
92

RED HAT, INC.
NOTES TO CONSOLIDATED FINANCIAL STATEMENTS—(Continued)
NOTE 14—Commitments and Contingencies
As of February 28, 2011, the Company leased office space and certain equipment under variousnon-cancelable operating leases. Future minimum lease payments required under the operating leases atFebruary 28, 2011 are as follows (in thousands):
Fiscal YearOperatingLeases
2012 . . . . . . . . . . . . . . . . . . . . . . . . . . . . . . . . . . . . . . . . . . . . . . . . . . . . . . . . . . . . . . . . . . . . . $21,8512013 . . . . . . . . . . . . . . . . . . . . . . . . . . . . . . . . . . . . . . . . . . . . . . . . . . . . . . . . . . . . . . . . . . . . . 15,6842014 . . . . . . . . . . . . . . . . . . . . . . . . . . . . . . . . . . . . . . . . . . . . . . . . . . . . . . . . . . . . . . . . . . . . . 12,9112015 . . . . . . . . . . . . . . . . . . . . . . . . . . . . . . . . . . . . . . . . . . . . . . . . . . . . . . . . . . . . . . . . . . . . . 9,5852016 . . . . . . . . . . . . . . . . . . . . . . . . . . . . . . . . . . . . . . . . . . . . . . . . . . . . . . . . . . . . . . . . . . . . . 8,425Thereafter . . . . . . . . . . . . . . . . . . . . . . . . . . . . . . . . . . . . . . . . . . . . . . . . . . . . . . . . . . . . . . . . 18,970
Total minimum lease payments . . . . . . . . . . . . . . . . . . . . . . . . . . . . . . . . . . . . . . . . . . . . . . . $87,426
Rent expense under operating leases for the fiscal years ended February 28, 2011, February 28, 2010 andFebruary 28, 2009 is provided in the following table (in thousands):
Year EndedFebruary 28,
2011
Year EndedFebruary 28,
2010
Year EndedFebruary 28,
2009
Total operating lease expense . . . . . . . . . . . . . . . . . . . . . . . $22,973 $22,344 $22,492
Product Indemnification
The Company is a party to a variety of agreements pursuant to which it may be obligated to indemnify theother party from losses arising in connection with the Company’s services or products, or from losses arising inconnection with certain events defined within a particular contract, which may include litigation or claimsrelating to intellectual property infringement, certain losses arising from damage to property or injury to personsor other matters. In each of these circumstances, payment by the Company is conditioned on the other partymaking a claim pursuant to the procedures specified in the particular contract, which procedures typically allowthe Company to challenge the other party’s claims. Further, the Company’s obligations under these agreementsmay in certain cases be limited in terms of time and/or amount, and in some instances, the Company may haverecourse against third-parties for certain payments made by the Company.
It is not possible to predict the maximum potential amount of future payments under these or similaragreements due to the conditional nature of the Company’s obligations and the facts and circumstances involvedin each particular agreement. The Company does not record a liability for claims related to indemnificationunless the Company concludes that the likelihood of a material claim is probable and estimable. Paymentspursuant to these indemnification claims during the year ended February 28, 2011 were in the aggregateimmaterial.
NOTE 15—Legal Proceedings
Commencing on or about March 2001, the Company and certain of its officers and directors were named asdefendants in a series of purported class action suits arising out of the Company’s initial public offering andsecondary offering. Approximately 310 other IPO issuers were named as defendants in similar class actioncomplaints (together, the “IPO Allocation Actions”). On August 8, 2001, Chief Judge Michael Mukasey of theU.S. District Court for the Southern District of New York issued an order that transferred all of the IPOAllocation Actions, including the complaints involving the Company, to one judge for coordinated pre-trial
93
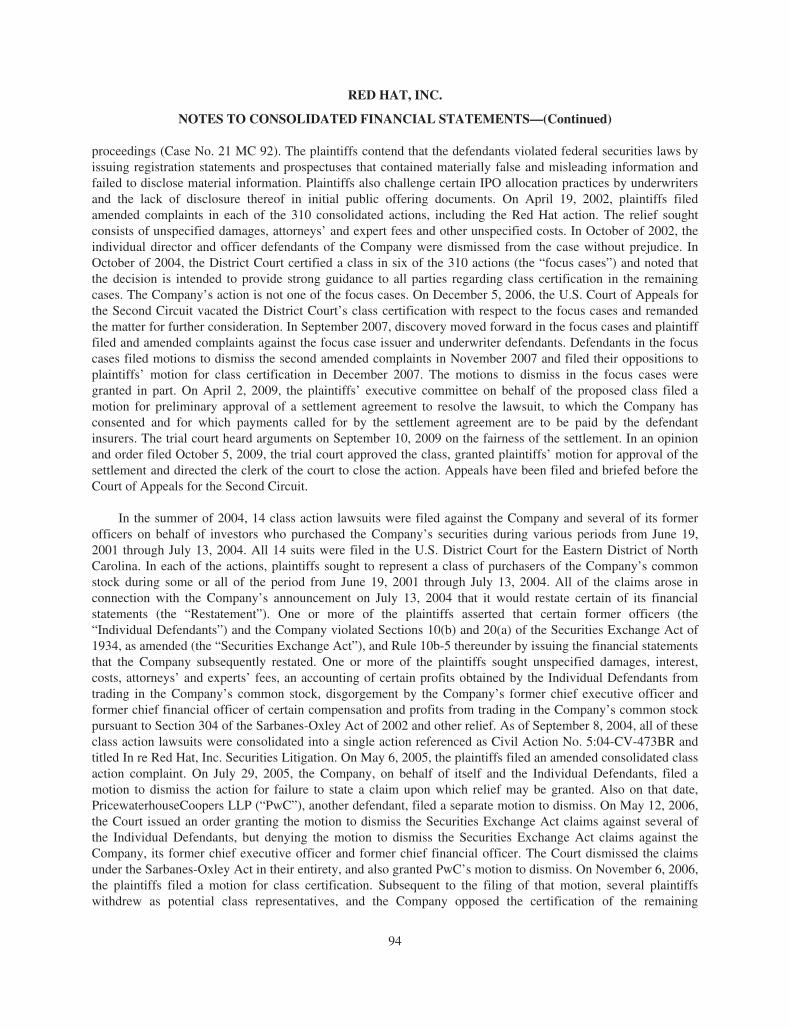
RED HAT, INC.
NOTES TO CONSOLIDATED FINANCIAL STATEMENTS—(Continued)
proceedings (Case No. 21 MC 92). The plaintiffs contend that the defendants violated federal securities laws byissuing registration statements and prospectuses that contained materially false and misleading information andfailed to disclose material information. Plaintiffs also challenge certain IPO allocation practices by underwritersand the lack of disclosure thereof in initial public offering documents. On April 19, 2002, plaintiffs filedamended complaints in each of the 310 consolidated actions, including the Red Hat action. The relief soughtconsists of unspecified damages, attorneys’ and expert fees and other unspecified costs. In October of 2002, theindividual director and officer defendants of the Company were dismissed from the case without prejudice. InOctober of 2004, the District Court certified a class in six of the 310 actions (the “focus cases”) and noted thatthe decision is intended to provide strong guidance to all parties regarding class certification in the remainingcases. The Company’s action is not one of the focus cases. On December 5, 2006, the U.S. Court of Appeals forthe Second Circuit vacated the District Court’s class certification with respect to the focus cases and remandedthe matter for further consideration. In September 2007, discovery moved forward in the focus cases and plaintifffiled and amended complaints against the focus case issuer and underwriter defendants. Defendants in the focuscases filed motions to dismiss the second amended complaints in November 2007 and filed their oppositions toplaintiffs’ motion for class certification in December 2007. The motions to dismiss in the focus cases weregranted in part. On April 2, 2009, the plaintiffs’ executive committee on behalf of the proposed class filed amotion for preliminary approval of a settlement agreement to resolve the lawsuit, to which the Company hasconsented and for which payments called for by the settlement agreement are to be paid by the defendantinsurers. The trial court heard arguments on September 10, 2009 on the fairness of the settlement. In an opinionand order filed October 5, 2009, the trial court approved the class, granted plaintiffs’ motion for approval of thesettlement and directed the clerk of the court to close the action. Appeals have been filed and briefed before theCourt of Appeals for the Second Circuit.
In the summer of 2004, 14 class action lawsuits were filed against the Company and several of its formerofficers on behalf of investors who purchased the Company’s securities during various periods from June 19,2001 through July 13, 2004. All 14 suits were filed in the U.S. District Court for the Eastern District of NorthCarolina. In each of the actions, plaintiffs sought to represent a class of purchasers of the Company’s commonstock during some or all of the period from June 19, 2001 through July 13, 2004. All of the claims arose inconnection with the Company’s announcement on July 13, 2004 that it would restate certain of its financialstatements (the “Restatement”). One or more of the plaintiffs asserted that certain former officers (the“Individual Defendants”) and the Company violated Sections 10(b) and 20(a) of the Securities Exchange Act of1934, as amended (the “Securities Exchange Act”), and Rule 10b-5 thereunder by issuing the financial statementsthat the Company subsequently restated. One or more of the plaintiffs sought unspecified damages, interest,costs, attorneys’ and experts’ fees, an accounting of certain profits obtained by the Individual Defendants fromtrading in the Company’s common stock, disgorgement by the Company’s former chief executive officer andformer chief financial officer of certain compensation and profits from trading in the Company’s common stockpursuant to Section 304 of the Sarbanes-Oxley Act of 2002 and other relief. As of September 8, 2004, all of theseclass action lawsuits were consolidated into a single action referenced as Civil Action No. 5:04-CV-473BR andtitled In re Red Hat, Inc. Securities Litigation. On May 6, 2005, the plaintiffs filed an amended consolidated classaction complaint. On July 29, 2005, the Company, on behalf of itself and the Individual Defendants, filed amotion to dismiss the action for failure to state a claim upon which relief may be granted. Also on that date,PricewaterhouseCoopers LLP (“PwC”), another defendant, filed a separate motion to dismiss. On May 12, 2006,the Court issued an order granting the motion to dismiss the Securities Exchange Act claims against several ofthe Individual Defendants, but denying the motion to dismiss the Securities Exchange Act claims against theCompany, its former chief executive officer and former chief financial officer. The Court dismissed the claimsunder the Sarbanes-Oxley Act in their entirety, and also granted PwC’s motion to dismiss. On November 6, 2006,the plaintiffs filed a motion for class certification. Subsequent to the filing of that motion, several plaintiffswithdrew as potential class representatives, and the Company opposed the certification of the remaining
94

RED HAT, INC.
NOTES TO CONSOLIDATED FINANCIAL STATEMENTS—(Continued)
proposed class representatives. On May 11, 2007, the Court entered an order denying class certification anddenying all other pending motions as moot. Thereafter, on July 13, 2007 Charles Gilbert filed a renewed motionfor appointment as lead plaintiff and approval of selection of lead counsel. On November 13, 2007, the Courtentered an Order allowing Gilbert’s motion, appointing him lead plaintiff, adding him as a party plaintiff andappointing lead counsel. On January 14, 2008, Gilbert’s counsel filed a motion to certify the action as a classaction. On August 28, 2009, the Court entered an Order certifying the action as a class action, appointing Gilbertas the class representative, and defining the class as “all purchasers of the common stock of Red Hat, Inc.between December 17, 2002, and July 12, 2004, inclusive and who were damaged thereby,” excluding Companyinsiders. On December 15, 2009, the Company announced that it had reached an agreement in principle to settlethis matter, subject, among other matters, to completion of a final written settlement agreement and courtapproval. The Company recorded, for its quarter ended November 30, 2009, an estimated liability in the amountof $8.8 million for its portion of the proposed settlement. On March 29, 2010, counsel for the class filed a Motionfor Preliminary Approval of the Settlement and, on June 11, 2010, a United States Magistrate Judge issued aMemorandum and Recommendation to the presiding judge that the motion be approved. On July 8, 2010, thepresiding judge approved the motion and set the hearing for the final fairness hearing on December 7, 2010. Thesettlement was approved by the District Court in an order dated December 10, 2010.
On December 9, 2009, the Company filed a complaint in the Eastern District of Texas (Civil ActionNo. 6:09-cv-00549) against Bedrock Computer Technologies LLC (“Bedrock”) seeking a declaratory judgmentthat United States Patent No. 5,893,120 (the “’120 Patent”) is invalid, unenforceable and not infringed. Thecomplaint states that Bedrock brought an action in which it wrongly accused some customers of the Company ofinfringing the ‘120 Patent based on their use of computer equipment configured with or utilizing software basedon various versions of the Linux operating system. The complaint seeks a declaration that anyone’s use, sale, oroffer for sale of the Linux kernel distributed by the Company has not and does not in any manner infringe anyclaim of the ‘120 patent or otherwise infringe or violate any rights of Bedrock and that the ‘120 Patent is invalidand unenforceable. On January 29, 2010, Bedrock responded denying the contentions in the complaint andasserting a counterclaim alleging that Red Hat has directly and indirectly infringed the ‘120 Patent. OnFebruary 22, 2010, Red Hat replied to the counterclaim denying the allegations of infringement and assertingaffirmative defenses. On March 26, 2010, Bedrock filed its first amended answer and counterclaim withcrossclaims against fifteen parties. The claim construction hearing has been scheduled for May 12, 2011 and trialin the case has been scheduled for October 11, 2011. Based on information available to date, the Companybelieves it has meritorious defenses to the counterclaims and intends to vigorously defend itself. There can be noassurance, however, that the Company will be successful in its defense, and an adverse resolution of thecounterclaims could have a material adverse effect on its business, financial position and results of operations,including its ability to continue to commercialize the technologies implicated in the litigation.
The Company also experiences routine litigation in the normal course of its business, including patentlitigation. The Company presently believes that the outcome of this routine litigation will not have a materialadverse effect on its financial position and results of operations.
NOTE 16—Employee Benefit Plans
401(k) Plan
The Company provides a retirement plan qualified under Section 401(k) of the Internal Revenue Code of1986, as amended (“IRC”). Participants may elect to contribute a portion of their annual compensation to theplan, after complying with certain limitations set by the IRC. Employees are eligible to participate in the plan ifthey are over 21 years of age. The Company has the option to make contributions to the plan and contributed to
95

RED HAT, INC.
NOTES TO CONSOLIDATED FINANCIAL STATEMENTS—(Continued)
the plan for the years ended February 28, 2011, February 28, 2010 and February 28, 2009 as follows(in thousands):
Year EndedFebruary 28,
2011
Year EndedFebruary 28,
2010
Year EndedFebruary 28,
2009
Total contributions to employee benefit plans . . . . . . . . . . . $8,683 $7,218 $6,019
NOTE 17—Share Repurchase Program
On March 24, 2010, the Company announced that its Board of Directors had authorized the repurchase of upto an aggregate of $300.0 million of the Company’s common stock from time to time in open market or privatelynegotiated transactions, as applicable. The program will expire on the earlier of (i) March 31, 2012 or (ii) adetermination by the Board of Directors, Chief Executive Officer or Chief Financial Officer to discontinue theprogram. During the year ended February 28, 2011, the Company repurchased 2,921,275 shares under theprogram for $90.1 million, including transaction costs. As of February 28, 2011, the remaining amount availableunder the program for the repurchase of common stock was $219.4 million.
NOTE 18—Assets and Liabilities Measured at Fair Value on a Recurring Basis
The following table summarizes the composition and fair value hierarchy of the Company’s financial assetsand liabilities at February 28, 2011 (in thousands):
As ofFebruary 28,
2011
Quoted Prices InActive Marketsfor Identical
Assets (Level 1)
SignificantOther
ObservableInputs (Level 2)
SignificantUnobservableInputs (Level 3)
Assets:Money markets (1) . . . . . . . . . . . . . . . . . . . . . $ 532,537 $532,537 $ 0 $0Available-for-sale securities (1):
Certificates of deposit . . . . . . . . . . . . . . . 1,840 0 1,840 0Commercial paper . . . . . . . . . . . . . . . . . . 27,562 0 27,562 0Agencies . . . . . . . . . . . . . . . . . . . . . . . . . 312,136 0 312,136 0Municipal bonds . . . . . . . . . . . . . . . . . . . 13,249 0 13,249 0Corporates . . . . . . . . . . . . . . . . . . . . . . . . 193,916 0 193,916 0
Equities (1) . . . . . . . . . . . . . . . . . . . . . . . . . . . 2,677 2,677 0 0Foreign currency derivatives (2) . . . . . . . . . . . 434 0 434 0
Liabilities:Foreign currency derivatives (3) . . . . . . . . . . . (96) 0 (96) 0
Total . . . . . . . . . . . . . . . . . . . . . . . . . . . . . . . . . . . . $1,084,255 $535,214 $549,041 $0
(1) Included in either cash and cash equivalents or investments in debt and equity securities in the Company’sConsolidated Balance Sheet at February 28, 2011 in addition to $108.5 million of cash.
(2) Included in other current assets in the Company’s Consolidated Balance Sheet at February 28, 2011.(3) Included in accrued expenses in the Company’s Consolidated Balance Sheet at February 28, 2011.
96

RED HAT, INC.
NOTES TO CONSOLIDATED FINANCIAL STATEMENTS—(Continued)
The following table summarizes the composition and fair value hierarchy of the Company’s financial assetsand liabilities at February 28, 2010 (in thousands):
As ofFebruary 28,
2010
Quoted Prices InActive Marketsfor Identical
Assets (Level 1)
SignificantOther
ObservableInputs (Level 2)
SignificantUnobservableInputs (Level 3)
Assets:Money markets (1) . . . . . . . . . . . . . . . . . . . . . $216,624 $216,624 $ 0 $0Available-for-sale securities (1):
Treasuries . . . . . . . . . . . . . . . . . . . . . . . . 9,294 9,294 0 0Certificates of deposit . . . . . . . . . . . . . . . 133,810 0 133,810 0Commercial paper . . . . . . . . . . . . . . . . . . 21,367 0 21,367 0Agencies . . . . . . . . . . . . . . . . . . . . . . . . . 349,338 0 349,338 0Municipal bonds . . . . . . . . . . . . . . . . . . . 11,754 0 11,754 0Corporates . . . . . . . . . . . . . . . . . . . . . . . . 160,915 0 160,915 0
Equities (1) . . . . . . . . . . . . . . . . . . . . . . . . . . . 4,687 4,687 0 0Foreign currency derivatives (2) . . . . . . . . . . . 77 0 77 0
Liabilities:Foreign currency derivatives (3) . . . . . . . . . . . (4) 0 (4) 0
Total . . . . . . . . . . . . . . . . . . . . . . . . . . . . . . . . . . . . $907,862 $230,605 $677,257 $0
(1) Included in either cash and cash equivalents or investments in debt and equity securities in the Company’sConsolidated Balance Sheet at February 28, 2010, in addition to $62.4 million of cash.
(2) Included in other current assets in the Company’s Consolidated Balance Sheet at February 28, 2010.(3) Included in accrued expenses in the Company’s Consolidated Balance Sheet at February 28, 2010.
The following table represents the Company’s investments measured at fair value as of February 28, 2011(in thousands):
Balance Sheet Classification
AmortizedCost
Gross Unrealized AggregateFairValue
CashEquivalentMarketableSecurities
Short-termMarketableSecurities
Long-termMarketableSecuritiesGains Losses(1)
Money markets . . . . . . . . . . $ 532,537 $ 0 $ 0 $ 532,537 $532,537 $ 0 $ 0Certificates of deposit . . . . . 1,840 0 0 1,840 20 1,820 0Commercial paper . . . . . . . . 27,558 4 0 27,562 1,600 25,962 0Agencies . . . . . . . . . . . . . . . 313,133 70 (1,067) 312,136 0 85,350 226,786Municipals . . . . . . . . . . . . . . 13,259 0 (10) 13,249 0 13,249 0Corporates . . . . . . . . . . . . . . 193,373 647 (103) 193,917 0 88,912 105,005Equities . . . . . . . . . . . . . . . . 85 2,592 0 2,677 0 2,677 0
Total . . . . . . . . . . . . . . . . . . . $1,081,785 $3,313 $(1,180) $1,083,918 $534,157 $217,970 $331,791
(1) As of February 28, 2011, there were no accumulated unrealized losses related to investments that have beenin a continuous unrealized loss position for 12 months or longer.
97

RED HAT, INC.
NOTES TO CONSOLIDATED FINANCIAL STATEMENTS—(Continued)
The following table represents the Company’s investments measured at fair value as of February 28, 2010(in thousands):
Balance Sheet Classification
AmortizedCost
Gross Unrealized AggregateFairValue
CashEquivalentMarketableSecurities
Short-termMarketableSecurities
Long-termMarketableSecuritiesGains Losses(1)
Money markets . . . . . . . . . . . . . $216,624 $ 0 $ 0 $216,624 $216,624 $ 0 $ 0Treasury . . . . . . . . . . . . . . . . . . . 9,253 41 0 9,294 0 9,294 0Certificates of deposit . . . . . . . . 133,810 0 0 133,810 108,060 25,750 0Commercial paper . . . . . . . . . . . 21,367 0 0 21,367 0 21,367 0Agencies . . . . . . . . . . . . . . . . . . 348,940 452 (54) 349,338 0 196,524 152,814Municipal bonds . . . . . . . . . . . . 11,739 15 0 11,754 0 11,754 0Corporates . . . . . . . . . . . . . . . . . 159,596 1,399 (80) 160,915 1,038 103,280 56,597Equities . . . . . . . . . . . . . . . . . . . 278 4,409 0 4,687 0 4,687 0
Total . . . . . . . . . . . . . . . . . . . . . . $901,607 $6,316 $(134) $907,789 $325,722 $372,656 $209,411
(1) Accumulated unrealized losses related to investments that have been in a continuous unrealized loss positionfor 12 months or longer totaled less than $0.1 million at February 28, 2010.
The following table summarizes the stated maturities of the Company’s investment in debt securities atFebruary 28, 2011 (in thousands):
TotalLess than1 Year 2-3 Years 4-5 Years
More than5 Years
Maturity of short and long term debt securities . . . . . . $547,084 $215,293 $193,246 $138,545 $0
NOTE 19—Earnings Per Share
The following table reconciles the numerators and denominators of the earnings per share calculation for theyears ended February 28, 2011, February 28, 2010 and February 28, 2009 (in thousands, except per shareamounts):
Year Ended
February 28,2011
February 28,2010
February 28,2009
Diluted net income per share computation:Net income . . . . . . . . . . . . . . . . . . . . . . . . . . . . . . . . . . . . . . . . . . . . . . . . . $107,278 $ 87,253 $ 78,721Interest expense on convertible debt, net of related tax . . . . . . . . . . . . . . . 0 0 1,413Amortization of debt issuance costs, net of related tax . . . . . . . . . . . . . . . 0 0 1,463
Net income—diluted . . . . . . . . . . . . . . . . . . . . . . . . . . . . . . . . . . . . . . . . . $107,278 $ 87,253 $ 81,597
Weighted average common shares outstanding . . . . . . . . . . . . . . . . . . . . . 190,294 187,845 190,772Incremental shares attributable to assumed vesting or exercise ofoutstanding equity award shares . . . . . . . . . . . . . . . . . . . . . . . . . . . . . . 6,059 5,701 4,942
Incremental shares attributable to assumed conversion of convertibledebentures . . . . . . . . . . . . . . . . . . . . . . . . . . . . . . . . . . . . . . . . . . . . . . . 0 0 15,630
Diluted shares . . . . . . . . . . . . . . . . . . . . . . . . . . . . . . . . . . . . . . . . . . . . . . . 196,353 193,546 211,344
Diluted net income per share . . . . . . . . . . . . . . . . . . . . . . . . . . . . . . . . . . . $ 0.55 $ 0.45 $ 0.39
98

RED HAT, INC.
NOTES TO CONSOLIDATED FINANCIAL STATEMENTS—(Continued)
The following share awards are not included in the computation of diluted earnings per share because theaggregate value of proceeds considered received upon either exercise or vesting was greater than the averagemarket price of the Company’s common stock during the related periods and the effect of including such shareawards in the computation would be anti-dilutive (in thousands):
Year Ended
February 28,2011
February 28,2010
February 28,2009
Number of shares considered anti-dilutive for calculating diluted EPS . . . 649 3,525 9,269
NOTE 20—Segment Reporting
The following summarizes revenue, net income (loss) and total assets by geographic segment at and for theyears ended February 28, 2011, February 28, 2010 and February 28, 2009 (in thousands):
Americas EMEA Asia Pacific Total
Year Ended February 28, 2011
Revenue from unaffiliated customers . . . . . . . . . . . . . . . . . . . $ 583,795 $199,646 $125,836 $ 909,277Net income . . . . . . . . . . . . . . . . . . . . . . . . . . . . . . . . . . . . . . . $ 65,526 $ 42,437 $ (685) $ 107,278Total assets . . . . . . . . . . . . . . . . . . . . . . . . . . . . . . . . . . . . . . . $1,737,946 $329,455 $131,921 $2,199,322
Year Ended February 28, 2010
Revenue from unaffiliated customers . . . . . . . . . . . . . . . . . . . $ 474,633 $168,134 $105,469 $ 748,236Net income (loss) . . . . . . . . . . . . . . . . . . . . . . . . . . . . . . . . . . . $ 62,849 $ 20,263 $ 4,141 $ 87,253Total assets . . . . . . . . . . . . . . . . . . . . . . . . . . . . . . . . . . . . . . . $1,566,140 $205,097 $ 99,635 $1,870,872
Year Ended February 28, 2009
Revenue from unaffiliated customers . . . . . . . . . . . . . . . . . . . $ 421,994 $141,679 $ 88,899 $ 652,572Net income (loss) . . . . . . . . . . . . . . . . . . . . . . . . . . . . . . . . . . . $ 73,120 $ 11,552 $ (5,951) $ 78,721Total assets . . . . . . . . . . . . . . . . . . . . . . . . . . . . . . . . . . . . . . . $1,539,840 $142,539 $ 71,257 $1,753,636
The following table lists, for the years ended February 28, 2011, February 28, 2010 and February 28, 2009,revenue from unaffiliated customers in the United States, the Company’s country of domicile, revenue fromunaffiliated customers in Japan, which in terms of revenue was the only individual country outside the UnitedStates to generate 10% or more of revenue, and revenue from other foreign countries (in thousands):
Year EndedFebruary 28,
2011
Year EndedFebruary 28,
2010
Year EndedFebruary 28,
2009
United States, the Company’s country of domicile . . . . . . . . . . . . . . . . . . $512,288 $423,295 $385,556Japan . . . . . . . . . . . . . . . . . . . . . . . . . . . . . . . . . . . . . . . . . . . . . . . . . . . . . 74,807 60,725 50,531Other foreign . . . . . . . . . . . . . . . . . . . . . . . . . . . . . . . . . . . . . . . . . . . . . . . 322,182 264,216 216,485
Total revenue from unaffiliated customers . . . . . . . . . . . . . . . . . . . . . . . . $909,277 $748,236 $652,572
99

RED HAT, INC.
NOTES TO CONSOLIDATED FINANCIAL STATEMENTS—(Continued)
Total tangible long-lived assets located in the United States, the Company’s country of domicile, and similartangible long-lived assets held outside the United States are summarized in the following table for the yearsended February 28, 2011 and February 28, 2010 (in thousands):
As ofFebruary 28,
2011
As ofFebruary 28,
2010
As ofFebruary 28,
2009
United States, the Company’s country of domicile . . . . . . . . . . . . . . . . . . $53,722 $51,523 $53,106Foreign . . . . . . . . . . . . . . . . . . . . . . . . . . . . . . . . . . . . . . . . . . . . . . . . . . . . 21,836 20,185 14,807
Total tangible long-lived assets . . . . . . . . . . . . . . . . . . . . . . . . . . . . . . . . . $75,558 $71,708 $67,913
NOTE 21—Unaudited Quarterly Results
Below are unaudited condensed quarterly results for the year ended February 28, 2011:
Year Ended February 28, 2011Unaudited
4thQuarter
3rdQuarter
2ndQuarter
1stQuarter
(in thousands, except per share data)
Revenue:Subscriptions . . . . . . . . . . . . . . . . . . . . . . . . . . . . . . . . . . . . . . . $209,303 $198,842 $186,183 $179,076Training and services . . . . . . . . . . . . . . . . . . . . . . . . . . . . . . . . 35,493 36,734 33,578 30,068
Total subscription and training and services revenue . . . . $244,796 $235,576 $219,761 $209,144Gross profit . . . . . . . . . . . . . . . . . . . . . . . . . . . . . . . . . . . . . . . . . . . . $203,193 $195,832 $184,059 $175,906Income from operations . . . . . . . . . . . . . . . . . . . . . . . . . . . . . . . . . . $ 39,410 $ 37,956 $ 34,071 $ 34,239Interest income . . . . . . . . . . . . . . . . . . . . . . . . . . . . . . . . . . . . . . . . . $ 1,697 $ 1,608 $ 1,775 $ 1,663Other income (expense), net . . . . . . . . . . . . . . . . . . . . . . . . . . . . . . . $ (865) $ 462 $ 548 $ 1,130Net income and diluted net income . . . . . . . . . . . . . . . . . . . . . . . . . $ 33,534 $ 26,017 $ 23,656 $ 24,071Net income per common share (1):
Basic . . . . . . . . . . . . . . . . . . . . . . . . . . . . . . . . . . . . . . . . . . . . . $ 0.17 $ 0.14 $ 0.13 $ 0.13Diluted . . . . . . . . . . . . . . . . . . . . . . . . . . . . . . . . . . . . . . . . . . . $ 0.17 $ 0.13 $ 0.12 $ 0.12
Weighted average shares outstanding:Basic . . . . . . . . . . . . . . . . . . . . . . . . . . . . . . . . . . . . . . . . . . . . . 192,996 191,296 189,027 187,926Diluted . . . . . . . . . . . . . . . . . . . . . . . . . . . . . . . . . . . . . . . . . . . 197,878 196,908 193,560 193,266
(1) Earnings per common share are computed independently for each of the quarters presented. Therefore, thesum of the quarterly per common share information may not equal the reported annual earnings per commonshare.
100
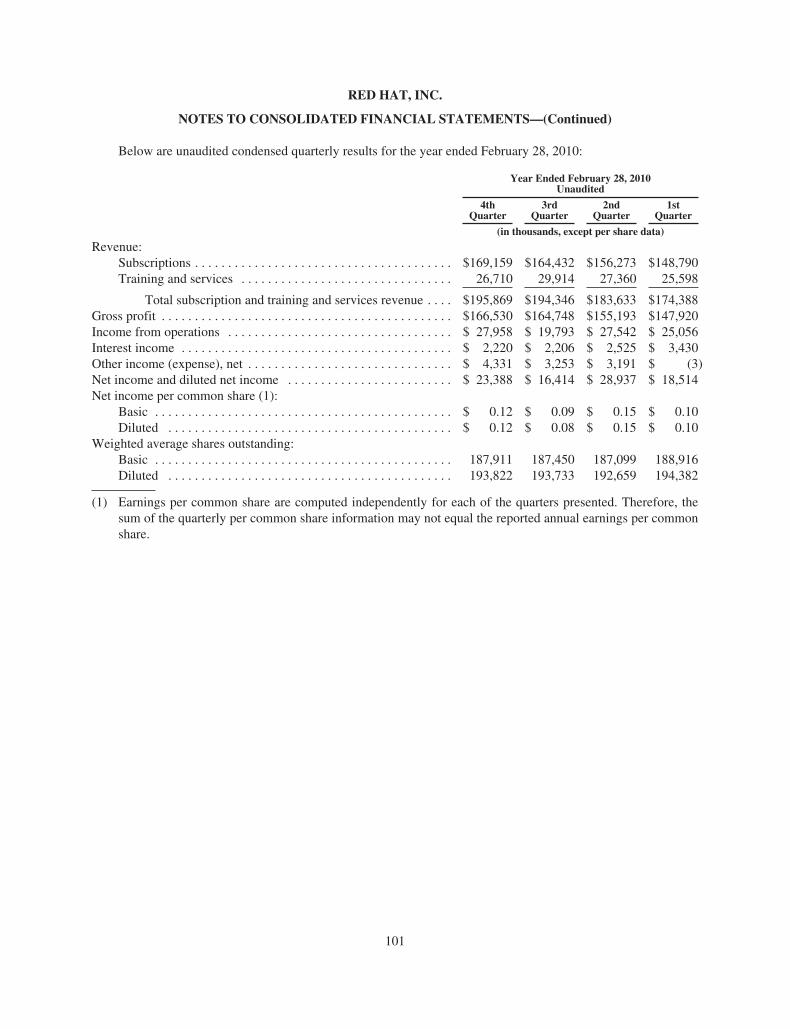
RED HAT, INC.
NOTES TO CONSOLIDATED FINANCIAL STATEMENTS—(Continued)
Below are unaudited condensed quarterly results for the year ended February 28, 2010:
Year Ended February 28, 2010Unaudited
4thQuarter
3rdQuarter
2ndQuarter
1stQuarter
(in thousands, except per share data)
Revenue:Subscriptions . . . . . . . . . . . . . . . . . . . . . . . . . . . . . . . . . . . . . . . $169,159 $164,432 $156,273 $148,790Training and services . . . . . . . . . . . . . . . . . . . . . . . . . . . . . . . . 26,710 29,914 27,360 25,598
Total subscription and training and services revenue . . . . $195,869 $194,346 $183,633 $174,388Gross profit . . . . . . . . . . . . . . . . . . . . . . . . . . . . . . . . . . . . . . . . . . . . $166,530 $164,748 $155,193 $147,920Income from operations . . . . . . . . . . . . . . . . . . . . . . . . . . . . . . . . . . $ 27,958 $ 19,793 $ 27,542 $ 25,056Interest income . . . . . . . . . . . . . . . . . . . . . . . . . . . . . . . . . . . . . . . . . $ 2,220 $ 2,206 $ 2,525 $ 3,430Other income (expense), net . . . . . . . . . . . . . . . . . . . . . . . . . . . . . . . $ 4,331 $ 3,253 $ 3,191 $ (3)Net income and diluted net income . . . . . . . . . . . . . . . . . . . . . . . . . $ 23,388 $ 16,414 $ 28,937 $ 18,514Net income per common share (1):
Basic . . . . . . . . . . . . . . . . . . . . . . . . . . . . . . . . . . . . . . . . . . . . . $ 0.12 $ 0.09 $ 0.15 $ 0.10Diluted . . . . . . . . . . . . . . . . . . . . . . . . . . . . . . . . . . . . . . . . . . . $ 0.12 $ 0.08 $ 0.15 $ 0.10
Weighted average shares outstanding:Basic . . . . . . . . . . . . . . . . . . . . . . . . . . . . . . . . . . . . . . . . . . . . . 187,911 187,450 187,099 188,916Diluted . . . . . . . . . . . . . . . . . . . . . . . . . . . . . . . . . . . . . . . . . . . 193,822 193,733 192,659 194,382
(1) Earnings per common share are computed independently for each of the quarters presented. Therefore, thesum of the quarterly per common share information may not equal the reported annual earnings per commonshare.
101
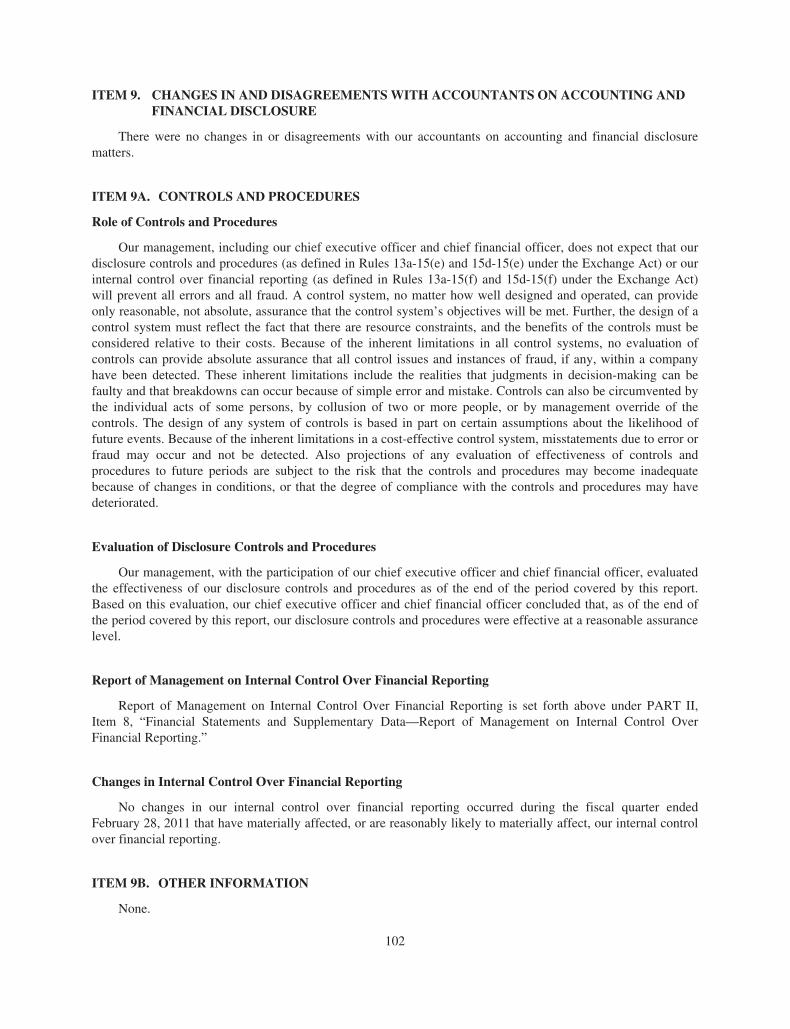
ITEM 9. CHANGES IN AND DISAGREEMENTSWITH ACCOUNTANTS ON ACCOUNTING ANDFINANCIAL DISCLOSURE
There were no changes in or disagreements with our accountants on accounting and financial disclosurematters.
ITEM 9A. CONTROLS AND PROCEDURES
Role of Controls and Procedures
Our management, including our chief executive officer and chief financial officer, does not expect that ourdisclosure controls and procedures (as defined in Rules 13a-15(e) and 15d-15(e) under the Exchange Act) or ourinternal control over financial reporting (as defined in Rules 13a-15(f) and 15d-15(f) under the Exchange Act)will prevent all errors and all fraud. A control system, no matter how well designed and operated, can provideonly reasonable, not absolute, assurance that the control system’s objectives will be met. Further, the design of acontrol system must reflect the fact that there are resource constraints, and the benefits of the controls must beconsidered relative to their costs. Because of the inherent limitations in all control systems, no evaluation ofcontrols can provide absolute assurance that all control issues and instances of fraud, if any, within a companyhave been detected. These inherent limitations include the realities that judgments in decision-making can befaulty and that breakdowns can occur because of simple error and mistake. Controls can also be circumvented bythe individual acts of some persons, by collusion of two or more people, or by management override of thecontrols. The design of any system of controls is based in part on certain assumptions about the likelihood offuture events. Because of the inherent limitations in a cost-effective control system, misstatements due to error orfraud may occur and not be detected. Also projections of any evaluation of effectiveness of controls andprocedures to future periods are subject to the risk that the controls and procedures may become inadequatebecause of changes in conditions, or that the degree of compliance with the controls and procedures may havedeteriorated.
Evaluation of Disclosure Controls and Procedures
Our management, with the participation of our chief executive officer and chief financial officer, evaluatedthe effectiveness of our disclosure controls and procedures as of the end of the period covered by this report.Based on this evaluation, our chief executive officer and chief financial officer concluded that, as of the end ofthe period covered by this report, our disclosure controls and procedures were effective at a reasonable assurancelevel.
Report of Management on Internal Control Over Financial Reporting
Report of Management on Internal Control Over Financial Reporting is set forth above under PART II,Item 8, “Financial Statements and Supplementary Data—Report of Management on Internal Control OverFinancial Reporting.”
Changes in Internal Control Over Financial Reporting
No changes in our internal control over financial reporting occurred during the fiscal quarter endedFebruary 28, 2011 that have materially affected, or are reasonably likely to materially affect, our internal controlover financial reporting.
ITEM 9B. OTHER INFORMATION
None.
102

PART III
ITEM 10. DIRECTORS, EXECUTIVE OFFICERS AND CORPORATE GOVERNANCE
We intend to file with the SEC a definitive proxy statement with respect to our Annual Meeting ofStockholders to be held on August 11, 2011 (the “2011 Annual Meeting”). The information under the sectionsentitled “Item No. 1—Election of Directors”, “Corporate Governance and Board of Directors Information”,“Compensation and Other Information Concerning Executive Officers” and “Other Matters” from the definitiveproxy statement for the 2011 Annual Meeting, which is to be filed with the SEC not later than 120 days after theclose of our fiscal year ended February 28, 2011 (the “2011 Proxy Statement”), is hereby incorporated byreference.
ITEM 11. EXECUTIVE COMPENSATION
The information under the sections entitled “Compensation and Other Information Concerning ExecutiveOfficers” and “Corporate Governance and Board of Directors Information” from the 2011 Proxy Statement ishereby incorporated by reference.
ITEM 12. SECURITY OWNERSHIP OF CERTAIN BENEFICIAL OWNERS ANDMANAGEMENTAND RELATED STOCKHOLDERMATTERS
The information under the sections entitled “Beneficial Ownership of Our Common Stock” and“Compensation and Other Information Concerning Executive Officers” from the 2011 Proxy Statement is herebyincorporated by reference.
ITEM 13. CERTAIN RELATIONSHIPS AND RELATED TRANSACTIONS, AND DIRECTORINDEPENDENCE
The information under the section entitled “Corporate Governance and Board of Directors Information”from the 2011 Proxy Statement is hereby incorporated by reference.
ITEM 14. PRINCIPAL ACCOUNTANT FEES AND SERVICES
The information under the section entitled “Item No. 2—Ratification of Selection of Independent RegisteredPublic Accounting Firm” from the 2011 Proxy Statement is hereby incorporated by reference.
103

PART IV
ITEM 15. EXHIBITS, FINANCIAL STATEMENT SCHEDULES
(a) The following documents are filed as part of this Report under “Item 8—Financial Statements andSupplementary Data”:
1. Financial Statements:
Report of Independent Registered Public Accounting Firm . . . . . . . . . . . . . . . . . . . . . . . . . . . . . . . 65Consolidated Balance Sheets at February 28, 2011 and February 28, 2010 . . . . . . . . . . . . . . . . . . . 66Consolidated Statements of Operations for the years ended February 28, 2011, February 28, 2010and February 28, 2009 . . . . . . . . . . . . . . . . . . . . . . . . . . . . . . . . . . . . . . . . . . . . . . . . . . . . . . . . . . 67
Consolidated Statements of Stockholders’ Equity and Comprehensive Income for the yearsended February 28, 2011, February 28, 2010 and February 28, 2009 . . . . . . . . . . . . . . . . . . . . . 68
Consolidated Statements of Cash Flows for the years ended February 28, 2011, February 28,2010 and February 28, 2009 . . . . . . . . . . . . . . . . . . . . . . . . . . . . . . . . . . . . . . . . . . . . . . . . . . . . . 69
Notes to Consolidated Financial Statements . . . . . . . . . . . . . . . . . . . . . . . . . . . . . . . . . . . . . . . . . . . 70
2. Financial Statement Schedules:
All other schedules for which provision is made in the applicable accounting regulations of the Securitiesand Exchange Commission are not required under the related instructions or are inapplicable and therefore havebeen omitted.
3. List of Exhibits:
Exhibit No. Description of Exhibits
3.1+ Third Amended and Restated Certificate of Incorporation, as amended, of the registrant(incorporated by reference to Exhibit 3.1 to the registrant’s Quarterly Report filed on Form10-Q with the SEC on July 10, 2007 (File no. 001-33162))
3.2+ Amended and Restated By-Laws of the registrant dated April 21, 2010 (incorporated by referenceto Exhibit 3.1 to the registrant’s Current Report on Form 8-K filed with the SEC on April 26,2010 (File no. 001-33162))
4.1+ Specimen certificate representing the common stock of the registrant (incorporated by reference toExhibit 4.1 to the registrant’s Registration Statement on Form S-1/A filed with the SEC onJuly 19, 1999 (File no. 333-94775))
4.2+ See Exhibits 3.1 and 3.2 for provisions of the Certificate of Incorporation and By-Laws of theregistrant defining the rights of holders of common stock of the registrant
4.3+ First Amended and Restated Investor Rights Agreement by and among the registrant and theInvestors and Founders listed therein, dated as of February 25, 1999, as amended (incorporatedby reference to Exhibit 10.7 to the registrant’s Registration Statement on Form S-1 filed withthe SEC on June 4, 1999 (File no. 333-80051))
10.1+* Red Hat, Inc. 1998 Stock Option Plan, as amended (incorporated by reference to Exhibit 10.1 tothe registrant’s Registration Statement on Form S-1 filed with the SEC on June 4, 1999(File no. 333-80051))
10.2+* Red Hat, Inc. 1999 Employee Stock Purchase Plan (incorporated by reference to Exhibit 10.3 tothe registrant’s Registration Statement on Form S-1 filed with the SEC on June 4, 1999(File no. 333-80051))
104

Exhibit No. Description of Exhibits
10.3+ GNU General Public License (incorporated by reference to Exhibit 10.13 to the registrant’sRegistration Statement on Form S-1 filed with the SEC on June 4, 1999 ((File no. 333-80051))
10.4+* Red Hat, Inc. 1999 Stock Option and Incentive Plan, as Amended and Restated August 2, 2001(incorporated by reference to Exhibit 10.4 to the registrant’s Quarterly Report on Form 10-Qfiled with the SEC on October 10, 2008 (File no. 001-33162))
10.5* Form of Long Term Incentive Plan Non-Qualified Stock Option Agreement for Directors pursuantto the Red Hat, Inc. 2004 Long-Term Incentive Plan, as Amended and Restated
10.6* Form of Long Term Incentive Plan Restricted Stock Agreement pursuant to the Red Hat, Inc. 2004Long-Term Incentive Plan, as Amended and Restated
10.7* Form of Non-Qualified Stock Option Agreement pursuant to Red Hat, Inc. 1999 Stock Option andIncentive Plan, as amended
10.8* Form of Incentive Plan and Stock Option Agreement pursuant to Red Hat, Inc. 1999 Stock Optionand Incentive Plan, as amended
10.9- Limited Liability Company Agreement of Open Inventions Network dated November 8, 2005
10.10* Form of Long-Term Incentive Plan Restricted Stock Agreement pursuant to the Red Hat, Inc.2004 Long-Term Incentive Plan, as Amended and Restated
10.11+* 2006 Performance Compensation Plan (incorporated by reference to Exhibit 10.1 to theregistrant’s Current Report filed on Form 8-K with the SEC on August 23, 2006(File no. 000-26281))
10.12+* Red Hat, Inc. 2004 Long-Term Incentive Plan, as Amended and Restated (incorporated byreference to Exhibit 10.1 to the registrant’s Quarterly Report on Form 10-Q filed with the SECon October 10, 2008 (File no. 001-33162))
10.13+* Form of Indemnification Agreement (incorporated by reference to Exhibit 10.1 to the registrant’sCurrent Report filed on Form 8-K with the SEC on February 28, 2007 (File No. 001-33162))
10.14+* Form of Restricted Stock Award Agreement pursuant to the Red Hat, Inc. 2004 Long-TermIncentive Plan, as Amended and Restated (incorporated by reference to Exhibit 10.2 to theregistrant’s Current Report filed on Form 8-K with the SEC on February 28, 2007(File No. 001-33162))
10.15+* Form of Non-Qualified Stock Option Agreement for Executive Employees pursuant to the RedHat, Inc. 2004 Long-Term Incentive Plan, as Amended and Restated (incorporated by referenceto Exhibit 10.3 to the registrant’s Current Report filed on Form 8-K with the SEC onFebruary 28, 2007 (File No. 001-33162))
10.16+* Form of Amendment to Equity Awards of Executive pursuant to the Red Hat, Inc. 2004 Long-Term Incentive Plan, as Amended and Restated (incorporated by reference to Exhibit 10.4 to theregistrant’s Current Report filed on Form 8-K with the SEC on February 28, 2007(File No. 001-33162))
10.17+* Senior Management Change in Control Severance Policy (incorporated by reference to Exhibit10.5 to the registrant’s Current Report filed on Form 8-K with the SEC on February 28, 2007(File No. 001-33162))
105

Exhibit No. Description of Exhibits
10.18+* Executive Variable Compensation Plan (incorporated by reference to Exhibit 99.1 to theregistrant’s Current Report filed on Form 8-K with the SEC on May 16, 2007(File No. 001-33162))
10.19+* Form of Restricted Stock Unit Agreement pursuant to the Red Hat, Inc. 2004 Long-TermIncentive Plan, as Amended and Restated (Non-Executive, U.S. Participants) (incorporated byreference to Exhibit 10.1 to the registrant’s Quarterly Report filed on Form 10-Q with the SECon October 10, 2007 (File No. 001-33162))
10.20+* Form of Restricted Stock Unit Agreement pursuant to the Red Hat, Inc. 2004 Long-TermIncentive Plan, as Amended and Restated (Non-Executive, Non U.S. Participants) (incorporatedby reference to Exhibit 10.2 to the registrant’s Quarterly Report filed on Form 10-Q with theSEC on October 10, 2007 (File No. 001-33162))
10.21+* Form of Performance Share Unit Agreement pursuant to the Red Hat, Inc. 2004 Long-TermIncentive Plan pursuant to the Red Hat, Inc. 2004 Long-Term Incentive Plan, as Amended andRestated (incorporated by reference to Exhibit 10.1 to the registrant’s Current Report filed onForm 8-K with the SEC on October 15, 2007 (File No. 001-33162))
10.22+* Executive Employment Agreement, dated December 19, 2007, between Red Hat, Inc. andJames M. Whitehurst (incorporated by reference to Exhibit 10.5 to the registrant’s QuarterlyReport filed on Form 10-Q with the SEC on January 9, 2008 (File No. 001-33162))
10.23+* Form of Amendment to Performance Share Unit Agreement pursuant to the Red Hat, Inc. 2004Long-Term Incentive Plan, as Amended and Restated (incorporated by reference to Exhibit10.38 to the registrant’s Annual Report filed on Form 10-K with the SEC on April 29, 2008(File No. 001-33162))
10.24+* Form of Director Deferred Stock Unit Agreement pursuant to the Red Hat, Inc. 2004 Long-TermIncentive Plan, as Amended and Restated (incorporated by reference to Exhibit 10.39 to theregistrant’s Annual Report filed on Form 10-K with the SEC on April 29, 2008(File No. 001-33162))
10.25+* 2008 Independent Director Compensation Plan (incorporated by reference to Exhibit 10.42 to theregistrant’s Annual Report filed on Form 10-K with the SEC on April 29, 2008(File No. 001-33162))
10.26+* Form of Performance Share Unit Agreement adopted May 2008 pursuant to the Red Hat, Inc. 2004Long-Term Incentive Plan, as Amended and Restated (incorporated by reference to Exhibit 99.1to the registrant’s Current Report filed on Form 8-K with the SEC on May 23, 2008(File No. 001-33162))
10.27+* Form of Director Deferred Stock Unit Agreement (Vested) pursuant to the Red Hat, Inc. 2004Long-Term Incentive Plan, as Amended and Restated (incorporated by reference to Exhibit 10.2to the registrant’s Quarterly Report filed on Form 10-Q with the SEC on July 10, 2008(File No. 001-33162))
10.28+* Form of Director Deferred Stock Unit Agreement (With Vesting) pursuant to the Red Hat, Inc.2004 Long-Term Incentive Plan, as Amended and Restated (incorporated by reference toExhibit 10.3 to the registrant’s Quarterly Report filed on Form 10-Q with the SEC on July 10,2008 (File No. 001-33162))
10.29+* Form of Director Restricted Stock Unit Agreement pursuant to the Red Hat, Inc. 2004 Long-TermIncentive Plan, as Amended and Restated (incorporated by reference to Exhibit 10.4 to theregistrant’s Quarterly Report filed on Form 10-Q with the SEC on July 10, 2008(File No. 001-33162))
106

Exhibit No. Description of Exhibits
10.30+* Senior Management Severance Plan (incorporated by reference to Exhibit 10.1 to the registrant’sCurrent Report filed on Form 8-K with the SEC on December 29, 2008 (File No. 001-33162))
10.31+* Form of Executive Agreement by and between Red Hat, Inc. and each Plan Participant(incorporated by reference to Exhibit 10.2 to the registrant’s Current Report filed on Form 8-Kwith the SEC on December 29, 2008 (File No. 001-33162))
10.32+* Form of Amendment to Equity Awards with Independent Directors (incorporated by reference toExhibit 10.1 to the registrant’s Quarterly Report filed on Form 10-Q with the SEC on January 9,2009 (File No. 001-33162))
10.33+* Letter Agreement dated December 23, 2008 between Red Hat, Inc. and James M. Whitehurstamending the Executive Employment Agreement between the parties dated December 19, 2007(incorporated by reference to Exhibit 10.4 to the registrant’s Quarterly Report filed onForm 10-Q with the SEC on January 9, 2009 (File No. 001-33162))
10.34+* Employee Inventions Assignment Agreement and Restrictive Obligations Agreement datedJanuary 1, 2008 between Red Hat, Inc. and James M. Whitehurst (incorporated by reference toExhibit 10.5 to the registrant’s Quarterly Report filed on Form 10-Q with the SEC on January 9,2009 (File No. 001-33162))
10.35+* Executive Base Salaries and Target Award Amounts under Red Hat, Inc.’s Executive VariableCompensation Plan for the Fiscal Year Ending February 28, 2010 (incorporated by reference toExhibit 99.1 to registrant’s Current Report filed on Form 8-K with the SEC on May 19, 2009(File No. 001-33162))
10.36+* Form of Performance Share Unit Agreement adopted May 13, 2009 (incorporated by reference toExhibit 99.2 to the registrant’s Current Report filed on Form 8-K with the SEC on May 19,2009 (File No. 001-33162))
10.37+* Clawback Policy of Red Hat, Inc. adopted May 13, 2009 (incorporated by reference to Exhibit99.3 to the registrant’s Current Report filed on Form 8-K with the SEC on May 19, 2009(File No. 001-33162))
10.38+* Form of Performance Share Unit Agreement (Fiscal Year 2010-SPP Form) adopted June 23, 2009(incorporated by reference to Exhibit 99.1 to the registrant’s Current Report filed on Form 8-Kwith the SEC on June 29, 2009 (File No. 001-33162))
10.39+* Target Share Price Performance Units awarded to named executive officers on June 23, 2009(incorporated by reference to Exhibit 99.2 to registrant’s Current Report filed on Form 8-K withthe SEC on June 29, 2009 (File No. 001-33162))
10.40+* Performance Compensation Plan as Amended and Restated Effective June 19, 2008 (incorporatedby reference to Exhibit 10.1 to the registrant’s Quarterly Report filed on Form 10-Q with theSEC on July 10, 2009 (File No. 001-33162))
10.41+* Red Hat, Inc. 2010 Non-Employee Director Compensation Plan effective January 1, 2010(incorporated by reference to Exhibit 10.1 to the registrant’s Quarterly Report filed onForm 10-Q with the SEC on October 5, 2009 (File No. 001-33162))
10.42+* Red Hat, Inc. Stock Ownership Policy for Directors and Senior Executives, amended and restatedas of March 21, 2011 (incorporated by reference to Exhibit 99.1 to the registrant’s CurrentReport filed on Form 8-K with the SEC on March 25, 2011 (File No. 001-33162))
10.43+* Red Hat, Inc. 2010 Non-Employee Director Compensation Plan amended and restated effectiveMarch 1, 2010 (incorporated by reference to Exhibit 10.59 to the registrant’s Annual Reportfiled on Form 10-K with the SEC on April 29, 2010 (File No. 001-33162))
107

Exhibit No. Description of Exhibits
10.44+* Form of Performance Share Unit Agreement (Fiscal Year 2011 Operating Performance Form)adopted May 19, 2010 (incorporated by reference to Exhibit 99.2 to the registrant’s CurrentReport filed on Form 8-K with the SEC on May 25, 2010 (File No. 001-33162))
10.45+* Form of Performance Share Unit Agreement (Fiscal Year 2011 Share Price Performance Form)adopted May 19, 2010 (incorporated by reference to Exhibit 99.3 to the registrant’s CurrentReport on Form 8-K filed with the SEC on May 25, 2010 (File No. 001-33162))
10.46+* Form of Performance Restricted Stock Agreement adopted May 19, 2010 (incorporated byreference to Exhibit 99.4 to the registrant’s Current Report on Form 8-K filed with the SEC onMay 25, 2010 (File No. 001-33162))
10.47+* Form of Restricted Stock Unit Agreement (Non-executive) pursuant to the Red Hat, Inc. 2004Long-Term Incentive Plan, as Amended and Restated, adopted August 11, 2010 (incorporatedby reference to Exhibit 10.1 to the registrant’s Quarterly Report filed on Form 10-Q with theSEC on October 8, 2010 (File No. 001-33162))
10.48+* Executive Base Salaries and Target Award Amounts under Red Hat, Inc.’s Executive VariableCompensation Plan for the Fiscal Year Ending February 28, 2011 (incorporated by reference toExhibit 99.1 to the registrant’s Current Report on Form 8-K filed with the SEC on May 25,2010 (File No. 001-33162))
21.1 Subsidiaries of Red Hat, Inc.
23.1 Consent of PricewaterhouseCoopers LLP
31.1 Certification of the registrant’s Chief Executive Officer pursuant to Rule 13a-14(a)/Rule15(d)-14(a) under the Securities Exchange Act of 1934, as amended, as adopted pursuant toSection 302 of the Sarbanes-Oxley Act of 2002
31.2 Certification of the registrant’s Chief Financial Officer pursuant to Rule 13a-14(a)/Rule15(d)-14(a) under the Securities Exchange Act of 1934, as amended, as adopted pursuant toSection 302 of the Sarbanes-Oxley Act of 2002
32.1 Certification of the registrant’s principal executive officer and principal financial officer pursuantto 18 U.S.C. Section 1350
101.INS XBRL Instance Document
101.SCH XBRL Taxonomy Extension Schema
101.CAL XBRL Taxonomy Extension Calculation Linkbase
101.DEF XBRL Taxonomy Extension Definition Linkbase
101.LAB XBRL Taxonomy Extension Label Linkbase
101.PRE XBRL Taxonomy Extension Presentation Linkbase
* Indicates a management contract or compensatory plan, contract or arrangement.+ Previously filed.- Indicates confidential treatment requested as to certain portions of this exhibit which have been filed
separately with the SEC.
108

SIGNATURES
Pursuant to the requirements of Section 13 or 15(d) of the Securities Exchange Act of 1934, the registranthas duly caused this report to be signed on its behalf by the undersigned, thereunto duly authorized.
RED HAT, INC.
By: /S/ JAMES M. WHITEHURST
James M. WhitehurstPresident and Chief Executive Officer
Date: April 29, 2011
Pursuant to the requirements of the Securities Exchange Act of 1934, this report has been signed below bythe following persons on behalf of the registrant and in the capacities and on the dates indicated.
Signature Title Date
/S/ JAMES M. WHITEHURST
James M. Whitehurst
President, Chief Executive Officer andDirector (principal executive officer)
April 29, 2011
/S/ CHARLES E. PETERS, JR.Charles E. Peters, Jr.
Executive Vice President and ChiefFinancial Officer (principal financialofficer)
April 29, 2011
/S/ MARK E. COOK
Mark E. Cook
Vice President Finance and Controller(principal accounting officer)
April 29, 2011
/S/ SOHAIB ABBASI
Sohaib Abbasi
Director April 29, 2011
/S/ W. STEVE ALBRECHT
W. Steve Albrecht
Director April 29, 2011
/S/ MICHELINE CHAU
Micheline Chau
Director April 29, 2011
/S/ JEFFREY J. CLARKE
Jeffrey J. Clarke
Director April 29, 2011
/S/ MARYE ANNE FOXMarye Anne Fox
Director April 29, 2011
/S/ NARENDRA K. GUPTA
Narendra K. Gupta
Director April 29, 2011
/S/ WILLIAM S. KAISER
William S. Kaiser
Director April 29, 2011
/S/ DONALD H. LIVINGSTONEDonald H. Livingstone
Director April 29, 2011
/S/ HENRY HUGH SHELTONHenry Hugh Shelton
Chairman of the Board of Directors April 29, 2011
109

EXHIBIT 31.1
CERTIFICATION OF JAMES M. WHITEHURST, PRESIDENT ANDCHIEF EXECUTIVE OFFICER, PURSUANT TO RULE 13a-14(a)/RULE 15d-14(a)
UNDER THE SECURITIES EXCHANGE ACT OF 1934, AS AMENDED
I, James M. Whitehurst, certify that:
1. I have reviewed this Annual Report on Form 10-K of Red Hat, Inc.;
2. Based on my knowledge, this report does not contain any untrue statement of a material fact or omit tostate a material fact necessary to make the statements made, in light of the circumstances under which suchstatements were made, not misleading with respect to the period covered by this report;
3. Based on my knowledge, the financial statements, and other financial information included in this report,fairly present in all material respects the financial condition, results of operations and cash flows of the registrantas of, and for, the periods presented in this report;
4. The registrant’s other certifying officer and I are responsible for establishing and maintaining disclosurecontrols and procedures (as defined in Exchange Act Rules 13a-15(e) and 15d-15(e)) and internal control overfinancial reporting (as defined in Exchange Act Rules 13a-15(f) and 15d-15(f)) for the registrant and have:
a) Designed such disclosure controls and procedures, or caused such disclosure controls and proceduresto be designed under our supervision, to ensure that material information relating to the registrant, includingits consolidated subsidiaries, is made known to us by others within those entities, particularly during theperiod in which this report is being prepared;
b) Designed such internal control over financial reporting, or caused such internal control overfinancial reporting to be designed under our supervision, to provide reasonable assurance regarding thereliability of financial reporting and the preparation of financial statements for external purposes inaccordance with generally accepted accounting principles;
c) Evaluated the effectiveness of the registrant’s disclosure controls and procedures and presented inthis report our conclusions about the effectiveness of the disclosure controls and procedures, as of the end ofthe period covered by this report based on such evaluation; and
d) Disclosed in this report any change in the registrant’s internal control over financial reporting thatoccurred during the registrant’s most recent fiscal quarter (the registrant’s fourth fiscal quarter in the case ofan annual report) that has materially affected, or is reasonably likely to materially affect, the registrant’sinternal control over financial reporting; and
5. The registrant’s other certifying officer and I have disclosed, based on our most recent evaluation ofinternal control over financial reporting, to the registrant’s auditors and the audit committee of the registrant’sboard of directors (or persons performing the equivalent functions):
a) All significant deficiencies and material weaknesses in the design or operation of internal controlover financial reporting which are reasonably likely to adversely affect the registrant’s ability to record,process, summarize and report financial information; and
b) Any fraud, whether or not material, that involves management or other employees who have asignificant role in the registrant’s internal control over financial reporting.
Date: April 29, 2011
By: /S/ JAMES M. WHITEHURST
James M. WhitehurstPresident and Chief Executive Officer
(Principal Executive Officer)

EXHIBIT 31.2
CERTIFICATION OF CHARLES E. PETERS, JR., EXECUTIVE VICE PRESIDENT ANDCHIEF FINANCIAL OFFICER, PURSUANT TO RULE 13a-14(a)/RULE 15d-14(a)
UNDER THE SECURITIES EXCHANGE ACT OF 1934, AS AMENDED
I, Charles E. Peters, Jr., certify that:
1. I have reviewed this Annual Report on Form 10-K of Red Hat, Inc.;
2. Based on my knowledge, this report does not contain any untrue statement of a material fact or omit tostate a material fact necessary to make the statements made, in light of the circumstances under which suchstatements were made, not misleading with respect to the period covered by this report;
3. Based on my knowledge, the financial statements, and other financial information included in this report,fairly present in all material respects the financial condition, results of operations and cash flows of the registrantas of, and for, the periods presented in this report;
4. The registrant’s other certifying officer and I are responsible for establishing and maintaining disclosurecontrols and procedures (as defined in Exchange Act Rules 13a-15(e) and 15d-15(e)) and internal control overfinancial reporting (as defined in Exchange Act Rules 13a-15(f) and 15d-15(f)) for the registrant and have:
a) Designed such disclosure controls and procedures, or caused such disclosure controls and proceduresto be designed under our supervision, to ensure that material information relating to the registrant, includingits consolidated subsidiaries, is made known to us by others within those entities, particularly during theperiod in which this report is being prepared;
b) Designed such internal control over financial reporting, or caused such internal control overfinancial reporting to be designed under our supervision, to provide reasonable assurance regarding thereliability of financial reporting and the preparation of financial statements for external purposes inaccordance with generally accepted accounting principles;
c) Evaluated the effectiveness of the registrant’s disclosure controls and procedures and presented inthis report our conclusions about the effectiveness of the disclosure controls and procedures, as of the end ofthe period covered by this report based on such evaluation; and
d) Disclosed in this report any change in the registrant’s internal control over financial reporting thatoccurred during the registrant’s most recent fiscal quarter (the registrant’s fourth fiscal quarter in the case ofan annual report) that has materially affected, or is reasonably likely to materially affect, the registrant’sinternal control over financial reporting; and
5. The registrant’s other certifying officer and I have disclosed, based on our most recent evaluation ofinternal control over financial reporting, to the registrant’s auditors and the audit committee of the registrant’sboard of directors (or persons performing the equivalent functions):
a) All significant deficiencies and material weaknesses in the design or operation of internal controlover financial reporting which are reasonably likely to adversely affect the registrant’s ability to record,process, summarize and report financial information; and
b) Any fraud, whether or not material, that involves management or other employees who have asignificant role in the registrant’s internal control over financial reporting.
Date: April 29, 2011
By: /S/ CHARLES E. PETERS, JR.Charles E. Peters, Jr.
Executive Vice President and Chief Financial Officer(Principal Financial Officer)

EXHIBIT 32.1
CERTIFICATIONS OF JAMES M. WHITEHURST, PRESIDENT AND CHIEF EXECUTIVEOFFICER, AND CHARLES E. PETERS, JR., EXECUTIVE VICE PRESIDENT AND
CHIEF FINANCIAL OFFICER, PURSUANT TO 18 U.S.C. SECTION 1350, AS ADOPTEDPURSUANT TO SECTION 906 OF THE SARBANES-OXLEY ACT OF 2002
Each of the undersigned hereby certifies, for the purposes of section 1350 of chapter 63 of title 18 of theUnited States Code, as adopted pursuant to Section 906 of the Sarbanes-Oxley Act of 2002, in his capacity as anofficer of Red Hat, Inc. (“Red Hat”), that, to his knowledge, the Annual Report of Red Hat on Form 10-K for theyear ended February 28, 2011 (the “Report”), as filed with the Securities and Exchange Commission, fullycomplies with the requirements of Section13(a) of the Securities and Exchange Act of 1934 and that theinformation contained in the Report fairly presents, in all material respects, the financial condition and results ofoperations of Red Hat.
Date: April 29, 2011
By: /S/ JAMES M. WHITEHURST
James M. WhitehurstPresident and Chief Executive Officer
(Principal Executive Officer)
Date: April 29, 2011
By: /S/ CHARLES E. PETERS, JR.Charles E. Peters, Jr.
Executive Vice President and Chief Financial Officer(Principal Financial Officer)

