6 prime movers of energy - iac.university
TRANSCRIPT

PRIME MOVERS OF ENERGY: PUMPS
Modern Industrial Assessments 171
6 PRIME MOVERS OF ENERGY
6.1. PUMPS
Pumps are widely used for transfer of liquids from one place to another. Pumps are usually driven by electric motors, thus some of the considerations about pumps and electric motors might overlap. For some specific applications, pumps can be driven by compressed air or hydraulically. There are a lot of different types of pumps used in the industry. Pump selection depends upon the application. For example, centrifugal pumps are used predominantly for transfer of large volumes, metering pumps are used for precise delivery of liquids, ensuring constant discharge regardless of back pressure in the lines, and progressive cavity pumps or peristaltic pumps are used for delivery of very viscous materials. It is a norm that a pump manufacturer also provides pump curves at the time of the sale. They are essential for establishing the operation range and if any changes for pumping systems are considered the curves have to be looked at. 6.1.1. Operation
Opportunities for savings in pump operation are often overlooked because pump inefficiency is not readily apparent. The following measures can improve pump efficiency: 1. Shut down unnecessary pumps. 2. Restore internal clearances if performance has changed significantly. 3. Trim or change impellers if head is larger than necessary. 4. Control by throttle instead of running wide open or bypassing the flow. 5. Replace oversized pumps. 6. Use multiple pumps instead of one large pump. 7. Use a small booster pump. 8. Change the speed of the pump for the most efficient match of horsepower requirements with output. Pumps can run inefficiently because: 1. Present operating conditions differ from the design conditions. This change often occurs after a
plant has undertaken a water conservation program. 2. Oversized pumps were specified and installed to allow for future increases in capacity. 3. Conservative design factors were used to ensure the pump would meet the required conditions. 4. Other design factors were chosen at the expense of pump efficiency when energy costs were lower.

PRIME MOVERS OF ENERGY: PUMPS
Modern Industrial Assessments 172
Pump Survey
A survey of pumps should concentrate on the following conditions associated with inefficient pump operation. These are discussed in order of decreasing potential for energy savings in existing installations. For the survey to produce worthwhile savings, only pumps above a certain size, such as 25 horsepower, need be checked. 1. Excessive pump maintenance. This problem is often associated with: a) Oversized pumps that are heavily throttled. b) Pumps in cavitation. c) Badly worn pumps. d) Pumps that are misapplied for the present operation. 2. Any pump system with large flow or pressure variations. When normal flows or pressures are less
than 75 percent of their maximum, energy is probably being wasted from excessive throttling, large bypassed flows, or operation of unneeded pumps.
3. Bypassed flow. Bypassed flow, either from a control system or deadhead protection orifices, is wasted energy.
4. Throttled control valves. The pressure drop across a control valve represents waster energy, which is proportional to the pressure drop and flow.
5. Fixed throttle operation. Pumps throttle at a constant head and flow indicate excess capacity. 6. Noisy pumps or valves. A noisy pump generally indicates cavitation from heavy throttling or excess
flow. Noisy control valves or bypass valves usually mean a high pressure drop with a corresponding high energy loss.
7. A multiple pump system. Energy is commonly lost from bypassing excess capacity, running unneeded pumps, maintaining excess pressure, or having a large flow increment between pumps.
8. Changes from design conditions. Changes in plant operating conditions (expansions, shutdowns, etc.) can cause pumps that were previously well applied to operate at reduced efficiency.
9. A low-flow, high-pressure user. Such users may require operation of the entire system at higher pressure.
10. Pumps with known overcapacity. Overcapacity wastes energy because more flow is pumped at a higher pressure than required.
Once the inefficient pumps have been identified, the potential savings and the cost of
implementing the changes should be analyzed. Comparison of the actual operating point with the pump performance curve will facilitate the analysis. Actual performance may differ from the original design because of process changes, faulty basic data, conservative safety margins, or planned expansions never realized.
Energy Conservation Measures
Energy may be saved in pump operation in a number of ways, including the following techniques arranged in approximate increasing order of investment cost.

PRIME MOVERS OF ENERGY: PUMPS
Modern Industrial Assessments 173
1. Shut Down Unnecessary Pumps This obvious but frequently overlooked energy-saving measure can often be carried out after a significant reduction in the plant’s water usage. If excess capacity is used because flow requirements vary, the number of pumps in service can be automatically controlled by installing pressure switches on one or more pumps. 2. Restore Internal Clearances This measure should be taken if performance changes significantly. Pump capacity and efficiency are reduced as internal leakage increases from excessive backplate and impeller clearances and worn throat bushings, impeller wear rings, sleeve bearings, and impellers. 3. Trim or Change Impellers If head is excessive, this approach can be used when throttling is not sufficient to permit the complete shutdown of a pump. Trimming centrifugal pump impellers is the lowest cost method to correct oversized pumps. Head can be reduced 10 to 50 percent by trimming or changing the pump impeller diameter within the vendor’s recommended size limits for the pump casing. 4. Control by Throttling Controlling a centrifugal pump by throttling the pump discharge wastes energy. Throttle control is, however, generally less energy wasteful than two other widely used alternatives: no control and bypass control. Throttles can, therefore, represent a means to save pump energy. 5. Replace Oversized Pumps Oversized pumps represent the largest single source of wasted pump energy. Their replacement must be evaluated in relation to other possible methods to reduce capacity, such as trimming or changing impellers and using variable speed control. 6. Use Multiple Pumps Multiple pumps offer an alternative to variable speed, bypass, or throttle control. The savings result because one or more pumps can be shut down at low system flow while the other pumps operate at high efficiency. Multiple small pumps should be considered when the pumping load is less than half the maximum single capacity. 7. Use a Small Booster Pump

PRIME MOVERS OF ENERGY: PUMPS
Modern Industrial Assessments 174
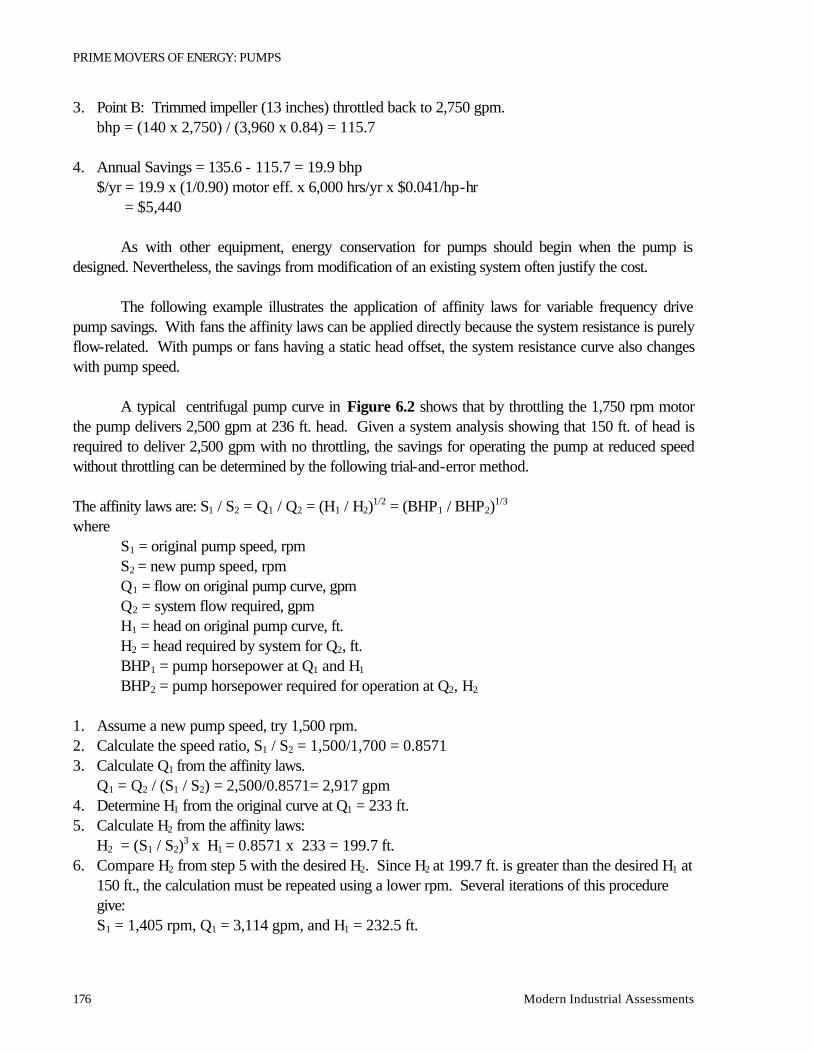
The energy requirements of the overall system can be reduced by the use of a booster pump to provide the high-pressure flow to a selected user and allow the remainder of the system to operate at a lower pressure and reduced power. 8. Change Pump Speed Variable-speed drives yield the maximum savings in matching pump output to varying system requirements. However, variable speed drives generally have a higher investment cost than other methods of capacity control. Several types of variable-speed drives can be considered: • Variable-speed motors, either variable frequency or DC. • Variable-speed drives such as traction drives, for constant-speed motors. • Two-speed motors when low speed can satisfy the requirements for significant portion of the time. As an example of the savings from the use of a smaller pump, assume 300 tons of refrigeration is required during the summer months but only 75 tons for the remaining nine months. One of two 700-gpm chilled-water pumps, equipped with 40-horsepower motors, is operated during the winter, with two thirds of the flow bypassed. A new 250-gpm pump designed for the same discharge head as the original two units consumes only 10 horsepower. The electric savings from operating the small pump during the winter is: Annual Savings = (40 hp - 10 hp) x 6,000 hrs/yr x 9 mos/12 x $0.041/hp-hr = $5,540 The installation cost of a new pump is about $5,000. The following example illustrates the possible savings from trimming an impeller. A double suction centrifugal pump with a 13.75-inch diameter impeller pumps process water. The demand is constant, 2,750 gpm, and the pump is controlled by a manual throttle valve. The pump operates at 164-feet head, 2,750 gpm and 135.6-brake horsepower (point A in Figure 6.1). A 16-psig (37-foot) pressure drop occurs across the partially closed throttle valve, with only a 6-foot drop across the completely open valve. If the pump were exactly matched to the system requirements, only 127 feet of head would be required without the valve. Because even the fully open valve has a 6-foot pressure drop, the minimum head required becomes 133 feet. To this, a 5 percent allowance should be added as a tolerance for the accuracy of the field measurements and impeller trimming. The minimum total head required, therefore, is 140 feet. Based on the pump affinity laws, the trimmed impeller diameter should be 13 inches, as shown in step 1 below. With a trimmed 13-inch impeller, the pump will operate slightly throttled at 140-feet head, 2,750 gpm and 115.7-brake horsepower, as shown by point B in Figure 6.1. The trimmed impeller reduces power consumption by 19.9-brake horsepower and saves $5,440 per year (see steps 2-4).

PRIME MOVERS OF ENERGY: PUMPS
Modern Industrial Assessments 175
Trimming and balancing an impeller usually cost less than $1,000, and payback, therefore, is less than three months. 1. Determine the impeller diameter to reduce head from 164 feet to 140 feet while maintaining 2,750-
gpm flow. Apply the affinity laws and note that both the head and flow are reduced as the impeller is trimmed.
.
0
40
60
80
100
120
140
160
180
200
220
500 1000 1500 2000 2500 3000 3500 4000 GPM
TO
TA
L H
EA
D
FE
ET
50
6'8'
12'14'
18' 22'
10'55 60 65 70
7875 80
80
82
82
8383
8484
78
75 HP
100 HP
125 HP
150 HP
200 HP
B
14 1/2
13 3/4
13
12 1/4
11 1/2
NPSH
A
Figure 6.1: Typical Centrifugal Pump Characteristics
a) H1 / H2 = D1
2 / D22 and Q1 / Q1 = D1 / D1 H1Q1/ H1Q1 = D1
3 / D13
b) Holding Q constant = D1 / D2 = (H1 / H2)1/3 = (164 / 140)1/3 = 1.054 c) D1 = (D2 / 1.054) = 13.0 inches
H = head in feet; H1, before the reduction, and H2, after the reduction D = diameter of the impeller in inches Q = flow in gpm E = pump efficiency
2. Point A: Oversized pump (13.75-inch impeller) throttle back to 2,750 gpm.
bhp = (H x Q x (SG)) / (3,960 x E) = (164 x 2,750) / (3,960 x 0.84) = 135.6
PRIME MOVERS OF ENERGY: PUMPS
Modern Industrial Assessments 176
3. Point B: Trimmed impeller (13 inches) throttled back to 2,750 gpm. bhp = (140 x 2,750) / (3,960 x 0.84) = 115.7
4. Annual Savings = 135.6 - 115.7 = 19.9 bhp
$/yr = 19.9 x (1/0.90) motor eff. x 6,000 hrs/yr x $0.041/hp-hr = $5,440
As with other equipment, energy conservation for pumps should begin when the pump is designed. Nevertheless, the savings from modification of an existing system often justify the cost. The following example illustrates the application of affinity laws for variable frequency drive pump savings. With fans the affinity laws can be applied directly because the system resistance is purely flow-related. With pumps or fans having a static head offset, the system resistance curve also changes with pump speed. A typical centrifugal pump curve in Figure 6.2 shows that by throttling the 1,750 rpm motor the pump delivers 2,500 gpm at 236 ft. head. Given a system analysis showing that 150 ft. of head is required to deliver 2,500 gpm with no throttling, the savings for operating the pump at reduced speed without throttling can be determined by the following trial-and-error method. The affinity laws are: S1 / S2 = Q1 / Q2 = (H1 / H2)1/2 = (BHP1 / BHP2)1/3
where S1 = original pump speed, rpm S2 = new pump speed, rpm Q1 = flow on original pump curve, gpm Q2 = system flow required, gpm H1 = head on original pump curve, ft. H2 = head required by system for Q2, ft. BHP1 = pump horsepower at Q1 and H1 BHP2 = pump horsepower required for operation at Q2, H2
1. Assume a new pump speed, try 1,500 rpm. 2. Calculate the speed ratio, S1 / S2 = 1,500/1,700 = 0.8571 3. Calculate Q1 from the affinity laws.
Q1 = Q2 / (S1 / S2) = 2,500/0.8571= 2,917 gpm 4. Determine H1 from the original curve at Q1 = 233 ft. 5. Calculate H2 from the affinity laws:
H2 = (S1 / S2)3 x H1 = 0.8571 x 233 = 199.7 ft. 6. Compare H2 from step 5 with the desired H2. Since H2 at 199.7 ft. is greater than the desired H1 at
150 ft., the calculation must be repeated using a lower rpm. Several iterations of this procedure give: S1 = 1,405 rpm, Q1 = 3,114 gpm, and H1 = 232.5 ft.

PRIME MOVERS OF ENERGY: PUMPS
Modern Industrial Assessments 177
From Q1 and H1 above a new operating point 1 is determined. The important concept here is that point 1 is not the original system operating point (2,500 gpm, 236 ft.). Rather it is the one and only point on the original pump curve that satisfies the affinity law equations at the new operating point 2 (2,500 gpm, 150 ft.). It must be determined before BHP2 can be calculated from the affinity laws.
.
250
225
200
175
150
BHP
TDH, ft.
Speed2 = ?
0 1000 2000 3000 4000 5000 6000
400
300
200
100
A
2
BHPA
10" x 18" Radial Flow Pump15 1/2" Diameter Impeller1750 RPM
Tot
al D
ynam
ic H
ead,
ft.
Flow, gpm
Pum
p B
rake
Hor
sepo
wer
Figure 6.2: Centrifugal Pump Curve
7. From the pump curve determine BHP1 for Q1 at 3,114 gpm. BHP1 = 258
8. Calculate BHP2 using affinity law BHP2 = BHP1 x (S2 / S1)3 = 258 x (1,405/1,750)3 = 258 x 0.5175 = 133.5 BHP
9. From the pump curve determine the actual BHP (BHPA) for the original operating point at 2,500 gpm. BHPA = 230 BHP
10. Determine reduction in horsepower: BHP savings = 230 - 133.5 = 96.5 BHP Note the savings are not found from BHP1 - BHP2, but BHPA - BHP2
Manual calculation of savings for variable speed drives will be tedious if they must be determined for a number of conditions. Computer programs can simplify the task.

PRIME MOVERS OF ENERGY: PUMPS
Modern Industrial Assessments 178
Flow (gpm)
Pump Curve, Speed 1
Pump Curve, Speed 2
SystemCurve
OperatingPoints
Tot
al H
ead
(ft)
Figure 6.3: Typical Pump and System Curves, Driven by Adjustable Speed Drive
Flow (gpm)
Tot
al H
ead
(ft)
Pump Curve
System CurveThrottled System Curve
Open
Operating Points
Figure 6.4: Typical Pump and System Curves for Pump with Throttling Valve

PRIME MOVERS OF ENERGY: PUMPS
Modern Industrial Assessments 179
40% 60% 80% 100%
Flow (%)
5
10
15
20
25
Inpu
t Pow
er (h
p)
PowerSavings
AdjustableSpeedMethod
ThrottlingMethod
Figure 6.5: Pump Power Requirements for Throttling and Adjustable Speed Motors
6.1.2. Considerations for Installation Design
The position of the pump with respect to the reservoir from which the liquid is to be taken is of utmost importance. If the pump is higher than the tank from which the fluid is being pumped the boiling of the fluid at local temperature can occur. The formation of the bubbles is called cavitation. The bubble collapse can happen at the higher pressure region (tips of the impeller), thus causing “cavitation erosion”. The efficiency of the pump is very low and the damage of the impeller will follow soon. The fatigue failure is the problem. In order to avoid cavitation in the pump, the installation has to satisfy a condition of net positive suction head (NPSH). The manufacturer of the pump supplies the net positive suction head required and that is the minimum pressure head at the inlet for the type and model of the

PRIME MOVERS OF ENERGY: FANS
Modern Industrial Assessments 180
pump which has to be maintained in order to avoid cavitation inside the pump. The net positive suction head required accounts for pressure drop inside the pump. The pressure head at the inlet has to be calculated for each installation. The conventional tools for pressure losses in pipes are commonly used and adequate. Since the occurrence of bubble forming inside the housing of the pump is absolutely forbidden the backpressure of the system is of the same importance as NPSH. The adequate backpressure will prevent the formation and can be achieved, if not available by the nature of the system, by installation of backpressure valve. OPERATING SITUATION
HOURS OF OPERATION
AVERAGE kW USAGE
PROPELLER FAN ENERGY [kWh]
BLOWER FAN ENERGY [kWh]
Constant Operation at Full Capacity
1202.2 P = 16.2 B = 32.4
19475.6 38951.2
Single Speed Fan Cycling
P = 765.3 (*) B = 852.7
P = 16.2 B = 32.4
12397.9 27627.5
Two Speed Fan Cycling
P = 1132 (*) B = 1146
P = 4.3 B = 8.55
4867.6 9798.3
Variable Control at Constant Speed
1202.2 P = 2.72 B = 5.44
3270 6540
Variable Speed Control
1202.2 P = 1.99 B = 3.98
2392.4 4704.8
(*) The propeller fan will operate slightly fewer hours in these modes because of the cross tower’s cooling effect with the fan off.
Table 6.1. Comparative Energy Usage with Various Methods of Control
6.2. FANS
Fans provide the necessary energy input to pump air from one location to another while they overcome the various resistances created by the equipment and the duct distribution system. Fans have been classified in a general way as either centrifugal fans or axial-flow fans, according to the direction of airflow through the impeller. There are a number of subdivisions of each general type. Generally, the subdivisions consist of different styles of impellers and the strength and arrangement of construction. Because of the type of impeller dictates fan characteristics, it influences the amount of energy (horsepower) the fan needs to transport the required volume of air. The centrifugal fan has four basic types of impellers--airfoil, backward curved, radial, and forward-curved. Table 6.2 gives the nominal efficiency of the various types of fans at normal operating conditions.

PRIME MOVERS OF ENERGY: FANS
Modern Industrial Assessments 181
Type of Fan
Efficiency %
Axial Fan 85-90 Centrifugal Fans Airfoil Impeller 75-80 Backward-Curved Impeller 70-75 Radial Impeller 60-65 Forward-Curved Impeller 55-60
Table 6.2: Nominal Efficiency of Fans at Normal Operating Conditions
Reductions in exhaust airflows are usually obtained by adjustment of dampers in the duct. Damper control is a simple and low-cost means of controlling airflow, but it adds resistance, which causes an increase in fan horsepower. Accordingly, if fan output is heavily throttled or dampered, the savings opportunity of alternate methods of volume control should be investigated. More efficient methods of volume control are to: 1. Install inlet vane control. 2. Reduce the speed of the fan. 3. Provide variable-speed control. Figure 6.6 shows the reduction in horsepower realized by reducing fan speed. Before alternate methods of volume control are considered, the condition of the existing fan and duct system should be checked. Some factors that can reduce fan efficiency are: 1. Excessive static-pressure losses through poor duct configuration or plugging. 2. Duct leakage from poor joints or flange connections, access doors left open, damage or corrosion,
etc. 3. An improperly installed inlet cone, which inadequately seals the fan inlet area and allows excessive
air recirculation. 4. Excessive fan horsepower caused by poor fan maintenance, such as bad bearings, shaft
misalignment, worn impeller blades, or corroded fan housing. 5. Dirt and dust accumulations on fan blades or housing. 6. Buildup of negative pressure. Once the existing system operates as efficiently as possible, alternate methods to control flow can be evaluated.

PRIME MOVERS OF ENERGY: FANS
Modern Industrial Assessments 182
100
80
60
40
20
0
Per
cent
Hor
sepo
wer
0 20 40 60 80 100
Percent Volume
Outlet Dampers
Inlet Vane Dampers
Variab
le Spe
ed
Figure 6.6: Effect of Volume Control on Fan Horsepower
6.2.1. Inlet Vane Control
Inlet vane control is the most commonly used device for automatic control of centrifugal or in-line fan output after damper control. Pre-spinning as well as throttling the air prior to its entry into the wheel reduces output and save power. Fans must be of sufficient size to permit retrofitting; the wheel diameter should be larger than 20 inches. 6.2.2. Reduced Speed
When fan output can be reduced permanently, an economical method is to change belt sheaves. A slower-speed motor can also be used if the first approach is not suitable. A two-speed motor is

PRIME MOVERS OF ENERGY: AIR COMPRESSORS
Modern Industrial Assessments 183
another alternative if the fan operates at low volume for a significant portion of the time but full capacity is still required part-time. As an example of the savings to be realized from a reduction in fan speed, assume the exhaust airflow requirements have been reduced 50 percent on a 20-horsepower centrifugal fan. Reducing fan rpm 50 percent by changing belt sheaves will halve fan output. Figure 6.6 shows a horsepower comparison of various methods of centrifugal fan control for typical fans. A 50 percent reduction with an outlet damper requires 80 percent of rated power; with a slower-speed motor, only 25 percent of rated power is required. (Refer to the variable speed control curve on the figure.) Therefore: Annual Savings = (20 hp x 80% - 20 hp x 25%) x 6,000 hrs/yr x $0.041/hp-hr = $2,700 The reduction in fan output will result in operation of the electric motor at less than rated capacity. If the horsepower required at the reduced flow is less than about one third of rated horsepower, the potential savings for substitution of a smaller motor should also be investigated. 6.2.3. Variable Speed
If fan output must be varied but operates at reduced capacity much of the time, a variable drive should be evaluated. (See separate discussion on variable-speed drives.) Automatic variation of fan speed through fluid or magnetic couplings or variable-speed motors has limited application because of the high initial cost. 6.3. AIR COMPRESSORS
Air compressors in manufacturing facilities are often large consumers of electricity. There are two types of air compressors: reciprocating and screw compressors. Reciprocating compressors operate in manner similar to that of an automobile engine. That is, a piston moves back and forth in a cylinder to compress the air. Screw compressors work by entraining the air between two rotating augers. The space between the augers becomes smaller as the air moves toward the outlet, thereby compressing the air. 6.3.1. General
Screw compressors have fewer moving parts than reciprocating compressors have and are less prone to maintenance problems. However, especially for older types of screw compressors, screw compressors tend to use more energy than reciprocating compressors do, particularly if they are oversized for the load. This is because many screw compressors continue to rotate, whereas reciprocating compressors require no power during unloaded state.
PRIME MOVERS OF ENERGY: AIR COMPRESSORS
Modern Industrial Assessments 184
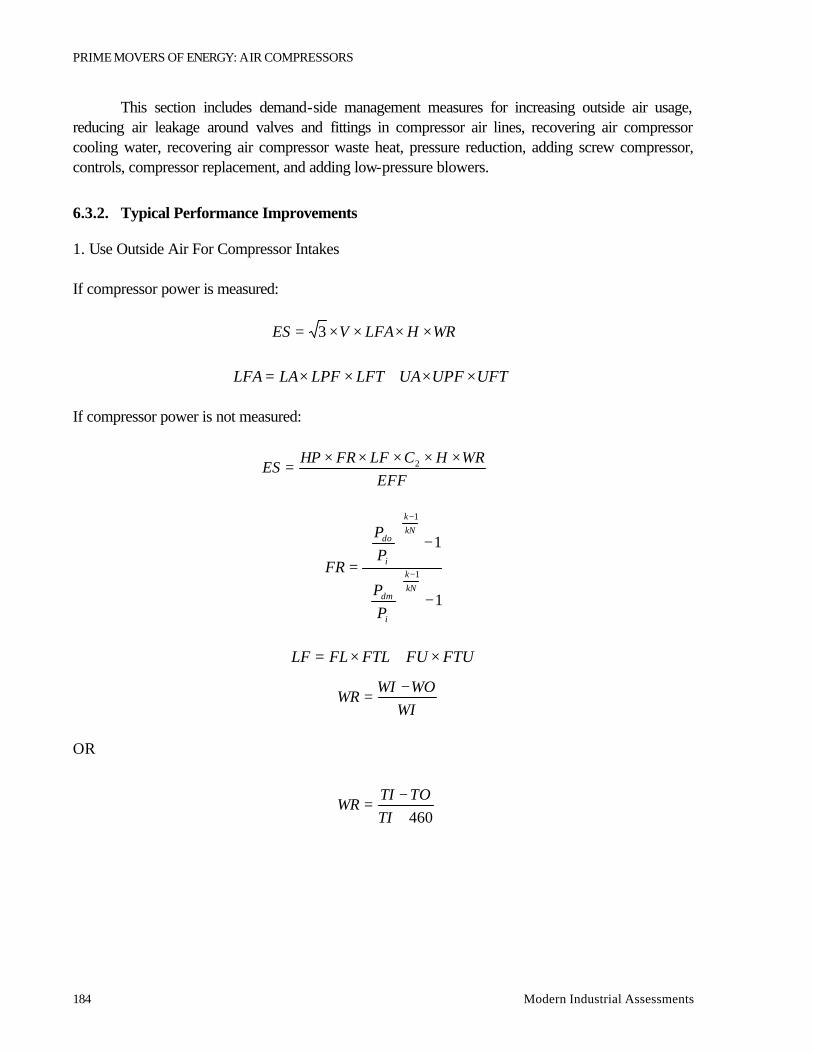
This section includes demand-side management measures for increasing outside air usage, reducing air leakage around valves and fittings in compressor air lines, recovering air compressor cooling water, recovering air compressor waste heat, pressure reduction, adding screw compressor, controls, compressor replacement, and adding low-pressure blowers. 6.3.2. Typical Performance Improvements
1. Use Outside Air For Compressor Intakes If compressor power is measured:
If compressor power is not measured:
1
1
1
1
−
−
= −
−
kNk
i
dm
kNk
i
do
PP
PP
FR
FTUFUFTLFLLF ×+×=
OR
WRHLFAVES ××××= 3
UFTUPFUALFTLPFLALFA ××+××=
EFFWRHCLFFRHP
ES×××××
= 2
WIWOWI
WR−
=
460+−
=TI
TOTIWR

PRIME MOVERS OF ENERGY: AIR COMPRESSORS
Modern Industrial Assessments 185
2. Compressor Controls
3. Install Small Compressor
( ) ( )FRCH
EffTLFLTUFUP
EffTLFLTUFUP
ESS
SSSS
L
LLLL ×××
×+××−
×+××=
HPS is based on cfm loading during off peak periods 4. Reduce Compressor Air Pressure
5. Reduce Compressed Air Leaks Leak diameter estimated on site
( )EFF
LFPLFCFRHCHPES
−××××=
( )EFF
HCUFLFHPFRES
×××××−=
1
5CHLES ××=
ma
Nkk
ifi
EE
PP
CNk
kVCP
L×
−
×××
−×××
=
×−
11
1
042
( )
460
4460
3
2
21
+
×××××+×=
TC
DCCC
PP
TNLV
di
li
π

PRIME MOVERS OF ENERGY: AIR COMPRESSORS
Modern Industrial Assessments 186
6. Install a Lower Pressure Blower For replacing plant compressed air used in plating tanks for agitation
7. Recover Compressor Waste Heat Flow and temperature of compressor exhaust air measured on site
Waste Heat Recovery
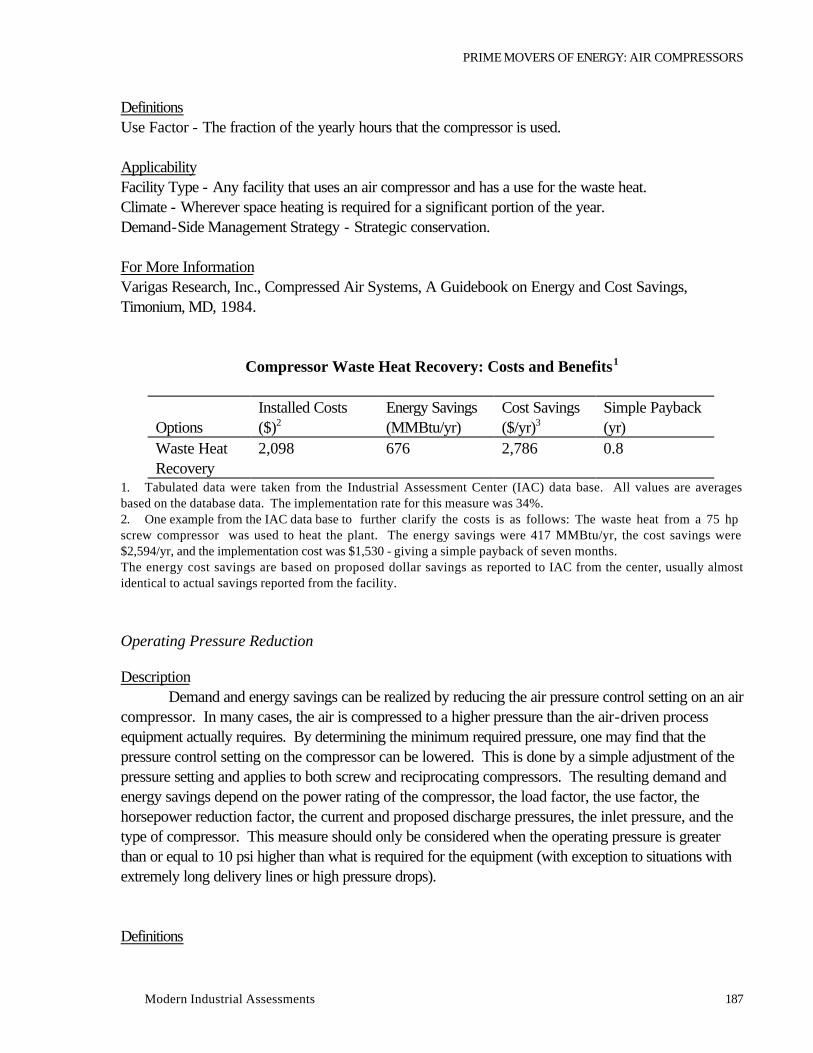
Description For both screw and reciprocating compressors, approximately 60% to 90% of the energy of compression is available as heat, and only the remaining 10% to 40% is contained in the compressed air. This waste heat may be used to offset space heating requirements in the facility or to supply heat to a process. The heat energy recovered from the compressor can be used for space heating during the heating season. The amount of heat energy that can be recovered is dependent on the size of the compressor and the use factor. For this measure to be economically viable, the warm air should not have to be sent very far; that is the compressor should be located near the heat that is to be used.
( ) 1CHPBPCES ××−=
mbab
Nkk
ii
EE
PP
CNk
kQCP
PB×
−
×××
−×××
=
×−
11
1
032
mcac
Nkk
ifi
EE
PP
CNk
kVCP
PC×
−
×××
−×××
=
×−
11
1
032
( )EFF
HHTTCCQES rep ×−××××
= 1ρ
PRIME MOVERS OF ENERGY: AIR COMPRESSORS
Modern Industrial Assessments 187
Definitions Use Factor - The fraction of the yearly hours that the compressor is used. Applicability Facility Type - Any facility that uses an air compressor and has a use for the waste heat. Climate - Wherever space heating is required for a significant portion of the year. Demand-Side Management Strategy - Strategic conservation. For More Information Varigas Research, Inc., Compressed Air Systems, A Guidebook on Energy and Cost Savings, Timonium, MD, 1984.
Compressor Waste Heat Recovery: Costs and Benefits1
Installed Costs Energy Savings Cost Savings Simple Payback Options ($)2 (MMBtu/yr) ($/yr)3 (yr) Waste Heat Recovery
2,098 676 2,786 0.8
1. Tabulated data were taken from the Industrial Assessment Center (IAC) data base. All values are averages based on the database data. The implementation rate for this measure was 34%. 2. One example from the IAC data base to further clarify the costs is as follows: The waste heat from a 75 hp screw compressor was used to heat the plant. The energy savings were 417 MMBtu/yr, the cost savings were $2,594/yr, and the implementation cost was $1,530 - giving a simple payback of seven months. The energy cost savings are based on proposed dollar savings as reported to IAC from the center, usually almost identical to actual savings reported from the facility. Operating Pressure Reduction
Description Demand and energy savings can be realized by reducing the air pressure control setting on an air compressor. In many cases, the air is compressed to a higher pressure than the air-driven process equipment actually requires. By determining the minimum required pressure, one may find that the pressure control setting on the compressor can be lowered. This is done by a simple adjustment of the pressure setting and applies to both screw and reciprocating compressors. The resulting demand and energy savings depend on the power rating of the compressor, the load factor, the use factor, the horsepower reduction factor, the current and proposed discharge pressures, the inlet pressure, and the type of compressor. This measure should only be considered when the operating pressure is greater than or equal to 10 psi higher than what is required for the equipment (with exception to situations with extremely long delivery lines or high pressure drops). Definitions

PRIME MOVERS OF ENERGY: AIR COMPRESSORS
Modern Industrial Assessments 188
Power Rating - The power indicated by the air compressor manufacturer-usually shown on the nameplate. Power Reduction Factor - The ratio of the proposed power consumption to the current power consumption, based on operating pressure. Inlet Pressure - The air pressure at the air intake to the compressor, usually local atmospheric pressure. Applicability Facility Type - Any facility that has an air compressor. Climate - All. Demand-Side Management Strategy - Strategic conservation. For More Information National Technical Information Service, Compressed Air Systems, A Guidebook on Energy and Cost Savings, #DOE/CS/40520-T2, March 1984.
Pressure Reduction: Costs and Benefits1
Installed Costs Energy Savings Cost savings Simple Payback Options ($)2 (MMBtu/yr) ($/yr)3 (yr) Pressure Reductions
864 187 2,730 1.0
1. Tabulated data were taken from the Industrial Assessment Center (IAC) database. All values are averages based on the data base data. The implementation rate for this measure was 48%. 2. One example from the IAC data base to further clarify the costs is as follows: Reducing the air pressure control setting on a 75 hp air compressor from 115 psig to 100 psig resulted in energy savings of 22,500 kWh and cost savings of $1,180/yr. The implementation cost was $270, resulting in a simple payback of three months. The energy cost savings are based on proposed dollar savings as reported to IAC from the center, usually almost identical to actual savings reported from the facility.
Elimination of Air Leaks
Description Air leaks around valves and fittings in compressor air lines may represent a significant energy cost in manufacturing facilities. Sometimes up to 20% of the work done by the compressor is to make up for air leaks. The energy loss as a function of hole diameter at an operating pressure of 100 psi is shown in the following table:

PRIME MOVERS OF ENERGY: AIR COMPRESSORS
Modern Industrial Assessments 189
Hole Diameter Free Air Wasted Energy Wasted
[ft3/yr] Per Leak [in] by a Leak of Air [kWh/h]
at 100 psi 3/8 90 400 000 29.9 ¼ 40 300 000 14.2 1/8 10 020 000 3.4 1/16 2 580 000 0.9 1/32 625 000 0.2
Source: National Bureau of Standards Rule of Thumb --=5%-10% of total energy consumption
Table 6.3: Fuel and Air Losses Due to Compressed Air Leaks
Definitions Gage Pressure - The system pressure supplied by the compressor. Absolute Pressure - The sum of the gage pressure and the atmospheric pressure. The gage and the absolute pressures are used in calculating the amount of air lost due to air leaks. Applicability Facility Type - Any facility that has an air compressor. Climate - All. Demand-Side Management Strategy - Strategic conservation and peak clipping. For More Information American Consulting Engineers’ Council, Industrial Market and Energy Management Guide, SIC 32 Stone, Clay and Glass Products Industry, Washington, DC, 1987, P. III-30. Turner, et. al., Energy Management Handbook, John Wiley and Sons, New York, NY, 1982, pp. 424-425.

PRIME MOVERS OF ENERGY: AIR COMPRESSORS
Modern Industrial Assessments 190
Leakage Reduction: Costs and Benefits1
Installed Costs Energy Savings Cost Savings Simple Payback Options ($)2 (MMBtu/yr) ($/yr)3 (yr) Leakage Reduction
934 230 3,540 0.3
1. Tabulated data were taken from the Industrial Assessment Center (IAC) data base. All values are averages based on the data base data. The implementation rate for this measure was 79%. 2. One example from the IAC data base to further clarify the costs is as follows: Repairing air leaks in a compressed air system having air compressors of 150 hp, 60 hp and 25 hp-all operating at 110 psig-resulted in energy savings of 35,750kWh and cost savings of $2,760/yr. The implementation cost was $500. 3. The energy cost savings are based on proposed dollar savings as reported to IAC from the center, usually almost identical to actual savings reported from the facility.
§ Case Study Estimated Energy Savings = 408.0 MMBtu/yr Estimated Cost Savings = $5,730/yr Estimated Implementation Cost = $460 Simple Payback = 1 month Recommended Action Leaks in compressed air lines should be repaired on a regular basis. Background The cost of compressed air leaks is the energy cost to compress the volume of lost air from atmospheric pressure to the compressor operating pressure. The amount of lost air depends on the line pressure, the compressed air temperature at the point of the leak, the air temperature at the compressor inlet, and the estimated area of the leak. The leak area is based mainly upon sound and feeling the airflow from the leak. The detailed equations are included at the end of the AR. An alternative method to determine total losses due to air leaks is to measure the time between compressor cycles when all air operated equipment is shut off. The plant utilizes one 75hp compressor that operates 8,520 hrs/yr. Measurements taken during the site visit showed the compressor to continuously draw 77.7 hp. Approximately 24% of this load is lost to air leaks in the plant. The majority of the air leaks are due to open, unused lines. There are several plant locations where pneumatic machinery could be connected to the primary air line, but at the time of the site visit, no machines were connected. These open lines were typically found on or near I-beams. The terms “I-beam #1, #2, and #3” are used in the tables of this AR to label the leaks. In

PRIME MOVERS OF ENERGY: AIR COMPRESSORS
Modern Industrial Assessments 191
order to allow for correct location of these open lines, a list of the terms and their approximate locations follow:

PRIME MOVERS OF ENERGY: AIR COMPRESSORS
Modern Industrial Assessments 192
Terms Description I-Beam #1 Leak located on I-beam near rotary automatic #2. I-Beam #2 Leak located on I-beam near catalogue machine. I-Beam #3 Leak located on hose attached to I-beam near Machine 6700. Anticipated Savings Values for all factors affecting the cost of compressed air leaks were determined during the site visit, and are listed in the following tables. Because of long piping runs to the equipment, the compressed air temperature is estimated to be the same as room temperature.
Condition of Pneumatic System at Time of Site Visit
Variable Air temperature at compressor inlet, °F 92 Atmospheric pressure, psia 14.7 Compressor operating pressure, psig 115 Air temperature at the leak, °F 72 Line pressure at the leak, psig 115 Compressor motor size, hp 75 Compressor motor efficiency 91.5% Compressor type Screw Number of stages 1 Compressor operating hours, per year 8,520 Electric cost, per MMBtu $14.05
Using these values, the volumetric flow rate, power lost due to leaks, energy lost and cost for leaks of various sizes were calculated specifically for the conditions at this plant. The results are shown in the following table. As the table shows, the cost of compressed air leaks increases exponentially as the size of the leak increases. As part of a continuing program to find and repair compressed air leaks, the table or graph can be referenced to estimate the cost of any leaks that might be found.

PRIME MOVERS OF ENERGY: AIR COMPRESSORS
Modern Industrial Assessments 193
PRIME MOVERS OF ENERGY: AIR COMPRESSORS
Modern Industrial Assessments 194
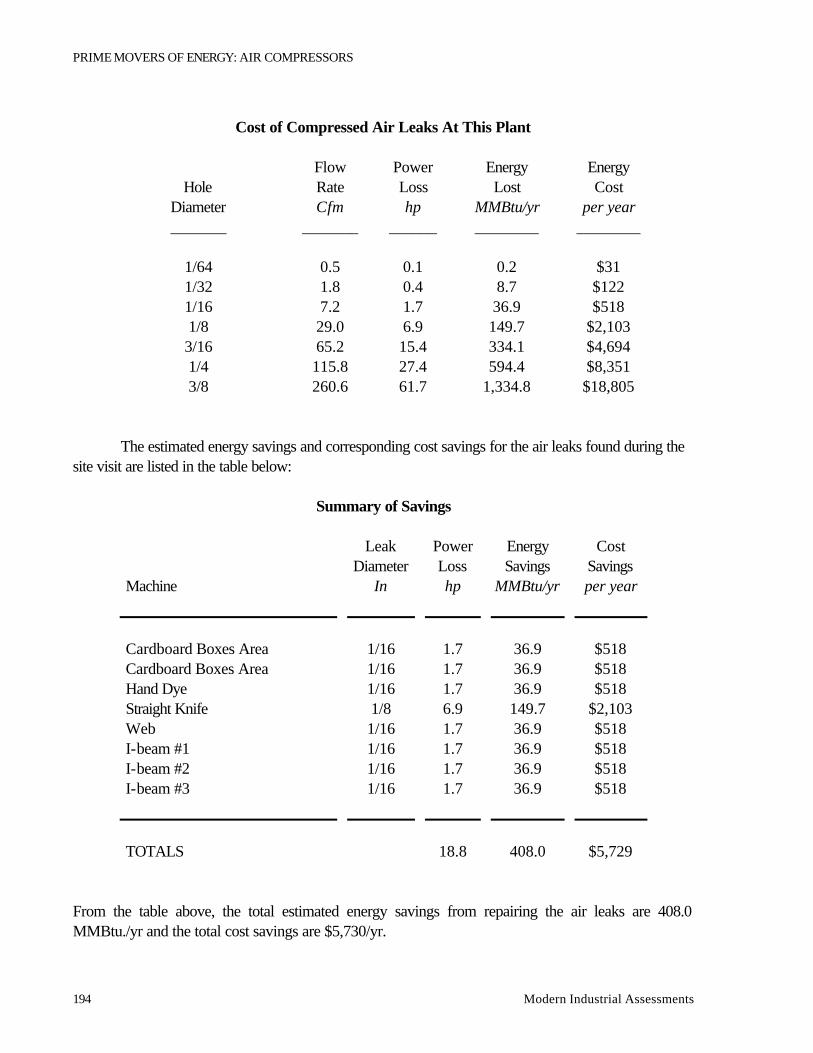
Cost of Compressed Air Leaks At This Plant
Flow Power Energy Energy
Hole Rate Loss Lost Cost Diameter Cfm hp MMBtu/yr per year _______ _______ ______ ________ ________
1/64 0.5 0.1 0.2 $31 1/32 1.8 0.4 8.7 $122 1/16 7.2 1.7 36.9 $518 1/8 29.0 6.9 149.7 $2,103 3/16 65.2 15.4 334.1 $4,694 1/4 115.8 27.4 594.4 $8,351 3/8 260.6 61.7 1,334.8 $18,805
The estimated energy savings and corresponding cost savings for the air leaks found during the site visit are listed in the table below:
Summary of Savings
Leak Power Energy Cost Diameter Loss Savings Savings Machine In hp MMBtu/yr per year
Cardboard Boxes Area 1/16 1.7 36.9 $518 Cardboard Boxes Area 1/16 1.7 36.9 $518 Hand Dye 1/16 1.7 36.9 $518 Straight Knife 1/8 6.9 149.7 $2,103 Web 1/16 1.7 36.9 $518 I-beam #1 1/16 1.7 36.9 $518 I-beam #2 1/16 1.7 36.9 $518 I-beam #3 1/16 1.7 36.9 $518
TOTALS 18.8 408.0 $5,729 From the table above, the total estimated energy savings from repairing the air leaks are 408.0 MMBtu./yr and the total cost savings are $5,730/yr.

PRIME MOVERS OF ENERGY: AIR COMPRESSORS
Modern Industrial Assessments 195
Implementation Costs In general, implementation of this AR involves any or all of the following:
1) replacement of couplings and/or hoses; 2) replacement of seals around filters; 3) shutting off air flow during lunch or break periods; and 4) repairing breaks in lines, etc.
Specific repairs and implementation costs for the leaks found during the site visit are given in the table below.
Implementation Costs
Machine Repair Needed Parts Labor Total Cost ____________________ _________________
_ ______
______
__________
Cardboard Boxes Area install shut-off valve $50 $25 $75 Cardboard Boxes Area install shut-off valve $50 $25 $75 Hand Dye install shut-off valve $50 $25 $75 Straight Knife replace coupling $2 $25 $27 Web change 0.5” tube $9 $25 $34 I-beam #1 install shut-off valve $50 $25 $75 I-beam #2 install shut-off valve $50 $25 $75 I-beam #3 replace coupling $2 $25 $27 ____________________ _________________
_ _____ _____
_ __________
TOTALS $263 $200 $463
Assuming that this work can be done by facility maintenance personnel, these leaks can be eliminated for approximately $460. Thus, the cost savings of $5,730 would pay for the implementation cost of $460 in about 1 month. Equations for Air Flow, Power Loss, and Energy Savings The volumetric flow rate of free air exiting the hole is dependent upon whether the flow is choked. When the ratio of atmospheric pressure to line pressure is less than 0.5283, the flow is said to be choked (i.e., traveling at the speed of sound). The ratio of 14.7 psia atmospheric pressure to 129.7 psia line pressure is 0.11. Thus, the flow is choked. The volumetric flow rate of free air, Vf, exiting the leak under choked flow conditions is calculated as follows:
( )
4604
460
6
2
54
+
×××××+×=
l
di
li
fTC
DCCC
PP
TNLV
π

PRIME MOVERS OF ENERGY: AIR COMPRESSORS
Modern Industrial Assessments 196
where Vf = volumetric flow rate of free air, cubic feet per minute NL = number of air leaks, no units Ti = temperature of the air at the compressor inlet, °F Pl = line pressure at leak in question, psia Pi = inlet (atmospheric) pressure, 14.7 psia C4 = isentropic sonic volumetric flow constant, 28.37 ft/sec-°R0.5 C5 = conversion constant, 60 sec/min Cd = coefficient of discharge for square edged orifice1, 0.8 (no units) D = leak diameter, inches (estimated from observations) Cb = conversion constant, 144 in2/ft2 Tl = average line temperature, °F The power loss from leaks is estimated as the power required to compress the volume of air lost from atmospheric pressure, Pi, to the compressor discharge pressure, P, as follows2:
Where L = power loss due to air leak, hp k = specific heat ratio of air, 1.4, no units N = number of stages, no units C7 = conversion constant, 3.03 x 10⁻⁵ hp-min/ft-lb Po = compressor operating pressure, psia Ea = air compressor isentropic (adiabatic) efficiency, no units Ea = 0.88 for single stage reciprocating compressors Ea = 0.75 for multi-stage reciprocating compressors Ea = 0.82 for rotary screw compressors Ea = 0.72 for sliding vane compressors Ea = 0.80 for single stage centrifugal compressors Ea = 0.70 for multi-stage centrifugal compressors Ea = 0.70 for turbo blowers
1. A.H. Shapiro, The Dynamics and Thermodynamics of Compressible Fluid Flow, Vol 1, Ronald Press, NY, 1953, p. 100. 2. Compressed Air and Gas Institute, Compressed Air and Gas Handbook, Fifth Edition, New Jersey, 1989, Chapters 10 and 11. 3. Pneumatic Handbook, 7th ed., Anthony Barber, Trade and Technical Press, 1989, p. 49.
3 . 1 4 1 6 c o n s t a n t ,h a g o r e a n π
ma
Nkk
ifi
EE
PP
CNk
kVCP
L×
−
×××
−×××
=
×−
11
1
076

PRIME MOVERS OF ENERGY: AIR COMPRESSORS
Modern Industrial Assessments 197
Ea = 0.62 for Roots blowers3
Em = compressor motor efficiency, no units

PRIME MOVERS OF ENERGY: AIR COMPRESSORS
Modern Industrial Assessments 198
The annual energy savings, ES, are estimated as follows:
where H = annual time during which leaks occurs, h/yr C8 = conservation factor, 0.002545 MMBtu/hp-h The annual cost savings, CS, can be calculated as follows:
CS = ES x unit cost of electricity Quantifying air leaks is relatively simple if the system can be shut down for 10 to 15 minutes and if there is an operating pressure gage in the system. It is a good idea to ask plant personnel to shut down their compressors briefly (and close a valve near the compressor if the compressor begins to relieve the system pressure through and automatic bleed). It is important to assure that there are no plant processes taking air from the system at the time of this test--the only thing relieving the pressure should be leaks. If there is not an operating plant pressure gage in the system, a cheap one and a collection of bayonet fittings should be at hand so the gage can be attached to the end of one of the plant’s supply hoses. One should monitor the pressure decay as a function of time for about a 10 psi drop and then measure the sizes of the major receivers/accumulators and major air headers. The pressure drop test never takes more than 15 minutes, and usually less. Measuring the size of major receivers and air lines is a short job for an experienced student. Small lines (1.5 inch or less) can be ignored and leaving them out makes the result conservative. Application of the perfect gas law will yield the leak rate in scfm. Then one can turn to a reference like the DOE/C/40520-TZ by Varigas Research to get compressor hp required per scfm. It is possible to correct the 100 psig data there to other pressures. This is a much better procedure than listening for leaks and ‘quantifying’ them by ear as to such things as ‘roar’, ‘gush’, ‘whisper’, etc. because the leak rate is reasonably quantified in a conservative way. It has the disadvantage of leaving the assessment team clueless about the cost of repair, which must then be estimated. It is a good practice to listen for the big leaks and to try to see what is causing them to aid in eliminating costs.
8CHLES ××=

PRIME MOVERS OF ENERGY: AIR COMPRESSORS
Modern Industrial Assessments 199
This procedure, along with a couple of other common projects is covered in two publications:
Darin W. Nutter, Angela J. Britton, and Warren M. Heffington, “Five Common Energy Conservation Projects in Small- and Medium-Sized Industrial Plants,” 15th National Industrial Energy Technology Conference, Houston, TX, March 1993, pp. 112-120. The same article was rewritten for Chemical Engineering. The reference is: “Conserve Energy to Cut Operating Costs,” Chemical Engineering, September 1993, pp. 126-137 Cooling Water Heat Recovery
Description Air compressors, 100 hp and larger, are often cooled by water from a cooling tower. The temperature of the water after leaving the cooling coils of the compressor may be sufficiently high that heat can be extracted from the water and used in a process. For example, boiler feedwater could be preheated by the water used to cool the compressor. Preheating make-up water displaces boiler fuel that would ordinarily be used to heat the make-up water. Definitions Cooling Coil - Finned tubes on a water-cooled compressor through which water flows and across which air flows. Applicability Facility Type - Any manufacturing facility that has a large, water-cooled air compressor. Climate - All. Demand-Side Management Strategy - Strategic conservation.
Waste Water Heat Recovery: Costs and Benefits1
Installed Costs Energy savings Cost Savings Simple Payback Options ($)2 (MMBtu/yr) ($/yr)3 (yr)
Waste Water 16,171 3,306 14,676 1.1 Heat Recovery
PRIME MOVERS OF ENERGY: AIR COMPRESSORS
Modern Industrial Assessments 200
1. Tabulated data were taken from the Industrial Assessment Center (IAC) data base and represent HOT waste water IN GENERAL, not just cooling water. All values are averages based on the data base data. The implementation rate for this measure was 41%. 2. One example from the IAC data base to further clarify the costs is as follows: Installing a heat exchanger to recover heat from waste water to heat incoming city water resulted in energy savings of 145 MMBtu/yr, cost savings of $777/yr, and an imp lementation cost of $2,600, giving a simple payback of 3.4 years. 3. The energy cost savings are based on proposed dollar savings as reported to IAC from the center, usually almost identical to actual savings reported from the facility. Compressor Controls
Description Screw compressors may consume up to 80% of their rated power output when they are running at less than full capacity. This is because many screw compressors are controlled by closing a valve; the inlet throttling valve on a typical throttled-inlet, screw-type compressor is partially closed in response to a reduced air system demand. The pressure rise across the compression portion of the unit does not decrease to zero, and thus power is still required by the unit. Accordingly, an older unit will continue to operate at 80% to 90% and a new unit at 40% to 60% of its full load capacity horsepower. When several screw-type air compressor are being used, it is more efficient to shut off the units based on decreasing load than to allow the units to idle, being careful not to exceed the maximum recommended starts/hour for the compressor. Modular systems that conserve energy by operating several small compressors that are brought on line as needed instead of operating one large compressor continuously are often found in retrofit and new installations. Definitions None. Applicability Facility Type - Any facility that has screw-type air compressors. Climate - All. Demand-Side Management Strategy - Strategic conservation.
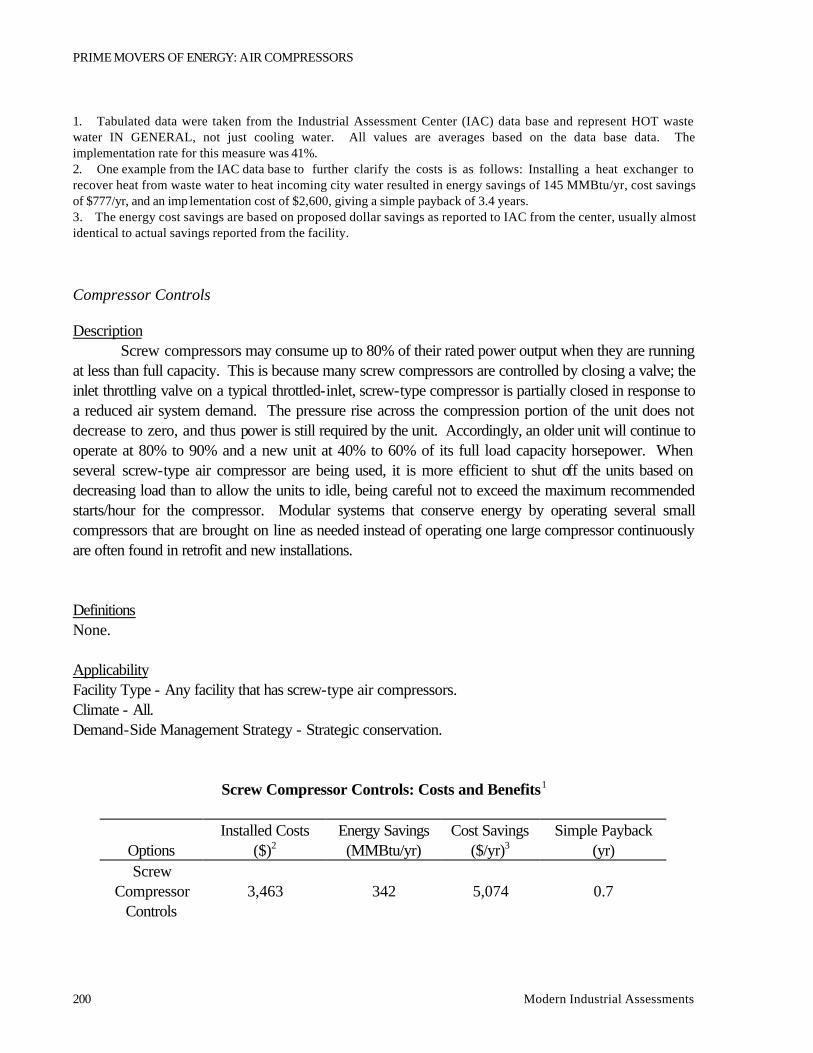
Screw Compressor Controls: Costs and Benefits1
Installed Costs Energy Savings Cost Savings Simple Payback Options ($)2 (MMBtu/yr) ($/yr)3 (yr) Screw
Compressor Controls
3,463
342
5,074
0.7

PRIME MOVERS OF ENERGY: AIR COMPRESSORS
Modern Industrial Assessments 201
1. Tabulated data were taken from the Industrial Assessment Center (IAC) data base. All values are averages based on the data base data. The implementation rate for this measure was 48%. 2. One example from the IAC data base to further clarify the costs is as follows: Installing controls on a 100 hp compressor resulted in energy savings of 128,600 kWh and a cost savings of $6,750/yr, at an implementation cost of $1,500. 3. The energy cost savings are based on proposed dollar savings as reported to IAC from the center, usually almost identical to actual savings reported from the facility.
Outside Air Usage
Description The amount of work done by an air compressor is proportional to the temperature of the intake air. Less energy is needed to compress cool air than to compress warm air. On average, outside air is cooler than in inside a compressor room. This is often the case even on very hot days. Piping can often be installed so that cooler outside air can be supplied to the intake on the compressor. This is particularly simple and cost-effective if the compressor is located adjacent to an exterior wall. The energy and cost savings are dependent on the size of the compressor, the load factor, and the number of hours during which the compressor is used. The payback period is nearly always less than two years. The load factor is fairly constant for compressors that operate only when they are actually compressing air. Most reciprocating compressors are operated in this manner. When that are on, they operate with fairly constant power consumption, usually nearly equal to their rated power consumption; when they are cycled off, the power consumption is zero. Screw compressors are often operated in a different manner. When loaded (i.e., actually compressing air), they operate near their rated power, but when compressed air requirements are met, they are not cycled off but continue to rotate and are “unloaded.” Older screw compressors may consume as much as 85% of their rated power during this unloaded state. Therefore, if a screw compressor is to be operated continuously, it should be matched closely to the compressed air load that it supplies. Often, plant personnel purchase compressors having several times the required power rating. This may be done for a variety of reasons, but often in anticipation of expansion of the facility and a commensurate increase in the compressed air requirements. Definitions Rated Load - The power usage indicated by the air compressor manufacturer; usually shown on the nameplate. Load Factor - The average fraction of the rated load at which the compressor operates. Applicability Facility Type - Any facility that uses compressed air in its operations. The savings increase as the size of the compressor and the hours of use increase for both types of compressors. Climate - Any climate in which the average outdoor air temperature is less than the air temperature in the compressor room. Demand-Side Management Strategy - Strategic conservation and peak clipping.

PRIME MOVERS OF ENERGY: AIR COMPRESSORS
Modern Industrial Assessments 202
For More Information Witte, L.C., P.S. Schmidt, D.R. Braun, Industrial Energy Management and Utilization, Hemisphere Publishing Corp., Washington, DC, 1988, pp.433, 437. Baumeister, T., L.S. Marks, eds., Standard Handbook for Mechanical Engineers, 7th Edition, McGraw-Hill Book Co., New York, NY, 1967, pp. 14.42-14.61.
Outside Air Usage: Costs and Benefits1
Installed Costs Energy Savings Cost Savings Simple Payback Options ($)2 (MMBtu/yr) ($/yr)3 (yr)
Outside Air Usage
593 82 1,246 0.5
1. Tabulated data were taken from the Industrial Assessment Center (IAC) data base. All values are averages based on the data base data. The implementation rate for this measure was 52%. 2. One example from the IAC data base to further clarify the costs is as follows: Supplying outside air to the intakes of three air compressors (100 hp, 75 hp, and 50 hp) resulted in energy and cost savings of 10,050 kWh and $490/yr. The implementation cost was $780. 3. The energy cost savings are based on proposed dollar savings as reported to IAC from the center, usually almost identical to actual savings reported from the facility. Compressor Replacement
Description It is often advantageous to install a smaller compressor to more closely match the compressed air requirements normally met by oversized or large compressors, for processes that have periods of low compressed air usage. A smaller compressor will reduce energy usage and associated costs because the smaller compressor will operate at a better efficiency than the larger compressor when air requirements are low. Generally pre-1975 stationary screw-type compressors, if oversized for the load, will run unloaded much of the time when the load is low. They are unloaded by closing the inlet valve and hence are referred to as modulating inlet type compressors. Based on manufacturers’ data, these compressors can consume as much as 85% of the full load horsepower when running unloaded. Some pre- and post-1975 compressor manufacturers have developed systems that close the inlet valve but also release the oil reservoir pressure and reduce oil flow to the compressor. Other strategies have also been developed but are not usually found on older (pre-1975) screw-type compressors. The unloaded horsepower for screw compressors operating with these types of systems typically ranges from 80% to 90% of the full load horsepower for older compressors and from 40% to 60% for newer

PRIME MOVERS OF ENERGY: AIR COMPRESSORS
Modern Industrial Assessments 203
compressors, depending on the particular design and conditions. In any event, if the compresses air requirements are reduced during particular periods (such as a third shift), but are not eliminated entirely, then installing a smaller compressor to provide the air requirements during these periods can be cost-effective. Definitions None. Applicability Facility Type - Any facility that has a screw compressors and in which there are time periods during which the compressed air requirements are low. Climate - All. Demand-Side Management Strategy - Strategic conservation.
Optimum Sized Equipment: Costs and Benefits1
Installed Costs Energy Savings Cost Savings Simple Payback Options ($)2 (MMBtu/yr) ($/yr)3 (yr)
Compressor Replacement 11,826 975 9,828 1.2 1. Tabulated data were taken from the Industrial Assessment Center (IAC) data base. All values are averages based on the data base data. The implementation rate for this measure was 39%. 2. One example from the IAC data base to further clarify the costs is as follows: A manufacturer of computer peripheral equipment replaced a 200 hp air compressor with a 75 hp air compressor. The energy savings were $61,850 kWh and the cost savings were $2,725. The implementation costs were $4,000. 3. The energy cost savings are based on proposed dollar savings as reported to IAC from the center, usually almost identical to actual savings reported from the facility.
Low-Pressure Blowers
Description Compressed air is sometimes used to provide agitation of liquids, to control vibration units for material handling (as air lances), and for other low-pressure pneumatic mechanisms. For such purposes, it is more efficient to use a blower to provide the required low-pressure air stream. Use of low-pressure air from the blower would reduce energy consumption by eliminating the practice of compressing air and then expanding it back to low pressure for use. Definitions Plating Tanks - Tanks containing chemicals used in plating operations, such as chrome plating. Applicability Facility Type - Any facility having plating tanks. Climate - All.
PRIME MOVERS OF ENERGY: AIR COMPRESSORS
Modern Industrial Assessments 204
Demand-Side Management Strategy - Strategic conservation and peak clipping.
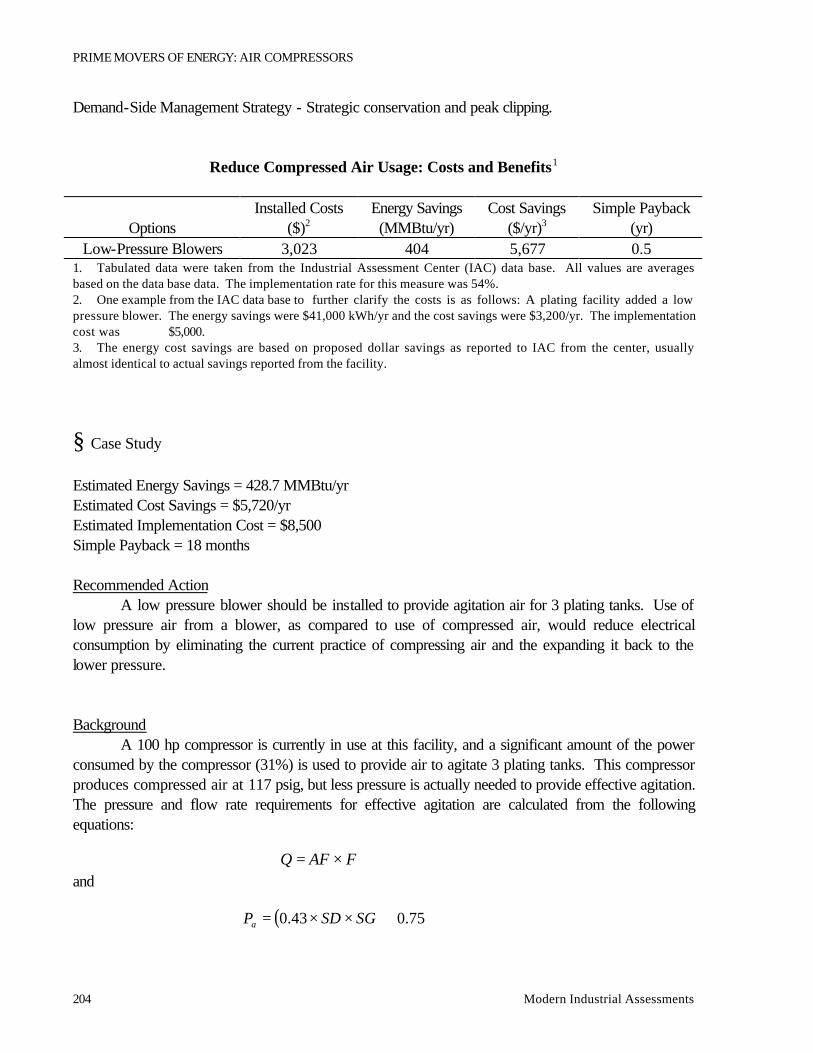
Reduce Compressed Air Usage: Costs and Benefits1
Installed Costs Energy Savings Cost Savings Simple Payback Options ($)2 (MMBtu/yr) ($/yr)3 (yr)
Low-Pressure Blowers 3,023 404 5,677 0.5 1. Tabulated data were taken from the Industrial Assessment Center (IAC) data base. All values are averages based on the data base data. The implementation rate for this measure was 54%. 2. One example from the IAC data base to further clarify the costs is as follows: A plating facility added a low pressure blower. The energy savings were $41,000 kWh/yr and the cost savings were $3,200/yr. The implementation cost was $5,000. 3. The energy cost savings are based on proposed dollar savings as reported to IAC from the center, usually almost identical to actual savings reported from the facility.
§ Case Study Estimated Energy Savings = 428.7 MMBtu/yr Estimated Cost Savings = $5,720/yr Estimated Implementation Cost = $8,500 Simple Payback = 18 months Recommended Action A low pressure blower should be installed to provide agitation air for 3 plating tanks. Use of low pressure air from a blower, as compared to use of compressed air, would reduce electrical consumption by eliminating the current practice of compressing air and the expanding it back to the lower pressure. Background A 100 hp compressor is currently in use at this facility, and a significant amount of the power consumed by the compressor (31%) is used to provide air to agitate 3 plating tanks. This compressor produces compressed air at 117 psig, but less pressure is actually needed to provide effective agitation. The pressure and flow rate requirements for effective agitation are calculated from the following equations:
and
FAFQ ×=
( ) 75.043.0 +××= SGSDPa

PRIME MOVERS OF ENERGY: AIR COMPRESSORS
Modern Industrial Assessments 205
where Q = flow rate required for agitation, cfm AF = agitation factor A = surface area of agitation tanks, 63.5 sq. ft. Pa = pressure required for agitation, psig SD = depth of solution, 3 ft. SG = specific gravity of water, 1.0 For agitation tanks containing water, the agitation factor is 1.0 cfm/sq. ft.1 The effective surface area of the tanks is 63.5 sq. ft. Thus, the flow rate required for agitation is calculated as follows:
The pressure required for effective tank agitation is calculated as follows: 1. Serfilco '91-'92 Catalog “U” p. 118
Because the difference between the pressure delivered by the compressor and the pressure required for effective tank agitation, the compressor is doing a large amount of unnecessary work. By implementing a blower that has a pressure output more closely matched to the agitation requirement, significant energy savings can be realized. Anticipated Savings Energy savings due to use of air at reduced pressure, ES, are estimated as follows1:
where PC = power consumed by compressor to agitate tank, hp PB = power consumed by blower to agitate tank, hp H = operating hours, 5,746 h/yr C1 = conversion factor, 0.756 kW/hp The volume of free air used for agitation Vf at this plant as obtained from the plant personnel is 130 cfm. The power PC that is required to compress the volume of free air Vf needed for agitation from atmospheric pressure Pi to the compressor discharge pressure Po can be calculated as follows2:
cfmQ 5.635.630..1 =×=
psigP 275.00.10.343.0 =+××=
( ) 1CHPBPCES ××−=
PRIME MOVERS OF ENERGY: AIR COMPRESSORS
Modern Industrial Assessments 206
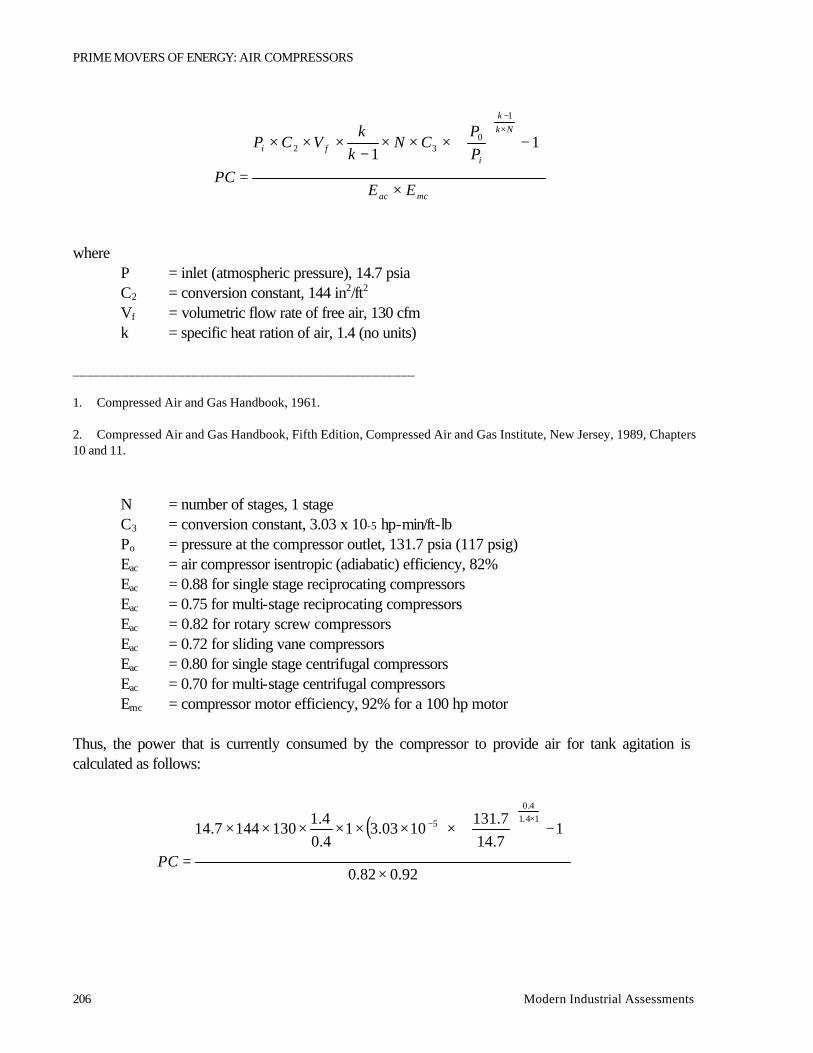
where P = inlet (atmospheric pressure), 14.7 psia C2 = conversion constant, 144 in2/ft2 Vf = volumetric flow rate of free air, 130 cfm k = specific heat ration of air, 1.4 (no units) _________________________________________________ 1. Compressed Air and Gas Handbook, 1961. 2. Compressed Air and Gas Handbook, Fifth Edition, Compressed Air and Gas Institute, New Jersey, 1989, Chapters 10 and 11.
N = number of stages, 1 stage C3 = conversion constant, 3.03 x 10⁻⁵ hp-min/ft-lb Po = pressure at the compressor outlet, 131.7 psia (117 psig) Eac = air compressor isentropic (adiabatic) efficiency, 82% Eac = 0.88 for single stage reciprocating compressors Eac = 0.75 for multi-stage reciprocating compressors Eac = 0.82 for rotary screw compressors Eac = 0.72 for sliding vane compressors Eac = 0.80 for single stage centrifugal compressors Eac = 0.70 for multi-stage centrifugal compressors Emc = compressor motor efficiency, 92% for a 100 hp motor Thus, the power that is currently consumed by the compressor to provide air for tank agitation is calculated as follows:
mcac
Nkk
ifi
EE
PP
CNk
kVCP
PC×
−
×××
−×××
=
×−
11
1
032
( )
92.082.0
17.147.131
1003.314.04.1
1301447.1414.1
4.0
5
×
−
×××××××
=
×−
PC

PRIME MOVERS OF ENERGY: AIR COMPRESSORS
Modern Industrial Assessments 207
Similarly the power required by the blower to provide the same amount of air for agitation, PB, can be calculated as follows:
where
Pb = pressure at the blower outlet, 17.7 psia (3 psig). This value accounts for Pa plus losses in the air lines.
Eab = blower isentropic (adiabatic) efficiency, 60% Eab = 0.70 for turbo blowers Eab = 0.62 for Roots blowers1 Emb = compressor motor efficiency, 92% for a 100 hp motor Thus, the power that would be consumed by the blower to provide air for tank agitation is estimated as follows: _______________________________________ 1. Anthony Barber, Pneumatic Handbook, 7th ed., Trade and Technical Press, 1989, p.49
For this facility, the energy savings, ES, that can be realized by installing a blower to provide agitation air for the three tanks are estimated as follows:
The annual cost savings, CS, can be estimated as follows:
CS = ES X unit cost of electricity
mbab
kk
i
bi
EE
PP
CNk
kQCP
PB×
−
×××
−×××
=
−
11
1
32
( )
80.060.0
17.147.17
1003.314.04.1
5.631447.144.14.0
5
×
−
×××××××
=
−
PB
( )yr
MMBtuyr
kWhES 7.469597,137746.057466.17.33 ==××−=

PRIME MOVERS OF ENERGY: AIR COMPRESSORS
Modern Industrial Assessments 208
Implementation Cost Implementation of this AR involves purchase and installation of a low pressure blower and corresponding controls. The purchase price for a blower that will provide a 3 psig air at a flow of 63.5 cfm, including controls, is estimated as $7,500. The installation cost is estimated as $1,000, including modifications to tanks described below, giving a total implementation cost of $8,500. Thus, the cost savings of $5,720/yr would have a simple payback of about 18 months. In order for a 3 psig blower to deliver 63.5 cfm of air, the size of the air outlets in the tanks may have to be modified. Assuming that there are 12 total outlets (4 outlets per tank), the required outlet diameter is calculated from the equation for unchoked flow (less than the speed of sound) as follows:
where T = average line temperature, °F NL = number of outlets used for agitation, 12 C5 = conversion constant, 60 sec/min C6 = conversion constant, 1/144 in2/ft2 C7 = isentropic subsonic volumetric flow constant, 109.61 ft/sec-°R0.5
Cbd = coefficient of discharge for subsonic flow through a square edged orifice, 0.6 Ti = temperature of the air at the compressor inlet, 101°F Pl = line pressure at the agitation tanks, 17.7 psia Thus, the required diameter of the air outlets is calculated as follows:
yrMMBtuyr
MMBtuCS /265,6$
34.13$7.469 =
×
=
( )( ) ( )
kk
i
lk
lk
i
lidb
l
PP
PP
TCCCCNL
TQD
12
765 460
4604−−×
−
×+××××××
+××=
π

PRIME MOVERS OF ENERGY: AIR COMPRESSORS
Modern Industrial Assessments 209
D = 0.20 inches Therefore, if the current diameter of the air outlets is not equal to 0.20 inches, the outlets should be enlarged. 6.3.3. General Notes on Air Compressors
1. Screw units use 40-100% of rated power unloaded. 2. Reciprocating units are more efficient, more expensive. 3. About 90% of energy consumption becomes heat (10%). 4. RULE OF THUMB: Roughly 20 hp per 100 cfm @ 100 psi. 5. Synchronous belts generally are not appropriate (cooling fins, pulley size). 6. Use low pressure blowers vs. compressed air whenever possible (agitation, heat guns, pneumatic transfer, etc.). 7. Cost of sir leaks surprisingly high. 8. Second, third, weekend shifts may have low air needs that could be served by smaller compressor. 9. Outside air is cooler, denser, easier to compress than warm inside air. 10. Friction can be reduced by using synthetic lubricants. 11. Older compressors are driven by older, less efficient motors. 12. Compressors may be cooled with chilled water or have reduced condenser capacity. REFERENCES 1. Compressed Gas Association, Handbook of Compressed Gases, Reinhold, 1966
( ) 4.14.0
4.14.02
7.147.17
7.147.17
4601016.061.109144
16012
460755.634
−
×+××××××
+××=
×
π
D

PRIME MOVERS OF ENERGY: AIR COMPRESSORS
Modern Industrial Assessments 210
2. White, F.G., Industrial Air Compressors, Foulis, 1967 3. Janna, W.S., Introduction to Fluid Mechanics, PWS Publishing Company, 1993 4. Wolanski, W., Negoshian, J., and Henke, R., Fundamentals of Fluid Power, Houghton Miffin, 1977 5. Anderson B., The Analysis and Design of Pneumatic Systems, John Wiley and Sons, 1967 6. Fluid Power Handbook and Directory, Hydraulics And Pneumatics, 1994 7. Marks’ Standard Handbook for Mechanical Engineers, McGraw-Hill, 1987 8. Vacuum and Pressure Systems Handbook, Gast Manufacturing Corporation, 1986