prime movers’ group on gas quality and h handling
TRANSCRIPT

Picture courtesy of Gas Connect Austria
#6 meeting, 24th February 2021 (09:00 – 13:00 CET)
Prime movers’ group on Gas Quality and H2 handling
Knowledge sharing session on ‘Mitigation measures for gas quality and H2
handling’
Online

Agenda
Agenda
Introduction to gas quality variation and H2 impacts and principles for mitigation strategies 09:05 - 10:05
• Gas quality/hydrogen: Impact on combustion processes and principles of mitigation by Jörg Leicher
• For feedstock industries by Jochen Wagner
Session 1 - Case studies on end-users’ level: What are the principal mitigation options on the end-user side? 10:15 - 11:30
• Residential appliances: Gas adaptive systems by Philipp Woerner
• Self-regulated gas boilers able to cope with gas quality variation by Jean Schweitzer
• Wobbe Index Measurements and Combustion Control for Industries by Philippe Buchet
• Industrial feedstock processes - Lessons from the past in The Netherlands by Dirk-Jan Meuzelaar
• Power Generation Gas Turbines: Mitigation of Issues Associated with Gas Quality Variation and Hydrogen Addition by David Abbott
• Wobbe Index sensitivity reduction reciprocating engines by Jacob Klimstra
Coffee break 11:30 - 11:40
Session 2 - Case studies at grid level: What are the principal mitigation options at grid level? 11:40 - 12:55
• Possible mitigation measures – use cases at Fluxys Belgium by Quentin Degroote
• The static gradient splitter by Peter van Wesenbeeck
• Online tracking and forecasting of gas quality by Stefan Rickelt
• The French case by Alice Vatin
Concluding remarks 12:55 - 13:00

Introduction to gas quality variation and H2 impacts and principles for mitigation strategies

l www.gwi-essen.de
Gas quality/hydrogen: Impact on combustion processes and principles of mitigation
Jörg Leicher
Prime Movers’ Group, February 24th, 2021
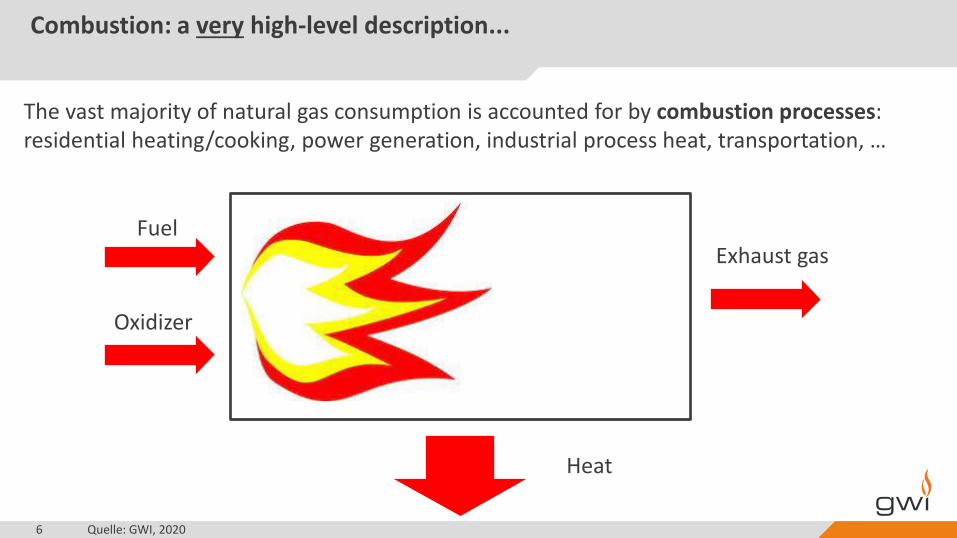
Combustion: a very high-level description...
6 Quelle: GWI, 2020
Fuel
Oxidizer
Exhaust gas
Heat
The vast majority of natural gas consumption is accounted for by combustion processes:residential heating/cooking, power generation, industrial process heat, transportation, …

Combustion and gas quality
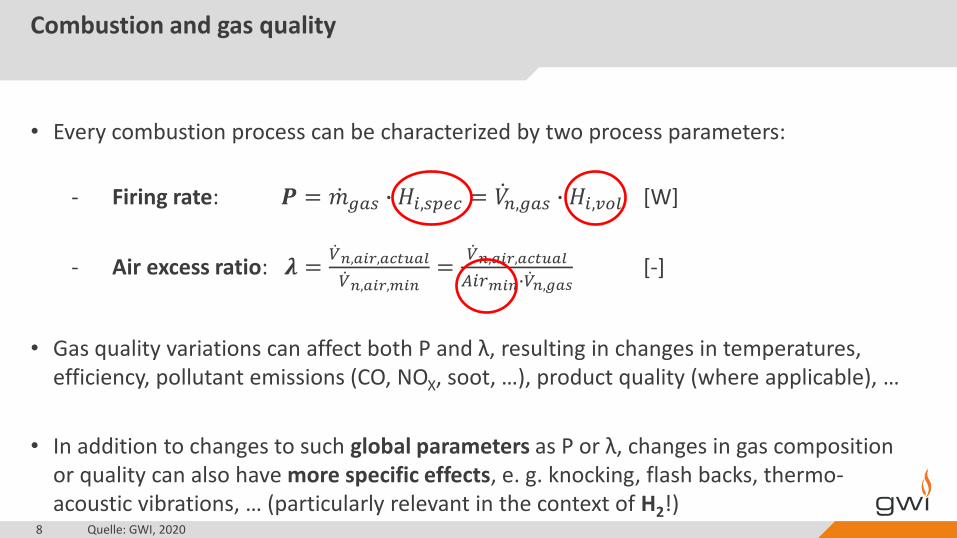
• Every combustion process can be characterized by two process parameters:
- Firing rate: 𝑷 = ሶ𝑚𝑔𝑎𝑠 ∙ 𝐻𝑖,𝑠𝑝𝑒𝑐 = ሶ𝑉𝑛,𝑔𝑎𝑠 ∙ 𝐻𝑖,𝑣𝑜𝑙 [W]
- Air excess ratio: 𝝀 =ሶ𝑉𝑛,𝑎𝑖𝑟,𝑎𝑐𝑡𝑢𝑎𝑙ሶ𝑉𝑛,𝑎𝑖𝑟,𝑚𝑖𝑛
=ሶ𝑉𝑛,𝑎𝑖𝑟,𝑎𝑐𝑡𝑢𝑎𝑙
𝐴𝑖𝑟𝑚𝑖𝑛∙ ሶ𝑉𝑛,𝑔𝑎𝑠[-]
7 Quelle: GWI, 2020
Unit CH4 H2 50 % CH4 / 50 % H2
Hi,vol MJ/m3 34.06 10.24 24.95
WS MJ/m3 50.64 45.78 44.56
Airmin m3/m3 9.524 2.381 5.952
@15 °C / 15 °C
Combustion and gas quality
• Every combustion process can be characterized by two process parameters:
- Firing rate: 𝑷 = ሶ𝑚𝑔𝑎𝑠 ∙ 𝐻𝑖,𝑠𝑝𝑒𝑐 = ሶ𝑉𝑛,𝑔𝑎𝑠 ∙ 𝐻𝑖,𝑣𝑜𝑙 [W]
- Air excess ratio: 𝝀 =ሶ𝑉𝑛,𝑎𝑖𝑟,𝑎𝑐𝑡𝑢𝑎𝑙ሶ𝑉𝑛,𝑎𝑖𝑟,𝑚𝑖𝑛
=ሶ𝑉𝑛,𝑎𝑖𝑟,𝑎𝑐𝑡𝑢𝑎𝑙
𝐴𝑖𝑟𝑚𝑖𝑛∙ ሶ𝑉𝑛,𝑔𝑎𝑠[-]
• Gas quality variations can affect both P and λ, resulting in changes in temperatures, efficiency, pollutant emissions (CO, NOX, soot, …), product quality (where applicable), …
• In addition to changes to such global parameters as P or λ, changes in gas composition or quality can also have more specific effects, e. g. knocking, flash backs, thermo-acoustic vibrations, … (particularly relevant in the context of H2!)
8 Quelle: GWI, 2020

Typical firing rates and air excess ratios (examples)
9 Quelle: GWI, 2020
Sou
rce:
Sie
me
ns
Sou
rce:
HV
G
Sou
rce:
Vai
llan
t
Residential heatingappliance
Industrial furnace Gas turbine forpower generation
P: < 70 kWλ: 1.2 - 1.4
P: 0.1 – 200+ MWλ: 1.05 - 1.15
P: < 1.5 GW (< 600 MWel)λ: ≈ 2.0

Why do we talk about Wobbe Indices?
• In many gas-fired applications, particularly residential appliances, the volume flow of fuel gas (and hence the firing rate) is controlled by the pressure in the nozzle of a burner and the nozzle diameter. The grid pressure can be a limiting factor.
• The Wobbe Index (WI) was introduced as a way to compare the impact of a fuel gas change on the heat input of such a system: if two gases have the same Wobbe Index, they will release the same amount of heat if they are burned at the same nozzle with the same nozzle pressure. Thus, the two gases are interchangeable for this system in terms of heat release. This is valid for residential or commercial appliances, but also many larger applications.
• The WI does only relate to the heat release, not to any other important aspects of combustion (emissions, efficiency, temperatures, …). Also, its meaningfulness is severely reduced if chemically very different fuel gases are compared (=> H2).
10 Quelle: GWI, 2020

The limits of the Wobbe Index
11 Quelle: GWI, 2020
Unit 100 % CH4 94 % CH4 / 6 % CO2 92 % CH4 / 8 % N2 100 % H2
WI MJ/m3 50.64 45.28 45.27 45.78
NCV MJ/m3 34.06 32.02 31.34 10.24
GCV MJ/m3 37.80 35.53 34.78 12.10
d - 0.5571 0.6157 0.5901 0.0698
Airmin m3/m3 9.524 8.952 8.762 2.381
Tad (λ = 1) °C 1982 1971 1974 2096
sL (λ = 1) cm/s 38.57 36.79 37.52 209
MN* - 100 105 99 0
@ 1
5 °
C /
15
°C
*: MWM method

Example: residential appliance without combustion control: effects of hydrogen admixture
12 Quelle: GWI, 2020
0
0.05
0.1
0.15
0.2
0.25
0.3
0
0.2
0.4
0.6
0.8
1
1.2
1.4
1.6
1.8
0 20 40 60
Fuel vo
lum
e flo
w [m
N3/h
]
Air
exece
ssra
tio
[-],
firi
ng
rate
[kW
]
H2 content [vol.-%]
P [kW] lambda [-] Vgas [m3/h]
• Firing rate: 𝑃2
𝑃1=
𝑊𝑖,2
𝑊𝑖,1
• Fuel volume flow: ሶ𝑉𝐺𝑎𝑠 =𝑃
𝐻𝑖
• Air excess ratio: 𝜆2
𝜆1=
𝐴𝑖𝑟𝑚𝑖𝑛,1
𝐴𝑖𝑟𝑚𝑖𝑛,2∙
𝑑2
𝑑1
• In the case of H2 admixture, the firing rate of the burner decreases with higher levels of H2, while the fuel volume flow increases.
• If Wi,2 > Wi,1(e. g. due to a change to a high-WI LNG), the situation is reversed:
- firing rate goes up- air excess ratio goes down(=> CO)
P(CH4) = 1 kWλ(CH4) = 1.2Vair = const
Source:THyGA Project

Additional aspects
• In addition to the impact of gas quality on main combustion parameters such as firing rate or air excess ratio, gas quality changes can also have more specific effects, often only affecting certain types of equipment, e. g.
- flash back or flame lift-off (relevant for premixed burners, e. g. in residential appliances or gas turbines)
- knocking, i. e. premature self-ignition due to compression (gas engines)- thermo-acousting vibrations (gas turbines)- hydrocarbon condensation (gas turbines)- …
• Often, these effects cannot be tied to global GQ criteria like WI or GCV, but are connected to the actual composition or require their own criteria, e. g. MN or C2+. H2 with its very different combustion characteristics can be very relevant here.
13 Quelle: GWI, 2020

Mitigation strategies
14

Mitigation strategies
• In principle, there are several options of how the impact of gas quality on an end-user‘s process and equipment can be mitigated, e.g.:
– a „robust“ setting of the application
– measurement and combustion control systems
– measurement and local gas conditioning (including preheating fuel gas)
– grid-level conditioning of gas
– grid level flow control to minimize local GQ fluctuations
• Not all approaches are equally viable. Often, solutions have to be tailored to specific applications, processes and locations.
15 Quelle: GWI, 2020

Robust settings: factory settings and test gases
• In the residential/commercial sector, appliances are (supposed to be) adjusted by the manufacturer and then sealed.
• Adjustment means that the nominal operational point of an appliance is set to a specified firing rate and air excess ratio. The air excess ratio is usually determined by measuring either the O2 or CO2 concentration in the flue gas. The volume flow of air is then tuned so that the measured concentration corresponds to a set point prescribed by the manufacturer.
• The adjustment is carried out with a well-defined reference gas (G 20, i. e. 100 % CH4, for H-gas regions; G 25, i. e. 86 % CH4, 14 % N2 for L-gas regions), and operational safetyof the appliance is tested with a number of limit gases, specified in EN 437.
16 Quelle: GWI, 2020

Reference and limit gases Group H (EN 437)
17 Quelle: GWI, 2020
Source: EN 437
G20: Airmin = 9.524 m3/m3 ; CARI = 12.76 m3/m3
G21: Airmin = 11.381 m3/m3 ; CARI = 13.726 m3/m3
G23: Airmin = 8.333 m3/m3 ; CARI = 10.681 m3/m3
CARI: Combustion Air Requirement Index:
𝐶𝐴𝑅𝐼 =𝐴𝑖𝑟𝑚𝑖𝑛
𝑑

Adjustment with reference and test gases: a thought experiment
• A residential combustion process (with constant air flow) is adjusted to λ = 1.35 with G 20 by the appliance manufacturer.It is then supplied with 2 limit gases, G 21 and G 23, to test for safety(incomplete combustion and flame lift respectively). What happens?
18 Quelle: GWI, 2020
• Thus: λG 21 = 1.25 ; λG 23 = 1.61 => the appliance is always safe, no danger of CO formation.
• Now, the same exercise, but this time with an initial λ = 1.05 (industrial setting):=> λG 21 = 0.98 ; λG 23 = 1.25
• The air excess ratio of the process shifts according to𝜆2
𝜆1=
𝐶𝐴𝑅𝐼1
𝐶𝐴𝑅𝐼2.

Factory settings and reference gases
• Using reference gases and factory settingsto mitigate gas quality fluctuations onlyworks in combination with high air excessratios and if one is not overly concernedabout NOX emissions.
• For industrial users, it is generally not an option, due to the inherent losses in efficiency and the likely increase in NOX.
• There is also the question how to readjustafter maintenance.
19 Quelle: GWI, 2020
0.8 1 1.2 1.4 1.6 1.8 2
CO
, NO
in f
lue
gas
Air excess ratio λ
CO NO

Combustion control via excess oxygen
20 Quelle: GWI, 2020
Oxidizer
Gas from the grid(variable WI/GCV, …)
l = 1.1
control
O2,exhaust, actual
O2,exhaust, target
Combustion chamber

Air excess ratio λ and excess oxygen
21 Quelle: GWI, 2020
0
2
4
6
8
10
12
14
1 1.1 1.2 1.3 1.4 1.5 1.6 1.7 1.8 1.9 2
Exce
ss o
xyge
n O
2,d
ry[v
ol.
-%]
Air excess ratio λ [-]
CH4 50 % CH4 / 50 % H2 H2 CO C3H8
It is possible – and indeed common practice – to adjustthe air excess ratio of a combustion process without knowingthe actual and current gas composition.

Combustion control in a residential appliance: effects of H2 admixture(flame ionization sensor)
22 Quelle: GWI, 2020
0
10
20
30
40
50
60
70
80
90
100
0.6
0.8
1.0
1.2
1.4
1.6
1.8
2.0
2.2
2.4
2.6
2.8
3.0
3.2
0 5000 10000 15000 20000 25000
CH
4[v
ol.-
%]
λ[-
], V
Gas
[m3/h
]
t[s]
VGas
QminQmax
λ
XCH4
complete λ-control partial λ-control
w/o control: λ = 1.7!
• Combustion controlsystems are usuallydesigned with certainfuel types in mind.
• These systems work wellwith „normal“ gas qualityvariations.
• If the fuel changes toodrastically, they mayrespond in unexpectedways.
Source: THyGA Project

Combustion control via local GQ measurement and excess oxygen
23 Quelle: GWI, 2020
Oxidizer
Gas from the gridvariable WI/GCV, …) O2,exhaust, actual
Controlsetpoints:
P, λ
gas
qu
alit
ym
easu
rem
ent
Vfuel
Vair
Combustion chamber

Impact on an industrial non-premixed burner system (CFD study)
24 Quelle: GWI, 2020
Russian H-Gas(P = 200 kW, λ = 1.1)
Reference case:
North Sea H-GasVolume flows constant(P = 208 kW, λ = 1.056)
↑ 4 % ↓ 4 %
No control:
North Sea H-Gas(P = 200 kW, λ = 1.1)Air and fuel volume flows adjusted
Control of firing rate and air excess ratio:
Δ ≈ 20 %
WS = 0.4 % Hi = 4 %

Effects of H2 admixture on a non-premixed burner (test rig experiments)
25 Quelle: GWI, 2020
Scenario I:no control intervention at all, i. e. volume flows ofboth fuel and air remain constant (worst case).
Scenario III:both burner firing rate and air excess ratio remainconstant, based on advanced gas quality monitoring(best case).
@ 1 vol.-% O2
Source: Leicher, J., Nowakowski, T., Giese, A., Görner, K., Hydrogen in natural gas: how does it impact industrial end users?,World Gas Conference 2018, Washington D.C., USA
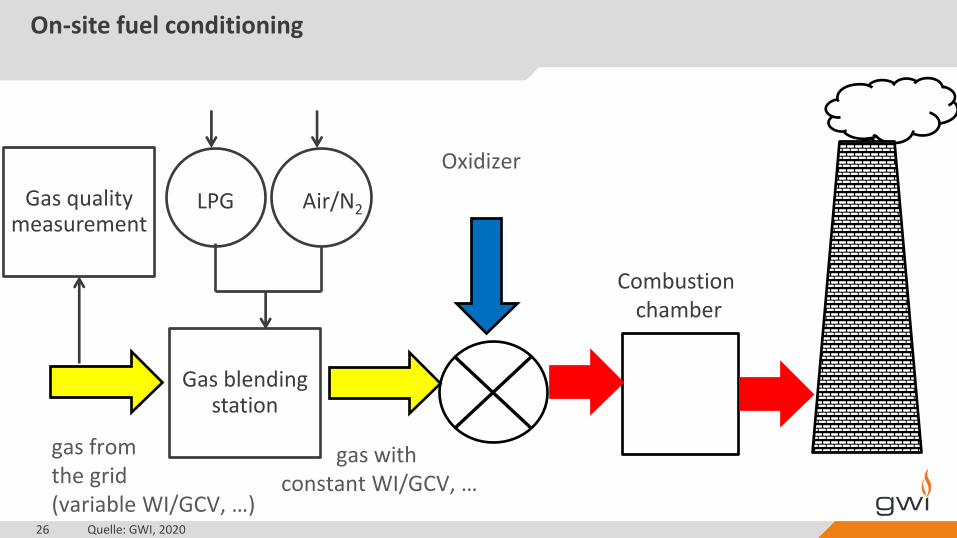
On-site fuel conditioning
26 Quelle: GWI, 2020
gas fromthe grid(variable WI/GCV, …)
gas withconstant WI/GCV, …
LPG Air/N2Gas quality
measurement
Gas blendingstation
Oxidizer
Combustionchamber

Fuel gas conditioning on-site
• Another option to compensate for gas quality fluctuations can be on-site fuel gas conditioning. Natural gas is blended with air or LPG to maintain a set NCV or WI.
• This usually is the more expensive approach, but it may be economically sensible if a system is extremely sensitive or contains a large number of burners, e. g. a feeder system in glass manufacturing.
27
Fuel gas conditioning a feeder (glass industry)
GCVRelevant process
temperatures
Source: Lantoine, L., Ourliac, M., Buchet, P., Wobbe Index Measurement and Control for Industry:A Mature Technology Facing New Challenges, IGRC 2017, Rio de Janeiro, Brazil

How not to control a furnace in times of varying gas qualities…
28 Quelle: GWI, 2020
Source: P. Hemmann, Regelungstechnische Lösungen zur vorausschauenden Kompensation schwankender Gasqualität Workshop "Erdgasbeschaffenheitsschwankungen in der Prozessindustrie - Hintergründe, Auswirkungen, Lösungsansätze“, Düsseldorf, Germany, 2018
≈5 %
GQ measurementdetects increased Hi
=> Vgas reduced
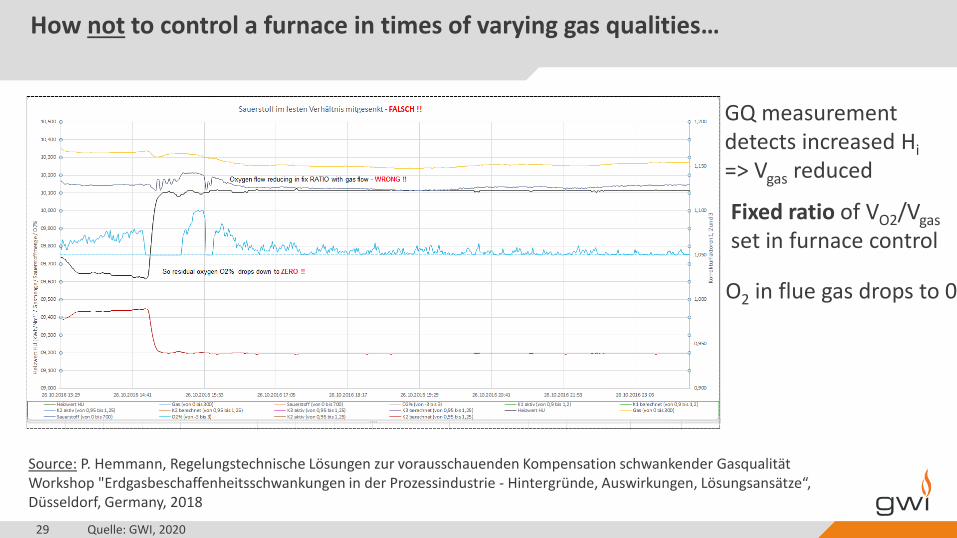
How not to control a furnace in times of varying gas qualities…
29 Quelle: GWI, 2020
Source: P. Hemmann, Regelungstechnische Lösungen zur vorausschauenden Kompensation schwankender Gasqualität Workshop "Erdgasbeschaffenheitsschwankungen in der Prozessindustrie - Hintergründe, Auswirkungen, Lösungsansätze“, Düsseldorf, Germany, 2018
GQ measurementdetects increased Hi
=> Vgas reduced
Fixed ratio of VO2/Vgas
set in furnace control
O2 in flue gas drops to 0
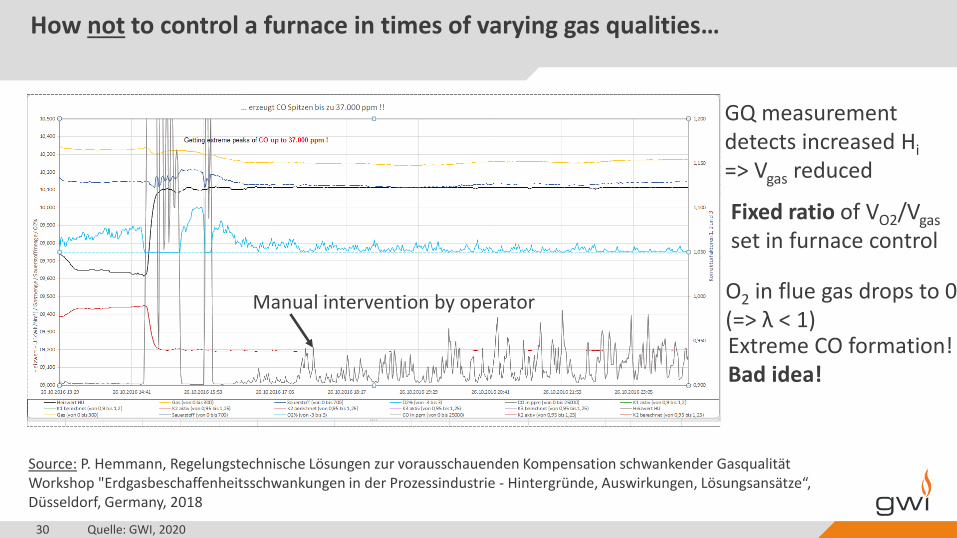
How not to control a furnace in times of varying gas qualities…
30 Quelle: GWI, 2020
Source: P. Hemmann, Regelungstechnische Lösungen zur vorausschauenden Kompensation schwankender Gasqualität Workshop "Erdgasbeschaffenheitsschwankungen in der Prozessindustrie - Hintergründe, Auswirkungen, Lösungsansätze“, Düsseldorf, Germany, 2018
GQ measurementdetects increased Hi
=> Vgas reduced
Fixed ratio of VO2/Vgas
set in furnace control
O2 in flue gas drops to 0(=> λ < 1)Extreme CO formation!Bad idea!
Manual intervention by operator
Conclusion
• Combustion processes are generally designed for a specified fuel. While a certain variation can usually be accomodated, there are limits, for reasons of safety, fitness for purpose, efficiency, emissions, … . These limits are very different for different applications. Some applications are more sensitive than others in terms of gas quality.
• While the Wobbe Index is generally used as the main gas interchangeability criterion, other criteria may also be relevant for various applications and technologies. H2 complicates matters significantly.
• There are options to mitigate the effects of gas quality changes on combustion applications, either by reducing the variations the equipment is exposed to (either on-site or on a grid level) or by using measurement and control technologies to re-adjust.
32 Quelle: GWI, 2020
Conclusions
• These measures are often very specialized and need to be tailored to the concrete application and process.
• There are physical and technological limits to what mitigation systems can do. Response times can be an important aspect here: some end-use applications require a very quick response. For others, a slower response may be sufficient.
• Technological solutions at the end-user level also need to fulfill additional requirements, e. g. in terms of safety (failsafe, redundancy), OPEX/CAPEX, maintenance, robustness, …
33 Quelle: GWI, 2020

Dr.-Ing. Jörg Leicher
Gas- und Wärme-Institut Essen e. V.
Hafenstrasse 101
45356 Essen, Germany
Tel.: +49 (0) 201 36 18 278
Mail: [email protected]
Thank you for your attention

Gas quality variation
Impact on feedstock usage
Prime Movers’ Group, 24th February 2021

Internal
Agenda
◼ Natural gas market and the chemical industry
◼ Gas quality – Challenges for the chemical industry
◼ Summary
36

Internal
Folie in Ursprungsform Reiter Start
Folienlayout wechseln Reiter Start
Textebene wechseln Reiter Start verringern
Aufzählungszeichen einrichten:Reiter Start→
→
→
→
aus der oberen Farbreihe der Designfarben(RGB 76 | 128 | 179) einfärben
37
Natural gas market and the chemical industry

Internal
Folie in Ursprungsform Reiter Start
Folienlayout wechseln Reiter Start
Textebene wechseln Reiter Start verringern
Aufzählungszeichen einrichten:Reiter Start→
→
→
→
aus der oberen Farbreihe der Designfarben(RGB 76 | 128 | 179) einfärben
3/4/202138
Natural gas market Europe
Approximately 80% of natural gas from few sources
*Source: Wood Mackenzie, IHS, BASF
own production 20%
imports (pipeline) 60%
Demand 2019*
5.300 TWh
20%
34%
21%
5%
20%
imports (LNG) 20%

Internal
Folie in Ursprungsform Reiter Start
Folienlayout wechseln Reiter Start
Textebene wechseln Reiter Start verringern
Aufzählungszeichen einrichten:Reiter Start→
→
→
→
aus der oberen Farbreihe der Designfarben(RGB 76 | 128 | 179) einfärben
◼ Share of chemical industry
Europe: ca. 11% (ca. 590 TWh)
Germany: ca. 12% (ca. 120 TWh)
◼ Usage
Ca. 75% heating (combustion)
Ca. 25% feedstock (chemical processes)
39
Chemical industry – natural gas usage

Internal
Folie in Ursprungsform Reiter Start
Folienlayout wechseln Reiter Start
Textebene wechseln Reiter Start verringern
Aufzählungszeichen einrichten:Reiter Start→
→
→
→
aus der oberen Farbreihe der Designfarben(RGB 76 | 128 | 179) einfärben
◼ LNG, Biogas/Biomethane and Hydrogen can lead to more fluctuating gas quality in Europe
◼ Reasons
LNG → broad spectrum of chemical composition
Biogas/Biomethane, Hydrogen⚫ Risk of fluctuating injection → Risk of stepchanges in gas quality at exit points close by injection
points of Biomethane/Hydrogen productions
◼ Critical components for chemical industry
Hydrogen, Nitrogen, Oxygen, higher Hydrocarbons and Sulphur
40
General

Internal
Folie in Ursprungsform Reiter Start
Folienlayout wechseln Reiter Start
Textebene wechseln Reiter Start verringern
Aufzählungszeichen einrichten:Reiter Start→
→
→
→
aus der oberen Farbreihe der Designfarben(RGB 76 | 128 | 179) einfärben
41
General
Source: DVGW G260

Internal
Folie in Ursprungsform Reiter Start
Folienlayout wechseln Reiter Start
Textebene wechseln Reiter Start verringern
Aufzählungszeichen einrichten:Reiter Start→
→
→
→
aus der oberen Farbreihe der Designfarben(RGB 76 | 128 | 179) einfärben
42
General
Source: Guidebook to Gas Interchangeability and Gas Quality by BP/IGU

Internal
Folie in Ursprungsform Reiter Start
Folienlayout wechseln Reiter Start
Textebene wechseln Reiter Start verringern
Aufzählungszeichen einrichten:Reiter Start→
→
→
→
aus der oberen Farbreihe der Designfarben(RGB 76 | 128 | 179) einfärben
3/4/202143
Gas quality – Challenges for the chemical industry

Internal
Folie in Ursprungsform Reiter Start
Folienlayout wechseln Reiter Start
Textebene wechseln Reiter Start verringern
Aufzählungszeichen einrichten:Reiter Start→
→
→
→
aus der oberen Farbreihe der Designfarben(RGB 76 | 128 | 179) einfärben
◼ Natural gas is used as important raw material / feedstock in following chemical processes
Steam methane reforming (Syngas)⚫ Methanol⚫ Ammonia
Acetylene
Hydrocyanic acid
◼ These chemicals are „base chemicals“, which are used in several value chains
Disruptions in these processes lead to disruptions in subsequent processes
3/4/202144
Feedstock usage

Internal
Folie in Ursprungsform Reiter Start
Folienlayout wechseln Reiter Start
Textebene wechseln Reiter Start verringern
Aufzählungszeichen einrichten:Reiter Start→
→
→
→
aus der oberen Farbreihe der Designfarben(RGB 76 | 128 | 179) einfärben
◼ Steam methane reforming
◼ Production of Carbon Monoxide (CO) and Hydrogen (H2), which are used in several subsequent processes to produce chemicals e.g., Methanol or Ammonia
45
Feedstock usage
Source: Ullmann's Encyclopedia of Industrial Chemistry, VCI

Internal
Folie in Ursprungsform Reiter Start
Folienlayout wechseln Reiter Start
Textebene wechseln Reiter Start verringern
Aufzählungszeichen einrichten:Reiter Start→
→
→
→
aus der oberen Farbreihe der Designfarben(RGB 76 | 128 | 179) einfärben
◼ Steam methane reforming
Nitrogen → reduction of plant capacity / production loss, CO might not be within specification (separation of Nitrogen from Methane difficult, requiring additional steps)
Oxygen ⚫ Oxidation and deactivation of highly active catalysts (risk of safety shutdowns due to strongly
exothermic reaction) leading to disruptions and/or plant damage⚫ in case of hydrogenating desulphurisation by adding Hydrogen, risk of uncontrollable adiabatic
temperature increase in the reactor possibly exceeding the design temperature → damage and mechanical failure of the reactor (detonation)
Higher hydrocarbons → risk of coking of the catalyst in the reformer (can be handled via upstream „pre-reforming“)
Sulphur → catalyst poison (natural gas is pretreated in a desulphurisation before usage as feedstock / raw material in catalytic processes)
3/4/202146
Feedstock usage

Internal
Folie in Ursprungsform Reiter Start
Folienlayout wechseln Reiter Start
Textebene wechseln Reiter Start verringern
Aufzählungszeichen einrichten:Reiter Start→
→
→
→
aus der oberen Farbreihe der Designfarben(RGB 76 | 128 | 179) einfärben
◼ Acetylene
High temperature pyrolysis of methane
Used as intermediate to produce polymers (e.g., Polyurethanes, Polybutylene terephthalate), adhesives, coatings etc.
3/4/202147
Feedstock usage
Source: Ullmann's Encyclopedia of Industrial Chemistry

Internal
Folie in Ursprungsform Reiter Start
Folienlayout wechseln Reiter Start
Textebene wechseln Reiter Start verringern
Aufzählungszeichen einrichten:Reiter Start→
→
→
→
aus der oberen Farbreihe der Designfarben(RGB 76 | 128 | 179) einfärben
◼ Acetylene
Nitrogen → yield loss, reduction of plant capacity / production loss (also in subsequent steps)
Oxygen → at concentrations > 1 Vol% unwanted side reactions in the preheating step and therefore yield loss
Higher Hydrocarbons → increased coking in the preheating step
Hydrogen → Risk of pre-ignition leading to safety shutdown
3/4/202148
Feedstock usage

Internal
Folie in Ursprungsform Reiter Start
Folienlayout wechseln Reiter Start
Textebene wechseln Reiter Start verringern
Aufzählungszeichen einrichten:Reiter Start→
→
→
→
aus der oberen Farbreihe der Designfarben(RGB 76 | 128 | 179) einfärben
◼ Hydrocyanic acid
Using Methane with Ammonia to produce Hydrocyanic Acid e.g., Andrussow- or BMA-process
Used as intermediate to produce polymers (e.g., Polyamides), animal feed, pesticides etc.
3/4/202149
Feedstock usage
Source: Ullmann's Encyclopedia of Industrial Chemistry

Internal
Folie in Ursprungsform Reiter Start
Folienlayout wechseln Reiter Start
Textebene wechseln Reiter Start verringern
Aufzählungszeichen einrichten:Reiter Start→
→
→
→
aus der oberen Farbreihe der Designfarben(RGB 76 | 128 | 179) einfärben
◼ Hydrocyanic acid
Nitrogen → reduction of plant capacity / production loss
Oxygen → Oxidation and deactivation of highly active catalysts (risk of safety shutdowns due to strongly exothermic reaction) leading to disruptions and/or plant damage
Higher Hydrocarbons → Risk of coking of catalyst
Sulphur → Catalyst poison
3/4/202150
Feedstock usage

Internal
Folie in Ursprungsform Reiter Start
Folienlayout wechseln Reiter Start
Textebene wechseln Reiter Start verringern
Aufzählungszeichen einrichten:Reiter Start→
→
→
→
aus der oberen Farbreihe der Designfarben(RGB 76 | 128 | 179) einfärben
3/4/202151
Summary

Internal
Folie in Ursprungsform Reiter Start
Folienlayout wechseln Reiter Start
Textebene wechseln Reiter Start verringern
Aufzählungszeichen einrichten:Reiter Start→
→
→
→
aus der oberen Farbreihe der Designfarben(RGB 76 | 128 | 179) einfärben
◼ Fluctuations in gas quality due to higher LNG-imports, Biomethane- and possibly Hydrogen-injections to be expected
◼ Separation of critical components for usage of natural gas in chemical processes not or only with increased efforts (including significant investments) possible
◼ By using additional analysis and control efforts in chemical processes plants can be safely shut down and severe damages can be avoided
3/4/202152
Natural gas quality – future challenges
Requires feasibility studies and impact analysis

Internal

Q&A session

Session 1 - Case studies on end-users' level: What are the principal mitigation options on the end-user side?


Modern condensing gas appliances are compatible with up to 20% H2, even without adjustment*
Appliance safety
H2-
NG
20
%
Function,
robustness
H2-
NG
20%Features
H2-
NG
20%
Appliances
equipped
with
electronic
combustion
controls
(gas-
adaptive)
Exhaust blockage O Ignition behavior + CO/NOx Emissions +
Condensate blockage O Ionization signal - Power -
Exhaust recirculation O Calibration O Efficiency O
Flame flashback O Air number O Noise/Ignition +
Late ignition - Modulation O Thermo acoustics O
Appliances
equipped
with
pneumatic
electronic
gas/air
ratio
Exhaust blockage O Ignition behavior + CO/NOx Emissions +
Condensate blockage O Ionization signal - Power -
Exhaust recirculation O Calibration O Efficiency O
Flame flashback O Air number O Noise/Ignition +
Late ignition O Modulation O Thermo acoustics O
O = no difference compared to 100% natural gas combustion
+ / - = improvement /drawback compared to NG only
* = Manufacturers’ laboratory data on residential appliances (<70kW), with G20 settings

Gas appliances are increasingly fit for hydrogen –snapshot
Old installed stock: 10 % H2
•Influence of 10 % H2 on gas appliances is low
•Assessment: Existing equipment can tolerate up to 10 % H2
•It is being investigated whether the H2 share can be extended to 20 %
Modern technologies:
up to 20% H2
•Safety and robustness are fully given
•H2 provides positive contribution to emission reduction (CO/NOx)
•Gas-adaptive devices: In the future compensation air number/power also possible with H2 (power output will be maintained)
•Certification ongoing
•Standardisation activities ongoing
•Appliances >70kW (commercial/industrial use) still need to be tested to up to 20%H2
In the coming years: 100% H2 technologies
•Adaptation of components for H2 is required (ionisation etc)
•100% Hydrogen boilers & hydrogen-ready boilers with a conversion kit are in development
•Standardisation activities ongoing
•Demonstration in pilot projects ongoing / planned

Example of mitigation measure for end-use: Gas-adaptive systems
1. What end-use applications are gas adaptive systems good for?
Gas adaptive systems, e.g. based on the ionisation
signal of the flame, are used for fully premix burners,
such as:
- Condensing gas boilers <70kW
- Cooking appliances

2. Framing the gas quality issue for end-use appliances
Changes in Wobbe Index or high fluctuations of hydrogen blends may influence:
- Ignition behaviour
- Emissions
- Efficiency
- Combustion parameters
- Reliability
➢ Gas adaptive systems have been identified by manufacturers as a possible
mitigation measure.
Example of mitigation measure for end-use: Gas-adaptive systems

3. Description of the gas quality issue
Climate targets could only be reached with green gases and hydrogen content. That causes higher Wobbe Index extreme values and leads to larger air ratio extreme values.
Example of mitigation measure for end-use: Gas-adaptive systems

4. What is the chosen mitigation measure?
Ionisation-based gas adaptive systems keep the air/ gas ratio
(l value) constant (output remains constant even though gas
quality changes).
Independently from the gas quality (from G271 to G21) or
hydrogen blends up to 20% the combustion parameters remain
stable.
Safe combustion is guaranteed.
Example of mitigation measure for end-use: Gas-adaptive systems

l
io
.
io.
l spHow do ionisation-based gas adaptive systems work?
- Each ionisation value corresponds to a certain l value
- Wobbe => l =>Io=>gas=>Io=> lOK
- Wobbe => l =>Io=>gas =>Io => lOK
Example of mitigation measure for end-use: Gas-adaptive systems

6. Potential of gas-adaptive systems in the EU market
Advantages:
Minimal impact of product costs, as mainly standard components are
used
Several systems/suppliers available, such as:
- SCOT (resideo)
- iXQ (resideo)
- Sitherm Pro (Siemens)
- Elektra CMS (SIT)
- Egarc (B&P)
- Ebm-papst
Disadvantages:
- Some appliances in the installed stock cannot be converted
Example of mitigation measure for end-use: Gas-adaptive systems

Gas adaptive systems are not the only solution for end-use GQ issues
Other mitigation measures are possible:
- For the installed stock, manual adjustment to G20 setting based
on real time Wobbe Index value (accepting certain fluctuations
on power output)
- Communication of gas quality data on daily basis from network
operators for commercial & industrial appliances
- Research ongoing on gas quality sensors

Self-regulated gas boilers able to cope with gas
quality variation: State of the art and performances
Project Partners Project Sponsors:
CETIAT, Nourreddine Mostefaoui Gasunie Transport Services,
ENGIE, Stéphane Carpentier Jelle Lieffering
E.ON, Petra Nitschke-Kowsky National Grid Gas Distribution Limited
DGC, Jean Schweitzer Lorna Millington
Gas.be, Olivier Thibaut
2017-2019
Tests of 5 condensing boilers
equipped with combustion controls
67
• what’s the application?• what is the GQ problem?• what kind of problem is caused by
gas quality changes
Domestic and commercial gas boilers
Safety & Variation of performances with GQ

Results from GasQual on CB´s
with variation of Wobbe number
68
• CO depends strongly on WS and increases on both
sides of the range, effect depends construction.
• NOx increases with increasing WS
• The effect of Ws on boiler efficiency is negligible
• New CB´s adjusted to G20 normally cope to the WS
range of group H.
• Installed aged CB´s might be restricted to WS
• Installed CB´s might be not any more adjusted to
G20 but to a local gas quality and loose by that their
flexibility to the group H range of WS.
The technology of combustion-controlled appliances
may overcome these difficulties, as they adjust
steadily to the nominal operation point.
Model data based on test

69
• what’s the application?• what is the GQ problem?• what kind of problem is caused by
gas quality changes• what is the chosen mitigation
measure and why was it chosen?
Domestic and commercial gas boilers
Safety & Variation of performances with GQ
Combustion control based on ionisation

70
• what’s the application?• what is the GQ problem?• what kind of problem is caused by
gas quality changes• what is the chosen mitigation
measure and why was it chosen?• how was it implemented and what
are the performances?
Domestic and commercial gas boilers
Safety & Variation of performances with GQ
Combustion control (CC) based on ionisationAir ratio constant

Gases used for the testing
71
Test Gases over the whole
range of natural gases.
Including the German group LL
Including hydrogen admixture
up to 30%.
Including biomethane - here
CH4 with 10% CO2

Air factor is maintained with CC
Air factor quite constant over the whole range of
Natural Gases with Ws from 34.3 MJ/m³ to 54.7
MJ/m³.
WITH CCWITOUT CC (tests from Gasqual)
Appliances are safe & performances are maintained

Air Factor change with H2
73
Ionization Combustion
Control generally doesn't
work well with H2 for but
for one of the boilers the
air ratio measured is
almost constant.

Operation under rapid change
All boilers are able to cope with
instantaneous jumps of gas quality from
minimum to maximum and vice versa
without any interruption of operation. The
time to return to nominal operation
(stabilization time) is between 0,5 and 2
minutes (3 minutes was observed in one
case)

75
• what’s the application?• what is the GQ problem?• what kind of problem is caused by
gas quality changes• what is the chosen mitigation
measure and why was it chosen?• how was it implemented and what
are the performances?• costs• main recommendation/lessons
learnt?
Domestic and commercial gas boilers
Safety & Variation of performances with GQ
Combustion control based on ionisation
Air ratio constant

Costs Conclusion Recomendations
According interview with manufacturers the mass production of CC and
implementation is not giving a significant cost increase to the boiler
Beside this, boilers with combustion controls are potentially easier to install
and maintain = savings on servicing
The testing of boilers equipped with combustion controls (ionization) have
proved that they can cope with very large variations of natural gas (from
lowest L to highest H!). Some can also cope with H2.
Having new boilers equipped with CC would be recommended!
Checking retrofit possibilities?


Reserve slides

Technology of CCCB´s - Sensors
79
upstream of combustion zone
• Gas chromatography
• Mass Spectrometry
• Infrared Spectrograph
• Wobbelis (engie)
• Micro Wobbe Index Meter
• Several in development
in the combustion zone
• Flame Ionization
• Flame temperature
monitoring
• IR emission
• Flame shape
downstream of combustion
zone
• O2-Measurement
• CO-Sensor
Overview on Gas Quality Sensors, Device …
Currently three of these sensors are used in combustion controlled
condensing boilers.

Realized sytems in CCCB based
on Ionization Signal (Examples)
80Source: www.kromschroeder.de/fileadmin/kromschroeder/Produkte/scot/scot_22_04_2010_de_web.swf https://www.youtube.com/watch?v=dxLs6PNI4eo
SCOT system
Kromschröder
Lambda Pro system
Viessmann
Sitherm Pro system
Siemens
VESTASIT system
SIT
Design of the realizations differ in evaluation of the
signal, design of recalibration program and
electronic control.

Manufacturer of CCCB
81
Manufacturer Load rangeYear of
market entry
Ariston ? ?
Bosch Thermotechnik Buderus up to 20 kW 2017
Bosch Thermotechnik Junkers up to 20 kW 2017
Brötje 15 kW-38 kW 2006
Chappee 12 kW 2016
Hansa up to 36 kW 2018
Interdomo 15 kW-68 kW 2012
Rotex (Daikin) 15 kW – 28 kW 2017
Max Weishaupt 15 kW-60 kW 2001
Vaillant up to 28 kW 2003
Viessmann 13 kW–150 kW 2005
Wolf 15 kW-30 kW 2013
Combustion controlled
condensing boilers are on
the market since 2001.
Meanwhile 12 different
manufacturers offer CCCB
on the European market.

WOBBE INDEX Measurements and Combustion Control for Industries:
ENGIE LAB CRIGEN WOBBELYS Solutions: A Mature (>15 years) range of Technologies
facing these new challenges
Senior Global expert - Director of research
programs - ENGIE

ENGIE Lab CRIGEN in a Nutshell
ENGIE Lab CRIGEN
83
Master tomorrow
technologies, bring them to maturity and prepare the zero carbon transition
€35 millionrevenues from
30 countries
180 employees
100Patents in portfolio
ISO 9001certified
37%
63%
37 yrsAverage age
11 nationalities
51 PhD
10 Co-operativeeducation students
19 Trainees
Unique testing facilitiesin Europe
NEW ENERGY RESOURCES LABS
Biogas and Biomass
Hydrogen
Liquefaction
ENGIE Lab Singapore
10 Labs
NEW ENERGY USES LABS
Future Buildings & Cities
Future Industry Environment & Society
EMERGING TECHNOLOGIES LABS
Drones & Robots
Nanotech, Sensors & Wireless
Computer Science & AI

Distributed Fuel-Gas quality variations in Europe/world are trending to increase !
84
A consequence of :
•The increase of the natural gas demand :
✓ Diversification of natural gas sources at deliverable points
✓ Improvement of the interconnected gas Grids and more LNG resources
• New trends with Energy transition pathway:
✓ Future will to “greener” distributed Fuel–gas (Biogas, bio-methane, H2…)
✓ Decentralization and diversity of future Green Fuel-gas
Today - EASEE-gas CBP on gas quality :
✓ 47< Wobbe Index (WI) <54 MJ (+/-7%)
✓ 0,55<rd<0,7 (no spec. for GCV)
For ex: in Italy (SNAM Rete Gas specifications) :
• 47.3<WI<53.3 MJ/Sm3
• 35.0<GCV<45.3 MJ/Sm3
More than 8% of variations is an issues for several industrial processes!
37
37,5
38
38,5
39
39,5
40
40,5
41
21/08/2006 21/08/2007 20/08/2008 20/08/2009
GC
V (M
J/Sm
3)
GCV variations in Bari
8%
Examples of:• GCV variations in
Europe (reddots)
• and Variation of Wobbe index with NG+H2 blend (bleu dots)
~ 5%

« Sensitivity » of gas-fired thermal process from variations in gas quality
In industry, some processes are more sensitive
to changes in gas quality ; e.g. where :
• The flame is used as a tool (e.g. flame work in glassware
industry),
• Process temperatures are very high
(e.g. melting glass furnaces or glass feeders),
• Combustion products are used in the processing (e.g.
direct contact firing and thermal treatment, in ceramics or
metallurgy),
• Combustion sparks off a chemical reaction (e.g. lime
production).
Main impacts are related to metering of fuel-gas
quality and Control of the fuel-gas Combustion
85
Variations in GCV or Wobbe index
Thermal process < 3% 3 to 5% 5 to 10%
Shell boilers
Air drying or drying oven
Water-tube boilers
Non ferrous metal melting
Metals reheating
Glass heating, decorating
Tiles and bricks firing
Gas turbines (premix burners)
Metals heat treatments
Lime or alumina calcining
Finest ceramics firing (china)
Glass flame working (bulbs)
Glass melting and feeders
Not sensitive Little sensitive Sensitive

In industrial processes : Control of the Combustion parameters are Keys factors in the performance of thermal processes (environmental and
Energy efficiency and profitability)
86
AirAtm. pressureTemperatureHygrometry
Fuel-GasPressure and Temperature
Wobbe 1 or GCV (gross calorific value)
Actuators adjustments
Temperature
Atmosphere
Heat release
Excess of air
Process controlCombustion control
Manual adjustments
1 Wobbe Iindex = GCV/√density : main combustion characteristic of a fuel gas
➔ Continuous measurements of GCV or WI is essential for :
➔ Good design of burners /combustion systems
➔ Good control of Power input and combustion quality
are function of Wobbe Index or GCV

Example of impacts of fuel-gas quality in high temperature process industry
Process impacts:✓ Increase of Energy consumption (2-
10%),
✓ Increase Maintenance costs (Burner
adjustments ex: Feeders, cleaning nose burner…),
✓ Production issues: ❖ Variation of temperature of parison
=> variation of glass viscosity ;❖ Increase of production returns
(~several %) ;❖ Non-compliance with the
specifications of the production …)
GCV variations in container glass plant (France)

ENGIE lab Combustion control in the industrial gas-fired processes – a Complete range of ENGIE SOLUTIONS
System for natural gas WOBBE/ GCV index
measuring
New systems (Coming soon):
• WobHylis® : An innovative device developed for Wobbe & GCV index for NG & natural gas-H2 blends
• J-NET® : An innovative device developed for NG & natural gas-H2 blends for distribution Grid
WOBBELIS POCCILIS
System for natural gas
Wobbe index controlling
INDELIS

Combustion control with an GCV/WI correction
89
2 solutions :
• If gas flow measured within a diaphragm or aventuri, then use WI (WOBBELIS)
• If gas flow measured within a volumetric meter,then use GCV (POCCILIS)
• Example : control flow sheet for the glassmelting furnace
Main features :
❖ Measure by correlation, without combustion orgas analyze (Engie patents)
❖ Small footprint, weight 9 kg ; IP65 cabinet❖ Pressure supply > 1bar❖ Accuracy better than 1% for all the natural
gases supplied in Europe❖ Self calibration and automatic restart❖ Continuous output signal 4-20 mA (or
digital connexion in option)❖ MMI by touch screen❖ Complying with EMC European Standards
Gas flow
control
Gas flow
setpoint
Calorific flow rate setpoint
Natural
gas
Air flow
setpoint
Excess of air
setpoint
Air
WOBBELIS
Qair
mes
Qgas
mes
Air flow
control
FE
FE
Example : WOBBELIS® & POCCILIS® solutions implementation

0
25
50
75
100
125
150
175
200
225
250
0:00 2:00 4:00 6:00 8:00 10:00 12:00 14:00 16:00 18:00 20:00 22:00 0:00
Flo
w r
ate
m3/h
14,2
14,3
14,4
14,5
14,6
14,7
14,8
14,9
15
15,1
15,2
Wo
bb
e (
kW
h/m
3)
Qgaz m3/h
10Qair Cons
W kWh/m3
control startup < 4 mn
calibration
INDELIS® : correction through regulation of the Wobbe index
A Wobbe index control station developed by ENGIE :
• Controlled injection of a small quantity of air into the gas
• Easily available up to 1000 Sm3/h of fuel-gas, to define above
• accurate control (<1%) of WI from 10 to 100% of the nominal plant gas flow rate
90
FIC air
EVS
PSH
PI
PI
PSL
DP
compressed airNatural Gas
WT
controlled Wobbe index measure
gas flow rate measure
flow control of the
injected air
Monitoring and
controls
➔ For container glass : melting &/or glass feeders/forhearth
➔ Ceramics appliances implementation of Indelis reduce the reject rate very significantly

WobHylis® : An innovative item developed for natural gas-H2 blends
91
Designed and patented by
Crigen, this prototype's
development is under progress
within a partnership integrating
the provider Tecora.
Item patented under reference
N°WO2018122490A1 and finally
named WobHylis®.
To enhance the measurement devices portfolio
already managed by Engie Lab Crigen, a new
apparatus has been developed to replace the
Wobbelis range within a unique adaptative
instrument.
WobHylis
NEW
Ongoing Project:➢ Several experimental tests
achieved in 2020 within blends
up to 20% of H2.
➢ Enhancements in progress on
industrialization steps to
guarantee the most reliable H2
measurement.
WobHylis® : a complete product to determine
precise Wobbe index and calorific value of blends
from Natural Gas and H2 by algorithmic
correlation-based and introducing a continuous
online H2 measurement.
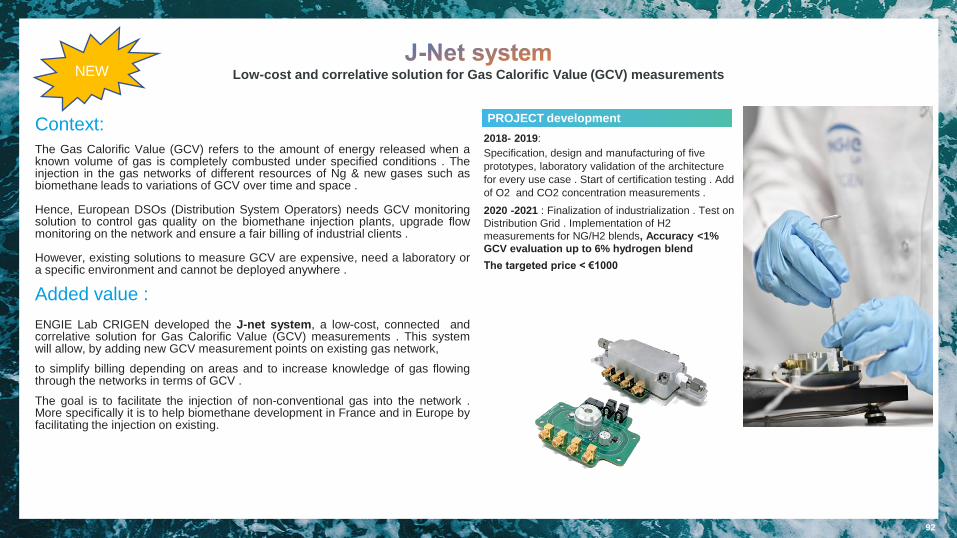
Low-cost and correlative solution for Gas Calorific Value (GCV) measurements
Context:
The Gas Calorific Value (GCV) refers to the amount of energy released when aknown volume of gas is completely combusted under specified conditions . Theinjection in the gas networks of different resources of Ng & new gases such asbiomethane leads to variations of GCV over time and space .
Hence, European DSOs (Distribution System Operators) needs GCV monitoringsolution to control gas quality on the biomethane injection plants, upgrade flowmonitoring on the network and ensure a fair billing of industrial clients .
However, existing solutions to measure GCV are expensive, need a laboratory ora specific environment and cannot be deployed anywhere .
Added value :
ENGIE Lab CRIGEN developed the J-net system, a low-cost, connected andcorrelative solution for Gas Calorific Value (GCV) measurements . This systemwill allow, by adding new GCV measurement points on existing gas network,
to simplify billing depending on areas and to increase knowledge of gas flowingthrough the networks in terms of GCV .
The goal is to facilitate the injection of non-conventional gas into the network .More specifically it is to help biomethane development in France and in Europe byfacilitating the injection on existing.
92
NEW
PROJECT development
2018- 2019:
Specification, design and manufacturing of five
prototypes, laboratory validation of the architecture
for every use case . Start of certification testing . Add
of O2 and CO2 concentration measurements .
2020 -2021 : Finalization of industrialization . Test on
Distribution Grid . Implementation of H2
measurements for NG/H2 blends, Accuracy <1%
GCV evaluation up to 6% hydrogen blend
The targeted price < €1000

Conclusions (1/2)
THE ENGIE SOLUTION SERVICE OFFERS
➢ Diagnostics on site of instrumentation and control system used for the process
➢ Installation, starting up, hiring and maintenance of the appliance by ENGIE TEAM
➢ Specific ENGIE services contract without need of Customer’s capex and including maintenance and calibration
➢Technical specifications :
✓ IP65 cabinet, MMI by touch screen
✓ Accuracy better than 1% for majority of natural gases
✓ Self smart calibration and automatic restart
✓ Turndown: from 8% to 100% of a nominal gas flow rate
➢Stated benefits :
✓Energy savings (~2-5%)
✓Reduce of the number of operations for burners adjustments,
✓And the most important : improvement of the quality in production (more than 50% for specific cases).
WOBBELIS® ; POCCILIS® ; or INDELIS® ;WOBHYLIS; ® J-NET ® : a complete range of solutions for Combustion control vs fuel-gas quality variations

ConclusionsENGIE lab CRIGEN :A complete range of ENGIE SOLUTIONS for
variations of distributed gas quality
A complete Range of solutions for management of variations of gas quality
In the last 15 years more than 60 industrial references into:
⚫ Glass industries (for supplying melting glass feeders), many references (Owens-Illinois; Niproglass; SGD, Geresheimer…) ;
⚫ Ceramic industries ( batch furnaces: Bernardaud, Jars, Doralaine ...)
⚫ Steel industries : ArcelorMittal, Ascometal, Alcan…
⚫ Lime industries : Bocahut
⚫ Other appliances : CHP plant …
WOBBELIS POCCILIS INDELIS WOBHYLIS J-NET


Prime Movers’ Group
Gas quality & H2 handingknowledge sharing session on mitigating measures
Lessons from the past in
The Netherlands
24 February 2021 Dirk Jan Meuzelaar

Increase upper limit Wobbe Index in NLOctober 2014 Dutch ‘regulation’ gas quality
• Concern and uncertainty H-gas customers after announcement in 2009 to increase upper limit
of the WI from 54 to 55,7 MJ/m3,
– motive: EASEE-gas CBP and new LNG terminal (GATE)
– Adjustment appliances before1 Oct 2014 (Dutch MR gas quality entry into force)• 80 H-gas customers consuming all H-gas ~equal to G-gas consumption
• Various regional bandwidths depending on regional entry specifications
– G-gas WI Bandwidth 43,46 – 44,41 MJ/m3 (25:0) unchanged
• Responsibility:
– MS (Ministry Economic Affairs): gas quality is political decision
– TSO: to deliver gas according political specifications (we are only a transport company for a quality neutral gas
market)
– Customers: Responsible to accept all gas quality specifications and its variations between the widest legal
bandwidths + forced to sign a connection ‘agreement’
We could not refuse the gas
We could not choose our gas
TSO did not know which gas would be injected
We could not send the gas back
HOW COULD WE MANAGE OUR REPONIBILITY
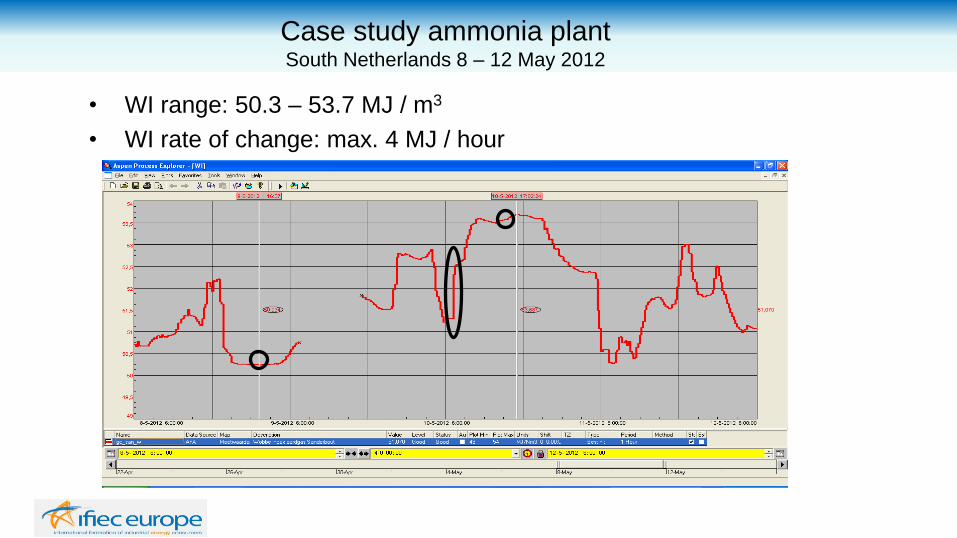
Case study ammonia plant South Netherlands 8 – 12 May 2012
• WI range: 50.3 – 53.7 MJ / m3
• WI rate of change: max. 4 MJ / hour

O2 % after combustion
If O2 % after combustion < 1 % → CO formation & flame instability
= ! SAFETY RISK !
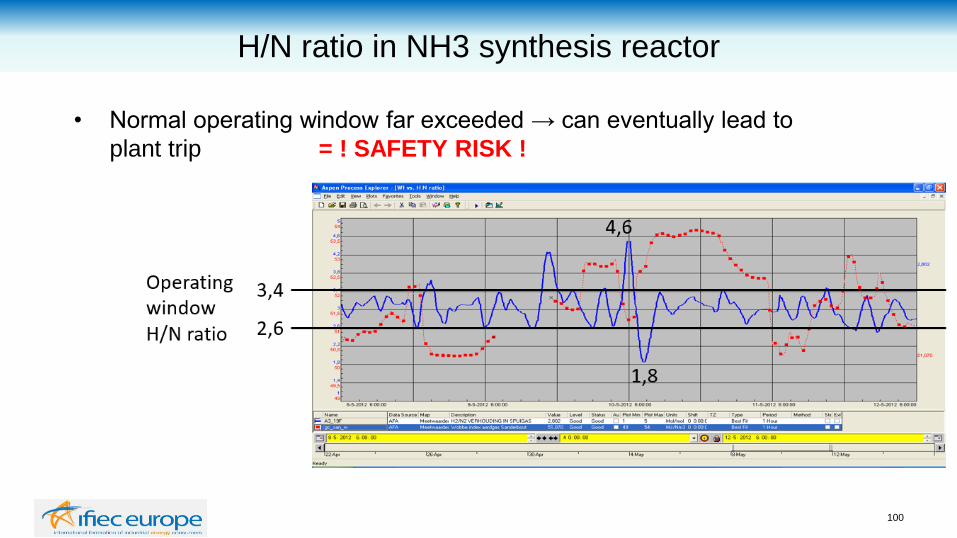
H/N ratio in NH3 synthesis reactor
100
• Normal operating window far exceeded → can eventually lead to
plant trip = ! SAFETY RISK !

Take aways and mitigating measures
– High uncertainty if control room operator would be able to accommodate future fast changes
– Additional investments needed to maintain the same level of • Safety
• Reliability
• Efficiency
• Emission should stay between the limits of the permits (LtO)
– Investments in Advanced Process Control based on Masse Spectrometer analysis, GasTurbine modifications,……and some more
– no safeguards for future gases
101
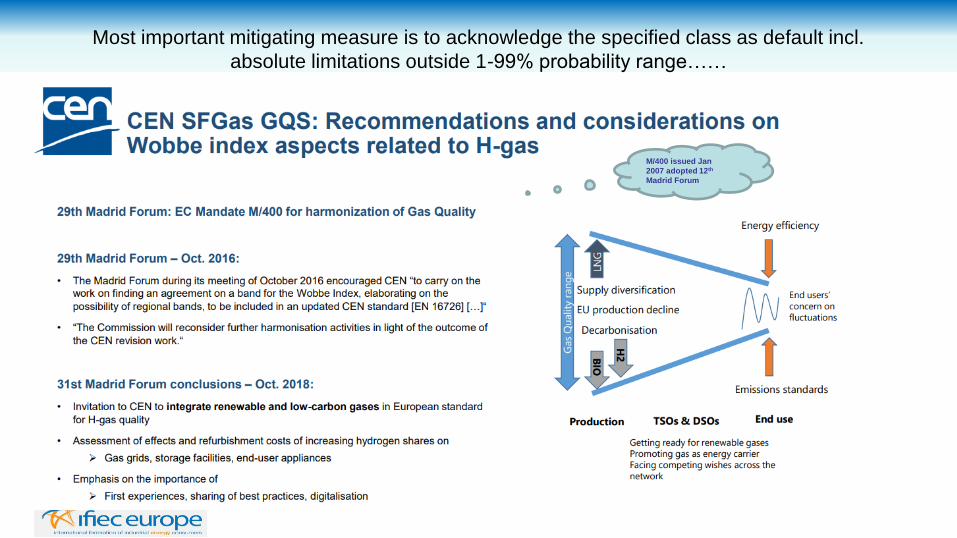
Most important mitigating measure is to acknowledge the specified class as default incl.
absolute limitations outside 1-99% probability range……
M/400 issued Jan
2007 adopted 12th
Madrid Forum

…. which will also limit the risks of high variations and comply with the conclusions of the MF of
April 2015
27th Madrid Forum April 2015: • Encourages relevant stakeholders at national level to pursue the assessment of
potential future instabilities in the Wobbe values and the impacts that has on the safe and secure operation on gas appliances and processes.

Preconditions for identifying mitigating measures at the exit
1. Legal network codes with precise specifications about future gasses
• Predictability: we need to know the gas composition in advance;
H2 and Biomethane have seasonal profiles (storages?)
2. Inform the public in case of a change of the gas quality at the exits
• as soon as TSOs/DSOs are aware of a foreseeable gas quality change outside the range
of the downstream system in the past
3. Near real time information is very much appreciated
4. Responsibilities should be clear, and risk should be manageable
• Risk management always start with the source and never at of pipe (measure of last
resort)
5. Compensation costs (Causer pay principle)
6. No ‘one size fits all’ solution for industrial customers
• We need long validity duration of classes also with respect to long lead times (major
adjustments only in 5years turnaround cycle)
104

Dr David Abbott
ETN Emeritus Member
Visiting Fellow: Cranfield University
Technical Consultant: Uniper Technologies Ltd

Gas turbines are often considered to particularly sensitive to changes in gas quality and H2 addition. Why?
• Gas Turbines combustors are highly tuned to give maximum cycle efficiency and low emissions:
➢ The most common low emissions combustion technology is lean premixed combustion
❖ Prone to thermoacoustic pressure oscillations (pulsations/dynamics) and flame stability issues (flashback, blow-off)
❖ Combustor tuning is optimised for a particular conditions including fuel composition: therefore they are sensitive to changing conditions
• Continuous high pressure combustion
➢ Energy density is much greater (typically 10 to 30 times) than atmospheric pressure combustion
❖ If issues occur damage happens more rapidly than for atmospheric pressure combustion
24th February Gas Turbines: GQ and H2 Issues
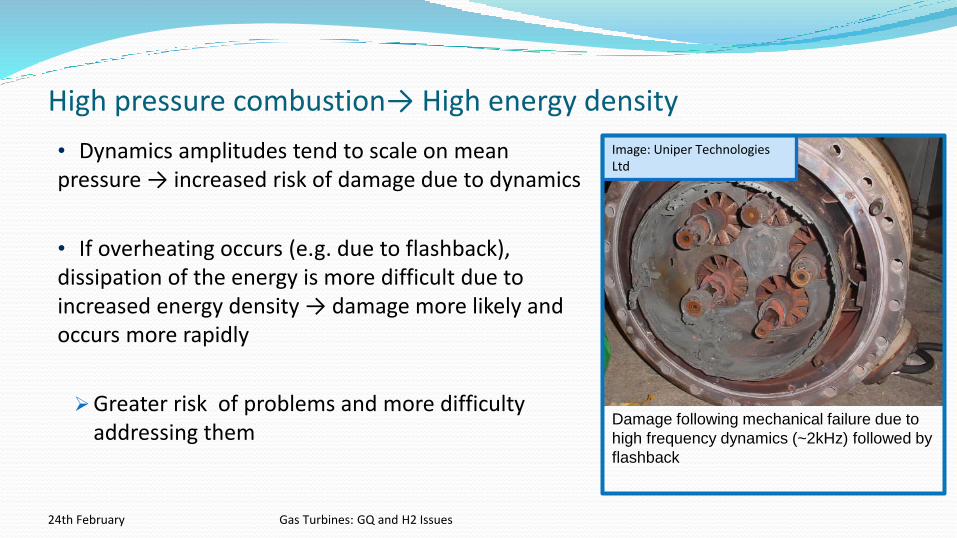
• Dynamics amplitudes tend to scale on mean pressure → increased risk of damage due to dynamics
• If overheating occurs (e.g. due to flashback), dissipation of the energy is more difficult due to increased energy density → damage more likely and occurs more rapidly
➢Greater risk of problems and more difficulty addressing them
High pressure combustion→ High energy density
24th February Gas Turbines: GQ and H2 Issues
Image: Uniper Technologies Ltd
Damage following mechanical failure due to
high frequency dynamics (~2kHz) followed by
flashback

Issues due to changing Wobbe Index and fuel composition
1. NOX emissions increase as deviation from optimum fuel composition (WI, higher hydrocarbon content etc.) increases
2. Dynamics increase as deviation from optimum fuel composition (WI, higher hydrocarbon content etc.) increases
3. Flame stability issues leading to dynamics and part load CO problems with Wobbe Index or low reactivity fuels
4. Component overheating due to changes in flame shape and position (including flashback) due to changes in composition, particularly high reactivity fuels
➢ Gas Turbine operational restrictions, de-loads and trips (1,2,3,4)
➢ Increased component wear, reduced life, increased maintenance requirements (2,4)
➢ Catastrophic component failure (2,4)
24th February Gas Turbines: GQ and H2 Issues
If the rate of change of WI is too high, control systems cannot respond quickly enough: OEM specifications range from 0.5%/s to 0.5%/min [1]BUT: Difficulties is defining a meaningful rate of change

24th February Gas Turbines: GQ and H2 Issues

Mitigation measures (1)
• What can be done in principle?
➢ Modify the fuel properties
➢ Modify the combustion system
➢ Control it differently
• Measure Wobbe Index and change the effective WI using variable fuel heating
➢ Relatively low cost
➢ Application only useful for systems particularly sensitive to WI
➢ Not effective in reactivity related issues (will not help with H2)
• Combustion system redesign
➢ Has effectively eliminated most flashback issues, but may not be the case for H2
➢ Improvements in stability, emissions and dynamics
24th February Gas Turbines: GQ and H2 Issues

Mitigation measures (2)• Measurement of full fuel composition and compensation through control
➢ Issues with speed of composition measurement
• Rapid measurement of key fuel properties: e.g. Higher hydrocarbon content: compensate using variable control parameters
➢ System specific applications, e.g. sequential combustion
• Control system response to changes in gas turbine behaviour (particularly emissions and dynamics) without fuel composition or property measurement
• Closed loop control of dynamics
• Automatic tuning systems
a) Closed loop control of dynamics and/or emissions according to a fixed set of rules
b) Closed loop control of dynamics and/or emissions through model based control using self teaching algorithms
c) AI based systems
➢ Can be very effective
➢ Most OEMs and some 3rd party suppliers offer auto-tuning options for some gas turbines
24th February Gas Turbines: GQ and H2 Issues

Hydrogen
• The above issues and mitigation measure apply equally to fuel variation caused by the addition of hydrogen,
➢ BUT: the complexity of the problem is increased due the additional variability and the very different combustion properties of hydrogen
• Gas turbine fuel specifications applicable to most of the existing low emissions fleet typically allow from trace to ~5vol% H2 with some allowing in excess of 20vol% [3]
➢ OEMs are revisiting fuel specifications and allowing increased hydrogen for some systems and are developing upgrades to allow further increases
➢ OEMs are investigating alternative combustion and control concepts for high hydrogen
➢ It is currently not clear what level of hydrogen blending would be generally acceptable or what level/range of hydrogen addition can practicably be accommodated
➢ Possible issues associated with alternative fuels for starting
24th February Gas Turbines: GQ and H2 Issues
Impact of hydrogen on flame shape (Shanbhogue et al [4]

Summary
• A range of mitigation measures exist for the main issues associated gas quality variation, BUT:
➢ Due to the wide range of designs and technologies in the existing fleet, suitable measures/upgrades are not available for all the current gas turbines
❖ Some plant may not be able to operate economically with greater fuel quality variation
❖ Issues with hydrogen are greater and many gas turbines will not be able to operate with high levels of hydrogen
➢ Even were emissions and dynamics can be controlled within “acceptable” limits, increased fuel variation will lead to increased overall emissions and increased component wear
➢Many issues associated with using hydrogen blends are not fully understood and need further investigation
24th February Gas Turbines: GQ and H2 Issues

References
1. European Turbine Network Position Paper, The Impact of Natural Gas Quality on Gas Turbine Performance, February 2009
2. D J Abbott , J P Bowers, and S R James, Impact of Natural Gas Composition Variations on the Operation of Gas Turbines for Power Generation, 6th International Gas Turbine Conference (IGTC12), October 2012, Brussels, Belgium, Paper ID Number: 27-IGT12
3. David Abbott, The Challenges for Gas Turbine Operators of Changing Fuel Compositions and the Availability of Alternative Fuels, 8th International Gas Turbine Conference (IGTC16), October 2016, Brussels, Belgium, Paper ID Number 79-IGTC16
4. S.J.Shanbhogue, Y.S.Sanusi, S.Taamallah, M.A.Habib, E.M.A.Mokheimer, A.F.Ghoniem, Flame macrostructures, combustion instability and extinction strain scaling in swirl-stabilized premixed CH 4 /H 2 combustion, Combustion and Flame 163 (2016) 494–507
24th February Gas Turbines: GQ and H2 Issues

Wobbe Index sensitivity reduction reciprocating engines
February 24, 2021
Jacob Klimstra

Not a single engine technologyGas-diesel for accepting a wide range of gas qualities (e.g. flare gas)Gas injection at 350 bar together with diesel fuel Only economic at well heads for avoiding flaring and producing electricity.
Duel-fuel for achieving high availability in case of gas supply failure and rapid response. High compression ratio needed for diesel ignition and therefore sensitive to WI increases. Applications at larger hospitals (emergency power) and in ships.
Spark-ignited- open chamber, swirl chamber, pre-chamber- rich burn, lean burn

BMEP reduction means more expensive engine + lower fuel efficiency

The carburettor and Wobbe Index
Δp
Wobbe = Hi / √ ρgas/ρair
Hi = lower calorific value (MJ/m3)
ρ = density (kg/m3)
V
P = V . Hi V = c √ Δp/
ρgas
Throttle valve
air
gas
carburettor engine
l = c ( Tgas/Tair)
Main adjustment screw
4-3-2021 118Jacob Klimstra Consultancy
l1 = Wobbe/Wobbe1 . l

Adjusting the lambda to Wobbe Index changes
Throttle valve
l1 = Wobbe/Wobbe1 . l
air
gas
carburettor engine
l = c ( Tgas/Tair)
Main adjustment screw
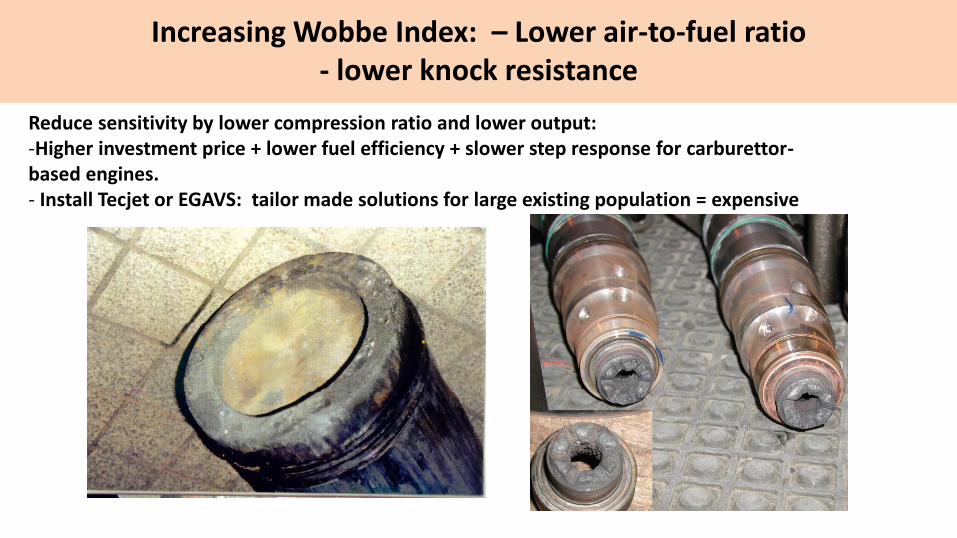
Increasing Wobbe Index: – Lower air-to-fuel ratio- lower knock resistance
Reduce sensitivity by lower compression ratio and lower output:-Higher investment price + lower fuel efficiency + slower step response for carburettor-based engines. - Install Tecjet or EGAVS: tailor made solutions for large existing population = expensive
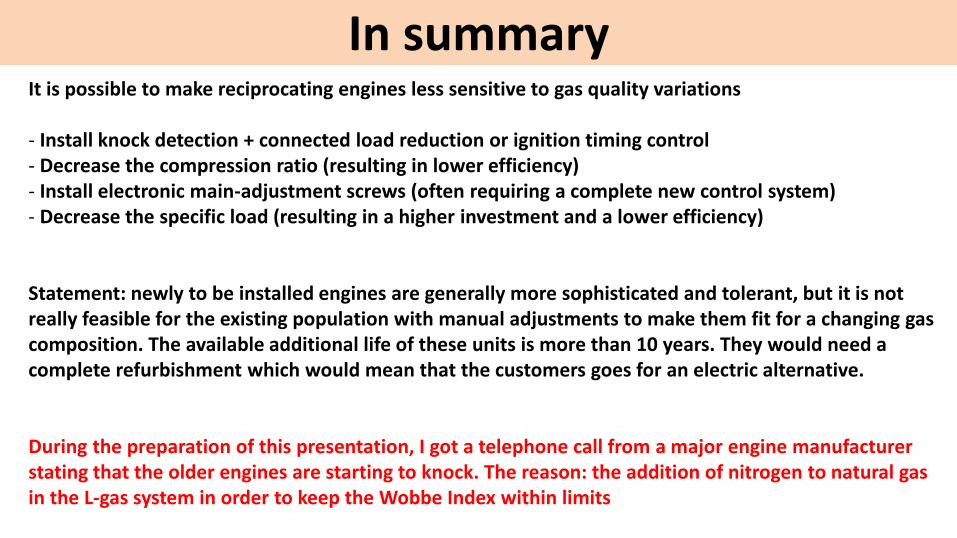
In summaryIt is possible to make reciprocating engines less sensitive to gas quality variations
- Install knock detection + connected load reduction or ignition timing control- Decrease the compression ratio (resulting in lower efficiency)- Install electronic main-adjustment screws (often requiring a complete new control system)- Decrease the specific load (resulting in a higher investment and a lower efficiency)
Statement: newly to be installed engines are generally more sophisticated and tolerant, but it is not really feasible for the existing population with manual adjustments to make them fit for a changing gas composition. The available additional life of these units is more than 10 years. They would need a complete refurbishment which would mean that the customers goes for an electric alternative.
During the preparation of this presentation, I got a telephone call from a major engine manufacturer stating that the older engines are starting to knock. The reason: the addition of nitrogen to natural gas in the L-gas system in order to keep the Wobbe Index within limits

Bibliography
1. John Oakley, ed, 'Fuel Flexible Energy Generation', Woodhead Publishing series in Energy, number 91, 2016, ISBN 978-1-78242-378-2
2. Christos A. Frangopoulos ed. 'Cogeneration - Technologies, Optimisation and Implementation', The Institution of Engineering and
Technology, 2017, ISBN 978-1-78561-055-4
3. Jacob Klimstra, 'Power Supply Challenges - solutions for integrating renewables', printed by Arkmedia, Vaasa, 2014, ISBN 978-952-93-
3634-0
4. John B. Heywood, 'Internal Combustion Engines Fundamentals', Mc. GrawHill Book Company, 1988.
5. Jacob Klimstra (Gasunie), Angel Benito Harnaez (Enagas), Wim H. Bouwman (Gastec), Antoine Gerard (Distrigas), Vittoriuo Quinto
(SNAM), Graham Robers (BG Technology) and Hans-Jürgen Schollmeyer (Ruhrgas), 'Classification methods for the knock resistance of
gaseous fuels - an attempt towards unification', ASME paper No. 99-ICE-214, 1999 Technical Fall Conference, Ann Arbor, Michigan, 1999.
6. Jacob Klimstra, 'Interchangeability of Gaseous Fuels - The Importance of the Wobbe Index', Paper 861578, SAE International Fuyls and
Lubricants Meeting, Philadelphia, Pennsylvania, October 6-9, 1986.
7. Jacob Klimstra, 'Catalystic Converters for Natural Gas Fueled Engines - A Measurement and Control Problem', Paper 872165, SAE
International Fuels and Lubricants Meeting, Toronto, Ontario, November 2-5, 1987.

Q&A session

Coffee break
See you at 11:50 CET

Session 2 - Case studies at grid level: What are the principal mitigation options at grid level?

24/02/2021
PMG – Possible mitigation measures – use cases at Fluxys Belgium

1. Mitigation measure at a biomethane plant : lower CO2 limit and ramp up/down spreading

20210224 - PMG Possible mitigation measures – Use cases at Fluxys Belgium
1. Mitigation measure at a biomethane plant : lower CO2 limit and ramp
up/down spreading
Sensitive
end user
Existing
situation
Specified class
Unit MJ/m³ (25,0)

20210224 - PMG Possible mitigation measures – Use cases at Fluxys Belgium
1. Mitigation measure at a biomethane plant : lower CO2 limit and ramp
up/down spreading
Sensitive
end user
New biomethane
project ?
Limit on
WI variations ?
?
O2 content (10 ppm) ?
Biomethan
e plant
Unit MJ/m³
(25,0)

20210224 - PMG Possible mitigation measures – Use cases at Fluxys Belgium
1. Mitigation measure at a biomethane plant : lower CO2 limit and ramp
up/down spreading
Biomethan
e plant
Sensitive
end user
10% of the time → pipeline
gas
90% of the time →
biomethane
10% of the time → pipeline gas
90% of the time → mix of pipeline
gas and biomethane
Flow and gas
quality analysis
Specified class
Extended class
Unit MJ/m³
(25,0)

C3H8 0% → 3%
CO2 2,5% → 0,5%
20210224 - PMG Possible mitigation measures – Use cases at Fluxys Belgium
1. Mitigation measure at a biomethane plant : lower CO2 limit and ramp
up/down spreading
Mitigation measures
(WI Range)
CO2 option preferred
by biomethane
producer (0,5% possible with
membrane technology at reasonable cost)
Unit MJ/m³
(25,0)

20210224 - PMG Possible mitigation measures – Use cases at Fluxys Belgium
1. Mitigation measure at a biomethane plant : lower CO2 limit and ramp
up/down spreading
Mitigation measures
(WI variations)
CONCLUSIONS : - TSO already takes measures to limit gas quality variations for sensitive end users- Case by case analysis is needed (flows and gas quality)- Reference to existing situation (considered as acceptable) is key
without mitigation
measure : more
variations, especially >
1 MJ
Large WI variations mostly
due to ramp-up/ramp-down
phases biomethane plant
Ramp-up/ramp-down
spreading over several
hours effectively reduce
large WI variations
Reducing the CO2 is more
effective than adding
C3H8 to decrease WI
variations
With a mix of ramp-
up/ramp-down spreading
with reduced
specification for CO2, WI
variations are smaller than
the existing situation for
the sensitive end user
Unit MJ/m³
(25,0)

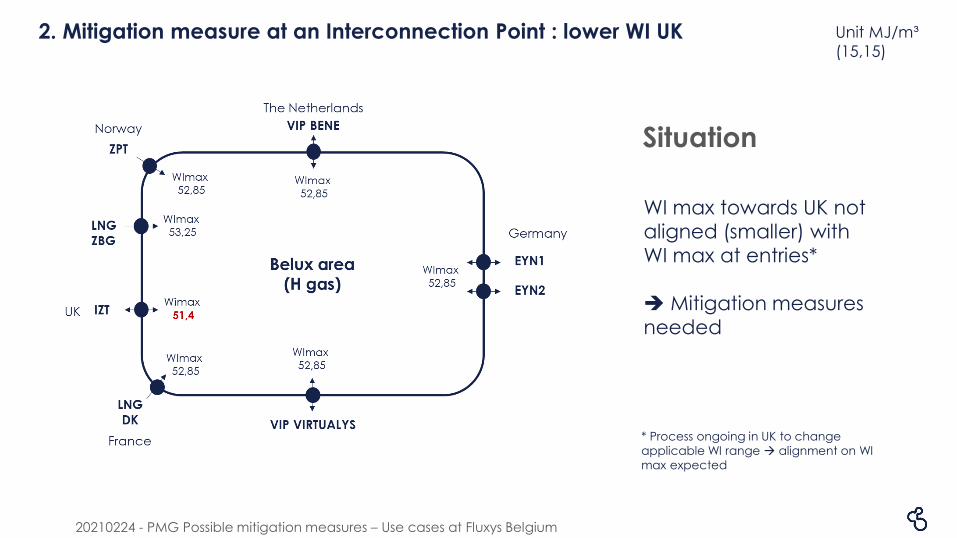
2. Mitigation measure at an Interconnection Point : lower WI UK
20210224 - PMG Possible mitigation measures – Use cases at Fluxys Belgium
2. Mitigation measure at an Interconnection Point : lower WI UK
Situation
Unit MJ/m³
(15,15)
WI max towards UK not
aligned (smaller) with
WI max at entries*
➔ Mitigation measures
needed
* Process ongoing in UK to change
applicable WI range → alignment on WI
max expected

20210224 - PMG Possible mitigation measures – Use cases at Fluxys Belgium
2. Mitigation measure at an Interconnection Point : Lower WI UK
Mitigation measures
Unit MJ/m³
(15,15)
Swapping a flow with a
too high WI with a flow
with an acceptable WI
1
2
3
4
Blending two flows so
that the mix has the right
WI
Ballasting NG with N2
to decrease its WI (at
LNG ZBG or in network)
Gas quality constraints
Options never
used so far(Available since Oct 2012)

20210224 - PMG Possible mitigation measures – Use cases at Fluxys Belgium
2. Mitigation measure at an Interconnection Point : Lower WI UK
Gas quality constraints
Unit MJ/m³
(15,15)
If other options (1→ 3) not sufficient :
1. Identification of quantities that could not be swapped, blended or ballasted with N2
2. Identification of network users exporting gas to UK
3. Identification of the “polluting IPs” where gas enters the system with a WI > WI max UK
4. Interruption of entry nominations of those network users on those IPs (pro rata)
5. To respect their balancing obligations, network users that were interrupted can either
• Reduce their exit nomination @ IZT (towards UK)
• Increase their nominations @ IPs with WI < WI max UK
Process fully automated but never used until now
CONCLUSIONS :
- TSO already takes measures to properly handle the gas quality
- Market driven mitigation measures can also be effective to help solve certain gas quality issues (but it
might impact the free flow of gas between MS)


Prime Movers' Group: Mitigating measures for GQ & H2 handling
The static gradient splitter
Groningen, 23 February 2021

Static Gradient Splitter
Functional specification
▪ Applicable up-, mid and downstream
▪ The static splitter is shaped like a ladder
▪ Design inputs: maximum flow, pressure, expected & desired gradients
▪ Flow distribution through branches determined by flow restrictions
▪ Avoid flow induced pulsations
▪ More branches possible but equal flow distribution becomes more difficult –Alternative more mixing organs in series
▪ Pressure drop causing possible additional costs
L2 L3
Flow restriction
2/3 Q 1/3 QQ
1/3 Q 1/3 Q
Flow restriction
1/3 Q

Static Gradient Splitter
Principle
The gas flow is broken up into several part streams, one or more parts of which gets a delay (detour) and subsequently is/are blended into the stream that didn’t take a detour.

Static Gradient Splitter
Entry/Exit behaviour

Static Gradient Splitter
An example
▪ Design inputs
▪ Q: 30.000 m3/h (n) @ 20 bar(g)
▪ D: DN 300 -> v: 6 m/s
▪ QDentry : 3 MJ/m3 (n) – peak disturbation
▪ QDexit : 1 MJ/m3 (n)
▪ Cost indication
▪ 300.000 – 500.000 EUR
▪ Remarks
▪ Available space may be leading
▪ Timescale measure: minutes
▪ Flow distribution is almost independent of flow
▪ Installation downstream of exit point in case of frontal flow situation
60 m 30 m
Flow restriction
4 m/s 2 m/s6 m/s
10.000 m3/h
Flow restriction
15 s 15 s
DN 300 10.000 m3/h
Feed A Feed B
Exit

Online tracking and forecasting of gas quality
Dr. Stefan Rickelt, SmartSim GmbH
Prime movers’ group, 24.02.2021

Gas quality tracking
144
• Applies real data as input datavolumes, pressures, gas quality…
• allows a dynamic simulation typically in hourly resolution
• gives TSOs/DSOs a clear picture about the gas distribution of a past period
• example: gas quality tracking of city grid of Malmö, Sweden
• capacity planning simulations provide a static steady-state simulation for a scenario (coldest/hottest day)

State of the art
145
Today
• Important advances of simulation techniques during last years
• Some years ago, gas quality tracking and online simulation were only applied by TSOs
• More and more DSO also apply gas quality tracking in grids where exit points have no hourly volume metering
• First implementations in city grids
• Simulations at hourly resolutionsome online systems provide 3 minutes resolution (unvalidated data)

Progress in simulation tools
146
Next years
• Gas quality tracking feasible for more and more complex gas networks
• Forecasting as further development of gas quality tracking
key for developments are grid operators’ demands
e.g. forecasting for Wobbe Index exit classification for customers/exit nodes
and requirements
• temporal resolution
• accuracy for gas quality data

Grid simulations tools
Input data
• Grid topology
• volume flows at entry and exit points
• yearly consumption/standard load profiles at exit points where no volume meters are available
• gas qualities (CV) at all entry points
147
Hs,1
≈ ≈
city grid factory
tran
smis
sio
n g
rid
regional distribution grid
Biogas-plant
V1 V2
VRLM
Hs,2
100 % natural gas mixing zone 100 % biomethaneCalculation
• provides output datamax. in temporal resolution of input data
→Measured data set possible resolution and accuracy/uncertainty of simulation
Biogas-plant
≈ ≈
city grid factory
tran
smis
sio
n g
rid
regional distribution grid
Hs,1
Hs,1 Hs,1 Hs,mix Hs,2
V1 V2
VRLM
Hs,2
100 % natural gas mixing zone 100 % biomethane

Key questions
148
What time resolution is expected?few seconds, 3, 15 or 60 minutes?
What accuracy level is required? ±2 % for Wobbe-Index and calorific value?

Influence of measured data
149
Temporal resolution
a. Volume metersMeters at DSO level or at large customers measure continuously but transfer data on an hourly basisMany customers have yearly meter reading. Hourly consumption can be derived.
b. Gas quality measurement with GCmeasurement every three minutes → time delay from measurement time + additional delay for gas sample to travel to GC
c. Data needs to be transferred, processed, e.g. corrected and simulation has to proceed

Influence of measured data
150
Simulation GC measurement
CV
, kW
h/m
³
Uncertainties
• of input data govern uncertainty of gas quality calculation
• added from simulation tools is small
• have large impact on temporal resolution of gas quality calculation
Example
deviation of 0.1 bar at pressure measurement at entry point
1. 80 bar transmission grid, flow velocity 5 m/sdistance between entry and exit point 100 km,travel time: 2000 s, resulting deviation: 25 s
2. 4 bar distribution grid, flow velocity 0.1 m/sdistance between entry and exit point100 km, travel time: 285 h, resulting deviation: 7 h

Conclusions
151
• Important advances of simulation techniques during last years
• Ongoing advances in the next years: grid complexity, data handling, simulation efficiency
• Systems rely on quality of input data (temporal resolution and accuracy)
• Challenges in online systems: instantaneous handling of missing and implausible input data
• Forecasting: some inevitable limitations due to unforeseeable incidents: dropout of biomethane production or of large customer


Study case of FranceMitigation measures – what is
possible already on the grid
24/02/21

154
2 TSO : TEREGA & GRTgaz
1 main DSO, GRDF, with 22
smaller GRD
> 37 000 km transmission
network length
> 200 000 km distribution
network length
with access to:
▪ 8 interconnection points
▪ 4 LNG terminals
▪ 14 UGS (STORENGY and
TEREGA)
3 reverse flows sites between
TSO/DSO (as Q1 2021)
Biomethane injection sites (as
Q1 2021)
• 195 on DSO level
• 23 on TSO level
1000 industrial end-users on
TSO level including 14 CCGT
Power Plants
11 Mil residential customers
French situation – Key figures
│ Knowledge session on mitigation measures – 24/02/21
│ Knowledge session on mitigation measures – 24/02/21 │ Niveau d’accessibilité : Public : [X ] 155
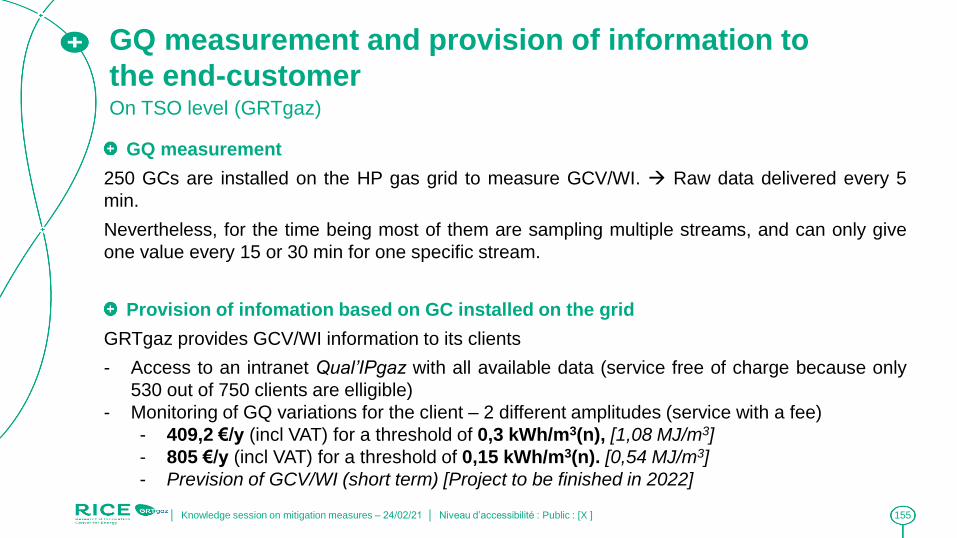
GQ measurement and provision of information to
the end-customerOn TSO level (GRTgaz)
GQ measurement
250 GCs are installed on the HP gas grid to measure GCV/WI. → Raw data delivered every 5
min.
Nevertheless, for the time being most of them are sampling multiple streams, and can only give
one value every 15 or 30 min for one specific stream.
Provision of infomation based on GC installed on the grid
GRTgaz provides GCV/WI information to its clients
- Access to an intranet Qual’IPgaz with all available data (service free of charge because only
530 out of 750 clients are elligible)
- Monitoring of GQ variations for the client – 2 different amplitudes (service with a fee)
- 409,2 €/y (incl VAT) for a threshold of 0,3 kWh/m3(n), [1,08 MJ/m3]
- 805 €/y (incl VAT) for a threshold of 0,15 kWh/m3(n). [0,54 MJ/m3]
- Prevision of GCV/WI (short term) [Project to be finished in 2022]

│ Titre - Date │ Niveau d’accessibilité : Public : [ ] Interne : [ ] Restreint : [ ] Secret : [ ] 156
GRTgaz
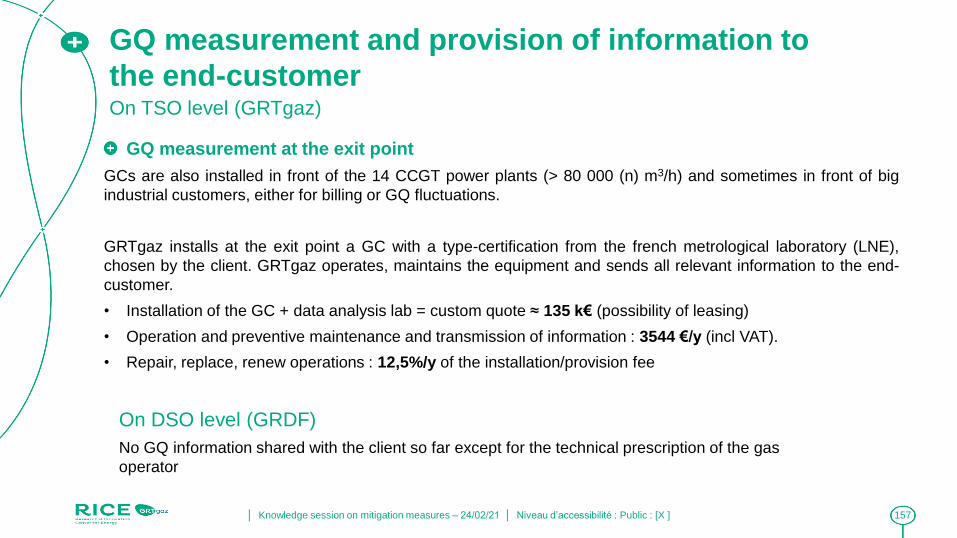
157
GQ measurement and provision of information to
the end-customerOn TSO level (GRTgaz)
GQ measurement at the exit point
GCs are also installed in front of the 14 CCGT power plants (> 80 000 (n) m3/h) and sometimes in front of big
industrial customers, either for billing or GQ fluctuations.
GRTgaz installs at the exit point a GC with a type-certification from the french metrological laboratory (LNE),
chosen by the client. GRTgaz operates, maintains the equipment and sends all relevant information to the end-
customer.
• Installation of the GC + data analysis lab = custom quote ≈ 135 k€ (possibility of leasing)
• Operation and preventive maintenance and transmission of information : 3544 €/y (incl VAT).
• Repair, replace, renew operations : 12,5%/y of the installation/provision fee
On DSO level (GRDF)
No GQ information shared with the client so far except for the technical prescription of the gas
operator
│ Knowledge session on mitigation measures – 24/02/21 │ Niveau d’accessibilité : Public : [X ]

158
Grid management as mitigation measureOn TSO level (GRTgaz)
In case of off spec gases (exceptional event)
The only time grid management (modification of gas flows, gas switch, co-mingling) is used to
control GQ is in the case of an off spec gas.
The gas grid was not conceived with the intention to do co-mingling. Those tools were not put in
place with the aim of controlling GQ, but they give some flexibility to the TSO. They are mostly a
crutch in case of unexpected events and can not solve any situation.
- It really depends on the situation and on the topology of the grid. Sometimes it is not possible
to do anything.
- It is counter-effective for the main role of the TSO (transport of gas). Doing it on a regular
basis implies a degraded service of the transiting offer and less capacities available.
On DSO level (GRDF)
No possibility of gas blending or dilution
Grid management is done in response to gas consumption and to the
demand of gas capacities from the shippers, not in order to regulate/control
the Gas Quality on the network.
│ Knowledge session on mitigation measures – 24/02/21 │ Niveau d’accessibilité : Public : [X ]

159
Grid management as mitigation measureOn SSO level (Storengy)
Gas mixing in the Undergound Storage
• Blending of gas is not possible in Aquifers. The gas will come out in the
reverse order as it went in.
• Blending of gas is possible in salt caverns → But only if they are filled with
different gas quality!!
• During withdrawal, theoritically it could be possible to blend two gas
qualities from different salt caverns.
UGS management is in response to gas consumption and to the
demand of storage capacities from the customers, not to
regulate/control the Gas Quality on the network.
│ Knowledge session on mitigation measures – 24/02/21 │ Niveau d’accessibilité : Public : [X ]

160
Grid management as mitigation measureOn SSO level (Storengy)
Withdrawal of gas
Withdrawal of gas is a very careful operation → NOT an On-Off valve!
UGS are flow regulated → Throttle valve
Works like a [BIG] water tap
Flow of gas injected into the TSO gas grid is increased slowly to :
- Avoid bringing water with the gas from the UGS (Aquifers)
- Avoid draging glycols or Charcoal from the upgrading process into the
gas stream
In a large aquifer UGS withdrawal flow rate can go from zero to a couple of
hundreds thousands Nm3/h within an hour.
│ Knowledge session on mitigation measures – 24/02/21 │ Niveau d’accessibilité : Public : [X ]
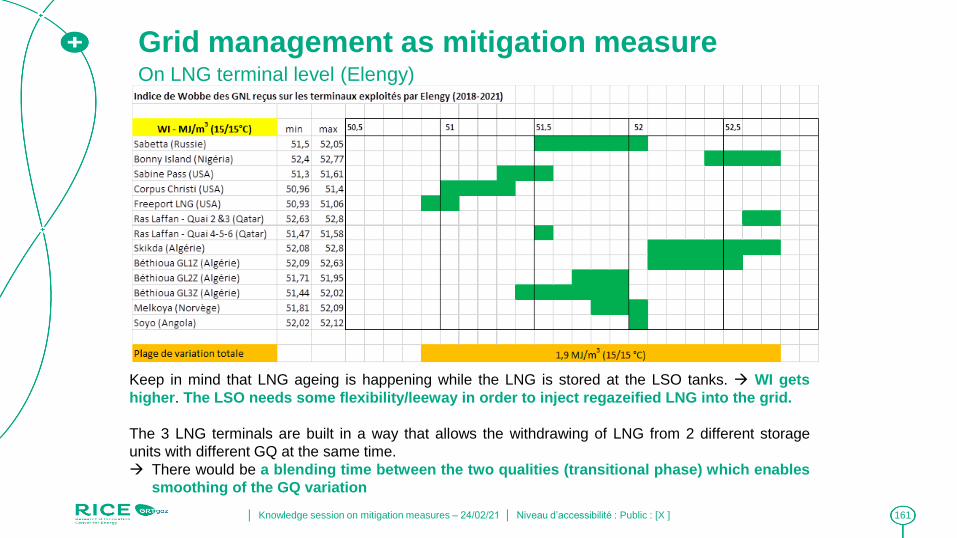
161
Grid management as mitigation measureOn LNG terminal level (Elengy)
Keep in mind that LNG ageing is happening while the LNG is stored at the LSO tanks. → WI gets
higher. The LSO needs some flexibility/leeway in order to inject regazeified LNG into the grid.
The 3 LNG terminals are built in a way that allows the withdrawing of LNG from 2 different storage
units with different GQ at the same time.
→ There would be a blending time between the two qualities (transitional phase) which enables
smoothing of the GQ variation
│ Knowledge session on mitigation measures – 24/02/21 │ Niveau d’accessibilité : Public : [X ]

│ Titre - Date │ Niveau d’accessibilité : Public : [ ] Interne : [ ] Restreint : [ ] Secret : [ ] 162
Annexes
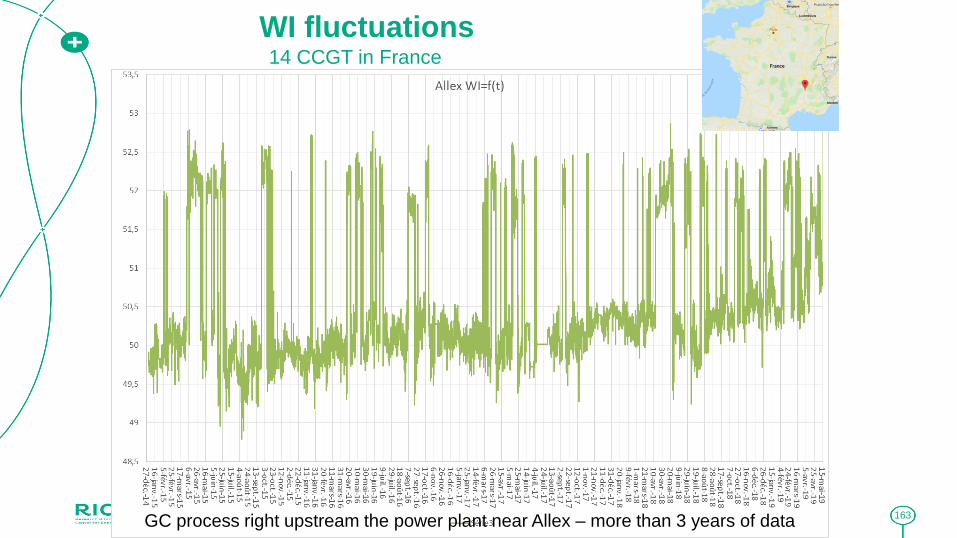
│ Titre - Date │ Niveau d’accessibilité : Public : [ ] Interne : [ ] Restreint : [ ] Secret : [ ] 163
WI fluctuations
GC process right upstream the power plant near Allex – more than 3 years of data
14 CCGT in France

│ Titre - Date │ Niveau d’accessibilité : Public : [ ] Interne : [ ] Restreint : [ ] Secret : [ ] 164
Rate of Change
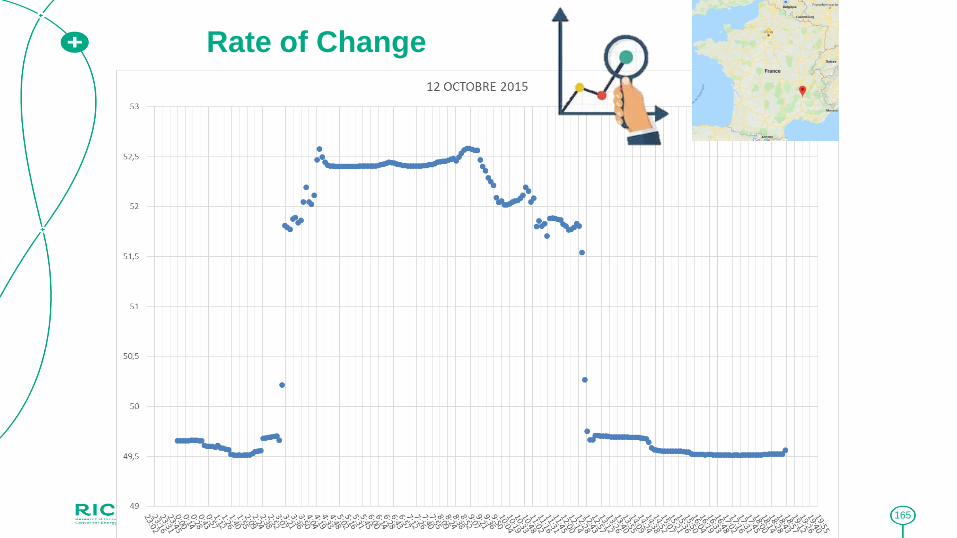
│ Titre - Date │ Niveau d’accessibilité : Public : [ ] Interne : [ ] Restreint : [ ] Secret : [ ] 165
Rate of Change

IMAGEImage
In France already 218 biomethane injection sites (data from
fev 21) are injecting biomethane into the gas grid,
representing a production of 3962 GWh/y.
The french energy transition law (2015) has a target of 10%
of renewable gases in the gas grid. Which represents more
than 30TWh.
It is expected by 2030, between 400 and 1500 injection
sites according to the French Environment Agency ADEME
(2013 Forecasts)
The gas operators have the ambition of injecting 90TWh
(30%) of renewables gases into the gas grid by 2030.
Source :
https://opendata.reseaux-energies.fr/
https://www.grdf.fr/dossiers/biomethane-biogaz/unites-injection-gaz-vert-biomethane-reseau
https://www.ademe.fr/sites/default/files/assets/documents/biogaz_depliant.pdf
Renewables injection points
166│ Knowledge session on mitigation measures – 24/02/21 │ Niveau d’accessibilité : Public : [X ]

167
Gas System Operators injection forecasts
"In 2030, renewable
energies represent 10%
of gas consumption“August 2015 Energy Transition Law (LTE)
French long term
renewable gas target
French short term
biomethane target
2018
1.7 TWh/y2023
6 to 8 TWh/yMultiannual programming of energy
(PPE)
First orientations and actions 2016-2023
November 2015
Anaerobic
digestionPyrogasification
Power-to-gas(H2 – CH4)
Algae
Source: Bilan
prévisionnel pluriannuel
gaz 2017
SPEGNN
Ambition of the French TSO and DSO
90 TWh renewable gas in 2030 (30%)
70 TWh/y
20 TWh/y
│ Knowledge session on mitigation measures – 24/02/21 │ Niveau d’accessibilité : Public : [X ]

168
Renewable Gases Value chain
Anaerobic
digestion
Pyrogasification Power-to-gas(H2 – CH4)
Algae
Potential of injectable gas
by departments in 2050
Theoretical potential of 460 TWh of renewable gases injectable in 2050
Primary
sources
available
Injectable
gas
Ele
ctr
oly
sis
me
tha
na
tio
nP
yro
ga
sific
atio
nA
na
ero
bic
dig
estio
n
Ele
ctr
oly
sis
me
tha
na
tio
nP
yro
ga
sific
atio
nA
na
ero
bic
dig
estio
n
│ Knowledge session on mitigation measures – 24/02/21 │ Niveau d’accessibilité : Public : [X ]


Q&A session

Concluding remarks

www.entsog.eu | [email protected]
ENTSOG - European Network of Transmission System Operators for Gas
Avenue de Cortenbergh 100, 1000 Bruxelles
Thank you for your attention
For further questions please contact:
Rosa Puentes ([email protected])
Thilo von der Grün ([email protected])
Nicolas Jensen ([email protected])
Leonardo D’Acquisto ([email protected])
Monica Di Pinti ([email protected])
Henning Eklund ([email protected])