5 feb 2021 4q2020 & fy2020 results presentation
TRANSCRIPT

iFAST Corporation Ltd.
4Q2020 & FY2020 Results Presentation
5 FEB 2021
iFAST Corporation Ltd.
This presentation should be read as an overview of iFAST Corporation Ltd.’s (“iFAST Corp” or the
“Company”, and together with its subsidiaries, the “Group”) current business activities and
operating environment. This presentation should not be solely relied upon by current and
potential investors when making an investment decision. iFAST Corp accepts no liability
whatsoever with respect to the use of the content in this presentation. This presentation may
contain forward-looking statements that involve known and unknown risks, uncertainties and
other factors that may cause our future performance, outcomes and results to be material
different from those expected, expressed or implied in these forward-looking statements.
Investors should therefore not rely on these forward-looking statements, which are based on the
current view of management of future events and market developments, which in turn are
based on currently available information, and are not a guarantee of future performance. This
presentation should not be construed as financial or investment advice and investors should
consult their independent advisers in respect of the contents and information set out in this
presentation where necessary. This presentation does not constitute an offer or solicitation of
an offer to subscribe for, acquire, purchase, dispose of or sell any units in iFAST Corp.
2
Disclaimer

iFAST Corporation Ltd.
o Key Summary Pg. 4
Section IFinancial Results
o 4Q2020 (Oct–Dec 2020) & FY2020 (Jan–Dec 2020) Results
o Financial Indicators
o Proposed Final Dividend
Pg. 8
Section IIOur Performance
Trends
o AUA Breakdown: Markets & Products
o Recurring and Non-recurring Net Revenue
o Performance by Geographical and Business Segments
o Progress of Individual Markets
Pg. 22
Section IIIAppendices
o Business Overview & Milestones
o The iFAST Fintech Ecosystem
o Value Proposition
o Net Revenue and Operating Expenses
o Fees Illustration
o Activities & Achievements
Pg. 45
Table of Contents

iFAST Corporation Ltd.
• The Group reported record quarterly net profit of S$6.83 million in
4Q2020, an increase of 127.5% compared to 4Q2019. This was achieved
on the back of 43.5% YoY increase in net revenue and 41.6% YoY increase
in gross revenue. For the full year 2020 (“FY2020”), net profit grew
122.3% YoY to S$21.15 million, on the back of 31.7% YoY increase in net
revenue and 35.5% YoY growth in gross revenue.
• Growth in profit was substantially higher than the growth in revenue,
showing the positive operating leverage and scalability of the Group’s
business model.
• The improvement in the Group’s business shows that iFAST Corp continues
to be a beneficiary of increased digital adoption in the wealth
management industry. The improvements have been seen for both the
B2C and B2B businesses.
• Net inflows of client assets registered a record of S$3.16 billion in 2020,
pushing the Group’s assets under administration (“AUA”) to a record of
S$14.45 billion as at 31 December 2020.
4
Key Summary

iFAST Corporation Ltd.
• iFAST Corp believes that the robust growth seen by the Group this year has
resulted from its past investments in building up a strong integrated digital
wealth management platform. iFAST Corp will continue to work hard on
various initiatives in all existing markets that the Group operates in to
ensure that its medium to long term growth prospects will remain strong.
• The 44.5% growth in the Group’s AUA in FY2020 as well as the continuing
positive momentum in net inflows of client assets will serve as tailwind for
the Group’s business performance as it enters 2021.
• Barring unforeseen circumstances, the Group expects further growth in its
business performance and targets to improve its operating margin in
2021.
• For the final dividend for FY2020, the Directors proposed an increase in
dividend from 0.90 cents per ordinary share in FY2019 to 1.00 cents per
ordinary share. The proposed final dividend will be subject to approval by
shareholders at the company’s Annual General Meeting on 23 April 2021.
5
Key Summary

iFAST Corporation Ltd.
$-
$1,000.00
$2,000.00
$3,000.00
$4,000.00
$5,000.00
$6,000.00
$7,000.00
$8,000.00
$9,000.00
$10,000.00
$11,000.00
$12,000.00
$13,000.00
$14,000.00
$15,000.00
De
c-0
0
Jun
-01
De
c-0
1
Jun
-02
De
c-0
2
Jun
-03
De
c-0
3
Jun
-04
De
c-0
4
Jun
-05
De
c-0
5
Jun
-06
De
c-0
6
Jun
-07
De
c-0
7
Jun
-08
De
c-0
8
Jun
-09
De
c-0
9
Jun
-10
De
c-1
0
Jun
-11
De
c-1
1
Jun
-12
De
c-1
2
Jun
-13
De
c-1
3
Jun
-14
De
c-1
4
Jun
-15
De
c-1
5
Jun
-16
De
c-1
6
Jun
-17
De
c-1
7
Jun
-18
De
c-1
8
Jun
-19
De
c-1
9
Jun
-20
De
c-2
0
B2B B2C
S$ million
6
Group AUA grew 44.5% YoY and 14.8% QoQto S$14.45 billion as at 31 December 2020
Note:
1. The Group’s AUA as at 31 December 2020 includes its effective 39.25% share of the India Business.
AUA (as at 31 Dec 2020): S$14.45 billion1

iFAST Corporation Ltd.
$1,574
$2,453
$3,605
$4,328
$11,082
$1,229
$3,343
$-
$2,000
$4,000
$6,000
$8,000
$10,000
$12,000
2016 2017 2018 2019 2020 4Q194Q20
Subscription ex-switching
$235
$942
$786
$976
$3,160
$268
$847
$-
$500
$1,000
$1,500
$2,000
$2,500
$3,000
$3,500
2016 2017 2018 2019 2020 4Q194Q20
Net inflows
7
Net inflows & Subscription ex-switching
S$ million S$ million
Notes:
1. Net inflows stood at S$590 million in 1Q2020, S$656 million in 2Q2020, S$1.07 billion in 3Q2020, and S$847 million in 4Q2020.
2. Subscription ex-switching stood at S$2.23 billion in 1Q2020, S$2.39 billion in 2Q2020, S$3.12 billion in 3Q2020 and S$3.34 billion in 4Q2020.
iFAST Corporation Ltd.
SECTION I
8
Financial Results

iFAST Corporation Ltd.
S$ (Million) 4Q2019 4Q2020 YoY change (%)
Revenue 33.82 47.90 +41.6
Net revenue 16.96 24.33 +43.5
Other income 0.52 1.56 +202.5
Operating Expenses 14.24 17.61 +23.7
Net finance (costs) / income 0.04 -0.06 NM
Share of results of associates, net of tax 0.11 -0.27 NM
Profit before tax 3.40 7.96 +134.2
Profit after tax 2.96 6.77 +129.1
Net profit attributable to
owners of the Company3.00 6.83 +127.5
EPS (cents) 1.12 2.51 +124.1
Dividend Per Share (cents) 0.90 1.001 +11.1
9
Financial Results for Group(4Q2020 vs 4Q2019)
Note:
1. Subject to approval by shareholders at the company’s Annual General Meeting on 23 April 2021.

iFAST Corporation Ltd.
S$ (Million) FY2019 FY2020 YoY change (%)
Revenue 125.41 169.93 +35.5
Net revenue 65.20 85.86 +31.7
Other income 2.04 5.21 +155.4
Operating Expenses 56.06 65.29 +16.5
Net finance (costs) / income -0.06 0.03 NM
Share of results of associates, net of tax -0.05 -0.41 +774.5
Profit before tax 11.07 25.39 +129.4
Profit after tax 9.31 20.96 +125.3
Net profit attributable to
owners of the Company9.52 21.15 +122.3
EPS (cents) 3.55 7.80 +119.7
Dividend Per Share (cents) 3.15 3.301 +4.8
10
Financial Results for Group(FY2020 vs FY2019)
Note:
1. Subject to approval by shareholders at the company’s Annual General Meeting on 23 April 2021.

iFAST Corporation Ltd.
S$ (Million) FY2016 FY20171 FY2018 FY2019 FY2020
Revenue 80.60 101.17 121.24 125.41 169.93
Net revenue 40.69 49.45 59.62 65.20 85.86
Other income 1.88 1.08 1.16 2.04 5.21
Operating expenses 37.16 42.19 49.78 56.06 65.29
Net finance income/(costs) 0.84 0.74 0.83 -0.06 0.03
Share of results of associates, net of tax -0.16 -0.33 0.52 -0.05 -0.41
Profit before tax 6.09 8.75 12.35 11.07 25.39
Profit after tax 5.33 7.49 10.69 9.31 20.96
Net profit attributable to
owners of the Company5.45 7.70 10.91 9.52 21.15
EPS (cents) 2.08 2.92 4.10 3.55 7.80
Operating Cashflows 5.63 13.22 17.62 19.38 41.56
Dividend per share (cents) 2.79 3.01 3.15 3.15 3.302
Note:
1. Restated as a result of adoption of SFRS(I)s with effect from 1 January 2018.
2. Subject to approval by shareholders at the company’s Annual General Meeting on 23 April 2021.
11
Results Overview for Group (including China operation)
iFAST Corporation Ltd.
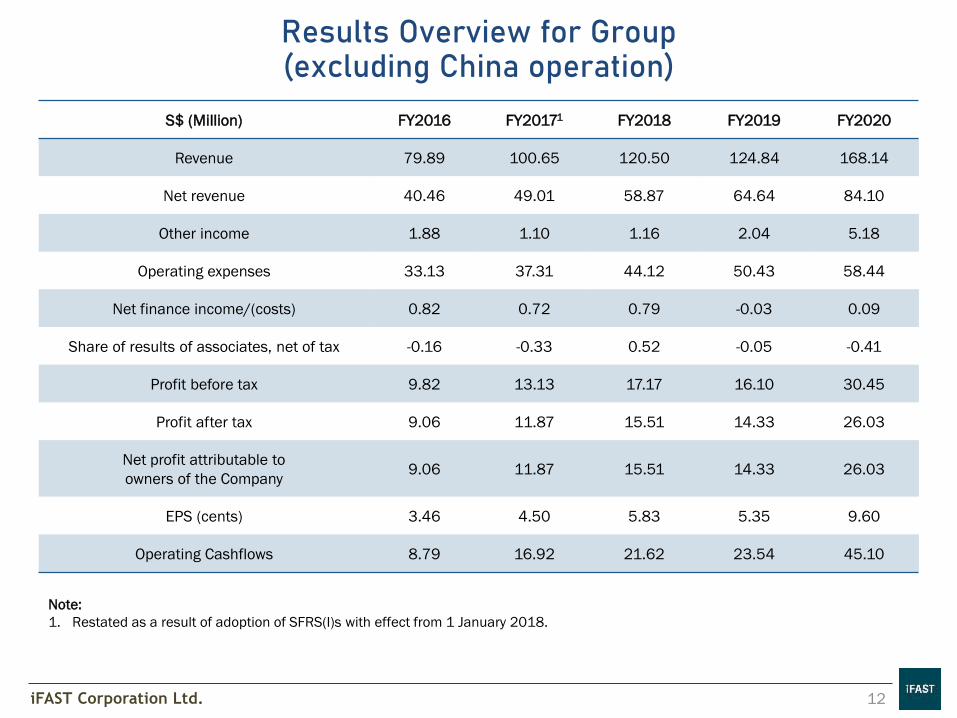
S$ (Million) FY2016 FY20171 FY2018 FY2019 FY2020
Revenue 79.89 100.65 120.50 124.84 168.14
Net revenue 40.46 49.01 58.87 64.64 84.10
Other income 1.88 1.10 1.16 2.04 5.18
Operating expenses 33.13 37.31 44.12 50.43 58.44
Net finance income/(costs) 0.82 0.72 0.79 -0.03 0.09
Share of results of associates, net of tax -0.16 -0.33 0.52 -0.05 -0.41
Profit before tax 9.82 13.13 17.17 16.10 30.45
Profit after tax 9.06 11.87 15.51 14.33 26.03
Net profit attributable to
owners of the Company9.06 11.87 15.51 14.33 26.03
EPS (cents) 3.46 4.50 5.83 5.35 9.60
Operating Cashflows 8.79 16.92 21.62 23.54 45.10
Note:
1. Restated as a result of adoption of SFRS(I)s with effect from 1 January 2018.
12
Results Overview for Group (excluding China operation)

iFAST Corporation Ltd.
Note: 1. PBT margins (2017) were restated as a result of adoption of SFRS(I)s with effect from 1 January 2018
13
PBT margin for Group (based on net revenue)
(excluding China operation) (including China operation)
15.0%
17.7%
20.7%
17.0%
29.6%
0.0%
5.0%
10.0%
15.0%
20.0%
25.0%
30.0%
35.0%
2016 2017 2018 2019 2020
24.3%
26.8%
29.2%
24.9%
36.2%
0.0%
5.0%
10.0%
15.0%
20.0%
25.0%
30.0%
35.0%
40.0%
2016 2017 2018 2019 2020

iFAST Corporation Ltd.
S$ (Million) FY2016 FY2017 FY2018 FY2019 FY2020
EBITA 7.59 12.96 16.44 17.49 32.98
Net Cash Position1 54.59 55.91 48.06 40.15 53.28
Operating Cash Flows 5.63 13.22 17.62 19.38 41.56
Operating Cash Flows
(excluding China
Operation)
8.79 16.92 21.62 23.54 45.10
Capital Expenditure2 6.61 7.47 10.73 11.90 12.63
Net Current Assets 64.39 60.18 56.62 49.86 58.35
Shareholders’ Equity 78.45 81.24 85.56 90.06 104.11
14
Financial Indicators
Notes:
1. Comprising cash and cash equivalents and investments in financial assets (categorised as other investments under current assets) net of
bank loans at the end of the respective year or period.
2. Excluding right-of-use assets recognised following the adoption of SFRS(I)16 Leases with effect from 1 Jan 2019.

iFAST Corporation Ltd.
As at 31 Dec 2020
(S$ million)
Cash and cash equivalents 36.44
Other investments¹ 16.84
Total cash and other investments 53.28
Less: Bank loans -
Net Cash Position
(total cash and other investments net off bank loans)53.28
Gross Debt-to-Equity Ratio 0.00%
Net Debt-to-Equity Ratio Net Cash Position
15
Net Cash Position
Note:
1. Other investments comprise investments in financial assets under current assets.

iFAST Corporation Ltd. 16
Group Operating Cash Flows
S$ million
8.79
16.92
21.62 23.54
45.10
5.63
13.22
17.62 19.38
41.56
0.00
5.00
10.00
15.00
20.00
25.00
30.00
35.00
40.00
45.00
50.00
2016 2017 2018 2019 2020
Operating Cash Flows (excluding China) Operating Cash Flows (including China)

iFAST Corporation Ltd.
214
1,554
2,339
5,454
6,615
7,466
10,727
11,901
12,631
-
2,000
4,000
6,000
8,000
10,000
12,000
14,000
2012 2013 2014 2015 2016 2017 2018 2019 2020
17
Capital Expenditure
S$ thousand

iFAST Corporation Ltd.
As at 31 Dec 2019 As at 31 Dec 2020
Total number of issued shares
(excluding treasury shares and
subsidiary holdings)
268,732,479 272,407,635
18
Number of issued shares

iFAST Corporation Ltd.
As at 31 Dec 19
S$’000
As at 31 Dec 20
S$’000
NON-CURRENT ASSETS
Plant and Equipment 3,689 4,283
Right-of-use Assets 14,390 18,538
Intangible Assets and Goodwill 22,212 25,500
Associates 5,375 5,982
Other Investments 5,329 3,944
Deferred Tax Assets 1,139 1,099
Prepayments & Others 327 330
TOTAL NON-CURRENT ASSETS 52,461 59,676
CURRENT ASSETS
Current Tax Receivables 30 203
Other Investments 19,144 16,838
Prepayments and Others 1,759 1,813
Trade & Other Receivables 34,720 44,990
Uncompleted Contracts - Buyers 24,246 94,318
Money Market Funds 616 4,833
Cash at Bank and In Hand 24,195 31,608
TOTAL CURRENT ASSETS 104,710 194,603
HELD UNDER TRUST
Client Bank Accounts 410,723 939,729
Client Ledger Balances (410,723) (939,729)
- -
TOTAL ASSETS 157,171 254,279
19
Our Consolidated Financial Position

iFAST Corporation Ltd.
As at 31 Dec 19
S$’000
As at 31 Dec 20
S$’000
EQUITY
Share Capital 66,180 66,976
Other Reserves 23,877 37,133
EQUITY ATTRIBUTABLE TO OWNERS OF THE COMPANY 90,057 104,109
Non-Controlling Interests (421) (709)
TOTAL EQUITY 89,636 103,400
NON-CURRENT LIABILITIES
Deferred Tax Liabilities 1,928 2,616
Lease Liabilities 10,755 12,013
TOTAL NON-CURRENT LIABILITIES 12,683 14,629
CURRENT LIABILITIES
Current Tax Payables 1,530 3,078
Lease Liabilities 4,366 7,205
Bank Loans 3,806 -
Trade & Other Payables 20,955 31,735
Uncompleted Contracts – Sellers 24,195 94,232
TOTAL CURRENT LIABILITIES 54,852 136,250
TOTAL LIABILITIES 67,535 150,879
TOTAL EQUITY & LIABILITIES 157,171 254,279
20
Our Consolidated Financial Position

iFAST Corporation Ltd.
• For the final dividend for FY2020, the Directors proposed an increase in dividend from 0.90 cents per ordinary share in FY2019 to 1.00 cents per ordinary share. The proposed final dividend will be subject to approval by shareholders at the company’s Annual General Meeting on 23 April 2021.
• The proposed final dividend brings the total dividend to 3.30 cents per ordinary share for FY2020 which is 4.8% higher than the total dividend of 3.15 cents per ordinary share for FY2019.
21
Proposed Final Dividend for FY2020
Proposed Final Dividend for FY2020 - Schedule
Dividend per share 1.00 cents per ordinary share
Ex-dividend date 3 May 2021
Record date and time 4 May 2021 (5.00 pm)
Payment date 17 May 2021

iFAST Corporation Ltd. 22
SECTION II
Our Performance Trends

iFAST Corporation Ltd. 23
AUA Breakdown: Markets & Products(as at 31 December 2020)
69.2%
18.4%
9.2%
3.2%
AUA Breakdown By Markets
Singapore Hong Kong
Malaysia Others (China & India)
75.4%
6.1%
12.9%
5.6%
AUA Breakdown by Products
Unit Trusts Bonds
Stocks & ETFs Cash Account
iFAST Corporation Ltd. 24
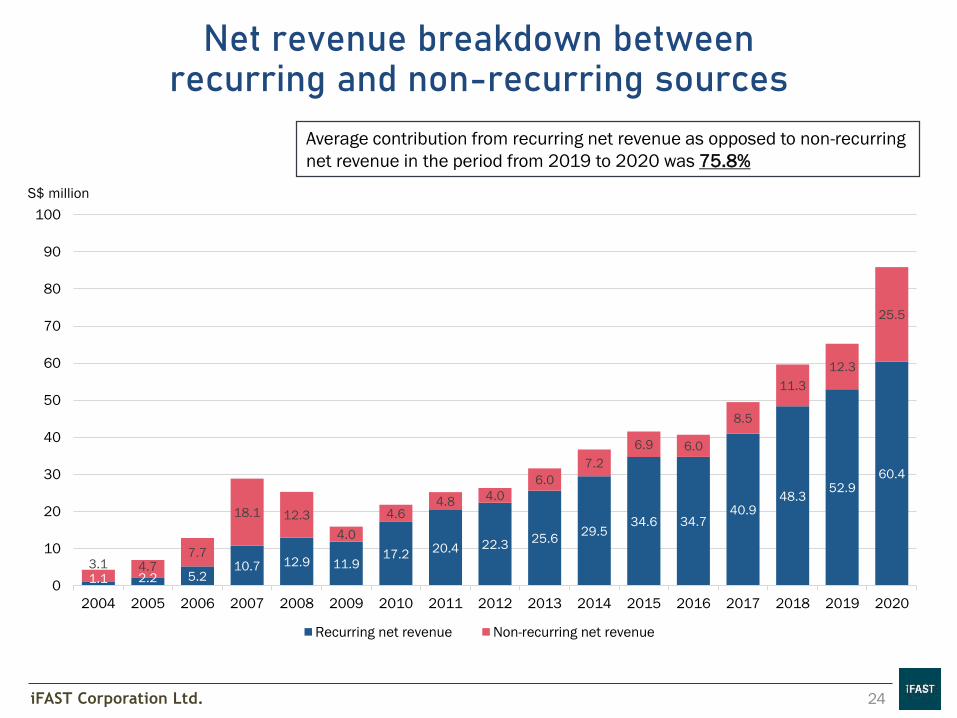
Net revenue breakdown between recurring and non-recurring sources
S$ million
Average contribution from recurring net revenue as opposed to non-recurring
net revenue in the period from 2019 to 2020 was 75.8%
1.1 2.2 5.210.7 12.9 11.9
17.220.4 22.3
25.629.5
34.6 34.740.9
48.352.9
60.4
3.1 4.77.7
18.1 12.3
4.0
4.64.8 4.0
6.0
7.2
6.9 6.0
8.5
11.3
12.3
25.5
0
10
20
30
40
50
60
70
80
90
100
2004 2005 2006 2007 2008 2009 2010 2011 2012 2013 2014 2015 2016 2017 2018 2019 2020
Recurring net revenue Non-recurring net revenue

iFAST Corporation Ltd. 25
Net revenue as a ratio of average AUA
0.609% 0.606% 0.596% 0.594%
0.533%
0.105% 0.126% 0.139% 0.138%0.225%
0.000%
0.100%
0.200%
0.300%
0.400%
0.500%
0.600%
0.700%
0.800%
2016 2017 2018 2019 2020
Recurring net revenue / AUA Non-recurring net revenue / AUA

iFAST Corporation Ltd. 26
Recurring and Non-Recurring Net Revenue
S$ (Million) FY2016 FY2017 FY2018 FY2019 FY2020
Recurring net revenue 34.71 40.95 48.32 52.94 60.39
Non-recurring net
revenue5.98 8.50 11.30 12.26 25.47
Total net revenue 40.69 49.45 59.62 65.20 85.86
YoY Change (%) FY2016 FY2017 FY2018 FY2019 FY2020
Recurring net revenue +0.2 +18.0 +18.0 +9.6 +14.1
Non-recurring net
revenue-13.2 +42.2 +33.0 +8.5 +107.7
Total net revenue -2.0 +21.5 +20.6 +9.4 +31.7
iFAST Corporation Ltd.
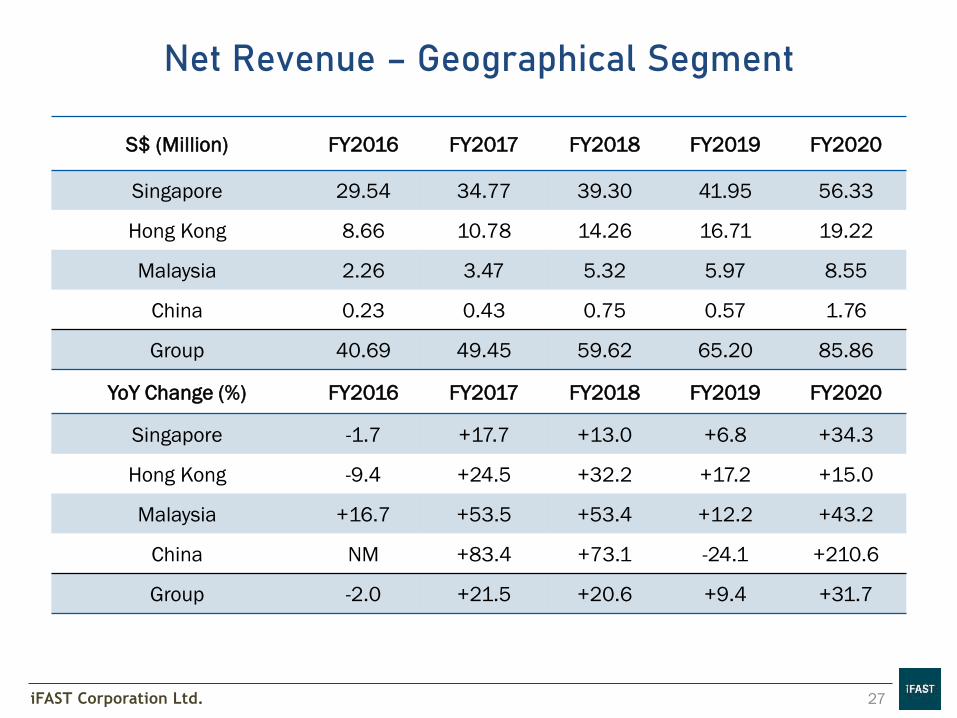
S$ (Million) FY2016 FY2017 FY2018 FY2019 FY2020
Singapore 29.54 34.77 39.30 41.95 56.33
Hong Kong 8.66 10.78 14.26 16.71 19.22
Malaysia 2.26 3.47 5.32 5.97 8.55
China 0.23 0.43 0.75 0.57 1.76
Group 40.69 49.45 59.62 65.20 85.86
YoY Change (%) FY2016 FY2017 FY2018 FY2019 FY2020
Singapore -1.7 +17.7 +13.0 +6.8 +34.3
Hong Kong -9.4 +24.5 +32.2 +17.2 +15.0
Malaysia +16.7 +53.5 +53.4 +12.2 +43.2
China NM +83.4 +73.1 -24.1 +210.6
Group -2.0 +21.5 +20.6 +9.4 +31.7
27
Net Revenue – Geographical Segment

iFAST Corporation Ltd.
B2B Net Revenue
(S$ Million)FY2016 FY2017 FY2018 FY2019 FY2020
Recurring net revenue 24.49 28.85 33.88 37.12 42.34
Non-recurring net revenue 3.86 5.15 7.22 7.19 10.88
Total B2B net revenue 28.35 34.00 41.10 44.31 53.22
YoY Change (%) FY2016 FY2017 FY2018 FY2019 FY2020
Recurring net revenue -0.02 +17.8 +17.4 +9.6 +14.1
Non-recurring net revenue -5.6 +33.4 +40.1 -0.5 +51.4
Total B2B net revenue -0.8 +19.9 +20.9 +7.8 +20.1
28
Net Revenue – B2B Business Segment

iFAST Corporation Ltd.
B2C Net Revenue
(S$ Million)FY2016 FY2017 FY2018 FY2019 FY2020
Recurring net revenue 10.22 12.10 14.44 15.81 18.04
Non-recurring net revenue 2.12 3.35 4.08 5.08 14.60
Total B2C net revenue 12.34 15.45 18.52 20.89 32.64
YoY Change (%) FY2016 FY2017 FY2018 FY2019 FY2020
Recurring net revenue +0.7 +18.4 +19.3 +9.5 +14.0
Non-recurring net revenue -24.1 +58.0 +22.0 +24.3 +187.5
Total B2C net revenue -4.6 +25.2 +19.9 +12.8 +56.2
29
Net Revenue – B2C Business Segment

iFAST Corporation Ltd.
Profit/Loss
(S$ Million) 4Q2019 4Q2020
YoY
Change
(%) FY2019 FY2020
YoY
Change
(%)
Singapore 2.43 6.91 +184.7 9.96 21.32 +114.1
Hong Kong 1.61 1.73 +7.9 4.42 5.79 +30.9
Malaysia 0.53 0.94 +76.0 1.76 3.75 +113.0
Other1 0.11 -0.27 NM (0.05) (0.41) +774.5
Profit before tax
(excluding China operation) 4.68 9.31 +99.0 16.10 30.45 +89.2
Tax expense (0.44) (1.18) +169.0 (1.76) (4.42) +151.0
Net profit after tax
(excluding China operation) 4.24 8.13 +91.7 14.33 26.03 +81.6
China operation (1.24) (1.30) +5.1 (4.82) (4.88) +1.2
Net profit after tax
(including China operation) 3.00 6.83 +127.5 9.52 21.15 +122.3
30
Profit/Loss – Geographical Segment
Notes:
1. Representing share of results of associates.

iFAST Corporation Ltd.
Profit/Loss
(S$ Million) FY2016 FY20172 FY2018 FY2019 FY2020
Singapore 9.07 10.62 11.86 9.96 21.32
Hong Kong 0.53 1.77 3.42 4.42 5.79
Malaysia 0.38 1.07 1.37 1.76 3.75
Other1 (0.16) (0.33) 0.52 (0.05) (0.41)
Profit before tax
(excluding China operation) 9.82 13.13 17.17 16.10 30.45
Tax expense (0.76) (1.26) (1.66) (1.76) (4.42)
Net profit after tax (excluding
China operation) 9.06 11.87 15.51 14.33 26.03
China operation (3.61) (4.17) (4.60) (4.82) (4.88)
Net profit after tax
(including China operation) 5.45 7.70 10.91 9.52 21.15
Notes:
1. Representing share of results of associates
2. Restated as a result of adoption of SFRS(I)s with effect from 1 January 2018 for comparison purpose
31
Profit/Loss – Geographical Segment

iFAST Corporation Ltd.
13.3829.92
229.80
184.09
249.72
353.47
516.78
612.30
698.63
0.00
100.00
200.00
300.00
400.00
500.00
600.00
700.00
800.00
2012 2013 2014 2015 2016 2017 2018 2019 2020
32
Transaction Volume Of Bondsupermart’sAffiliated Brokers From Inception
S$ million

iFAST Corporation Ltd.
SINGAPORE
iFAST Singapore Total Sales ex-switching
Progress of Individual Markets
S$ million
-
100
200
300
400
500
600
700
800
900
1,000
1,100
1,200
1,300
1,400
1,500
1,600
1,700
1,800
1Q
15
2Q
15
3Q
15
4Q
15
1Q
16
2Q
16
3Q
16
4Q
16
1Q
17
2Q
17
3Q
17
4Q
17
1Q
18
2Q
18
3Q
18
4Q
18
1Q
19
2Q
19
3Q
19
4Q
19
1Q
20
2Q
20
3Q
20
4Q
20
B2B B2C

iFAST Corporation Ltd.
SINGAPORE
• Net revenue for the Singapore operation increased by 50.2% YoY to S$16.24 million
in 4Q2020, and rose by 34.3% YoY to S$56.33 million in FY2020.
• The growth in net revenue was due to the robust growth rates in AUA, sales and net
inflows for FSMOne.com, its B2C business division, as well as for the iFAST B2B
business division.
• 4Q2020 was a record quarter for the iFAST Singapore operation in terms of sales.
The AUA of the Singapore operation grew 52.8% YoY and 18.0% QoQ to a record
high of $10 billion as at 31 December 2020. Both FSMOne.com and the iFAST B2B
business divisions achieved record high AUA levels.
• 4Q2020 sales hit a record high for FSMOne.com, continuing the strong momentum
from 9M2020. FSMOne.com continued to see a surge in investment activities from
DIY investors into the various investment products including unit trusts, stocks and
ETFs. The number of accounts opened remained strong in 4Q2020, and the full
year of 2020 saw a record number of accounts opened.
34
Progress of Individual Markets

iFAST Corporation Ltd.
SINGAPORE
• As part of FSMOne’s continued effort to provide investment ideas to investors, the
“FSMOne What and Where to Invest 2021” virtual investment conference was
organised over multiple days in January 2021. The investment presentations and
panel discussions gathered investment specialists from the region and were
streamed live to a record high number of investors.
• The AUA of the B2B division including its wealth advisory arm, iFAST Global
Markets (iGM), grew 43.1% YoY to a new high. The B2B wealth advisory business
has continued to achieve strong growth in 4Q2020. Sales of the B2B division
including iGM grew 5.2% QoQ and 182.8% YoY in 4Q2020.
• With more wealth advisers joining the industry and as the B2B platform signed on
more new B2B partners, the growth trend seen in the Singapore’s B2B business in
2020 is likely to continue into the new year. This is further supported by the
increased adoption of technology by wealth advisers in marketing simple
investment products which has helped improve the efficiency of their business.
35
Progress of Individual Markets

iFAST Corporation Ltd.
HONG KONG
36
• Net revenue for the Hong Kong operation increased by 13.5% YoY to S$5.16 million
in 4Q2020, and rose by 15.0% YoY to S$19.22 million in FY2020.
• The AUA of the Hong Kong operation grew by 16.1% YoY and 5.5% QoQ to S$2.66
billion as at 31 December 2020.
• Despite the economic slowdown resulting from sustained social distancing, the Hong Kong operation recorded positive net inflows in FY2020.
• The performance of both the B2B and B2C divisions remained strong with robust
growth seen in the unit trusts, bonds, stocks and ETFs turnover in FY2020 as
compared to FY2019.
• Unit trust sales for both the B2B and B2C division hit record high in FY2020. The B2B division recorded a 25% YoY increase in unit trust sales ex-switching in
FY2020 compared to FY2019.
• Stocks and ETFs turnover tripled for the B2B division and doubled for the B2C
division in FY2020. The surge in US stocks trading in 4Q2020 can be attributed to the higher trading activities brought about by the US presidential election.
Progress of Individual Markets

iFAST Corporation Ltd.
HONG KONG
37
• The Hong Kong bond business remained strong, especially in the retail space.
Bonds turnover for the B2C division, FSMOne.com, grew 51% YoY to a record high
in FY2020.
• The B2B wealth advisory arm, iFAST Global Markets (iGM), achieved decent growth
in 2020. In FY2020, the team not only expanded its number of representatives,
but also saw a 25.8% YoY increase total sales and turnover.
• In 4Q2020, the Hong Kong Fintech Solutions division saw an increase in its
upfront revenue as more securities firms and wealth management companies
engaged its service. Looking ahead, the Hong Kong operation expects this growth
trend to continue into 2021.
• The B2B division expects the strong demand for unit trusts, stocks and Fintech
solutions to continue into 2021 as more investors are starting to see investment
as a necessity while wealth advisers see iFAST as a good platform for addressing
such demand.
Progress of Individual Markets
iFAST Corporation Ltd.
HONG KONG
38
• In a press release published on 30 January 2021, iFAST Corp gave an update on
its participation in the eMPF Platform project.
• The eMPF Platform aims to standardise, streamline and automate the MPF
scheme administration processes to create room for fee reduction and a
predominantly paperless experience in the MPF System.
• For more information, please refer to the SGX announcement page on the
Company’s corporate website.
Progress of Individual Markets

iFAST Corporation Ltd.
MALAYSIA
39
• Net revenue for the Malaysia operation increased by 59.9% YoY to S$2.29 million in 4Q2020, and rose by 43.2% YoY to S$8.55 million in FY2020.
• The AUA of the Malaysia operation increased 13.4% QoQ driven by positive investors’ sentiment arising from successful vaccine rollout and positive outcome of the US election. In FY2020, the Malaysia’s AUA surged 52.1% YoY to a record high of S$1.32 billion as at 31 December 2020.
• While gross sales in 4Q2020 came in a tad lower than 3Q2020, the B2B business registered a record quarterly sales for unit trusts during the period. In FY2020, the combined sales for unit trusts and bonds on both the B2B and B2C division doubled as compared to FY2019.
• At the B2C division, FSMOne.com, the fourth quarter is seasonally the peak period for tax deductible Private Retirement Scheme (PRS) investments where the AUA is sticky. Over the PRS promotion period in 2020, FSMOne.com saw a record number of clients investing into PRS, which translates to a 28.3% YoY increase in PRS sales.
• The business momentum of the B2B division continues to build up going into 4Q2020. The B2B division achieved yet another record quarterly gross sales for unit trusts and saw increased uptake in equity funds and managed portfolios in 4Q2020. The skew towards equity funds would benefit AUA growth if the current market rally is sustained.
Progress of Individual Markets

iFAST Corporation Ltd.
MALAYSIA
40
• Despite the disruption resulting from the Movement Control Order in Malaysia, the
increased digital adoption and subsequent pent up demand from investors have led to
a record number of account openings across the Malaysia operation. In FY2020, the
number of accounts opened increased 138% YoY and 90% YoY on the B2C and B2B
division respectively. Correspondingly, the AUA of the B2C and B2B division grew more
than 50% and 20% in FY2020 respectively.
• In 4Q2020, the Fintech Solutions division started a new project and continued to be in
engagement with companies in the asset management industry and government
agencies that are looking for digital solutions to enhance the efficiency of their
platforms.
• Moving into 2021, iFAST Malaysia will be adding stocks trading to its suite of products
and services which is expected to be launched in the next few months. Having a more
comprehensive suite of wealth management services will continue to propel account
openings and AUA growth for the Malaysia operation. The Malaysia’s bonds business is
also expected to continue to progress well in 2021.
Progress of Individual Markets

iFAST Corporation Ltd.
CHINA
41
• Net revenue for the China operation grew 270.9% YoY to S$0.65 million in
4Q2020, and rose by 210.6% to S$1.76 million in FY2020.
• While wrap fee income currently accounts for close to 10% of China’s overall net
revenue, the Group believes that as the adoption rate of wrap account grows over
time, wrap fee income will become a strong contributor to the overall net revenue
structure of the China operation.
• The AUA of the China operation grew 15.3% QoQ and 170.5% YoY to approximately
RMB 1.39 billion (equivalent to S$275 million) as at 31 December 2020.
• The B2B division including the B2B wealth advisory arm, iFAST Global Markets
(iGM), achieved record high AUA as at 31 December 2020. The B2B and iGM
businesses has a close to even contribution to the overall AUA of the China
operation. The AUA of the B2B business grew 246% YoY, while the AUA for the iGM
business grew 114% YoY in 4Q2020.
Progress of Individual Markets

iFAST Corporation Ltd.
CHINA
42
• Notably, money market funds accounts for 13% of the overall AUA of the China
operation. This is a significantly lower percentage as compared to other internet-
based fund distributors in China. In 2020, the bulk of the sales on the iFAST China
platform comprises portfolio sales, where investors subscribe into a basket of
funds handpicked by the iFAST wealth advisers or in-house research team in
accordance to investors’ risk tolerance profile.
• In summary, 2020 has been a year of strong business momentum for the China
operation. The foundation years have laid in place key competencies for the China
operation to capture opportunities in the China wealth management space. The
Group expects the strong business momentum to carry forth into the future years
of operation as the China market embraces standardised investment products
such as publicly offered mutual funds.
• As China continues to liberate its financial markets, the Group will continue to seek
opportunities within the China market to expand its product offerings similar to its
core markets such as Singapore, Hong Kong or Malaysia.
Progress of Individual Markets

iFAST Corporation Ltd.
INDIA
43
• As at 31 December 2020, iFAST Corp holds an effective 39.25% share in iFAST
Financial India Pvt Ltd, the key business of the Group’s India business, which
engages in the distribution of investment products including unit trust in India.
• The AUA of the India operation remains flat on a YoY basis at Indian Rupee 27.30
billion (equivalent to S$497 million) as at 31 December 2020. In 2020, industry
equity mutual funds witnessed six consecutive months of net outflow from July to
December, while SENSEX reached record high buoyed by inflows from foreign
institutional investors and record level of retail investors investing into direct equity.
• Supported by the new SEBI RIA regulation that came into effect on 1 October 2020,
AUA of the India B2B iFAST Global Markets (iGM) arm grew to Indian Rupee 3.3
billion (equivalent to S$60 million), representing a 255% QoQ increase.
• Mutual fund distributors (MFDs) have joined iGM to become licenced advisers to
continue to provide fee-based advisory services. iFAST India believes that with the
more stringent compliance requirements coming into effect from 1 April 2021, more
advisers will find the need to work with a full service platform like iFAST.
Progress of Individual Markets

iFAST Corporation Ltd.
INDIA
44
• Global investing trend is picking up in India with asset management companies
rolling out more international funds to meet the growing demand. As the concept
of global investing is relatively new for investors in India, iFAST India is launching
its first global investment conference titled “Invest Globally And Profitably 2021”
and a list of recommended global funds and model portfolios to help its investors.
Progress of Individual Markets

iFAST Corporation Ltd. 45
SECTION III
Appendices
iFAST Corporation Ltd. 46
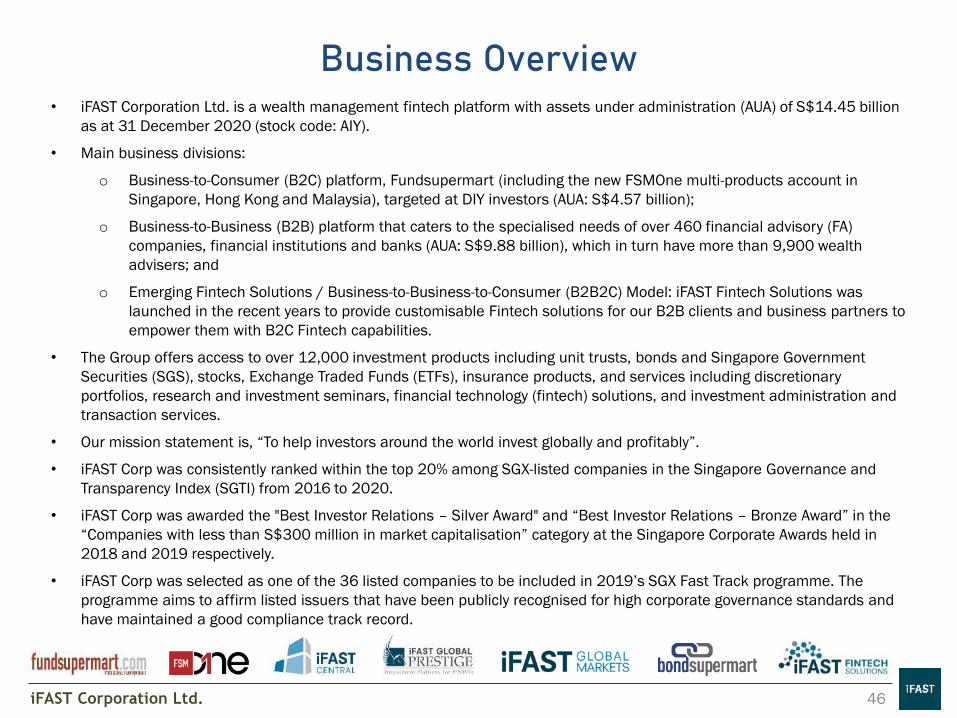
Business Overview• iFAST Corporation Ltd. is a wealth management fintech platform with assets under administration (AUA) of S$14.45 billion
as at 31 December 2020 (stock code: AIY).
• Main business divisions:
o Business-to-Consumer (B2C) platform, Fundsupermart (including the new FSMOne multi-products account in
Singapore, Hong Kong and Malaysia), targeted at DIY investors (AUA: S$4.57 billion);
o Business-to-Business (B2B) platform that caters to the specialised needs of over 460 financial advisory (FA)
companies, financial institutions and banks (AUA: S$9.88 billion), which in turn have more than 9,900 wealth
advisers; and
o Emerging Fintech Solutions / Business-to-Business-to-Consumer (B2B2C) Model: iFAST Fintech Solutions was
launched in the recent years to provide customisable Fintech solutions for our B2B clients and business partners to
empower them with B2C Fintech capabilities.
• The Group offers access to over 12,000 investment products including unit trusts, bonds and Singapore Government
Securities (SGS), stocks, Exchange Traded Funds (ETFs), insurance products, and services including discretionary
portfolios, research and investment seminars, financial technology (fintech) solutions, and investment administration and
transaction services.
• Our mission statement is, “To help investors around the world invest globally and profitably”.
• iFAST Corp was consistently ranked within the top 20% among SGX-listed companies in the Singapore Governance and
Transparency Index (SGTI) from 2016 to 2020.
• iFAST Corp was awarded the "Best Investor Relations – Silver Award" and “Best Investor Relations – Bronze Award” in the
“Companies with less than S$300 million in market capitalisation” category at the Singapore Corporate Awards held in
2018 and 2019 respectively.
• iFAST Corp was selected as one of the 36 listed companies to be included in 2019’s SGX Fast Track programme. The
programme aims to affirm listed issuers that have been publicly recognised for high corporate governance standards and
have maintained a good compliance track record.

iFAST Corporation Ltd. 47
Milestones
2000 2002 2007 2008 2011 2014 2015
Launch of
Fundsupermart.com
(B2C) in Singapore
Launch of iFAST
Platform Services
(B2B) in Singapore
Launch of
Fundsupermart.com (B2C)
in Hong Kong
• Launch of iFAST Platform
Services (B2B) in Hong Kong
• Launch of Fundsupermart.com
(B2C) and iFAST Platform
Services (B2B) in Malaysia
Launch of “FSM Mobile”
iPhone application. The
Android version of the “FSM
Mobile” was launched in
the following year
• Incorporation of
iFAST Platform
Services (Shenzhen)
Qianhai in China
• Listing on SGX-ST
Mainboard
• Distribution of bonds and ETFs in
Singapore
• Launch of online discretionary portfolio
management service (DPMS) in Hong Kong
• Received Funds Distributor Qualification in
China
2016
• Acquisition of a stockbroking company
and an insurance brokerage firm in
Hong Kong
• Acquisition of a stake in the holding
company of iFAST India Business
• Launch of HKEX stockbroking services
on the B2B platform in Hong Kong
• Launch of Insurance on FSM Malaysia
• Launch of FSMOne in Singapore
iFAST Corporation Ltd. 48
Milestones (cont’d)
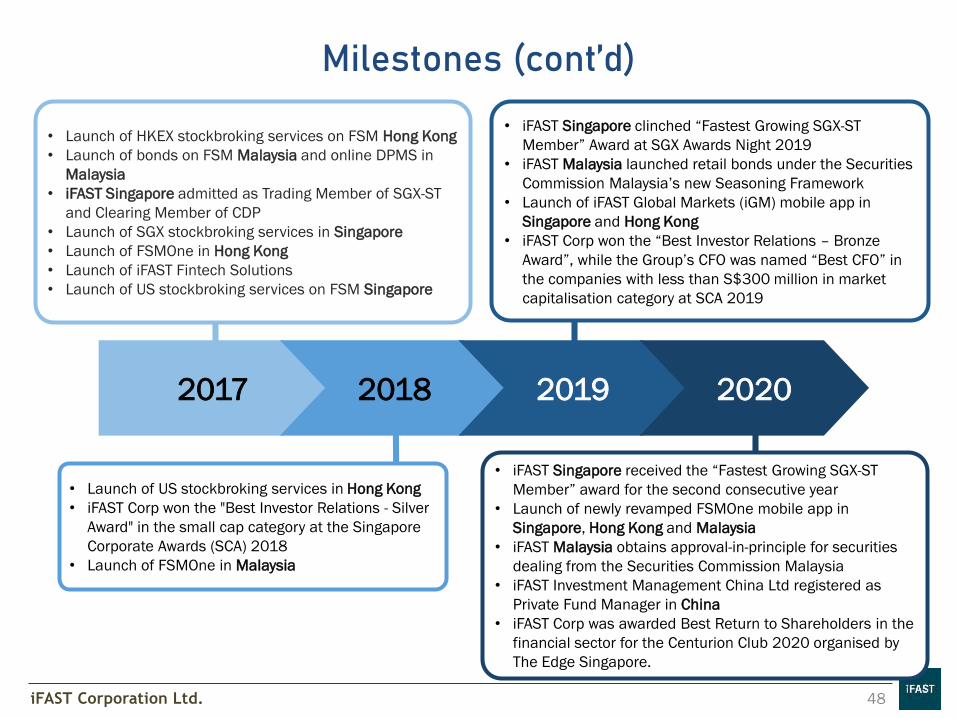
2017 2018 2019 2020
• Launch of HKEX stockbroking services on FSM Hong Kong
• Launch of bonds on FSM Malaysia and online DPMS in
Malaysia
• iFAST Singapore admitted as Trading Member of SGX-ST
and Clearing Member of CDP
• Launch of SGX stockbroking services in Singapore
• Launch of FSMOne in Hong Kong
• Launch of iFAST Fintech Solutions
• Launch of US stockbroking services on FSM Singapore
• Launch of US stockbroking services in Hong Kong
• iFAST Corp won the "Best Investor Relations - Silver
Award" in the small cap category at the Singapore
Corporate Awards (SCA) 2018
• Launch of FSMOne in Malaysia
• iFAST Singapore clinched “Fastest Growing SGX-ST
Member” Award at SGX Awards Night 2019
• iFAST Malaysia launched retail bonds under the Securities
Commission Malaysia’s new Seasoning Framework
• Launch of iFAST Global Markets (iGM) mobile app in
Singapore and Hong Kong
• iFAST Corp won the “Best Investor Relations – Bronze
Award”, while the Group’s CFO was named “Best CFO” in
the companies with less than S$300 million in market
capitalisation category at SCA 2019
• iFAST Singapore received the “Fastest Growing SGX-ST
Member” award for the second consecutive year
• Launch of newly revamped FSMOne mobile app in
Singapore, Hong Kong and Malaysia
• iFAST Malaysia obtains approval-in-principle for securities
dealing from the Securities Commission Malaysia
• iFAST Investment Management China Ltd registered as
Private Fund Manager in China
• iFAST Corp was awarded Best Return to Shareholders in the
financial sector for the Centurion Club 2020 organised by
The Edge Singapore.

B2B
B2B2C
49
iFAST Fintech Ecosystem
Fund
Houses
Stock
Exchanges
Banks/
Bond Dealers
Insurance
Companies &
Other Product
Providers
Access to iFAST’s Infrastructure
& Distribution Network in 5 markets
Connecting All to Help Investors Invest Globally and Profitably
B2C
Over 550,000
customer accounts
in 5 markets
Internet
Companies
FA Companies
Financial
Institutions
Banks
Over 460 companies,
and
over 9,900
wealth advisers
use iFAST B2B
platforms
across 5 markets
Fundsupermart.com / FSMOne.com /
Bondsupermart
Investment
Products
& Services
Fintech
Solutions
Research &
Advisory
Capabilities
Cash Management
facilities
Holds relevant
licences in 5
markets
(as at 31 Dec 2020)
iFAST Corporation Ltd. 50
The iFAST Fintech Ecosystem
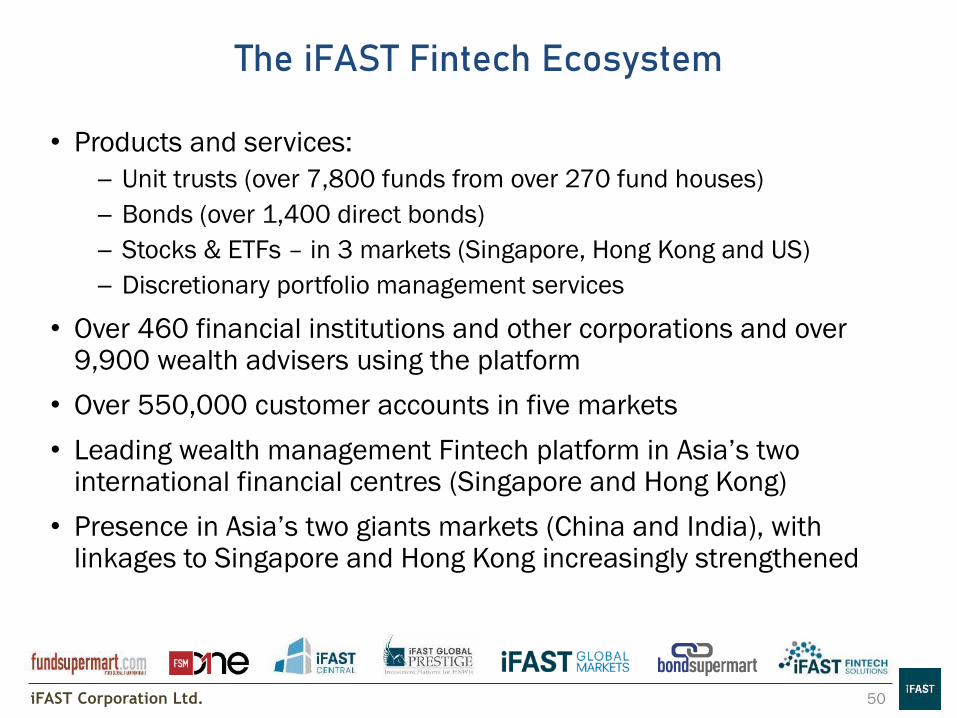
• Products and services:
─ Unit trusts (over 7,800 funds from over 270 fund houses)
─ Bonds (over 1,400 direct bonds)
─ Stocks & ETFs – in 3 markets (Singapore, Hong Kong and US)
─ Discretionary portfolio management services
• Over 460 financial institutions and other corporations and over 9,900 wealth advisers using the platform
• Over 550,000 customer accounts in five markets
• Leading wealth management Fintech platform in Asia’s two international financial centres (Singapore and Hong Kong)
• Presence in Asia’s two giants markets (China and India), with linkages to Singapore and Hong Kong increasingly strengthened
iFAST Corporation Ltd. 51
The Revenue Drivers
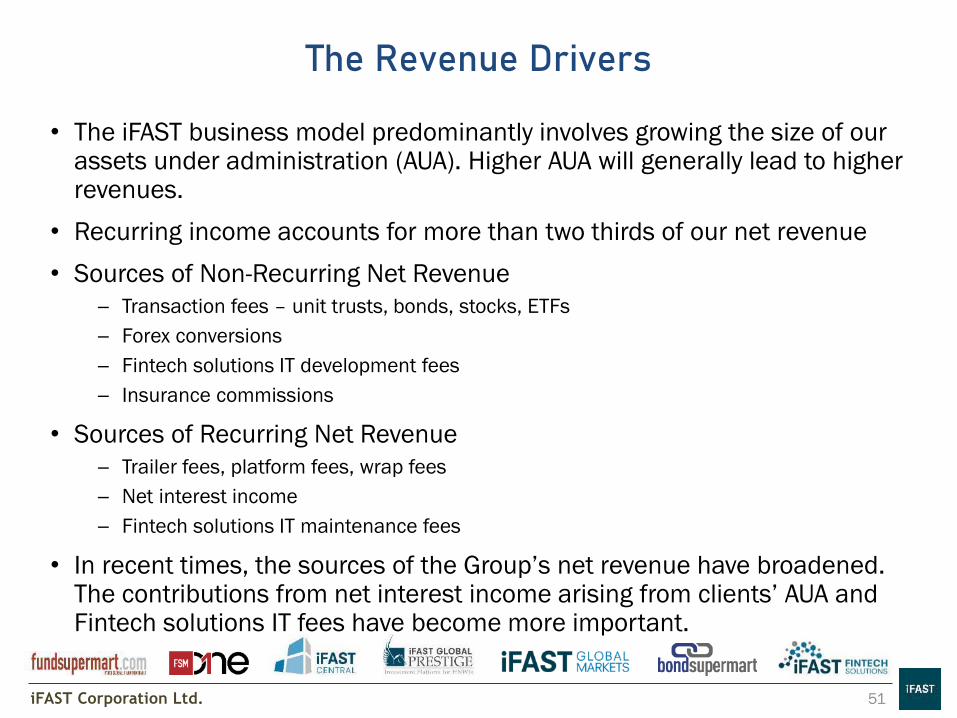
• The iFAST business model predominantly involves growing the size of our assets under administration (AUA). Higher AUA will generally lead to higher revenues.
• Recurring income accounts for more than two thirds of our net revenue
• Sources of Non-Recurring Net Revenue
─ Transaction fees – unit trusts, bonds, stocks, ETFs
─ Forex conversions
─ Fintech solutions IT development fees
─ Insurance commissions
• Sources of Recurring Net Revenue
─ Trailer fees, platform fees, wrap fees
─ Net interest income
─ Fintech solutions IT maintenance fees
• In recent times, the sources of the Group’s net revenue have broadened. The contributions from net interest income arising from clients’ AUA and Fintech solutions IT fees have become more important.

iFAST Corporation Ltd. 52
Licences Held and Products and Services Available (as at 31 December 2020)
LICENCES HELD:
• Registered Investment Adviser with SEBI
• Registered Mutual Fund Distributor with
Association of Mutual Funds in India
• Bombay Stock Exchange (BSE)
• Central Depository Services (India) Ltd
• Approved person of Central Insurance
Repository Ltd.
PRODUCTS AVAILABLE:
UT / Stocks
LICENCES HELD:
• Capital Market Services Licence [SC]
• Registered IUTA and IRPA [FIMM]
• Financial Advisers Licence [BNM]
PRODUCTS AVAILABLE:
UT / Bonds / DPMS / Insurance
LICENCES HELD:
• Type 1: Dealing in Securities [SFC]
• Type 4: Advising on Securities [SFC]
• Type 9: Asset Management [SFC]
• MPFA
• SEHK Participant
• HKSCC Participant
• Licensed Insurance Broker with Insurance Authority
PRODUCTS AVAILABLE:
UT / Bonds / Stocks / ETFs / DPMS
LICENCES HELD:
• Fund Distributor Qualification [CSRC]
• Associate Member of AMAC
• Member of SAMC
• Registered Private Fund Manager [AMAC]
PRODUCTS AVAILABLE:
UT
LICENCES HELD:
• Capital Markets Services Licence [MAS]
• Financial Adviser Licence [MAS]
• Exempt Insurance Broker [MAS]
• SGX Trading Member [SGX]
• CDP Depository and Clearing Agent [CDP]
PRODUCTS AVAILABLE:
UT / Bonds / Stocks / ETFs / DPMS / Insurance

iFAST Corporation Ltd.
B2C
DIY INVESTORS
• One platform, multiple
investment products
• Competitive and transparent
fee structure
• Award-winning websites and
mobile applications
• Availability of Investment
Advisers if advice is required
• Online discretionary
portfolio management
services (DPMS)
B2B
CUSTOMERS
• One platform, multiple investment products
• Adoption of recurring revenue business model based on Assets Under Administration (“AUA”)
• Platform performs efficient collection of fees
• IT solutions and backroom functions managed by platform
• Competitive fee-sharing structure • Research into investment products • Adoption of a wrap account which
seamlessly combines multiple investment product categories into one account
• Online discretionary portfolio management services (DPMS)
PRODUCT
PROVIDERS
• One platform, multiple
B2C and B2B customers
• No need to enter into
individual distribution
agreement and
business relationship
with customers
53
Our Value Proposition
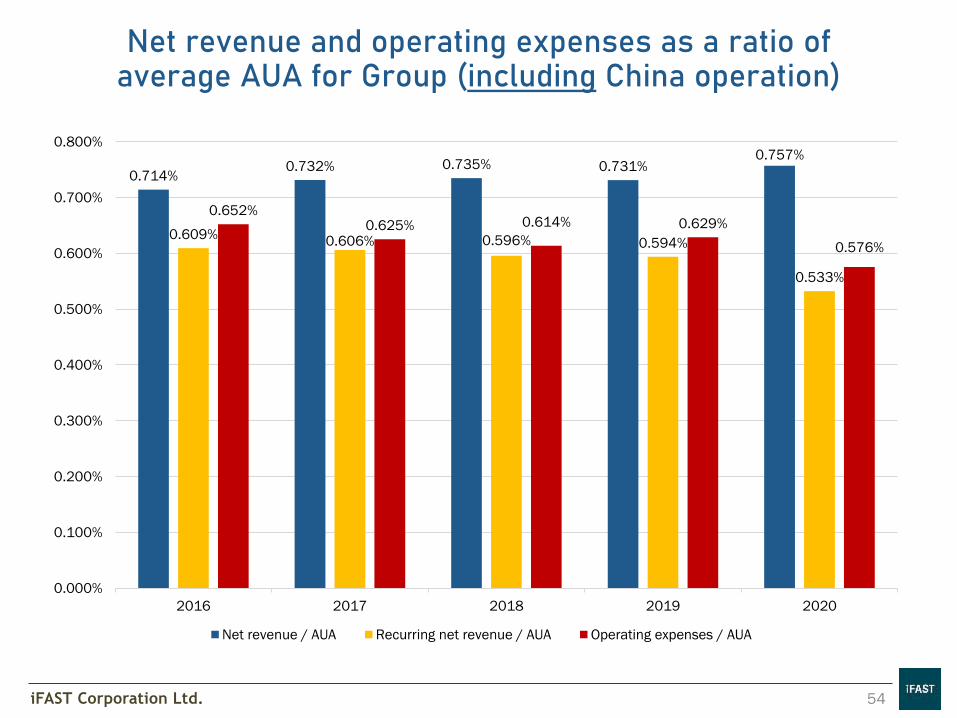
iFAST Corporation Ltd. 54
Net revenue and operating expenses as a ratio of average AUA for Group (including China operation)
0.714%0.732% 0.735% 0.731%
0.757%
0.609%0.606% 0.596% 0.594%
0.533%
0.652%0.625% 0.614% 0.629%
0.576%
0.000%
0.100%
0.200%
0.300%
0.400%
0.500%
0.600%
0.700%
0.800%
2016 2017 2018 2019 2020
Net revenue / AUA Recurring net revenue / AUA Operating expenses / AUA

iFAST Corporation Ltd. 55
Net revenue and operating expenses as a ratio of average AUA for Group (excluding China operation)
0.711%0.729% 0.736% 0.733%
0.753%
0.607%0.606% 0.599% 0.596%
0.534%
0.582%
0.556% 0.551% 0.572%
0.523%
0.000%
0.100%
0.200%
0.300%
0.400%
0.500%
0.600%
0.700%
0.800%
2016 2017 2018 2019 2020
Net revenue / AUA Recurring net revenue / AUA Operating expenses / AUA

iFAST Corporation Ltd. 56
Fees Illustration
FUND HOUSES
TRAILER FEE
PLATFORM FEE
UPFRONT FEE
WRAP FEE
B2B CUSTOMERS
B2B FINANCIAL
ADVISORY COMPANIES
PLATFORM FEE
UPFRONT FEEB2C CUSTOMERS
FINTECH SOLUTIONS
SERVICE FEES
OTHER
FACILITIES
FX CONVERSION FEES

iFAST Corporation Ltd.
4Q2020: Activities & Achievements
(L-R) Singapore: iFAST Corp organised a series of activities including food donation drive, food packing and distribution sessions, waterway clean up,
and virtual charity challenge under its CSR pillars “Caring for the Community”, “Conserving the Environment” and “Charity Through Sports: in 4Q2020.
(L-R) FSMOne.com Hong Kong conducted webinars to share the 4Q2020 Macro and Bond Market Outlook with its investors in October 2020;
iFAST Malaysia held its annual iFAST Awards Night 2020 on a smaller scale at Kuala Lumpur to recognise the achievements of top fund houses and advisers.
(L-R): iFAST Corp released its “Celebrating 20 Years” video series featuring the Group’s CEO and employees across the region in December 2020;
iFAST Global Markets (iGM) Singapore hosted the inaugural iGM SG Symposium in December 2020.
THANK YOU!For more information,
please visit: www.ifastcorp.com
iFAST Corporation Ltd.
TO HELP INVESTORS AROUND THE WORLD
INVEST GLOBALLY AND PROFITABLY