2020 estimated results 4q2020 and 2020 fiscal year webinar
TRANSCRIPT
2020 Estimated Results 4Q2020 and 2020 Fiscal YearWebinar, 27 January 2021
2
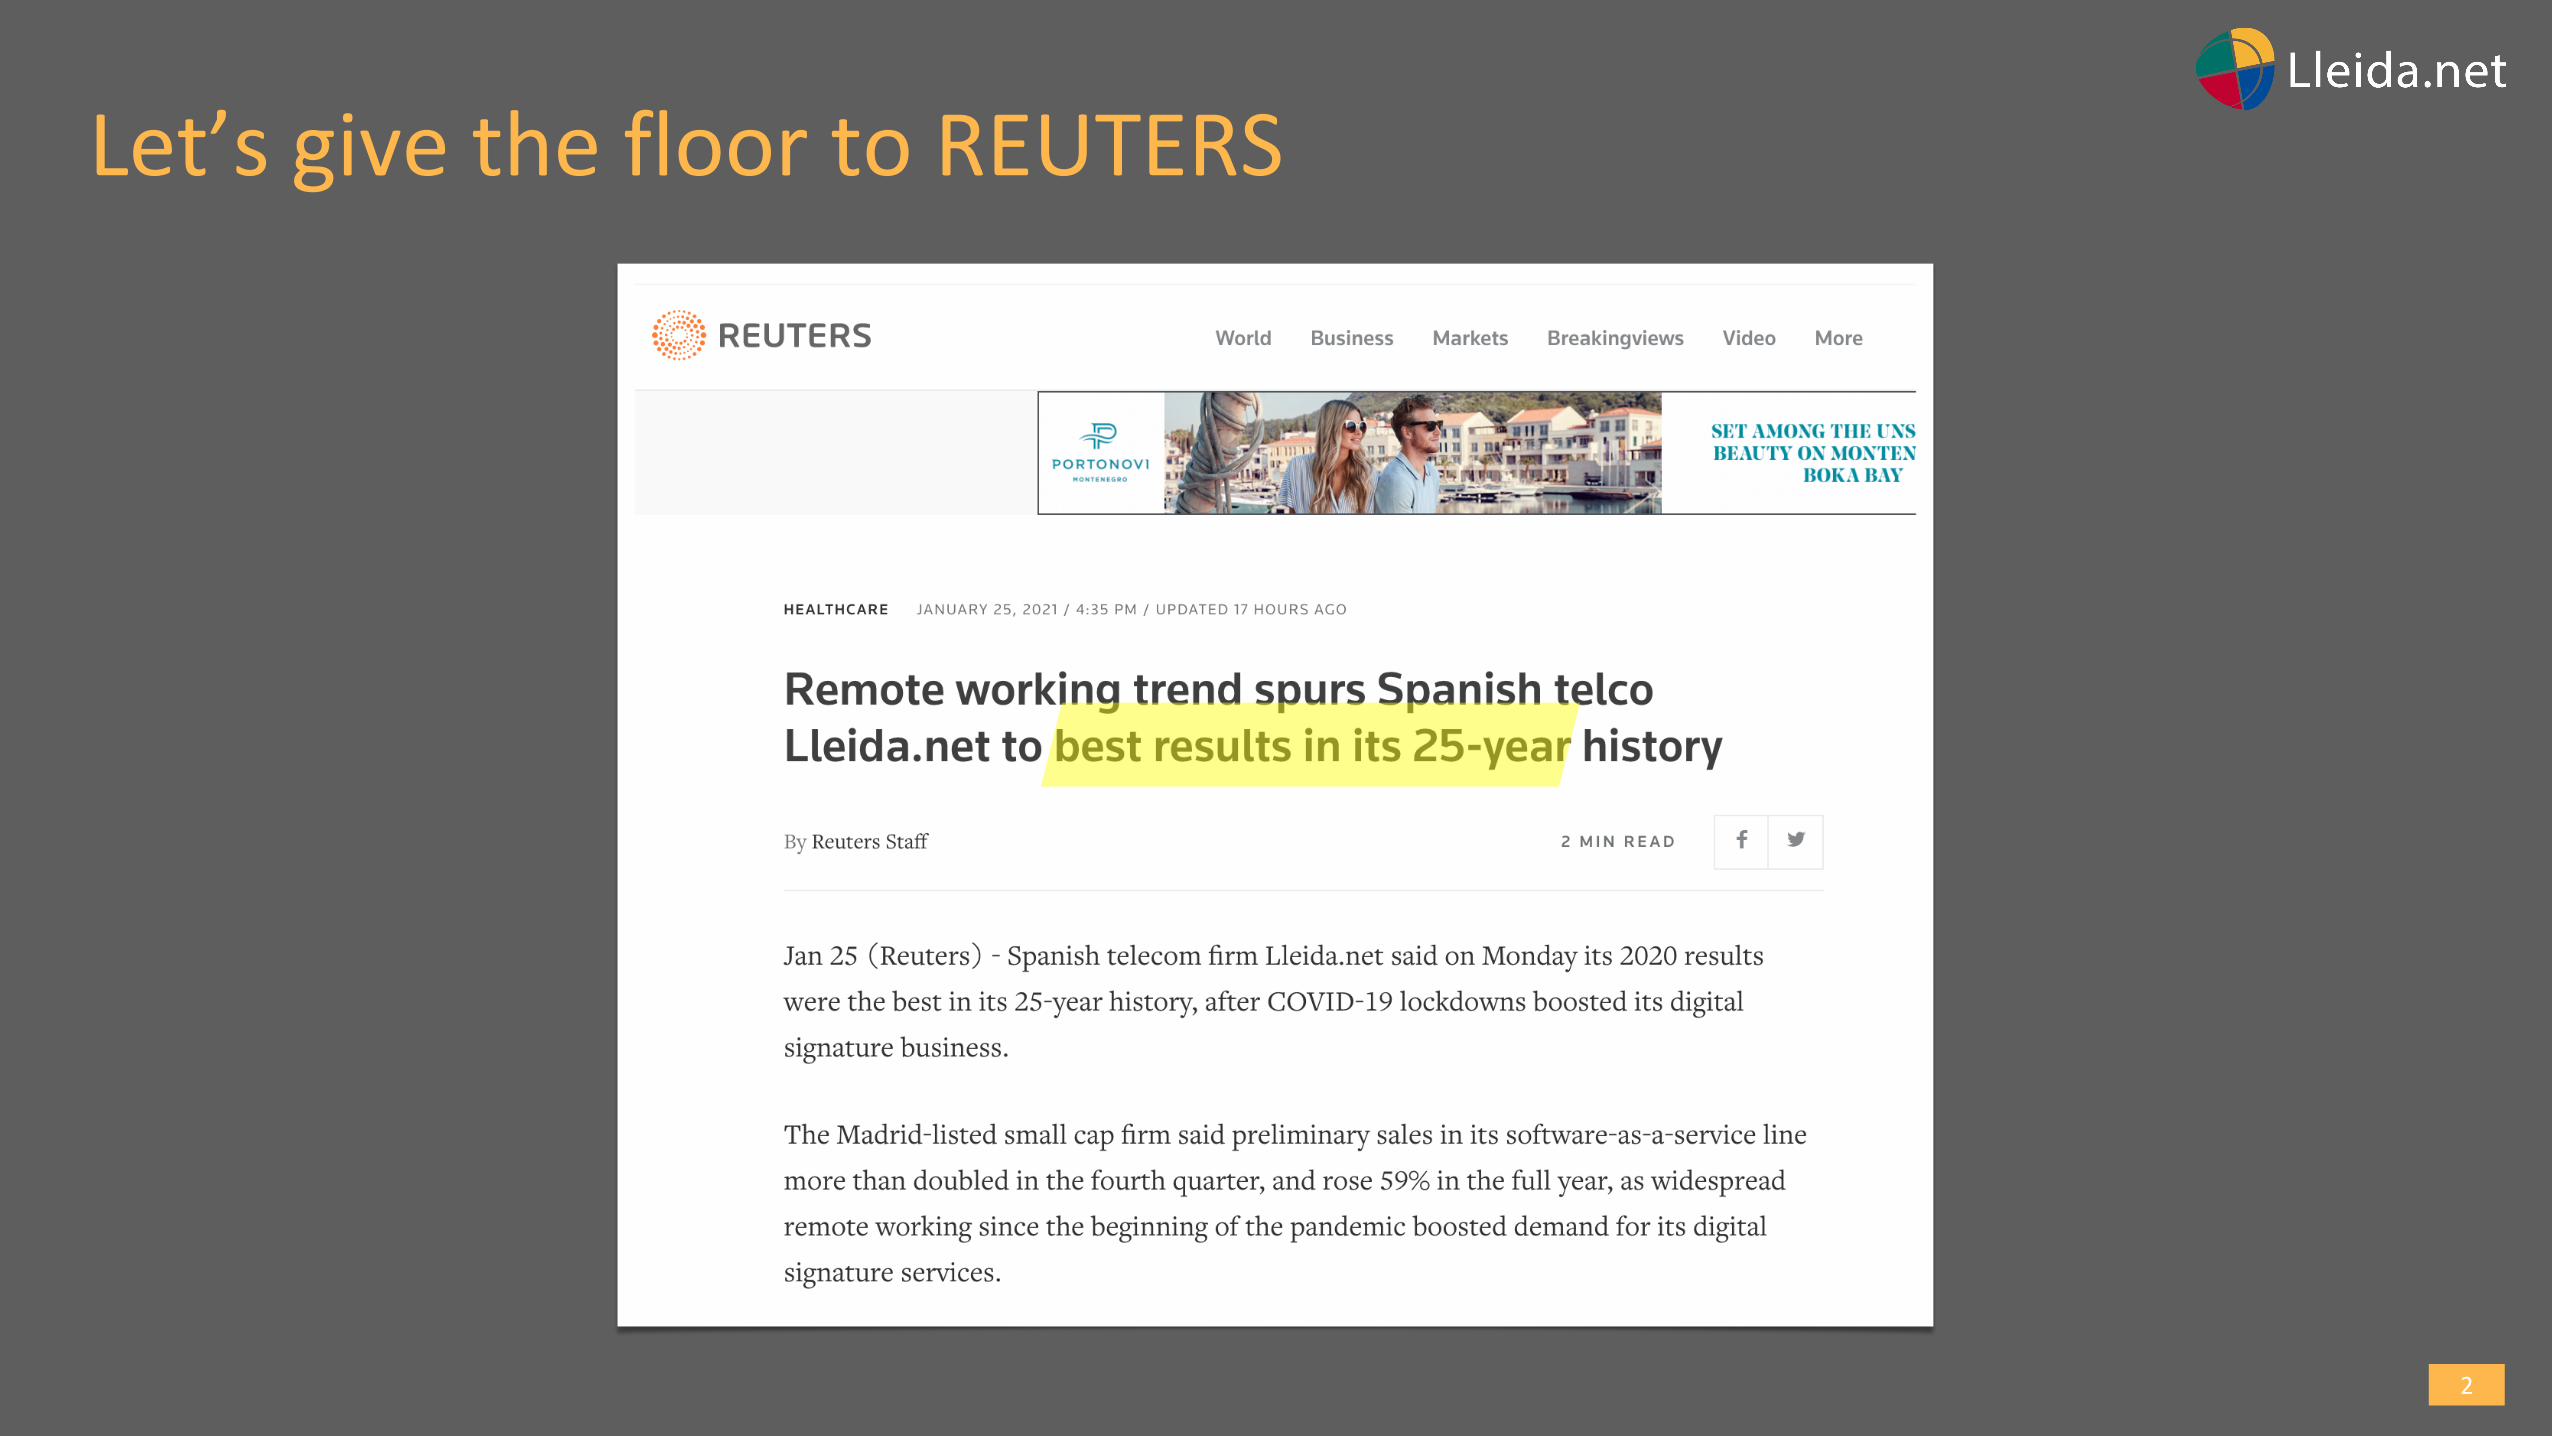
Let’s give the floor to REUTERS
3
TWO DAYS AGO WE PRESENTED OUR BEST
RESULTS EVER.
4
WE ARE A COMPANY:• With an accumulated growth of 20% in sales.
• Annual growth in the SaaS line of 59% and quarterly of 107%. We went public to
develop and enhance certification services
• International agreements on four continents
• With one of the best performance of the European stock market last year.
• More than 2000 shareholders.
• With the largest portfolio of patents in the sector.
• With net financial debt in our favour
• With five million euros in cash
• Listed on three markets: OTCQX New York, BME Growth and Euronext Growth.
• With 20 quarters with positive EBITDA. Four years making money.
5
2020 RESULTS WERE AS FOLLOWS
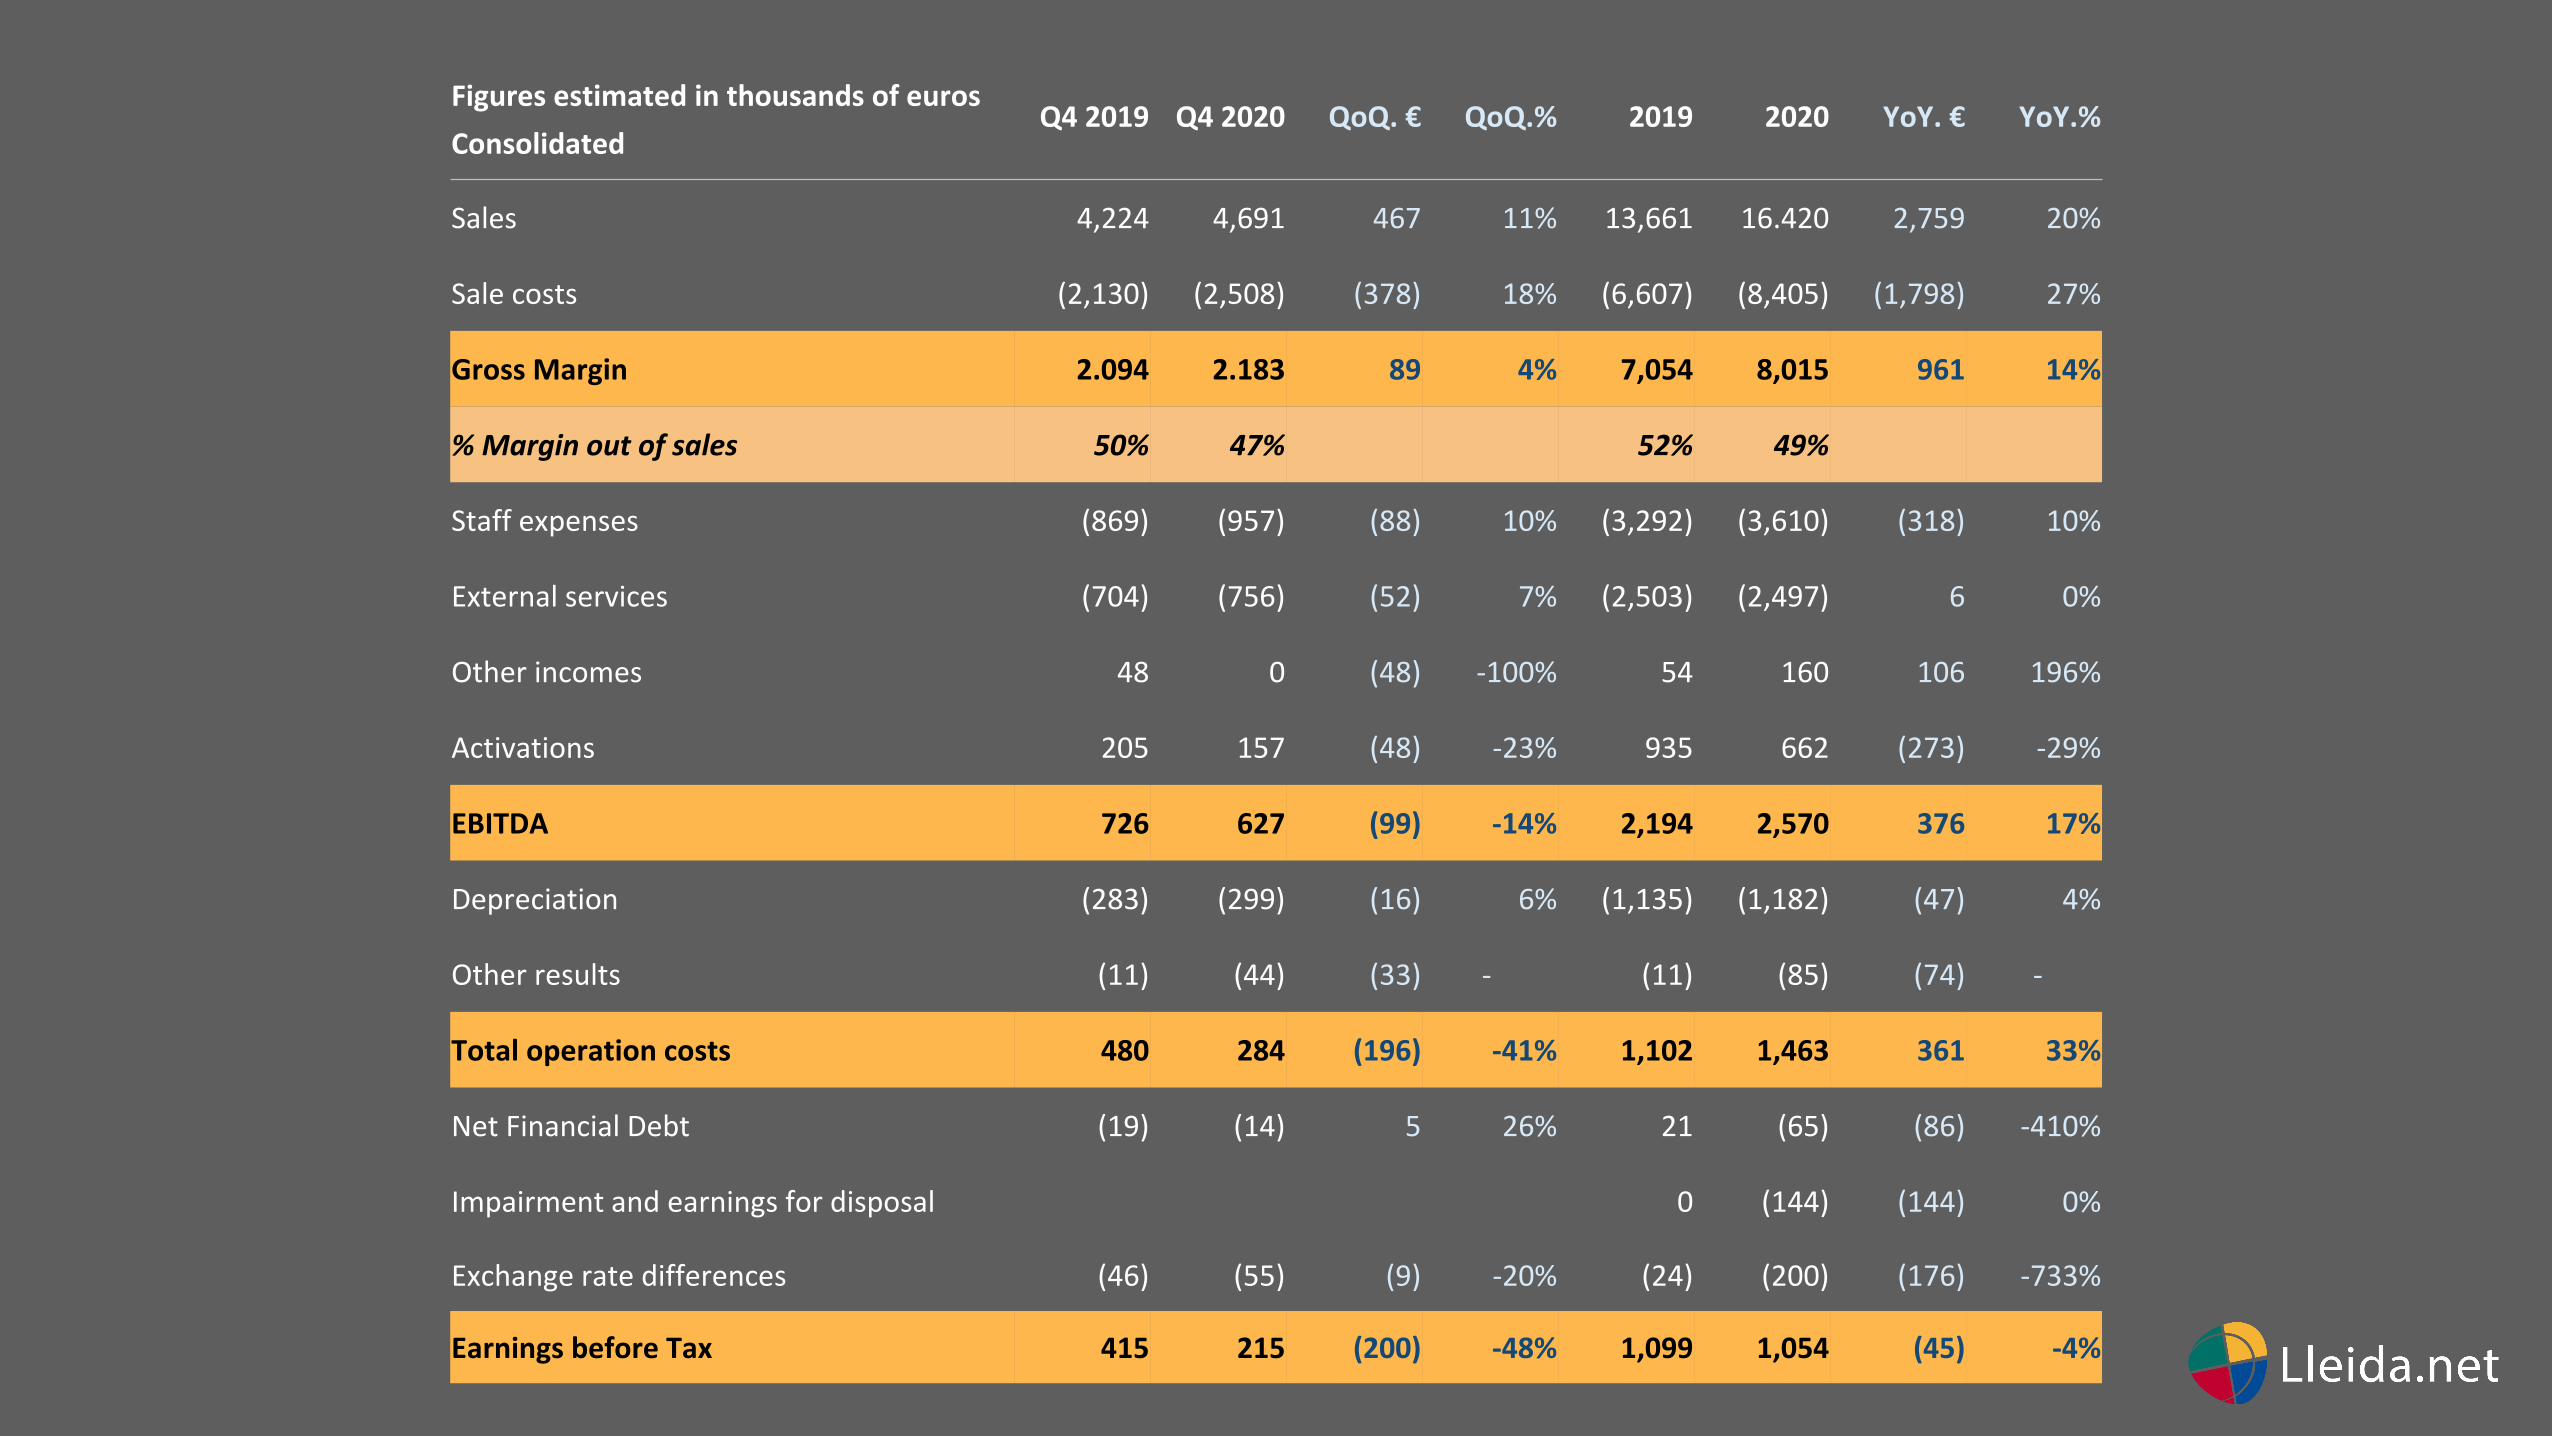
Figures estimated in thousands of euros
ConsolidatedQ4 2019 Q4 2020 QoQ. € QoQ.% 2019 2020 YoY. € YoY.%
Sales 4,224 4,691 467 11% 13,661 16.420 2,759 20%
Sale costs (2,130) (2,508) (378) 18% (6,607) (8,405) (1,798) 27%
Gross Margin 2.094 2.183 89 4% 7,054 8,015 961 14%
% Margin out of sales 50% 47% 52% 49%
Staff expenses (869) (957) (88) 10% (3,292) (3,610) (318) 10%
External services (704) (756) (52) 7% (2,503) (2,497) 6 0%
Other incomes 48 0 (48) -100% 54 160 106 196%
Activations 205 157 (48) -23% 935 662 (273) -29%
EBITDA 726 627 (99) -14% 2,194 2,570 376 17%
Depreciation (283) (299) (16) 6% (1,135) (1,182) (47) 4%
Other results (11) (44) (33) - (11) (85) (74) -
Total operation costs 480 284 (196) -41% 1,102 1,463 361 33%
Net Financial Debt (19) (14) 5 26% 21 (65) (86) -410%
Impairment and earnings for disposal 0 (144) (144) 0%
Exchange rate differences (46) (55) (9) -20% (24) (200) (176) -733%
Earnings before Tax 415 215 (200) -48% 1,099 1,054 (45) -4%
7
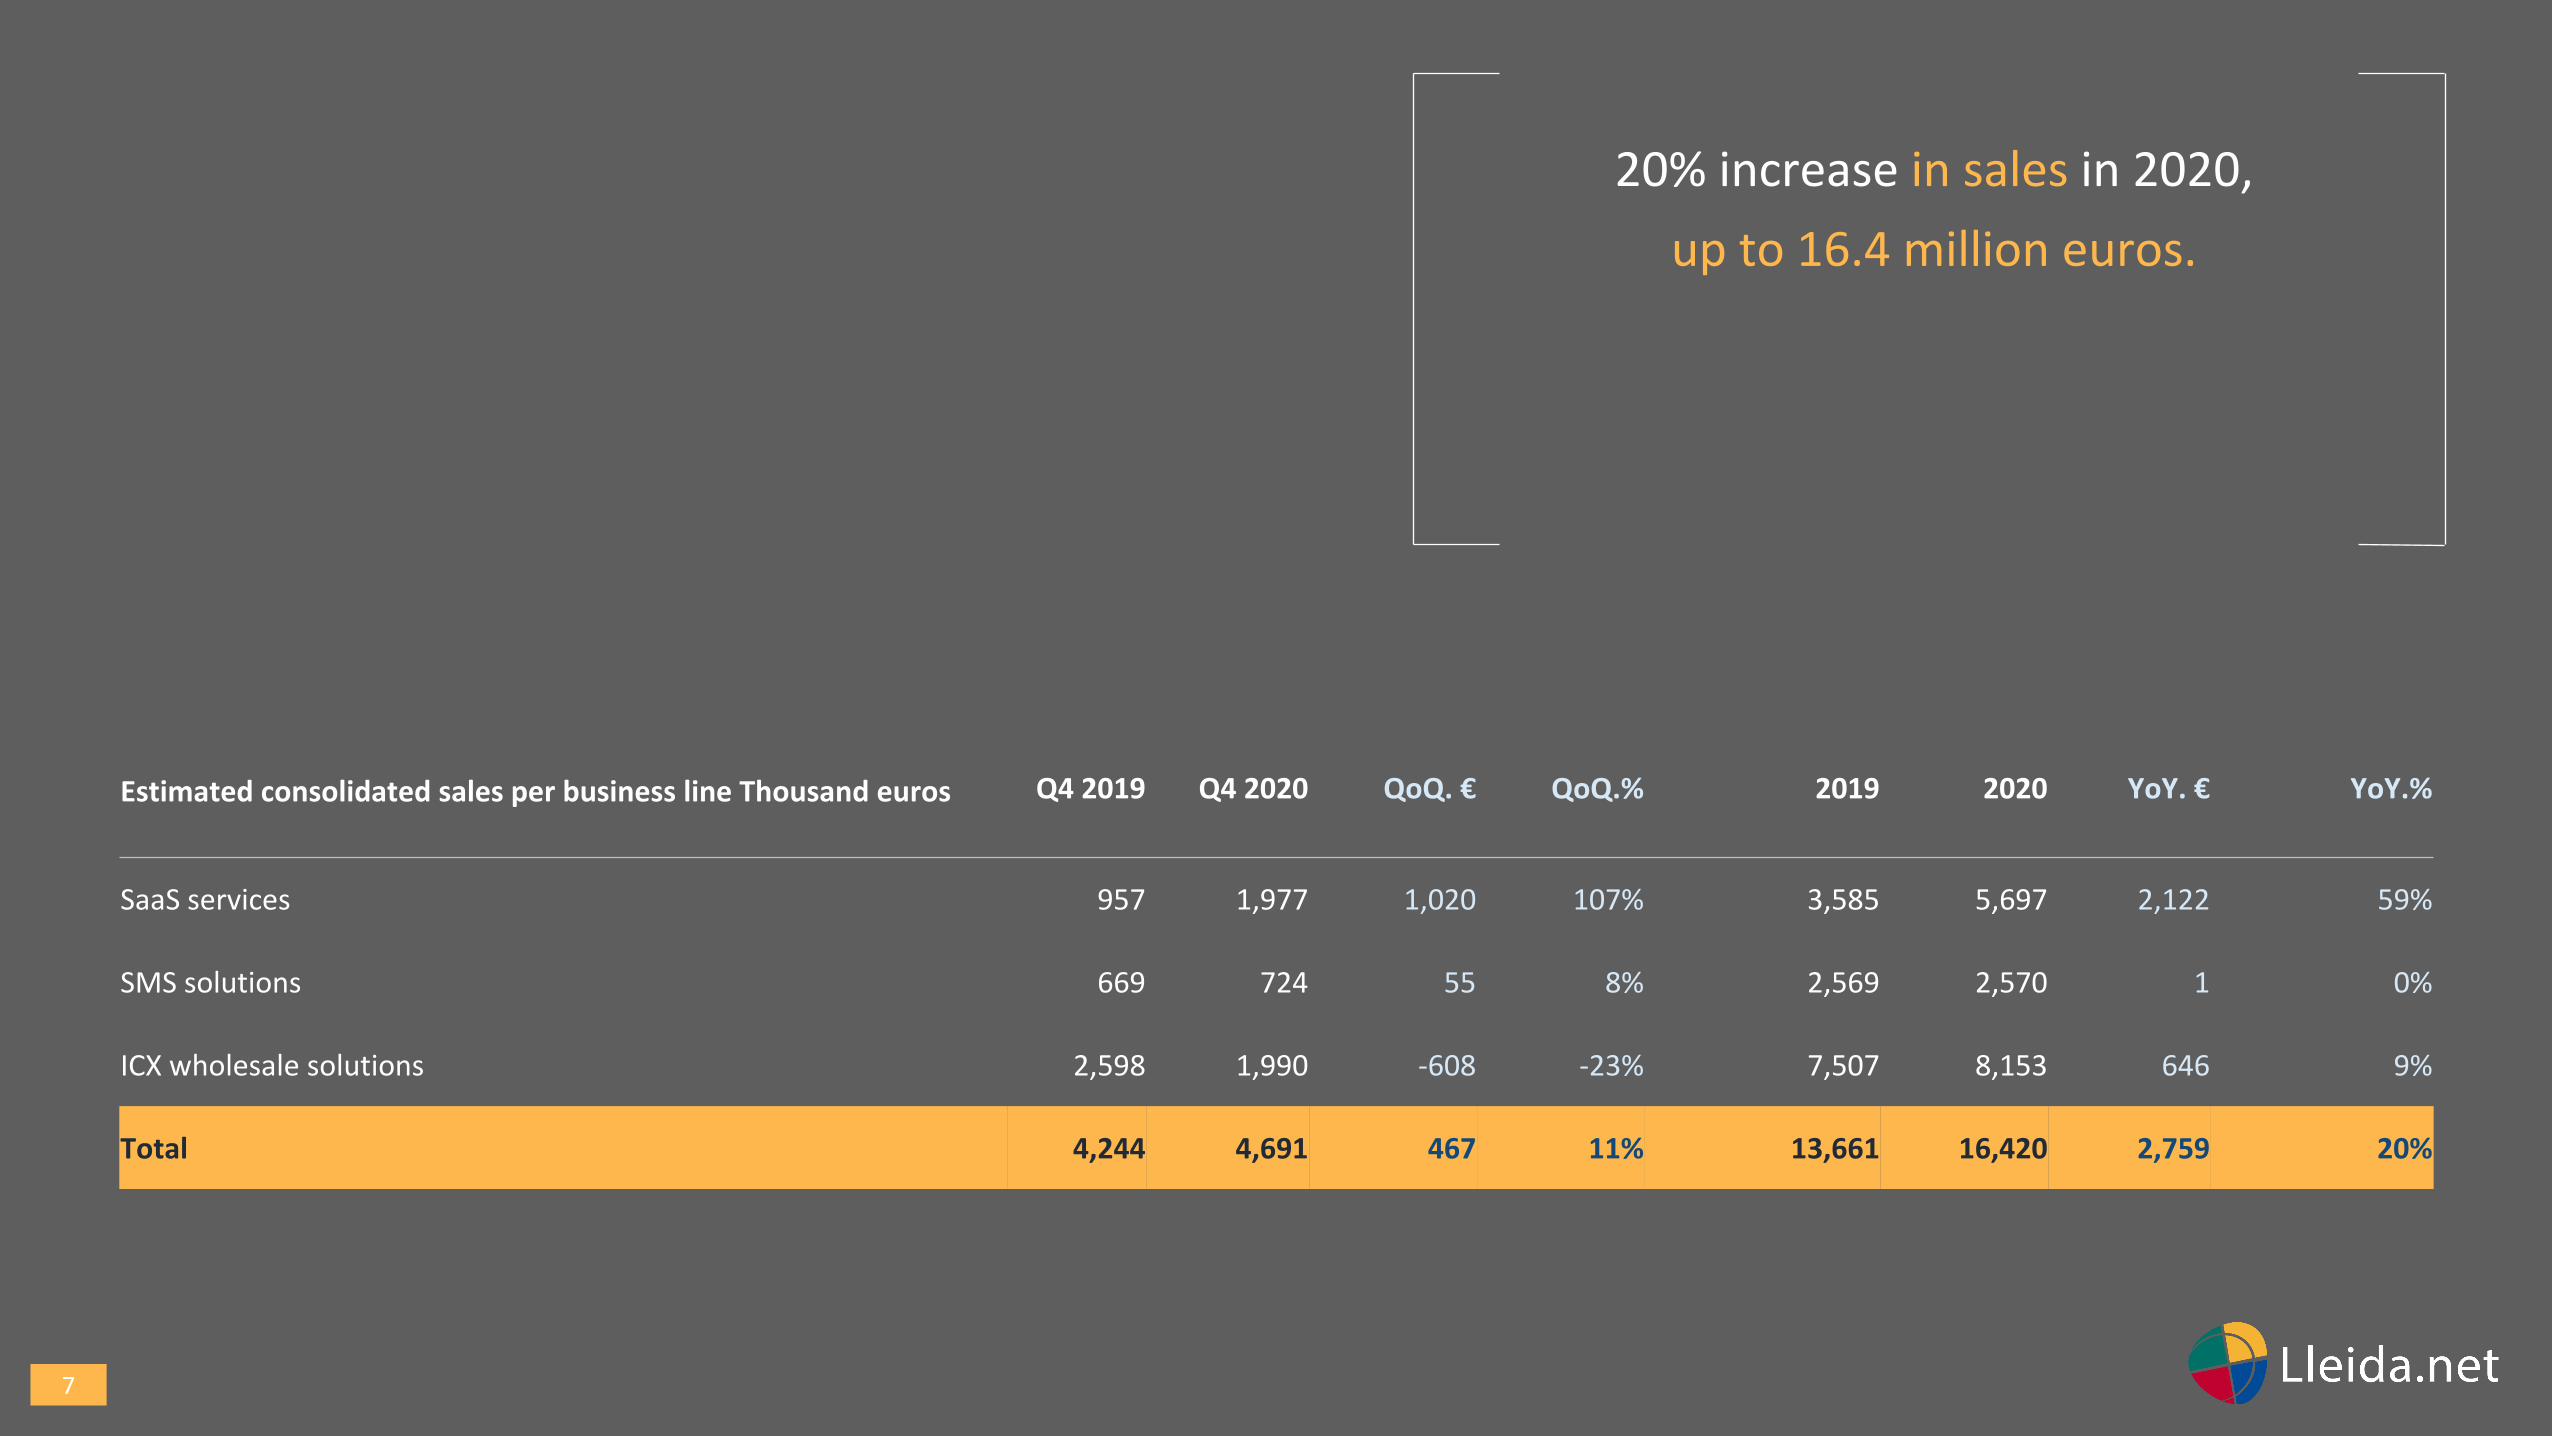
20% increase in sales in 2020,
up to 16.4 million euros.
Estimated consolidated sales per business line Thousand euros Q4 2019 Q4 2020 QoQ. € QoQ.% 2019 2020 YoY. € YoY.%
SaaS services 957 1,977 1,020 107% 3,585 5,697 2,122 59%
SMS solutions 669 724 55 8% 2,569 2,570 1 0%
ICX wholesale solutions 2,598 1,990 -608 -23% 7,507 8,153 646 9%
Total 4,244 4,691 467 11% 13,661 16,420 2,759 20%
8
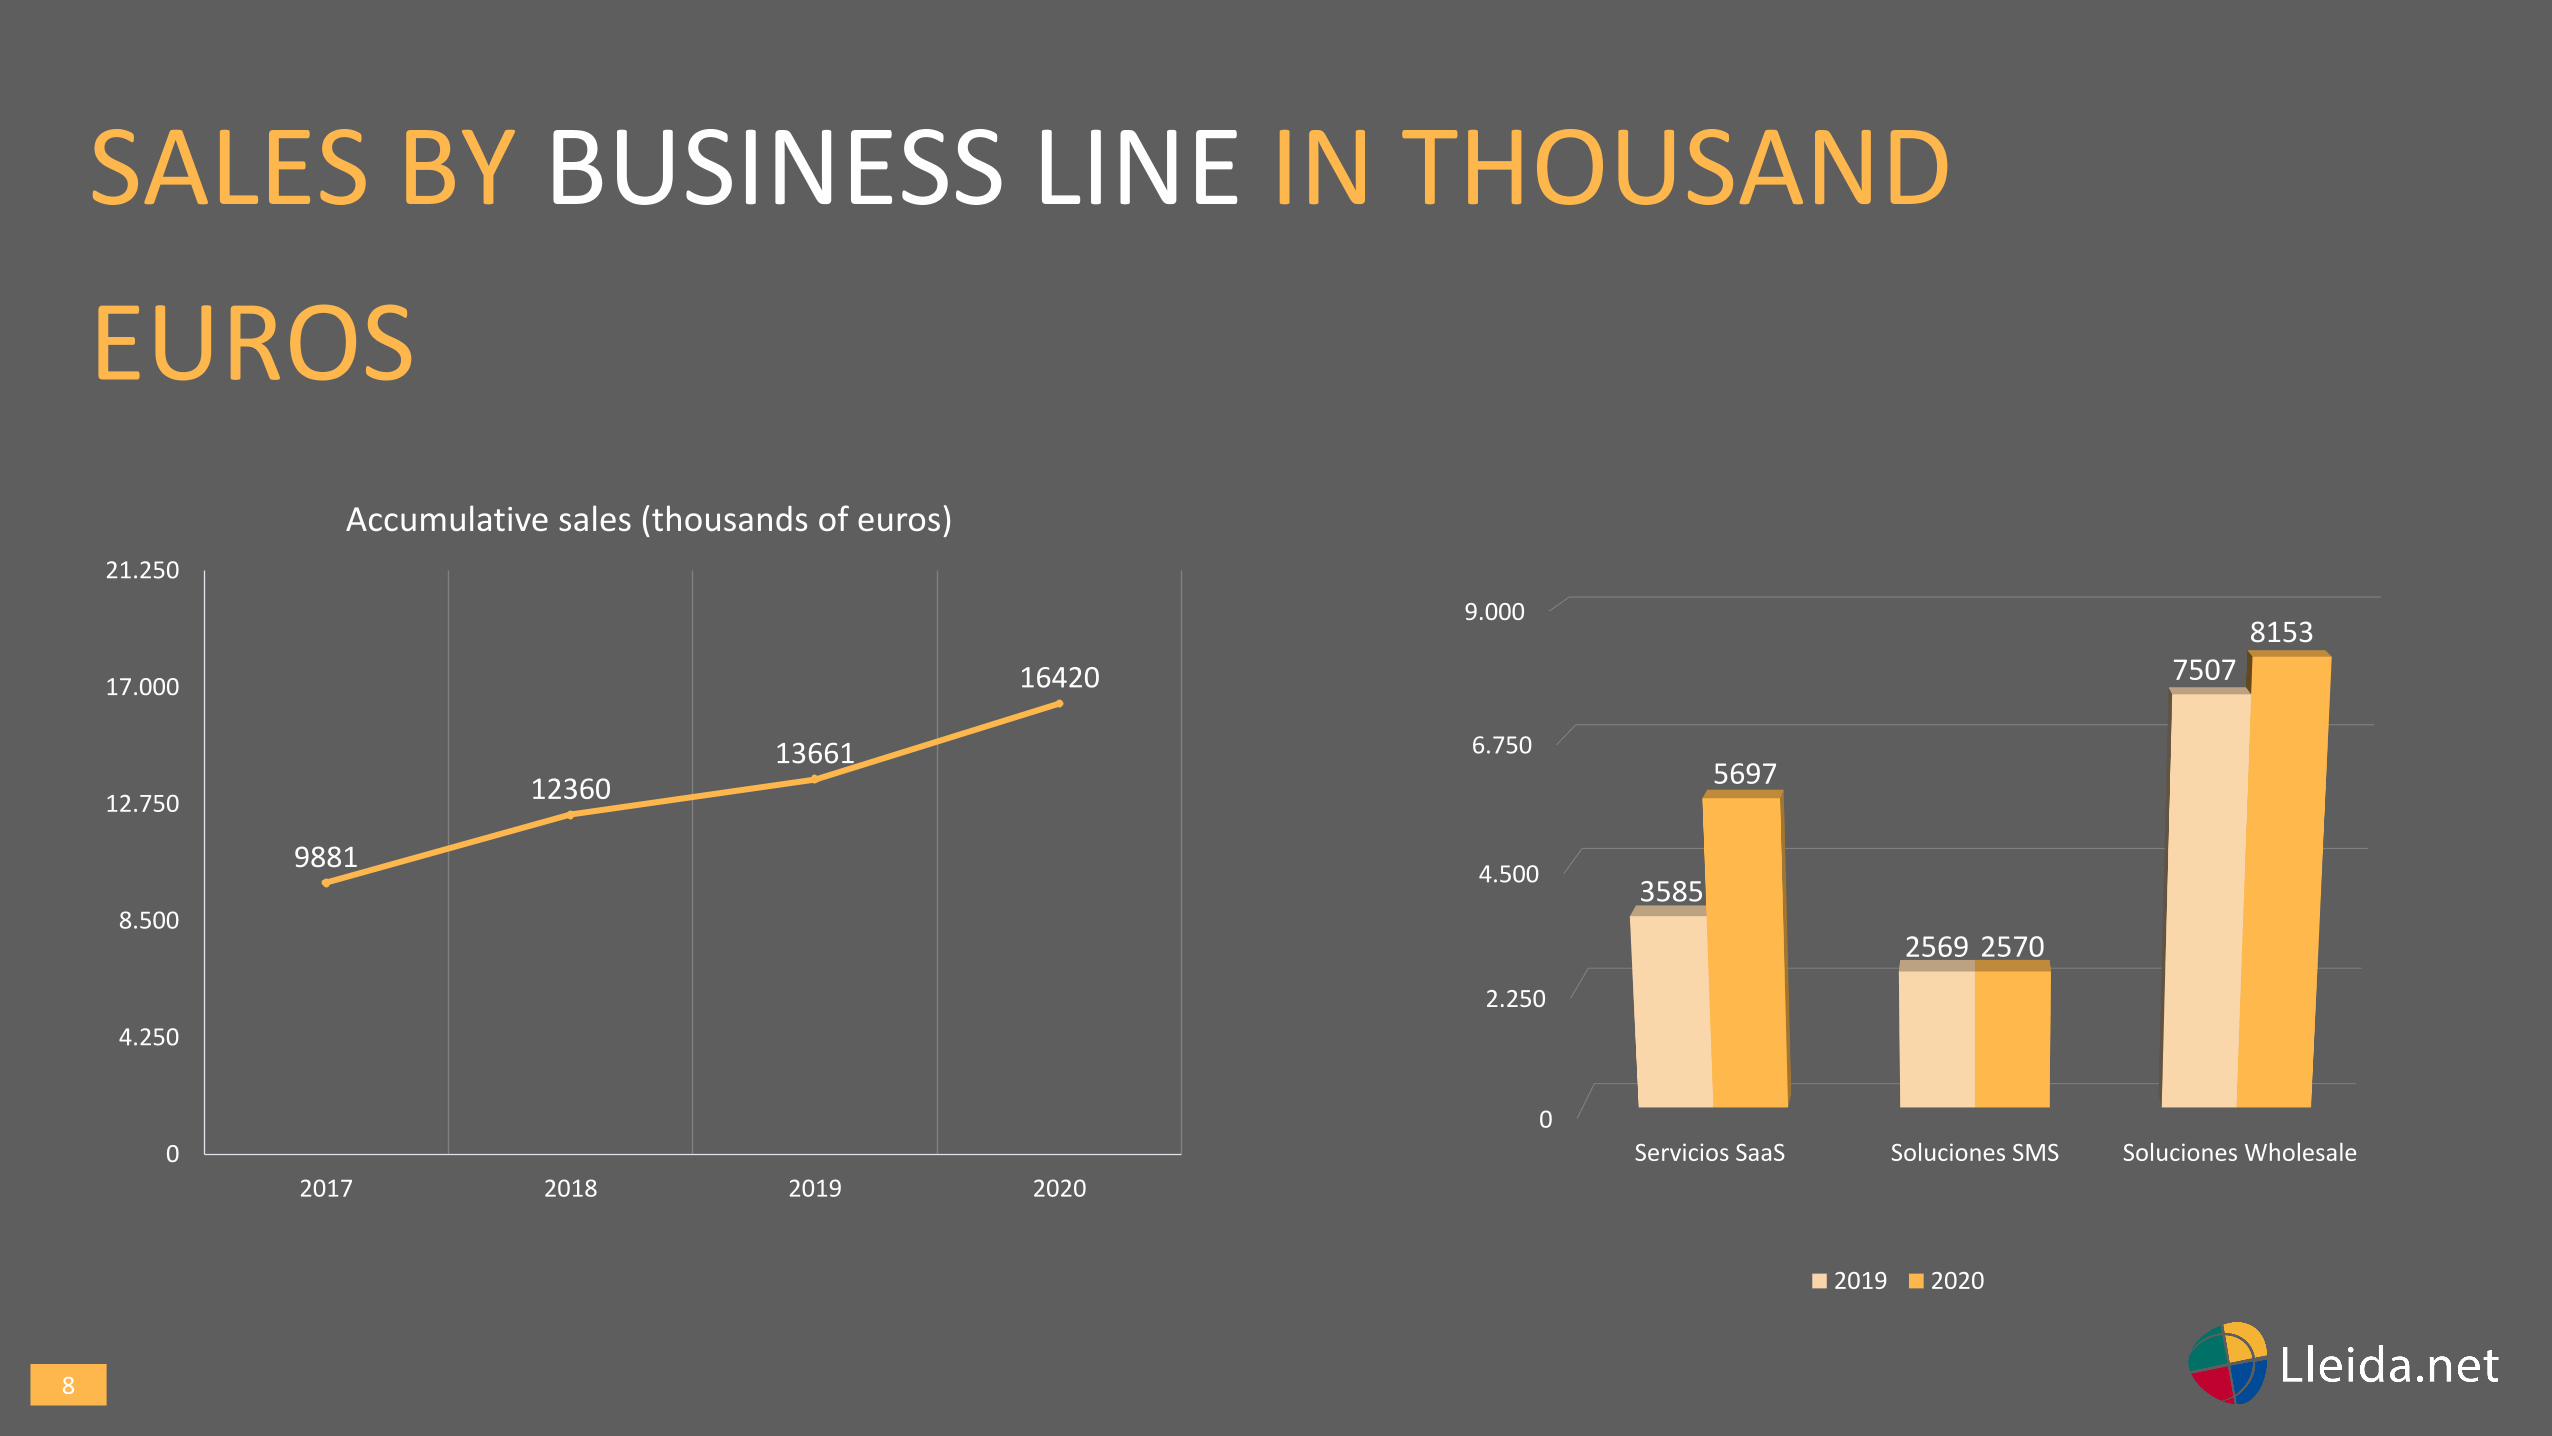
9881
1236013661
16420
0
4.250
8.500
12.750
17.000
21.250
2017 2018 2019 2020
Accumulative sales (thousands of euros)
SALES BY BUSINESS LINE IN THOUSAND
EUROS
0
2.250
4.500
6.750
9.000
Servicios SaaS Soluciones SMS Soluciones Wholesale
3585
2569
7507
5697
2570
8153
2019 2020
9
26603166
3585
5697
0
1.500
3.000
4.500
6.000
2017 2018 2019 2020
SaaS Accumulative sales (thousands of euros)
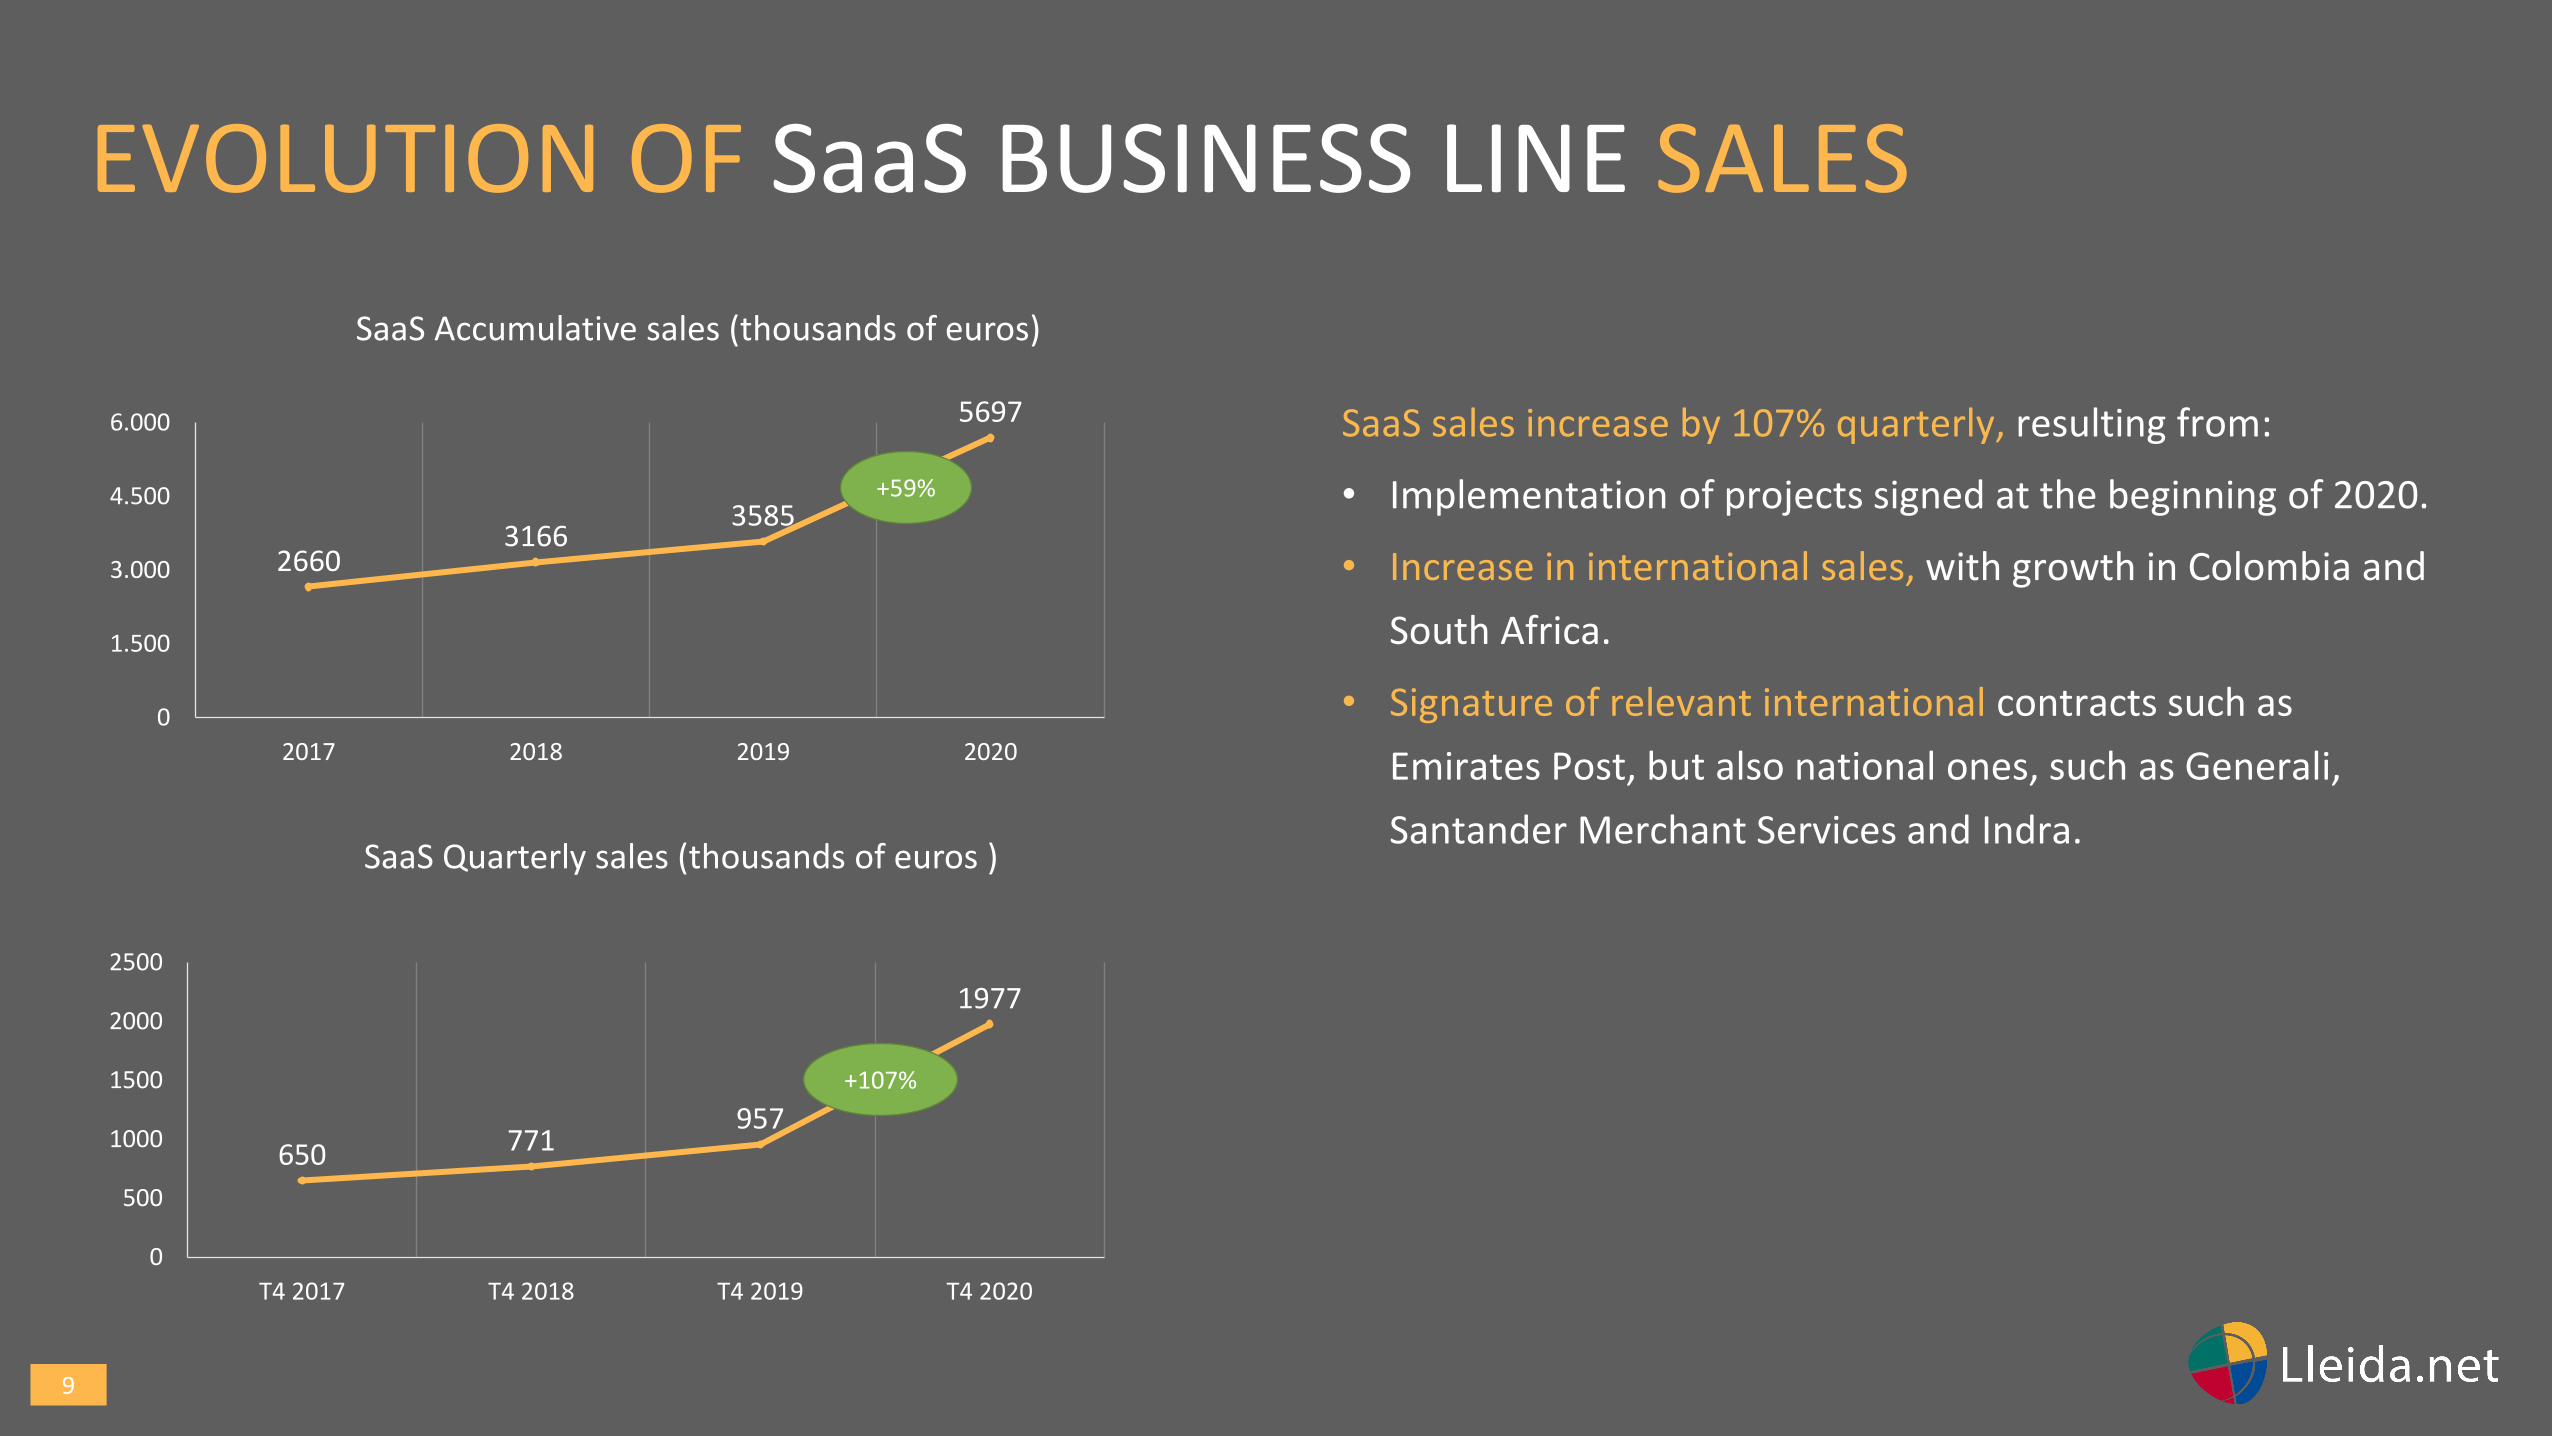
SaaS sales increase by 107% quarterly, resulting from:
• Implementation of projects signed at the beginning of 2020.
• Increase in international sales, with growth in Colombia and
South Africa.
• Signature of relevant international contracts such as
Emirates Post, but also national ones, such as Generali,
Santander Merchant Services and Indra.
EVOLUTION OF SaaS BUSINESS LINE SALES
+59%
650 771957
1977
0
500
1000
1500
2000
2500
T4 2017 T4 2018 T4 2019 T4 2020
SaaS Quarterly sales (thousands of euros )
+107%
10
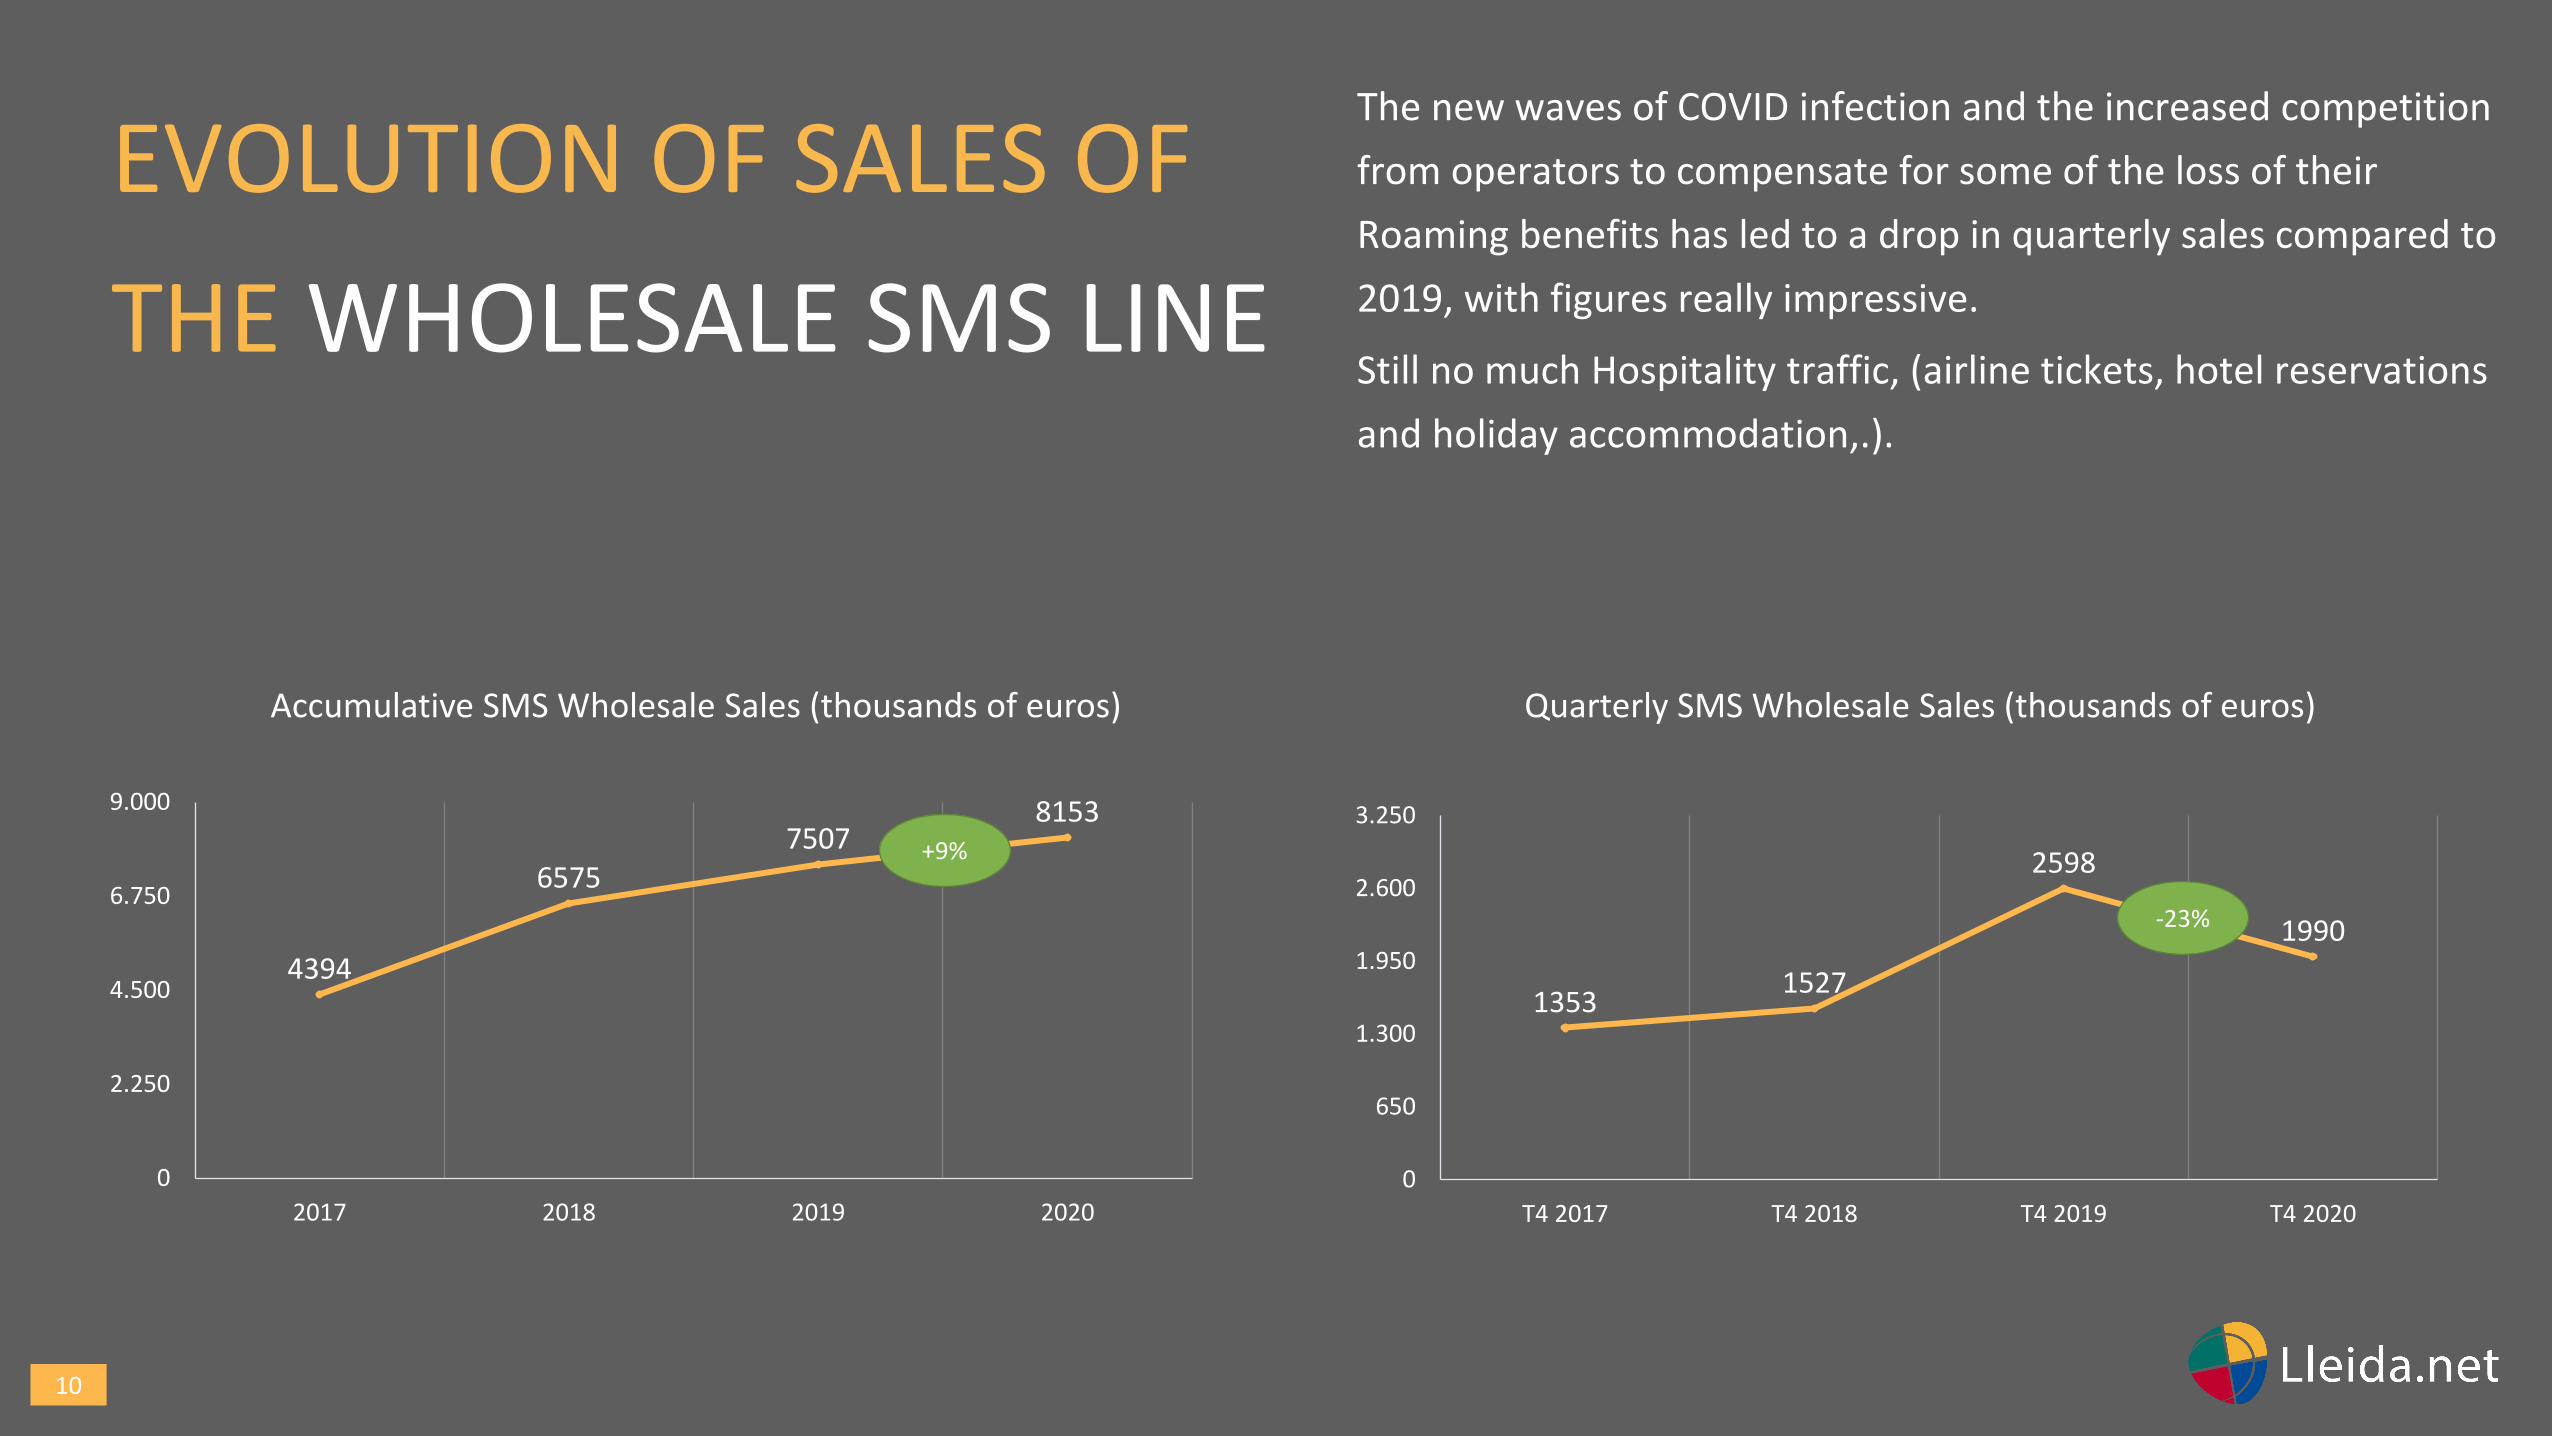
The new waves of COVID infection and the increased competition
from operators to compensate for some of the loss of their
Roaming benefits has led to a drop in quarterly sales compared to
2019, with figures really impressive.
Still no much Hospitality traffic, (airline tickets, hotel reservations
and holiday accommodation,.).
EVOLUTION OF SALES OF
THE WHOLESALE SMS LINE
4394
65757507
8153
0
2.250
4.500
6.750
9.000
2017 2018 2019 2020
Accumulative SMS Wholesale Sales (thousands of euros)
+9%
13531527
2598
1990
0
650
1.300
1.950
2.600
3.250
T4 2017 T4 2018 T4 2019 T4 2020
Quarterly SMS Wholesale Sales (thousands of euros)
-23%
11
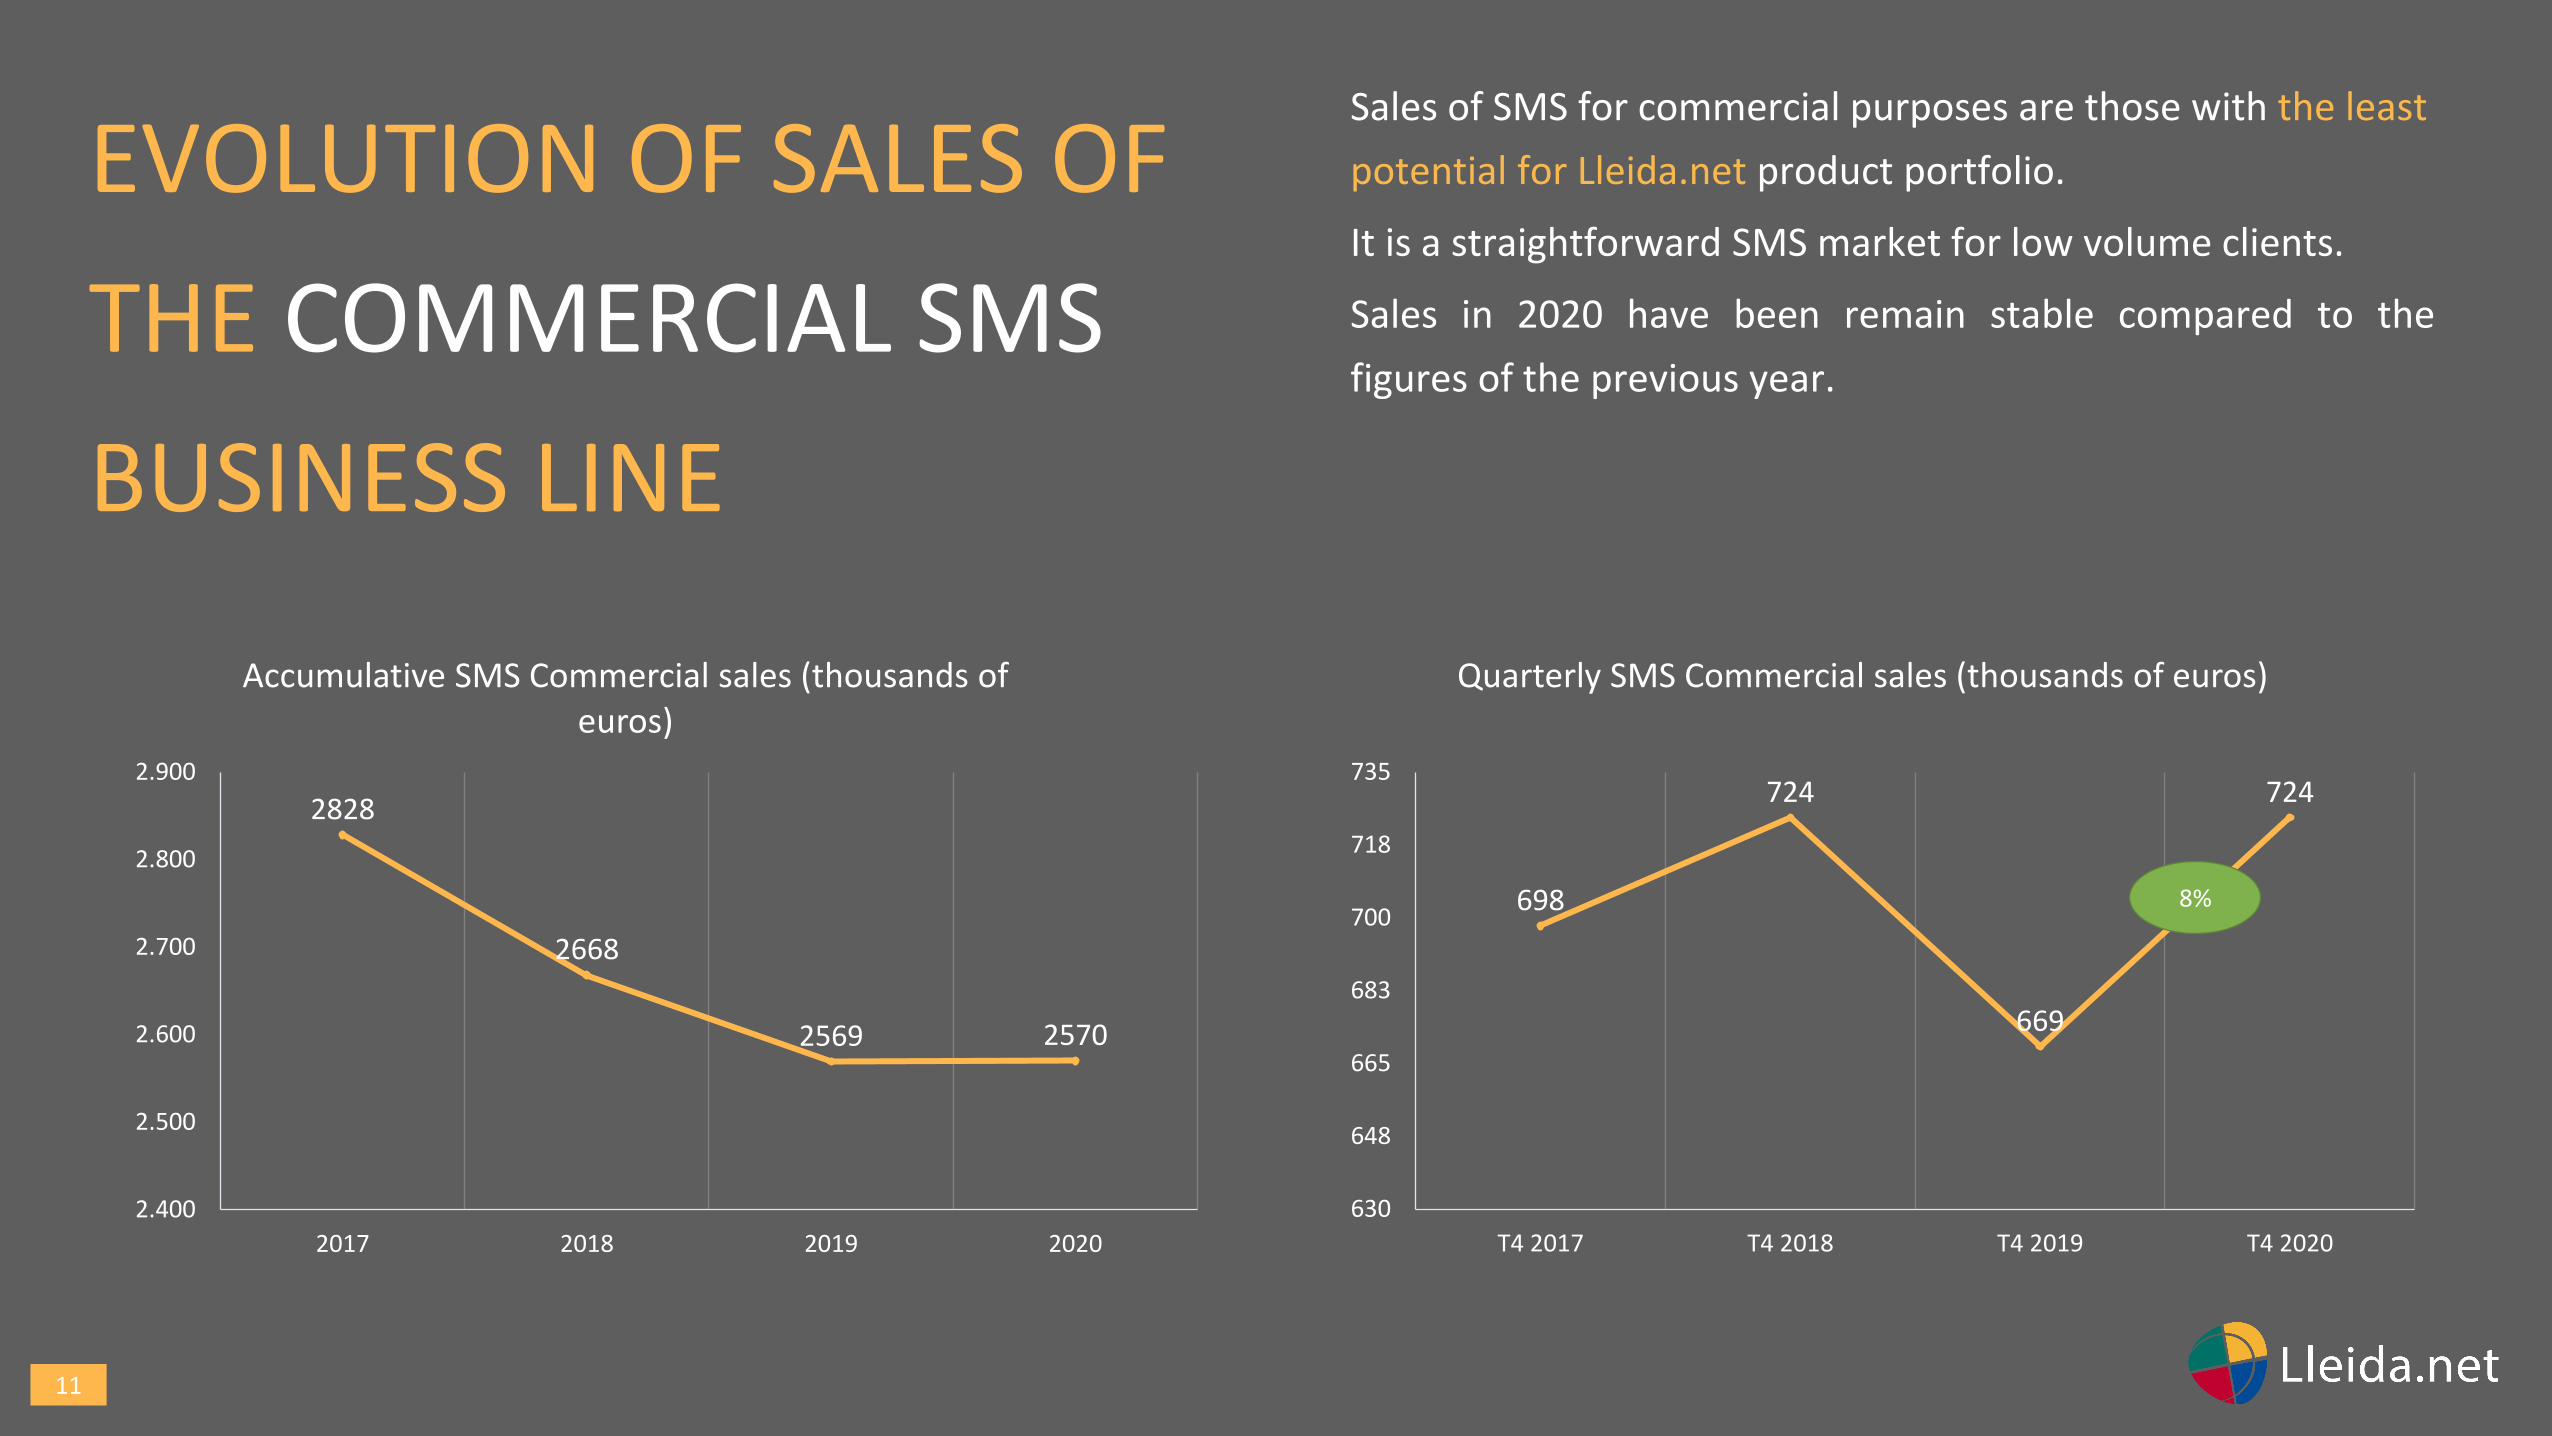
EVOLUTION OF SALES OF
THE COMMERCIAL SMS
BUSINESS LINE
Sales of SMS for commercial purposes are those with the least
potential for Lleida.net product portfolio.
It is a straightforward SMS market for low volume clients.
Sales in 2020 have been remain stable compared to the
figures of the previous year.
2828
2668
2569 2570
2.400
2.500
2.600
2.700
2.800
2.900
2017 2018 2019 2020
Accumulative SMS Commercial sales (thousands of euros)
698
724
669
724
630
648
665
683
700
718
735
T4 2017 T4 2018 T4 2019 T4 2020
Quarterly SMS Commercial sales (thousands of euros)
8%
12
GROSS MARGIN
EVOLUTION
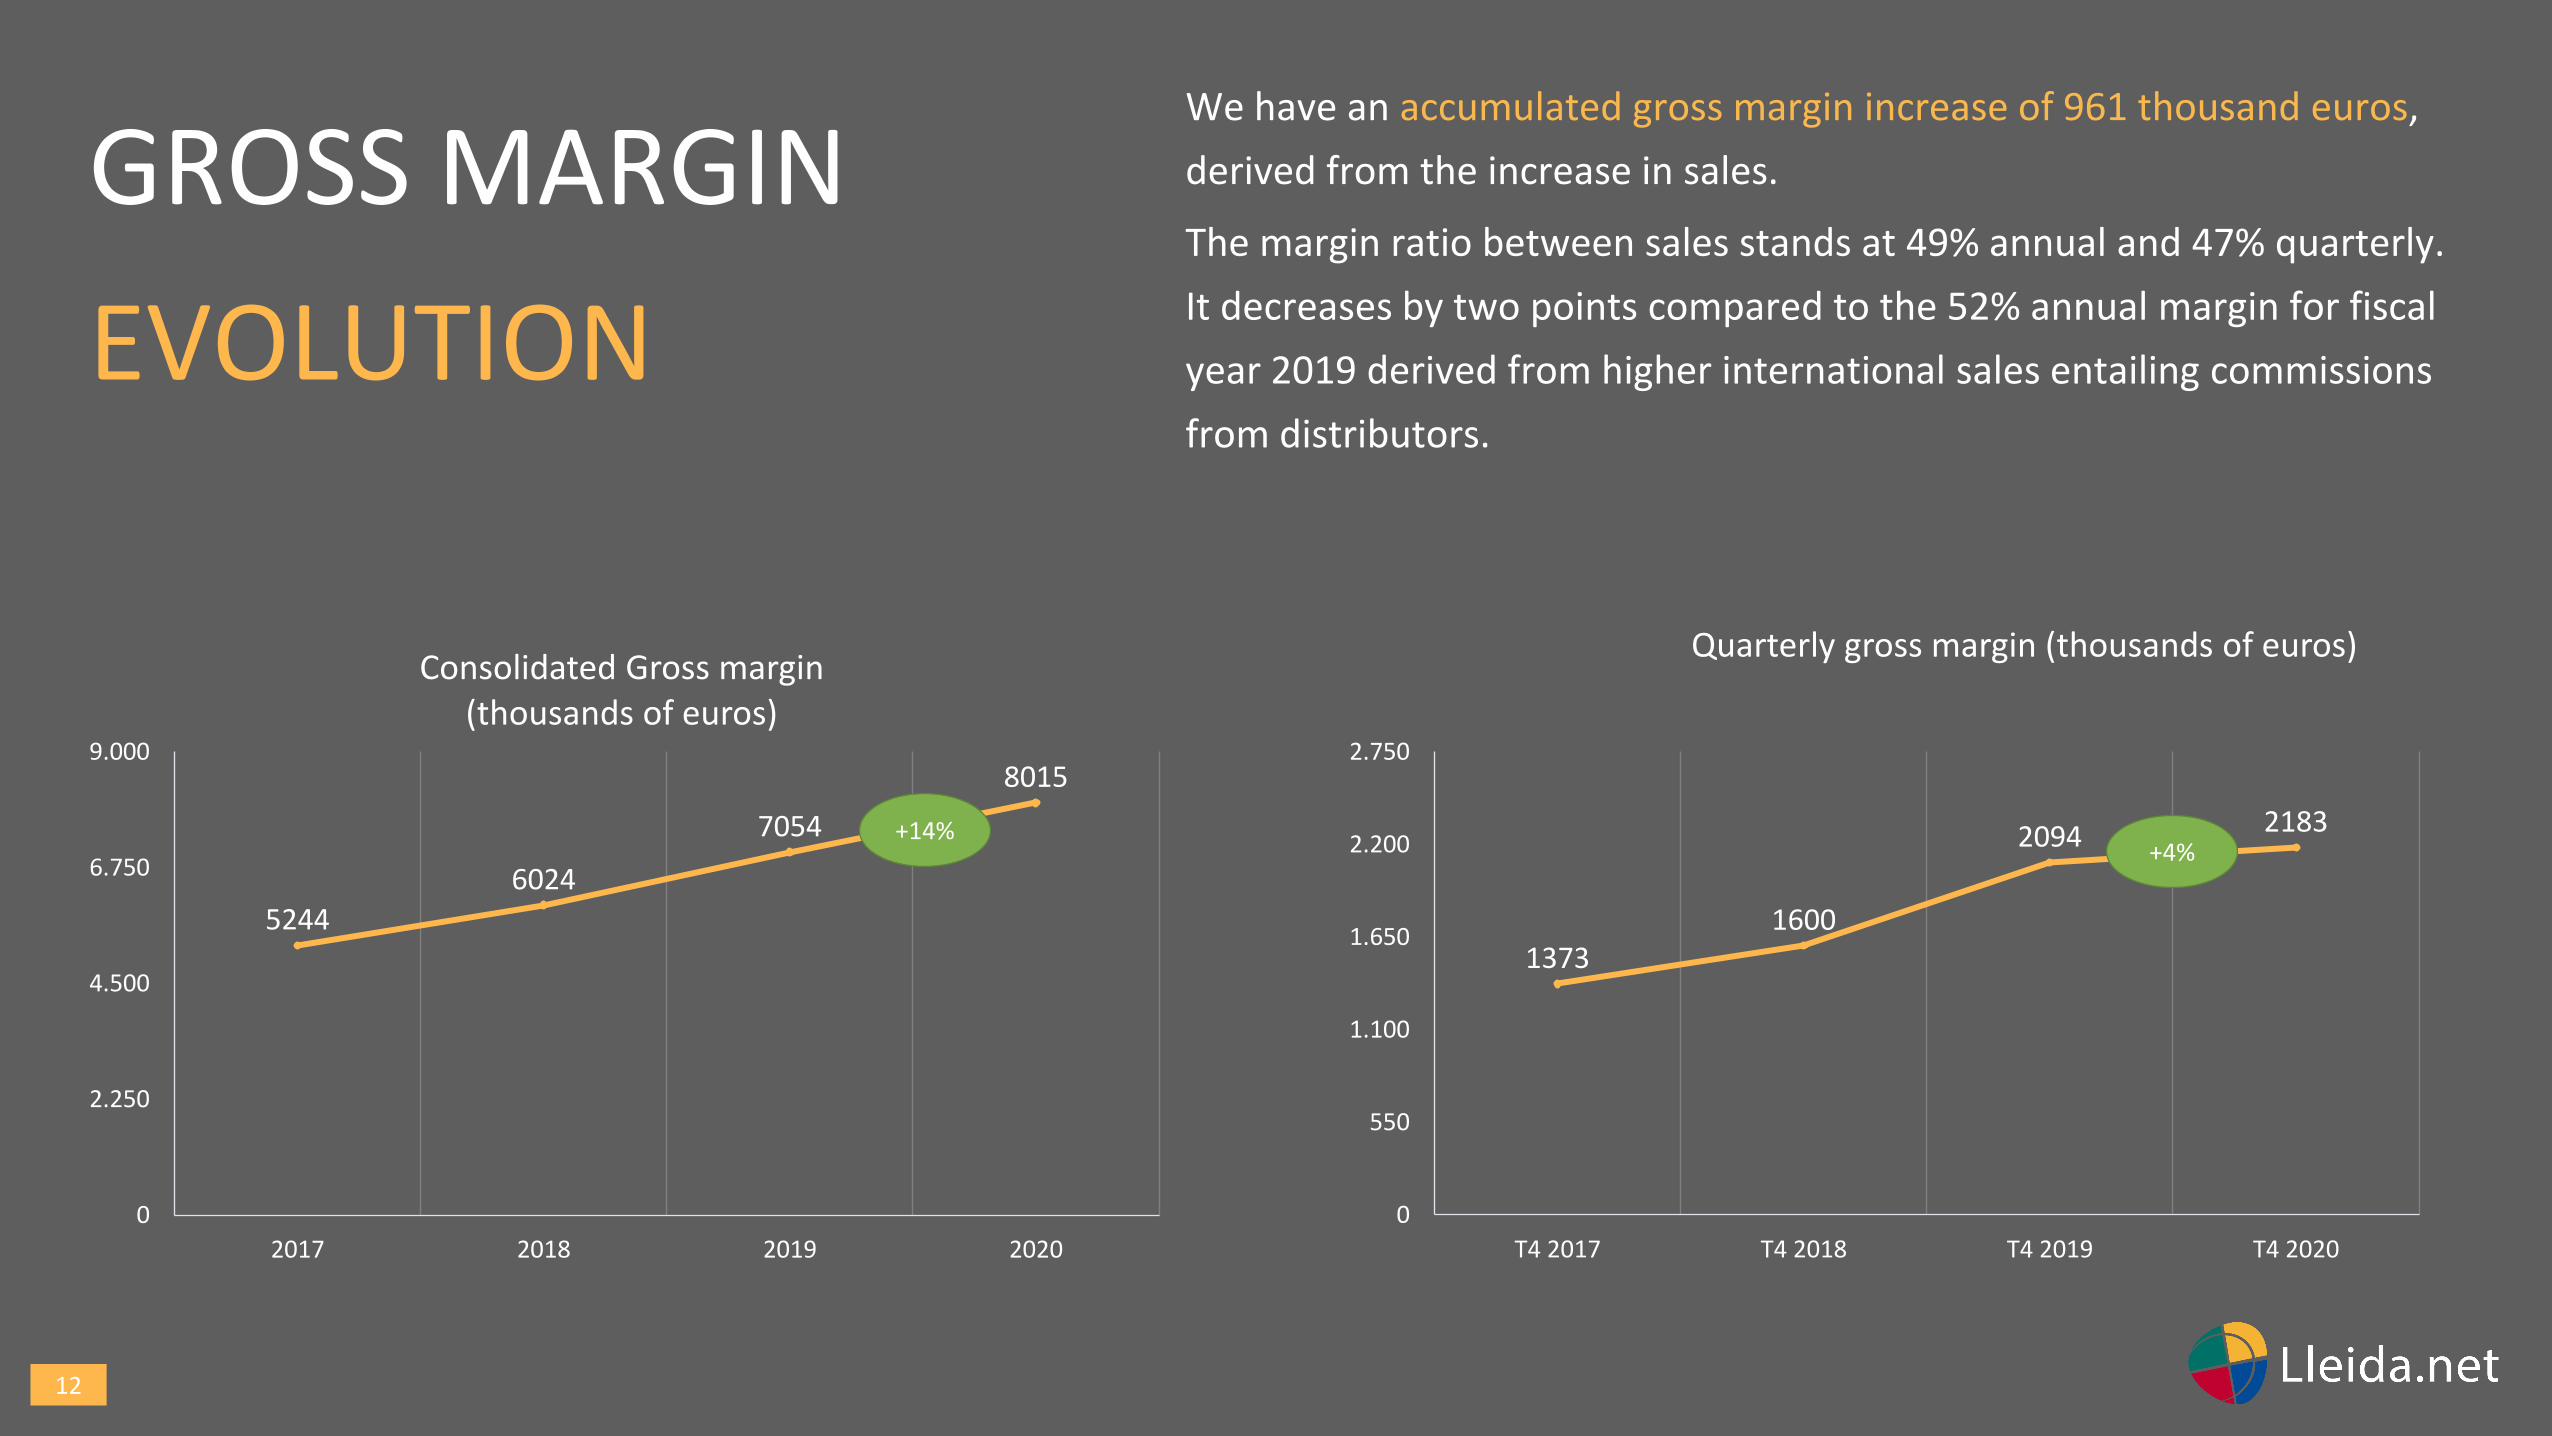
We have an accumulated gross margin increase of 961 thousand euros,
derived from the increase in sales.
The margin ratio between sales stands at 49% annual and 47% quarterly.
It decreases by two points compared to the 52% annual margin for fiscal
year 2019 derived from higher international sales entailing commissions
from distributors.
5244
6024
7054
8015
0
2.250
4.500
6.750
9.000
2017 2018 2019 2020
Consolidated Gross margin(thousands of euros)
13731600
2094 2183
0
550
1.100
1.650
2.200
2.750
T4 2017 T4 2018 T4 2019 T4 2020
Quarterly gross margin (thousands of euros)
+4%+14%
13
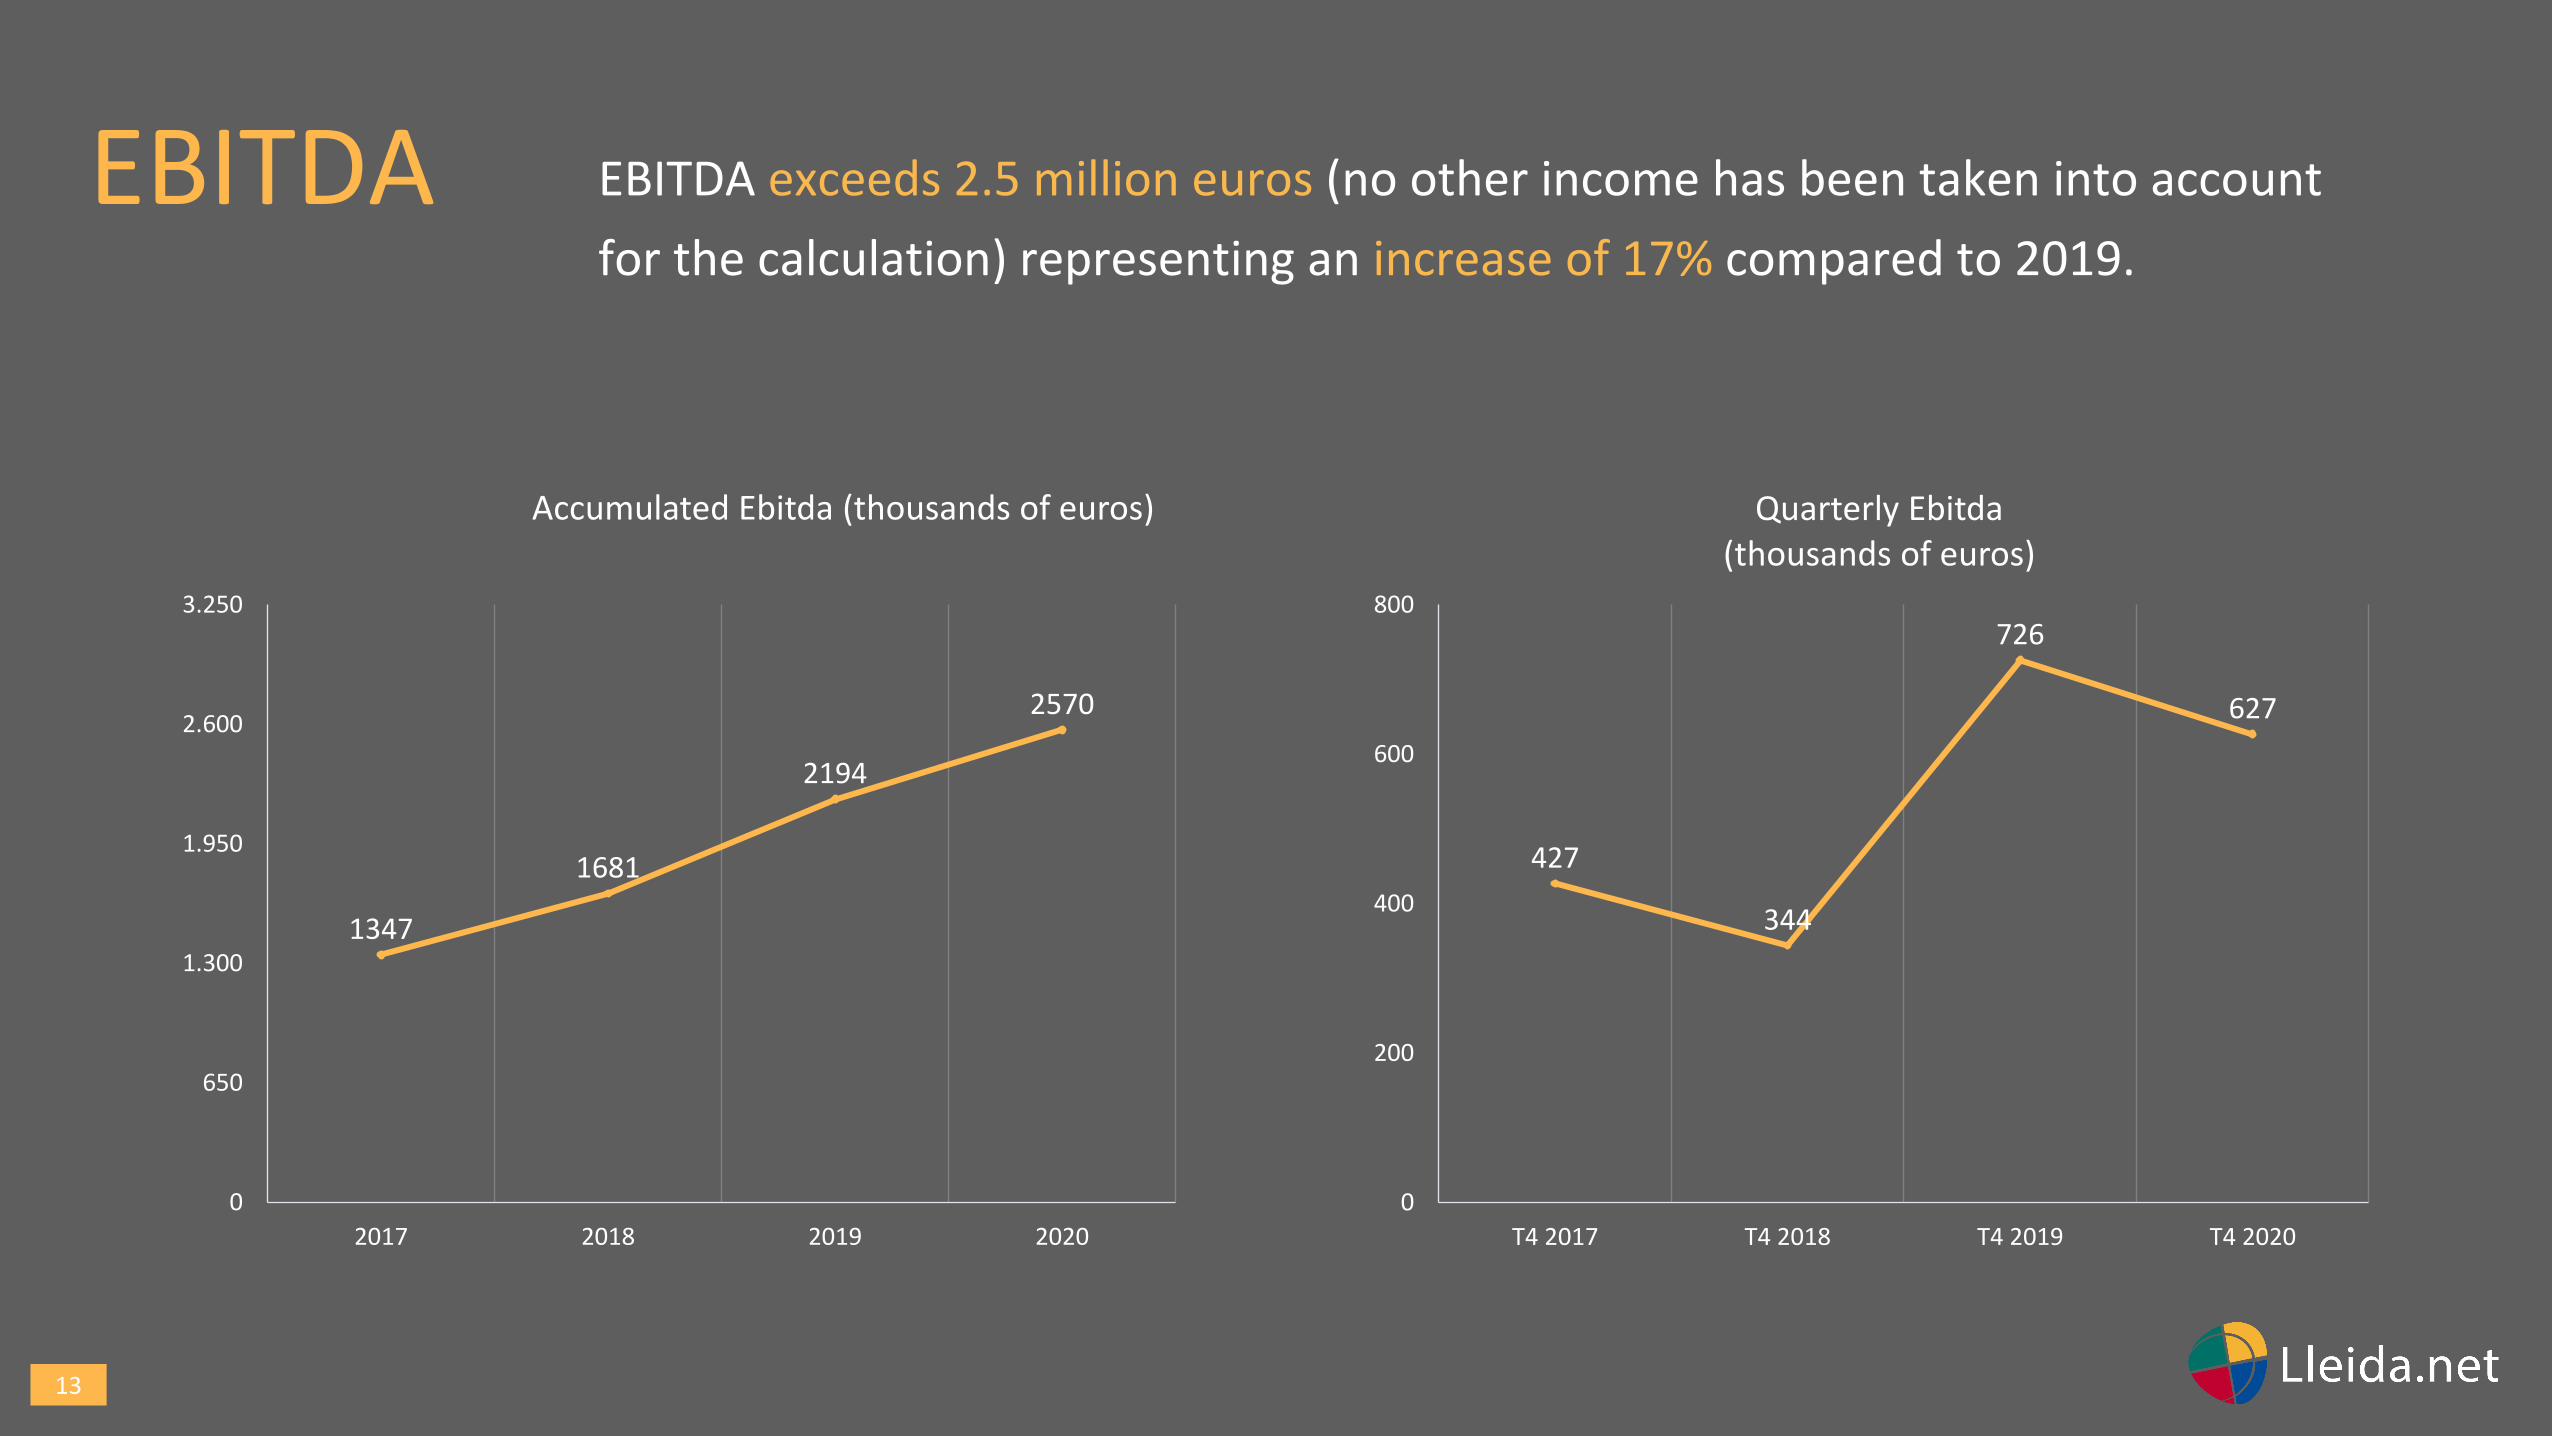
EBITDA exceeds 2.5 million euros (no other income has been taken into account
for the calculation) representing an increase of 17% compared to 2019.
EBITDA
1347
1681
2194
2570
0
650
1.300
1.950
2.600
3.250
2017 2018 2019 2020
Accumulated Ebitda (thousands of euros)
427
344
726
627
0
200
400
600
800
T4 2017 T4 2018 T4 2019 T4 2020
Quarterly Ebitda(thousands of euros)
14
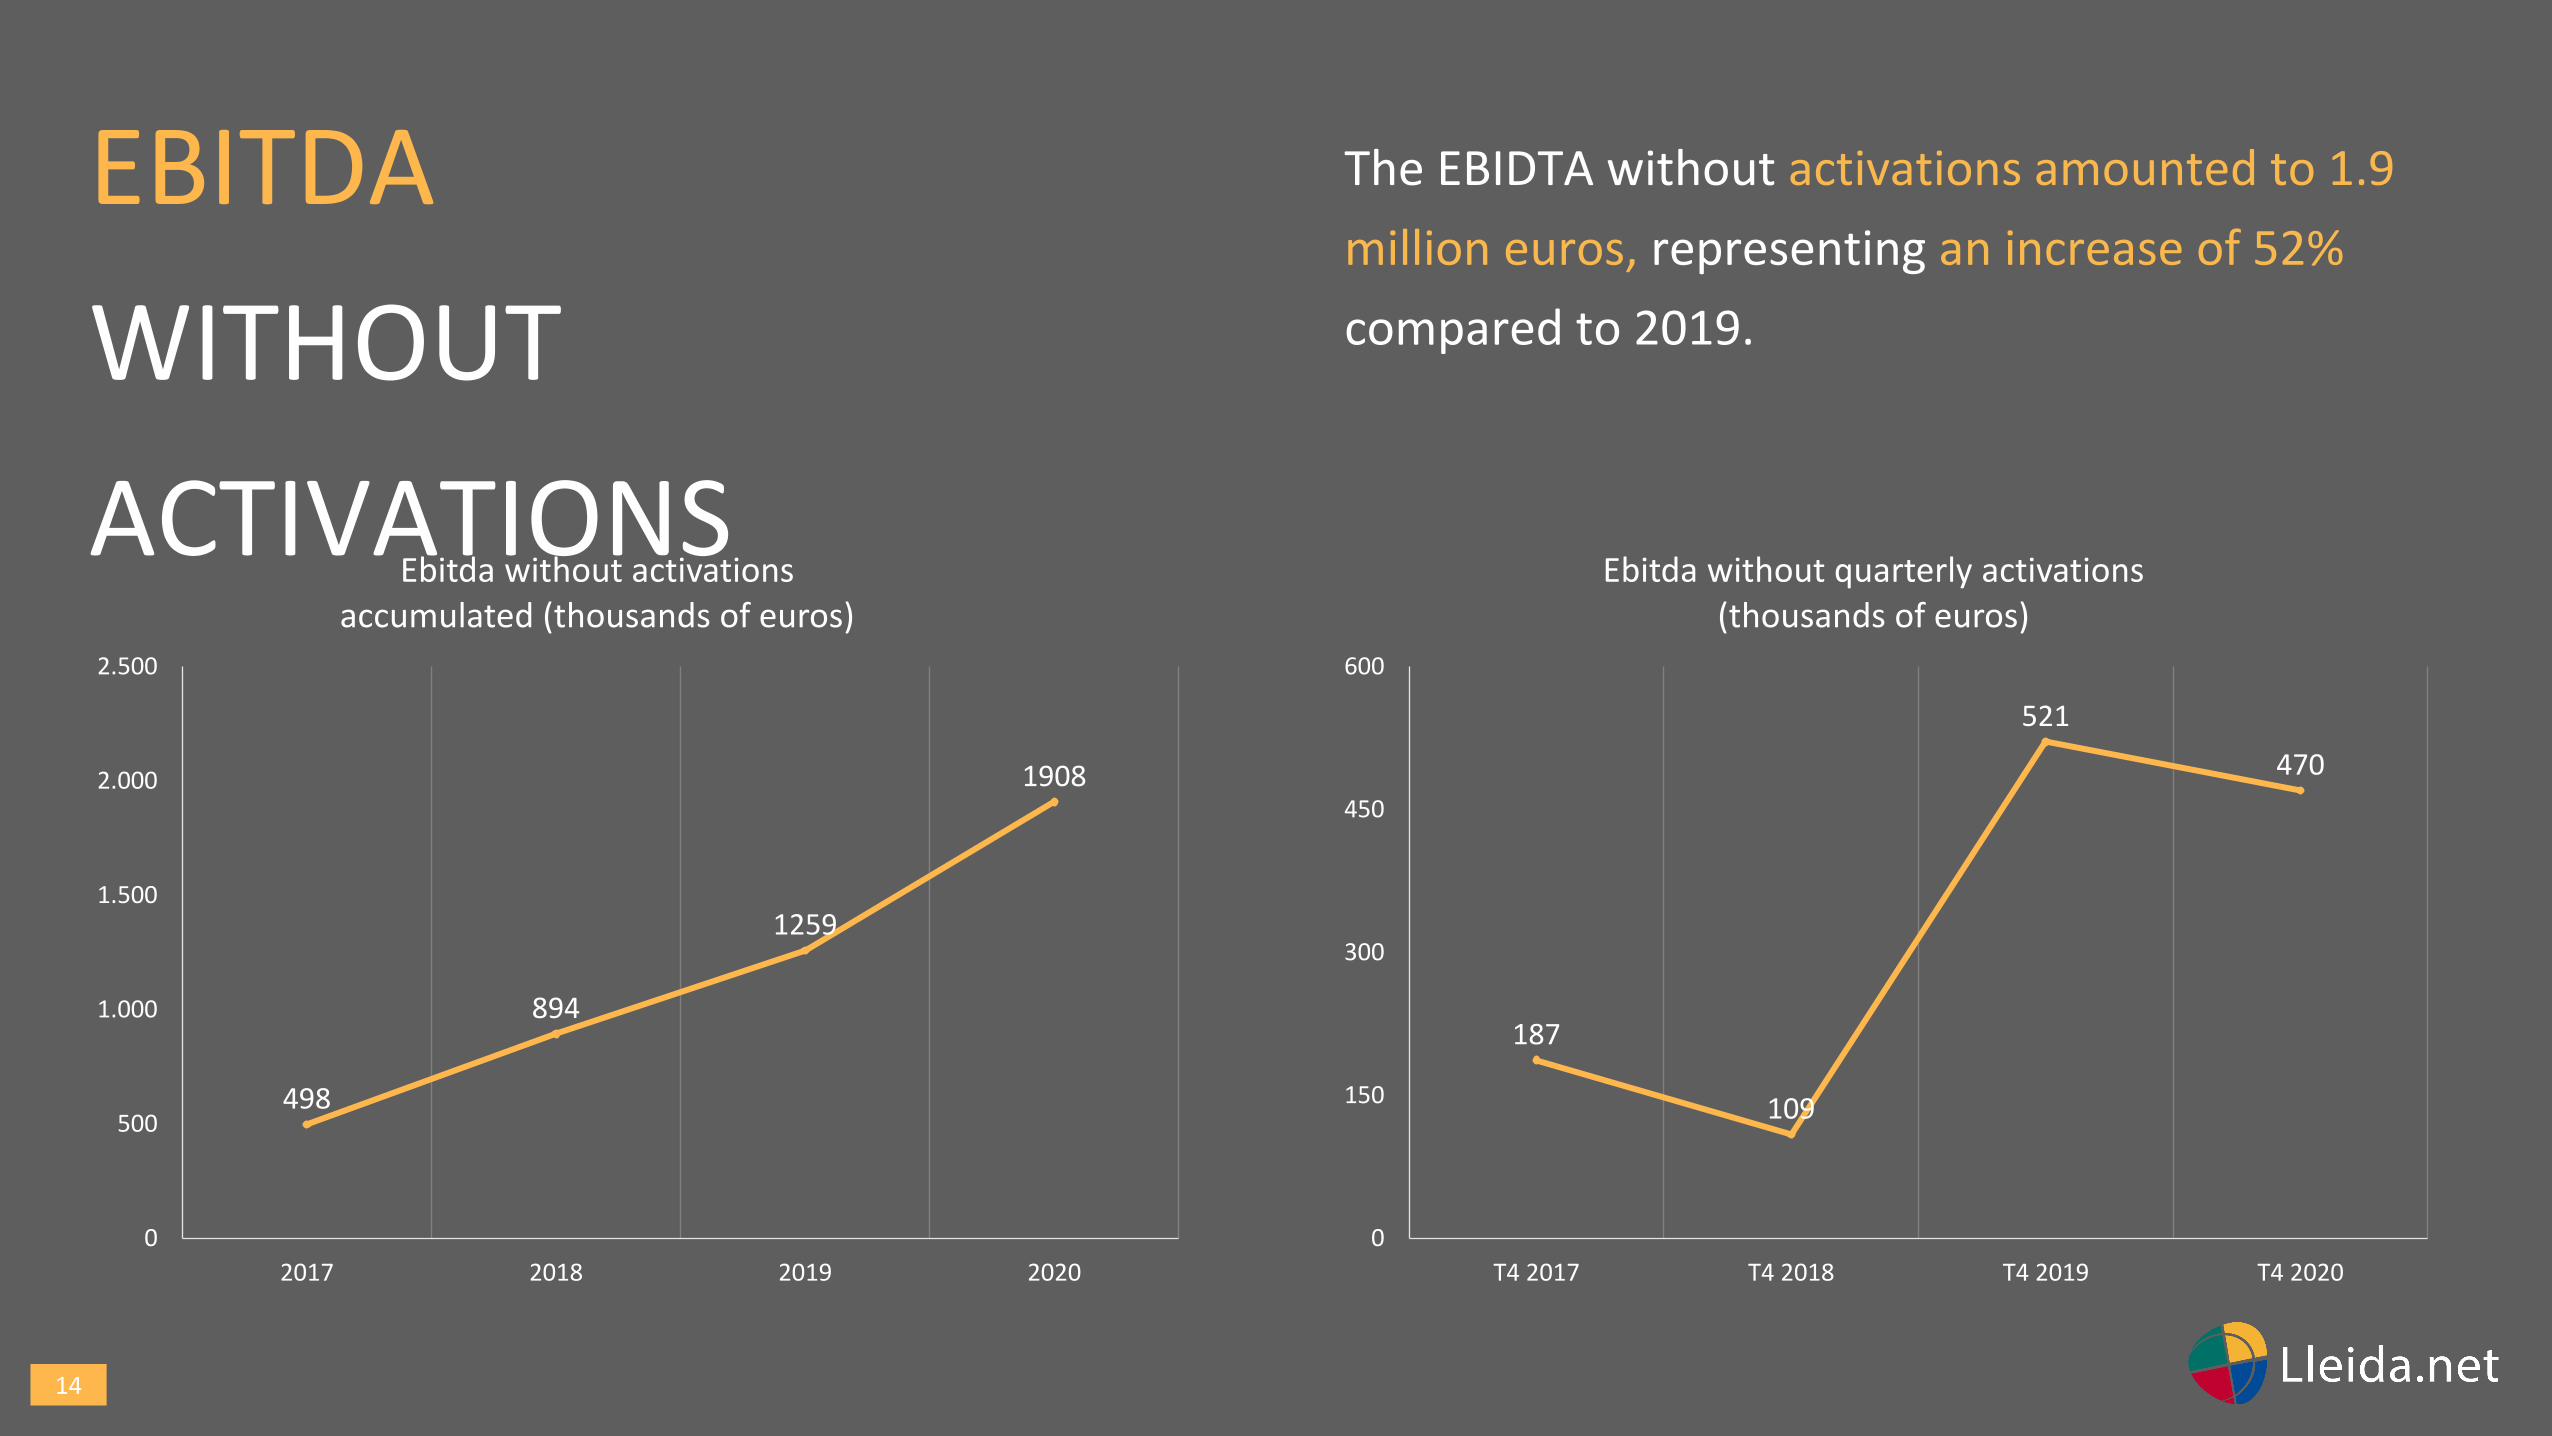
The EBIDTA without activations amounted to 1.9
million euros, representing an increase of 52%
compared to 2019.
EBITDA
WITHOUT
ACTIVATIONS
498
894
1259
1908
0
500
1.000
1.500
2.000
2.500
2017 2018 2019 2020
Ebitda without activationsaccumulated (thousands of euros)
187
109
521
470
0
150
300
450
600
T4 2017 T4 2018 T4 2019 T4 2020
Ebitda without quarterly activations(thousands of euros)
15
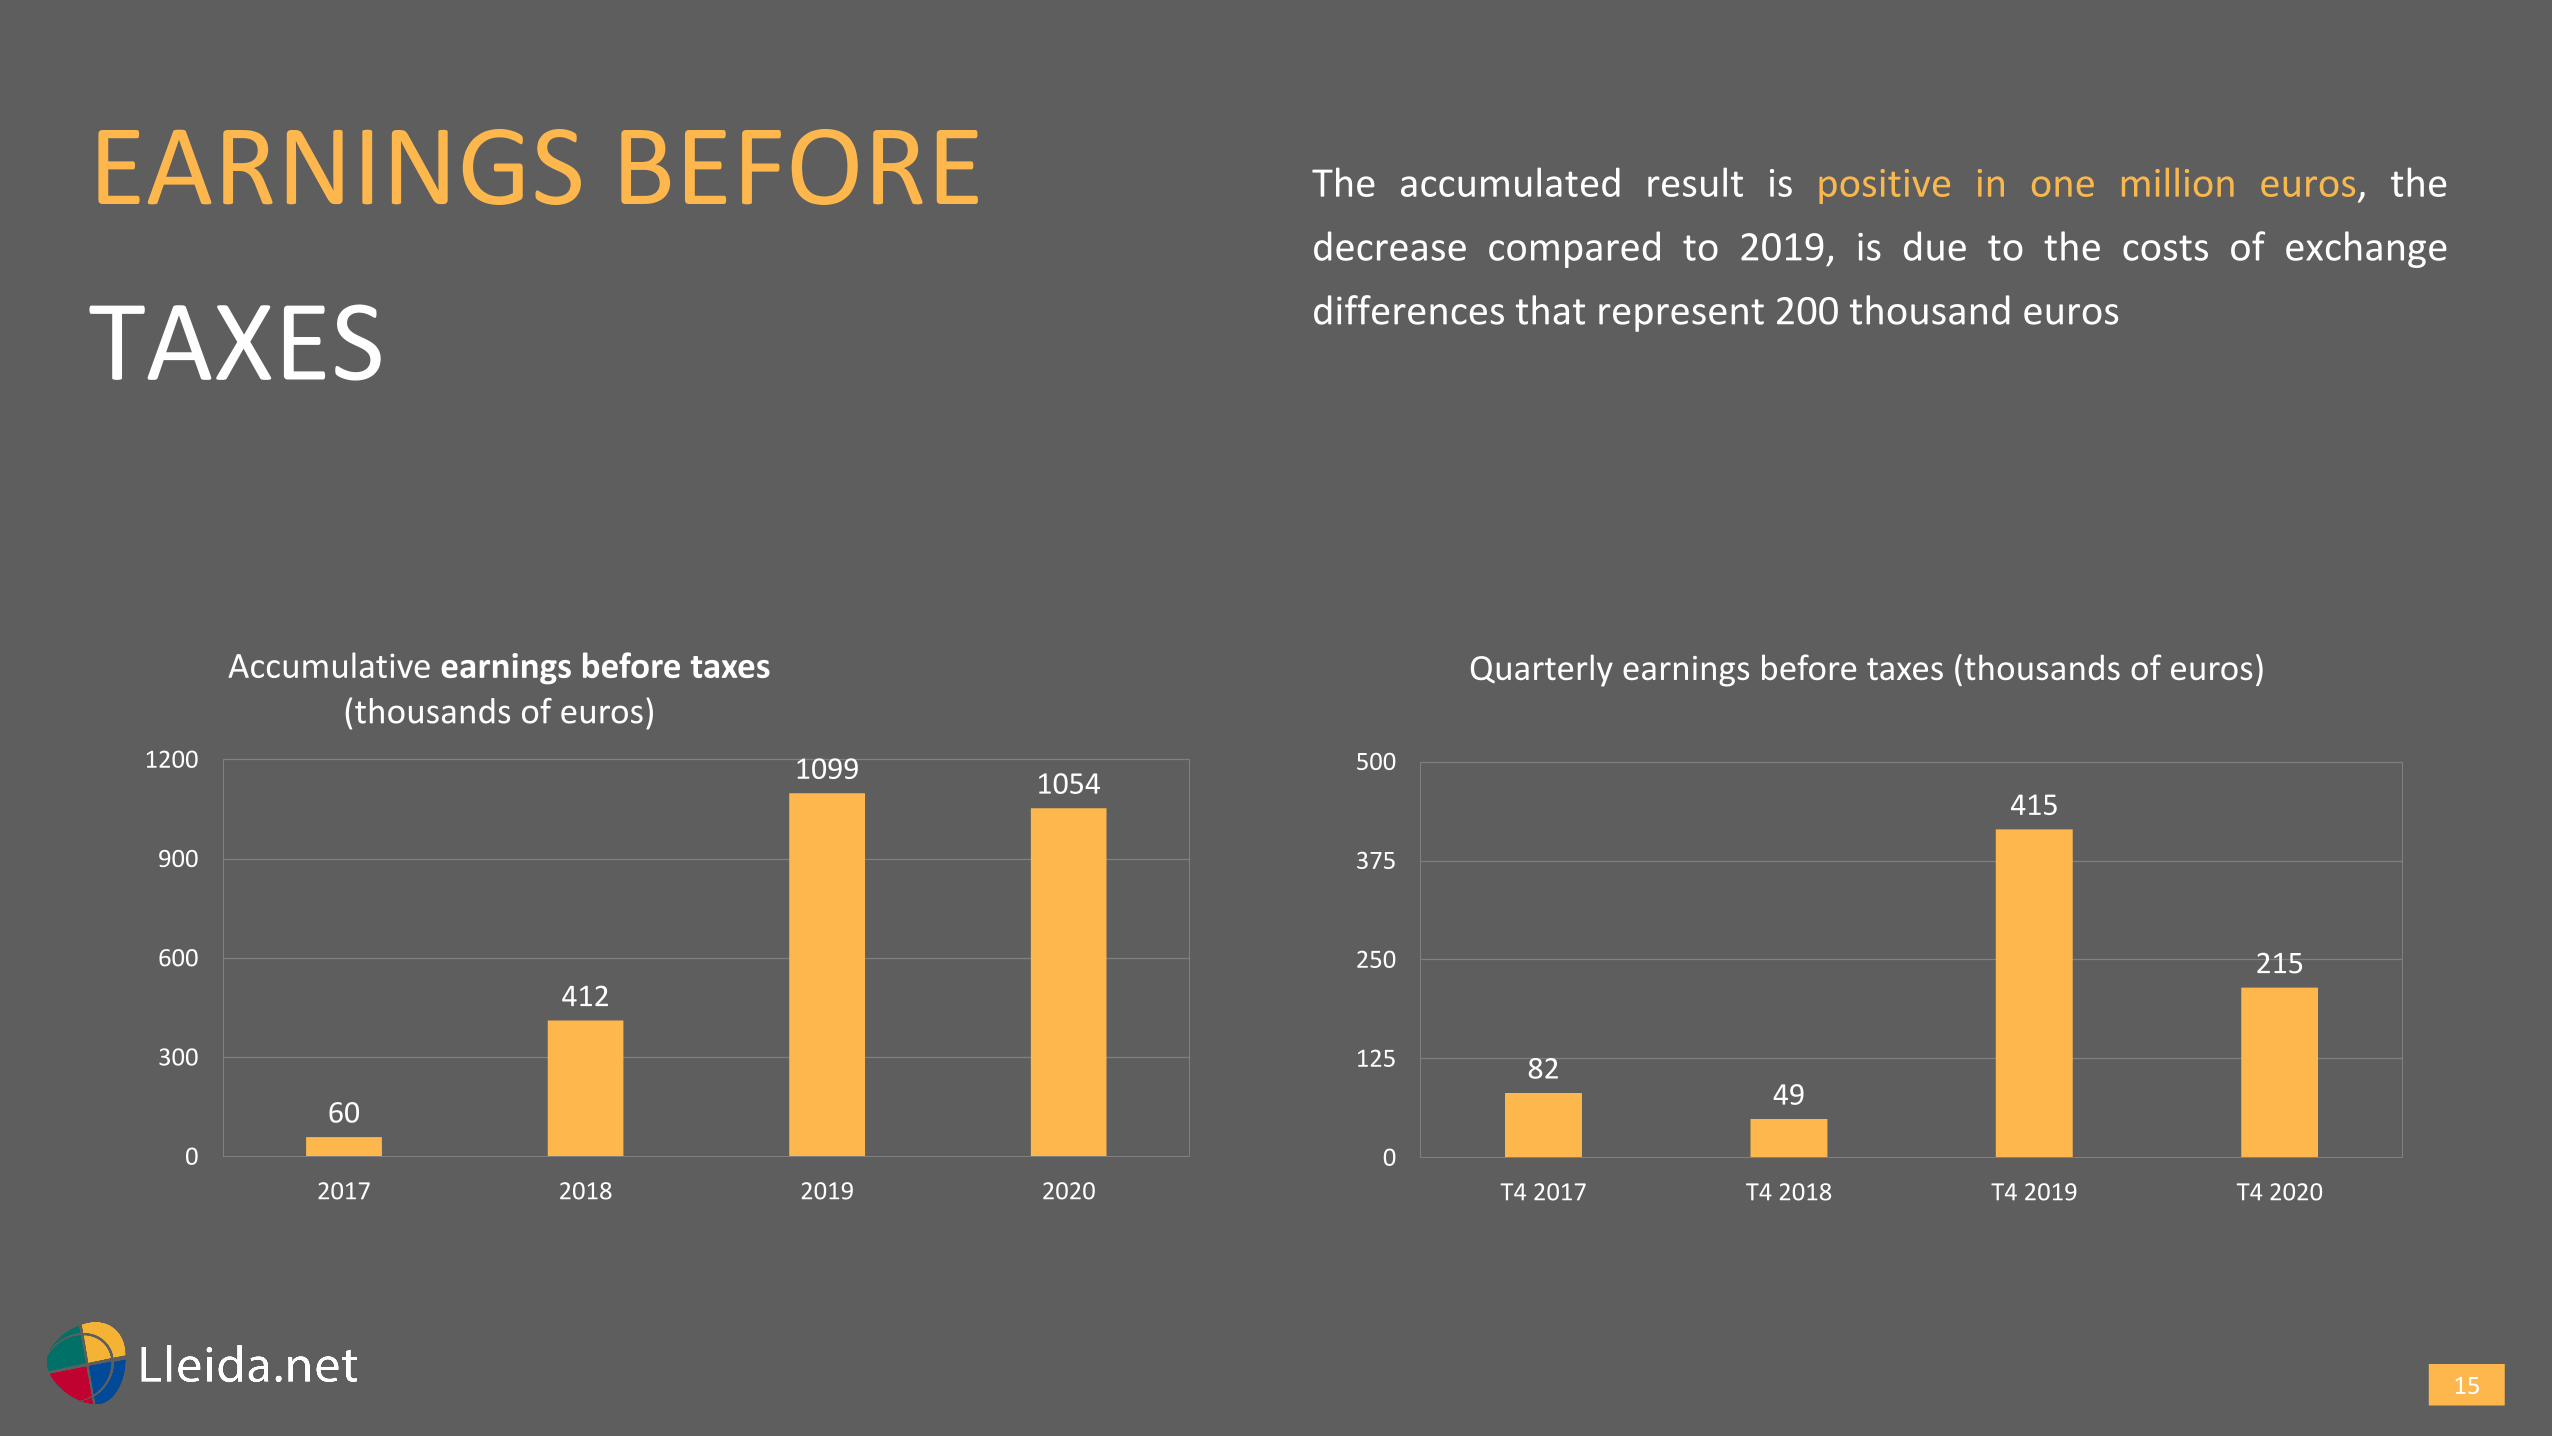
The accumulated result is positive in one million euros, the
decrease compared to 2019, is due to the costs of exchange
differences that represent 200 thousand euros
EARNINGS BEFORE
TAXES
60
412
1099 1054
0
300
600
900
1200
2017 2018 2019 2020
Accumulative earnings before taxes(thousands of euros)
8249
415
215
0
125
250
375
500
T4 2017 T4 2018 T4 2019 T4 2020
Quarterly earnings before taxes (thousands of euros)
16
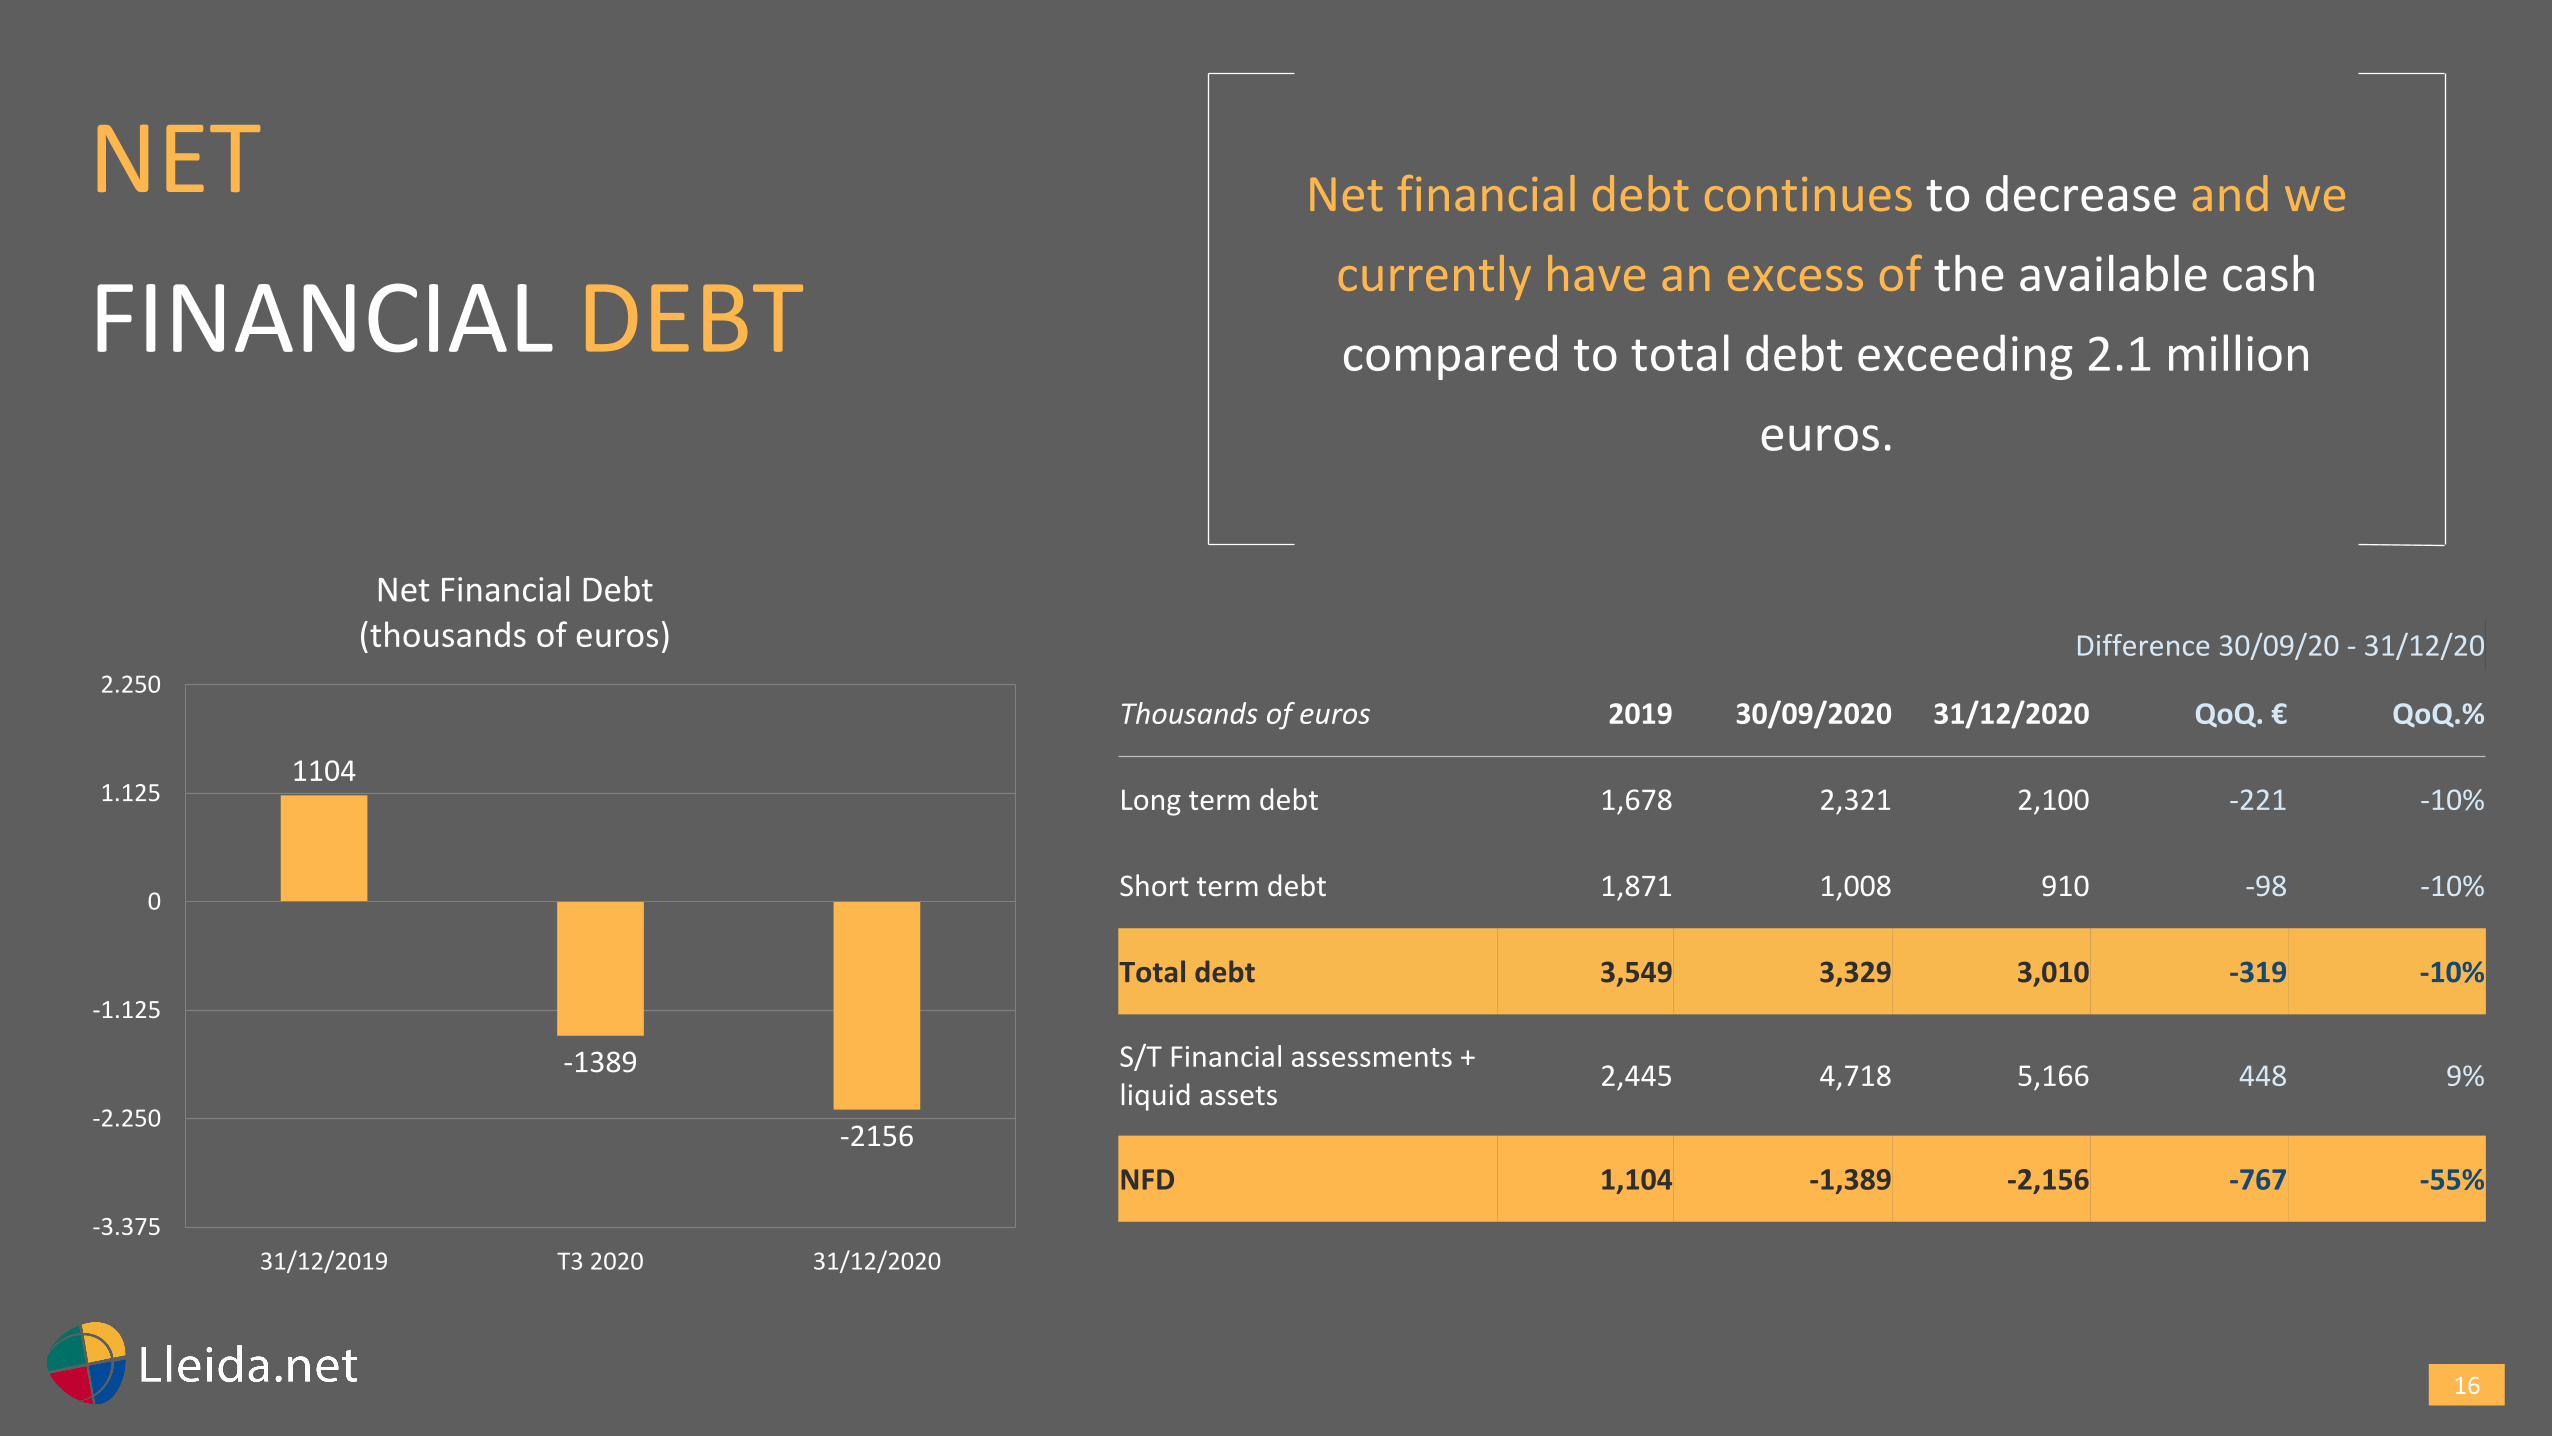
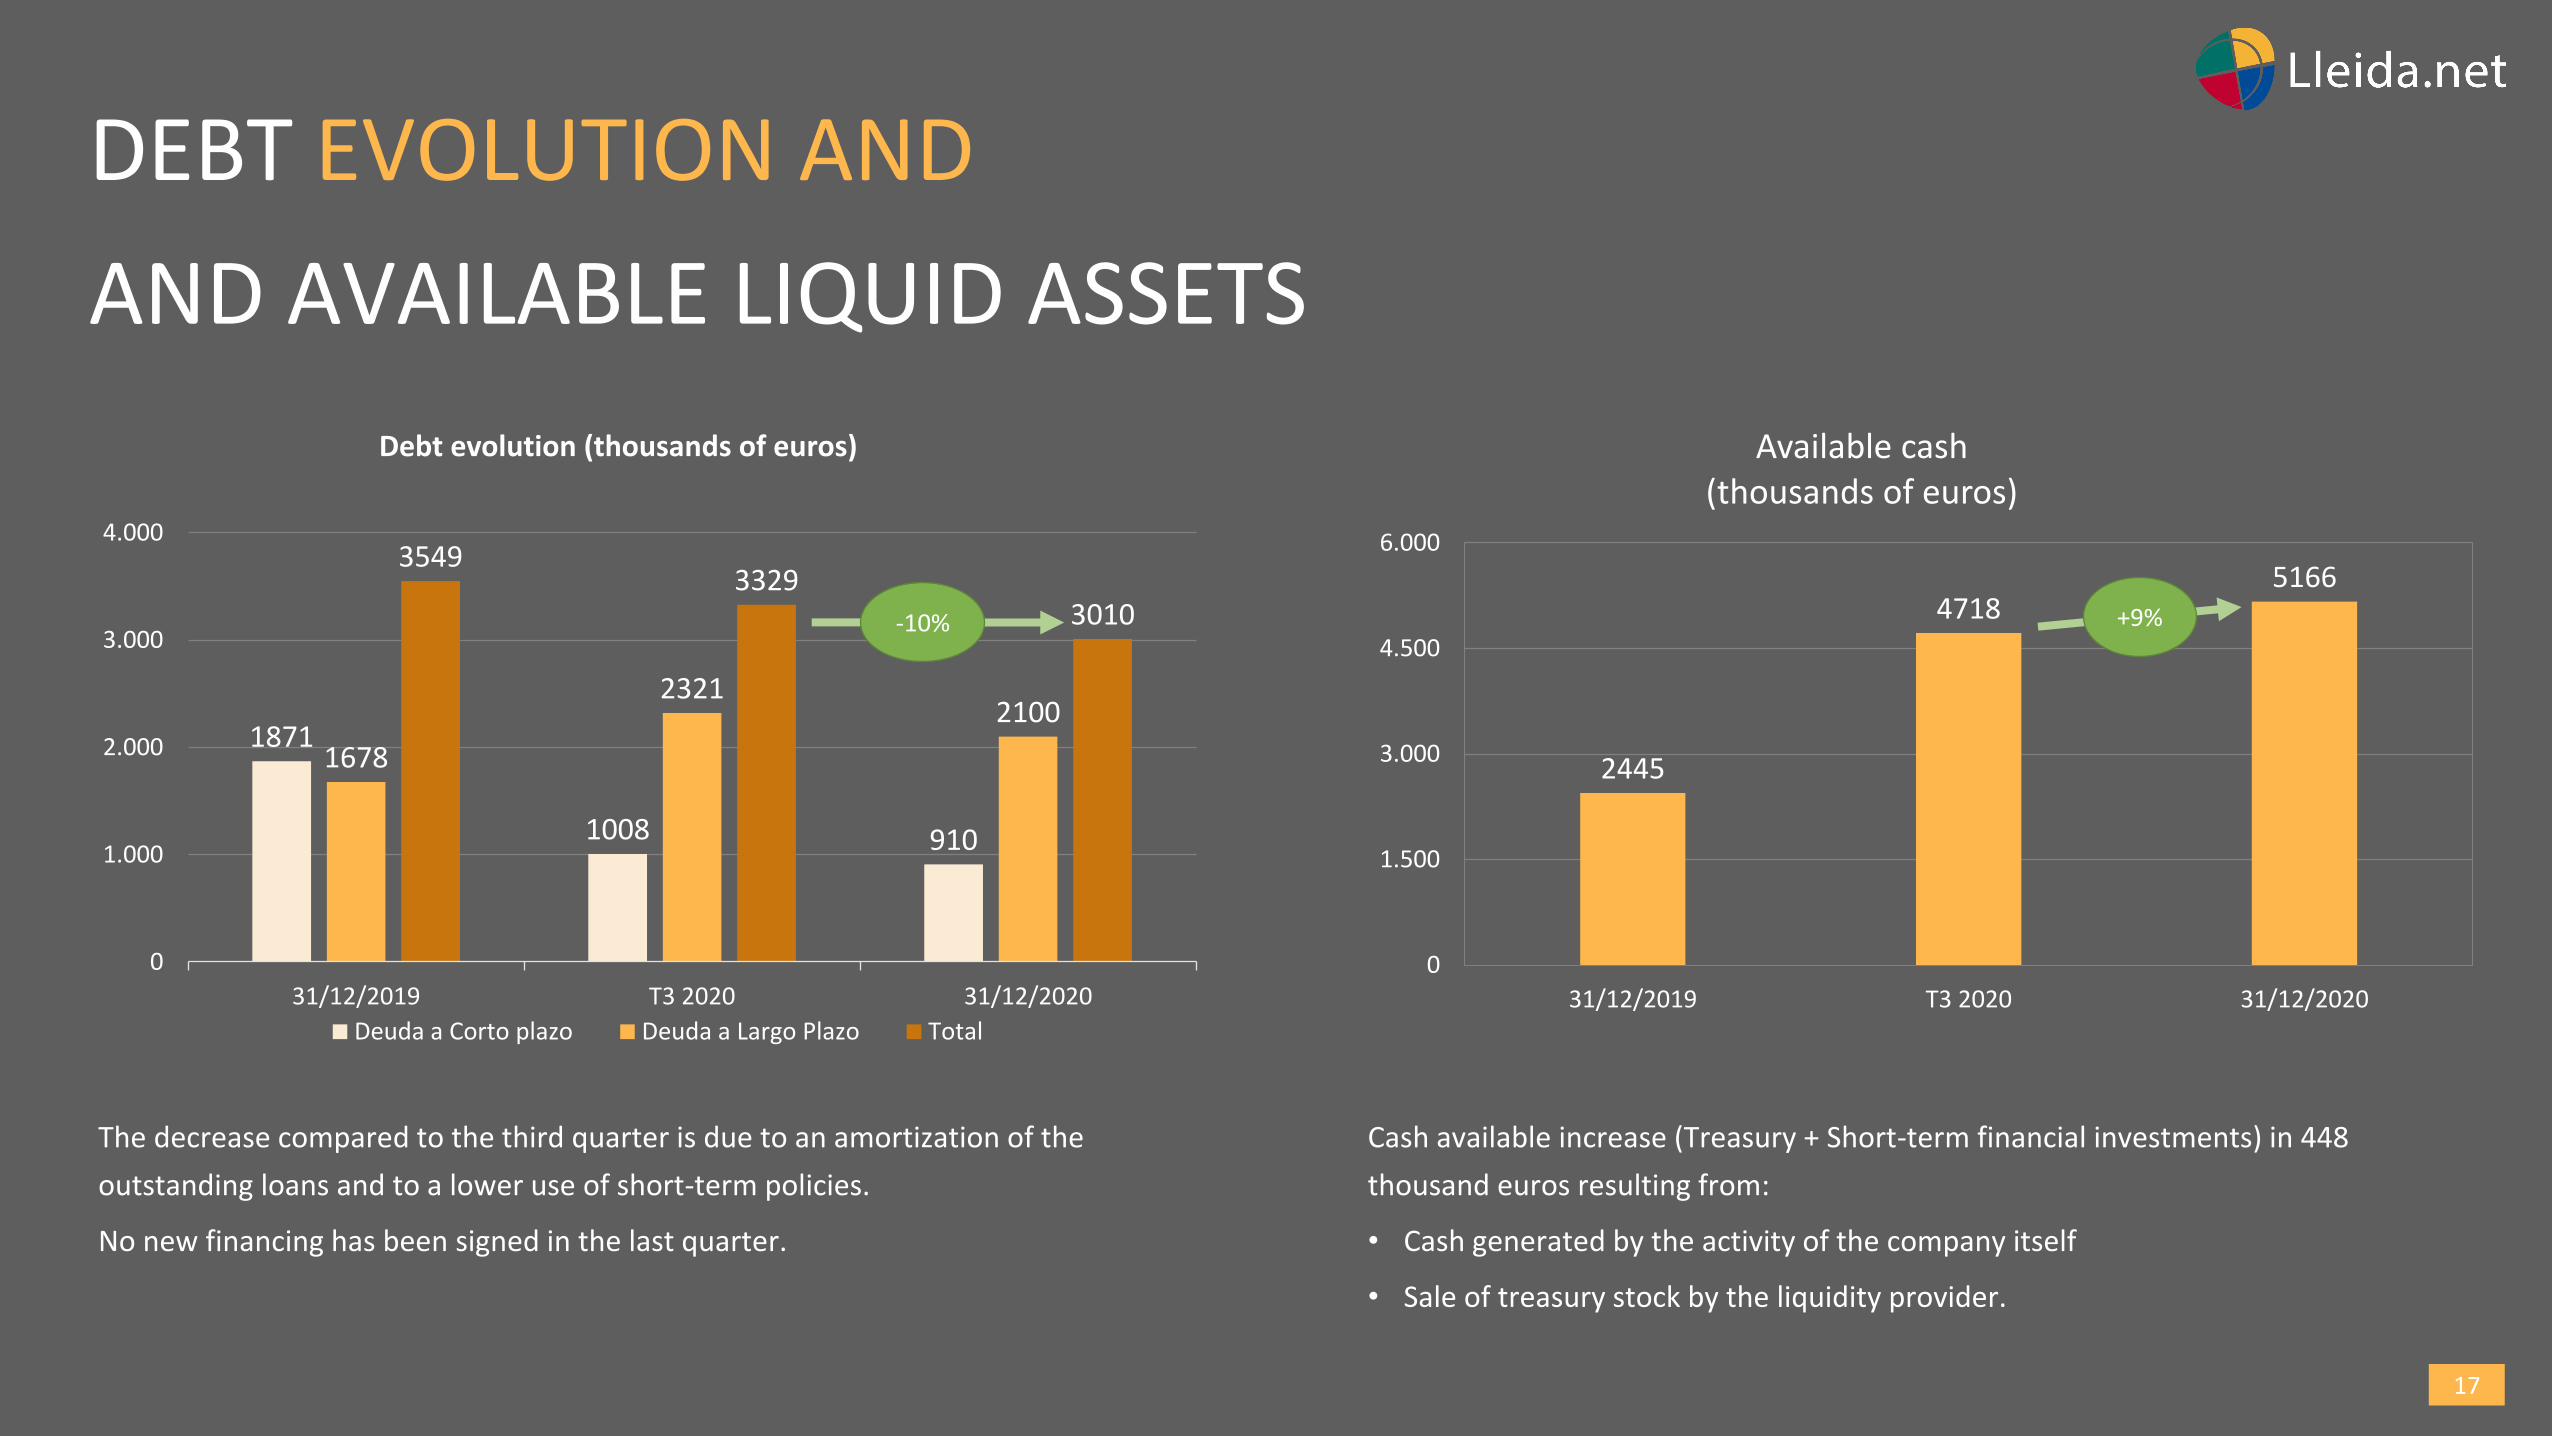
Net financial debt continues to decrease and we
currently have an excess of the available cash
compared to total debt exceeding 2.1 million
euros.
NET
FINANCIAL DEBT
Difference 30/09/20 - 31/12/20
Thousands of euros 2019 30/09/2020 31/12/2020 QoQ. € QoQ.%
Long term debt 1,678 2,321 2,100 -221 -10%
Short term debt 1,871 1,008 910 -98 -10%
Total debt 3,549 3,329 3,010 -319 -10%
S/T Financial assessments + liquid assets
2,445 4,718 5,166 448 9%
NFD 1,104 -1,389 -2,156 -767 -55%
1104
-1389
-2156
-3.375
-2.250
-1.125
0
1.125
2.250
31/12/2019 T3 2020 31/12/2020
Net Financial Debt(thousands of euros)
17
2445
47185166
0
1.500
3.000
4.500
6.000
31/12/2019 T3 2020 31/12/2020
Available cash(thousands of euros)
1871
1008 910
1678
23212100
35493329
3010
0
1.000
2.000
3.000
4.000
31/12/2019 T3 2020 31/12/2020
Debt evolution (thousands of euros)
Deuda a Corto plazo Deuda a Largo Plazo Total
DEBT EVOLUTION AND
AND AVAILABLE LIQUID ASSETS
+9%
The decrease compared to the third quarter is due to an amortization of the
outstanding loans and to a lower use of short-term policies.
No new financing has been signed in the last quarter.
Cash available increase (Treasury + Short-term financial investments) in 448
thousand euros resulting from:
• Cash generated by the activity of the company itself
• Sale of treasury stock by the liquidity provider.
-10%
18
LLEIDA.NET IS A COMPANY WORKING ITS
FUNDAMENTALS AND THE THREE PILLARS OF ITS
STRATEGY:
InternationalisationInnovation Intellectual property
19
HOW WE HAVE EVOLVED
20
1.532 1.6201.772 1.786
2.355
2.842
0
750
1.500
2.250
3.000
2015 2016 2017 2018 2019 2020
No. of clients
0
550
1.100
1.650
2.200
2015 2016 2017 2018 2019 2020
Customers by billing value
Clientes hasta 500€ Clientes entre 500-5000€ Clientes de +5.000€
OUR SERVICES ARE POPULATIONAL
2015 2016 YOY (2016-2015) 2017 YOY (2017-2016) 2018 YOY (2018-2017) 2019 YOY (2019-2018) 2020 YOY (2020-2019)
Clients up to 500€
1.068 1.108 3,75% 1.204 8,66% 1.211 0.58% 1.728 42,69% 2.080 20,37%
Clients between € 500-5000
297 313 5,39% 335 7,03% 324 -3,28% 361 11,42% 431 19,39%
Customers + 5,000 €
167 199 19,16% 233 17,09% 251 7,73% 266 5,98% 331 24,44%
No. of clients 1.532 1.620 5,74% 1.772 9,38% 1.786 0,79% 2.355 31,86% 2.842 20,68%
21
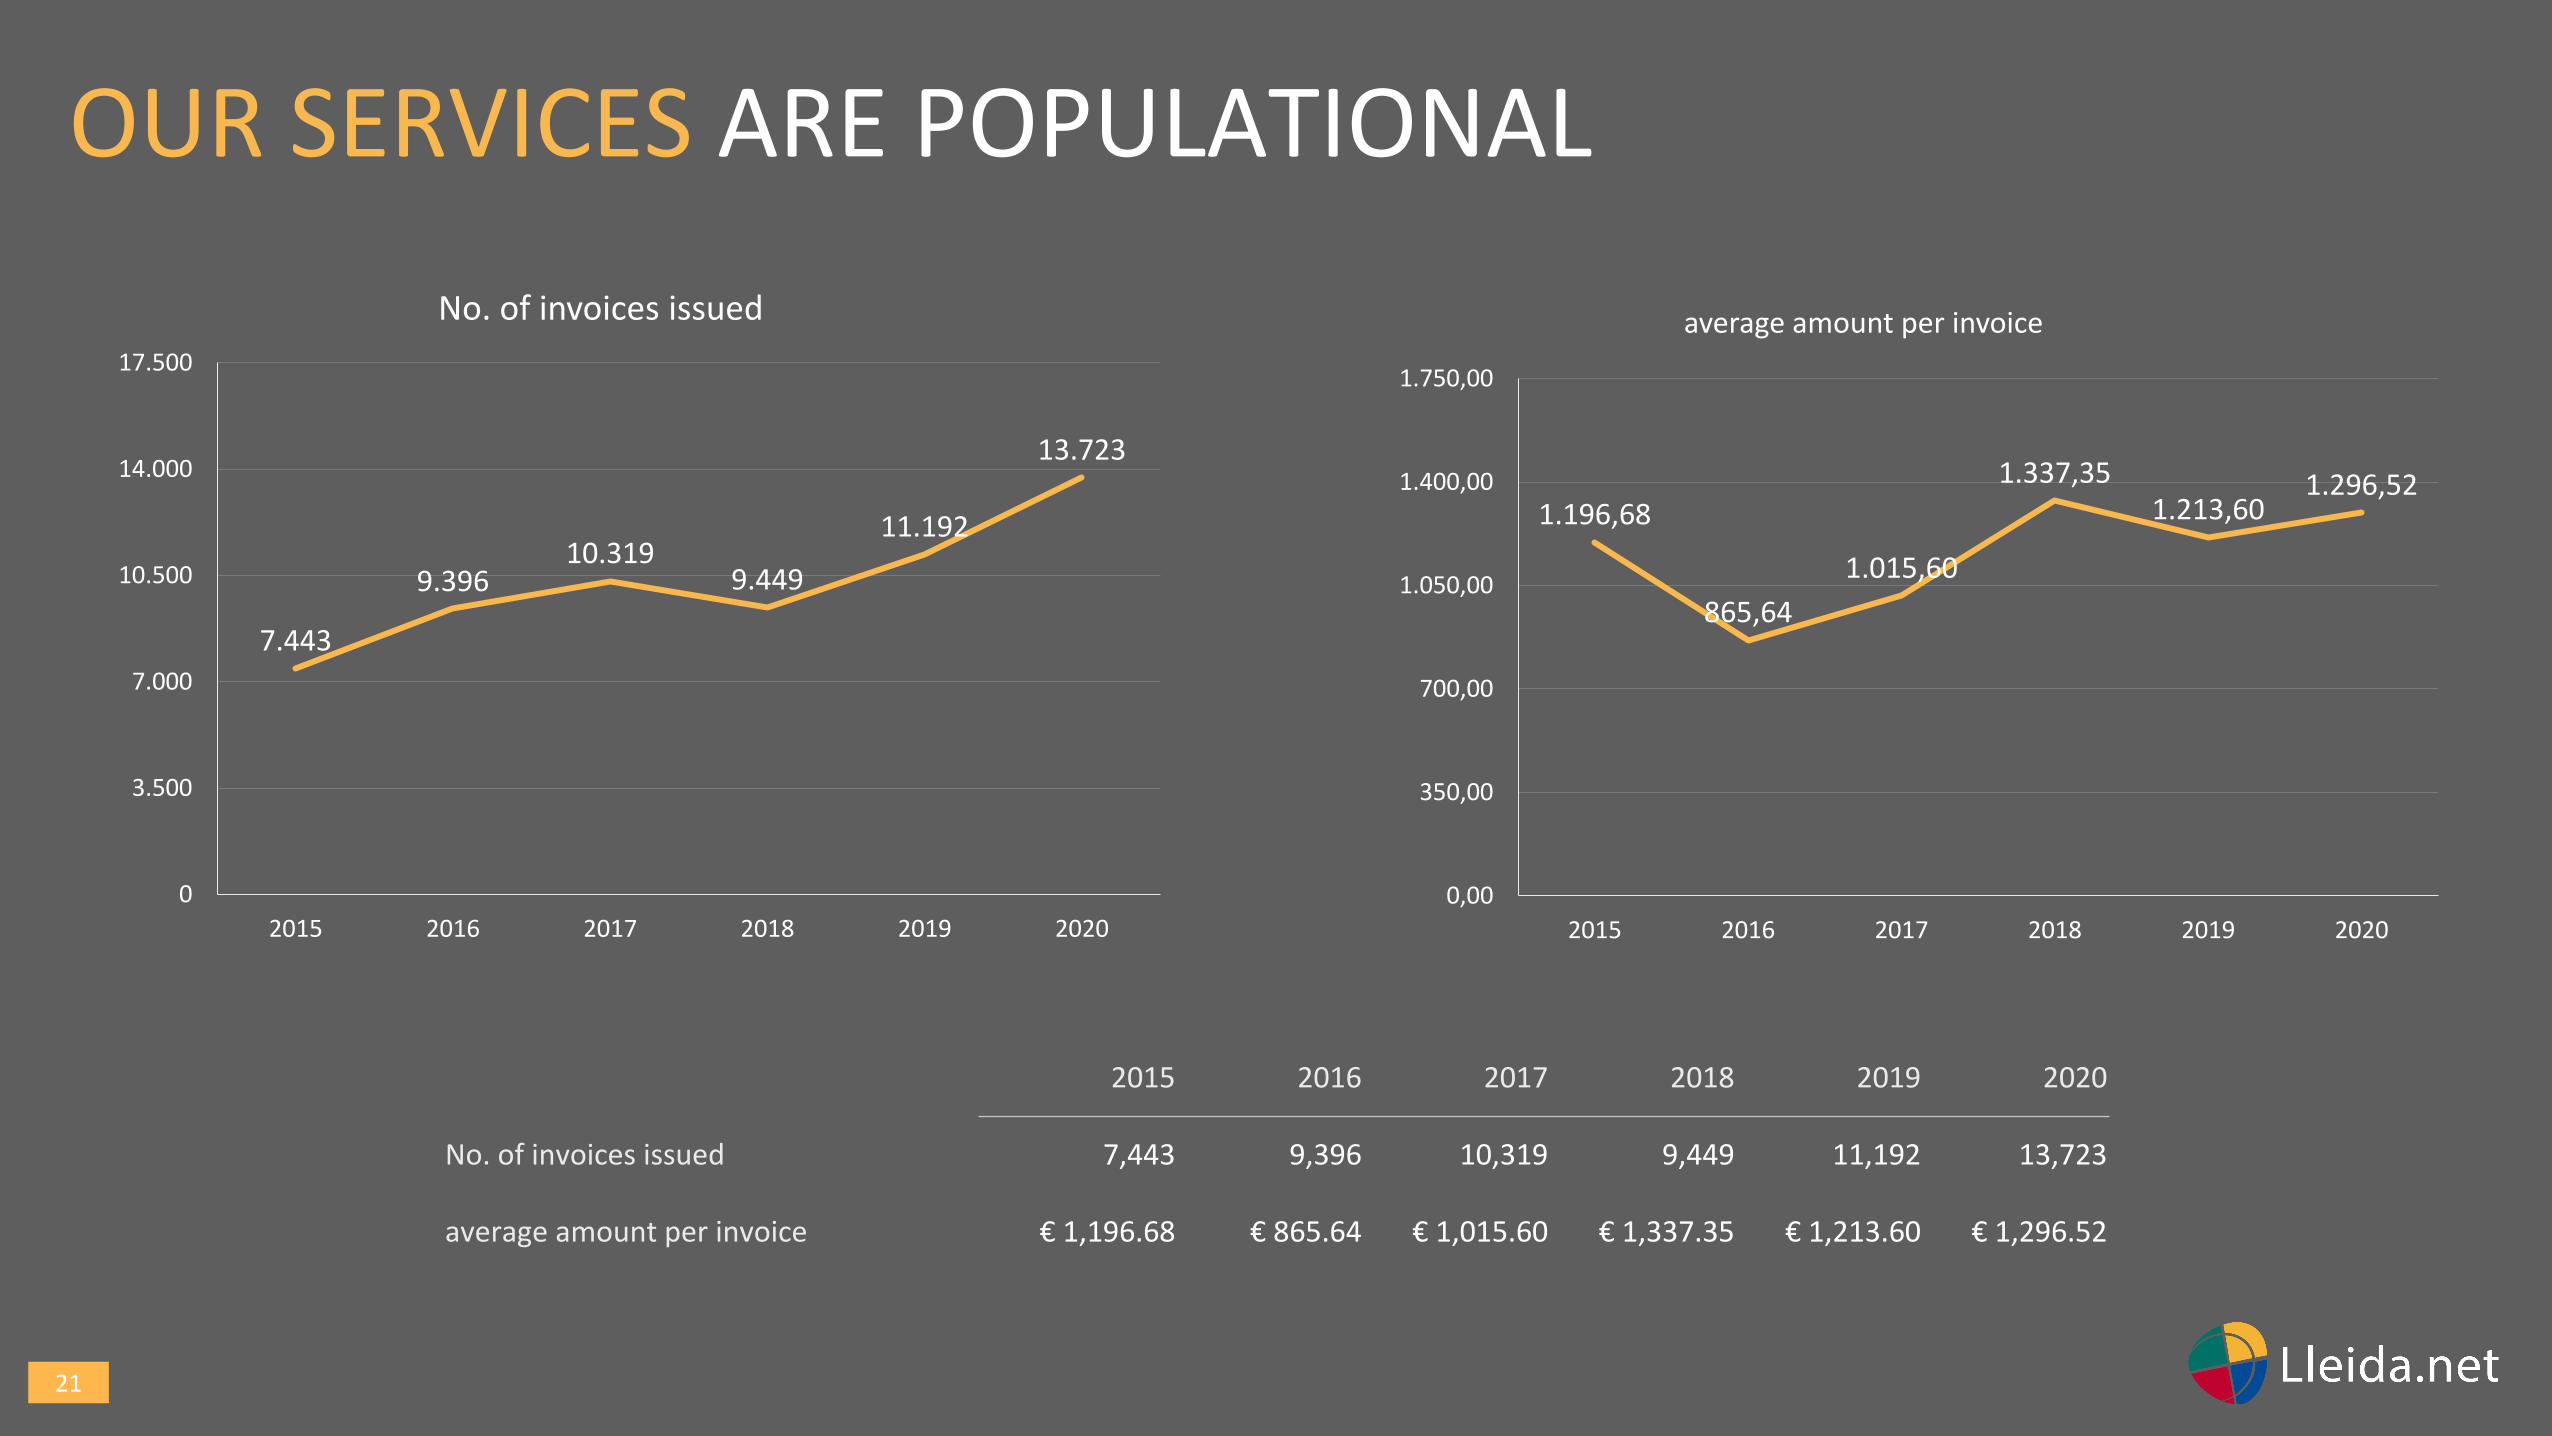
7.443
9.39610.319
9.449
11.192
13.723
0
3.500
7.000
10.500
14.000
17.500
2015 2016 2017 2018 2019 2020
No. of invoices issued
1.196,68
865,64
1.015,60
1.337,351.213,60
1.296,52
0,00
350,00
700,00
1.050,00
1.400,00
1.750,00
2015 2016 2017 2018 2019 2020
average amount per invoice
2015 2016 2017 2018 2019 2020
No. of invoices issued 7,443 9,396 10,319 9,449 11,192 13,723
average amount per invoice € 1,196.68 € 865.64 € 1,015.60 € 1,337.35 € 1,213.60 € 1,296.52
OUR SERVICES ARE POPULATIONAL

22
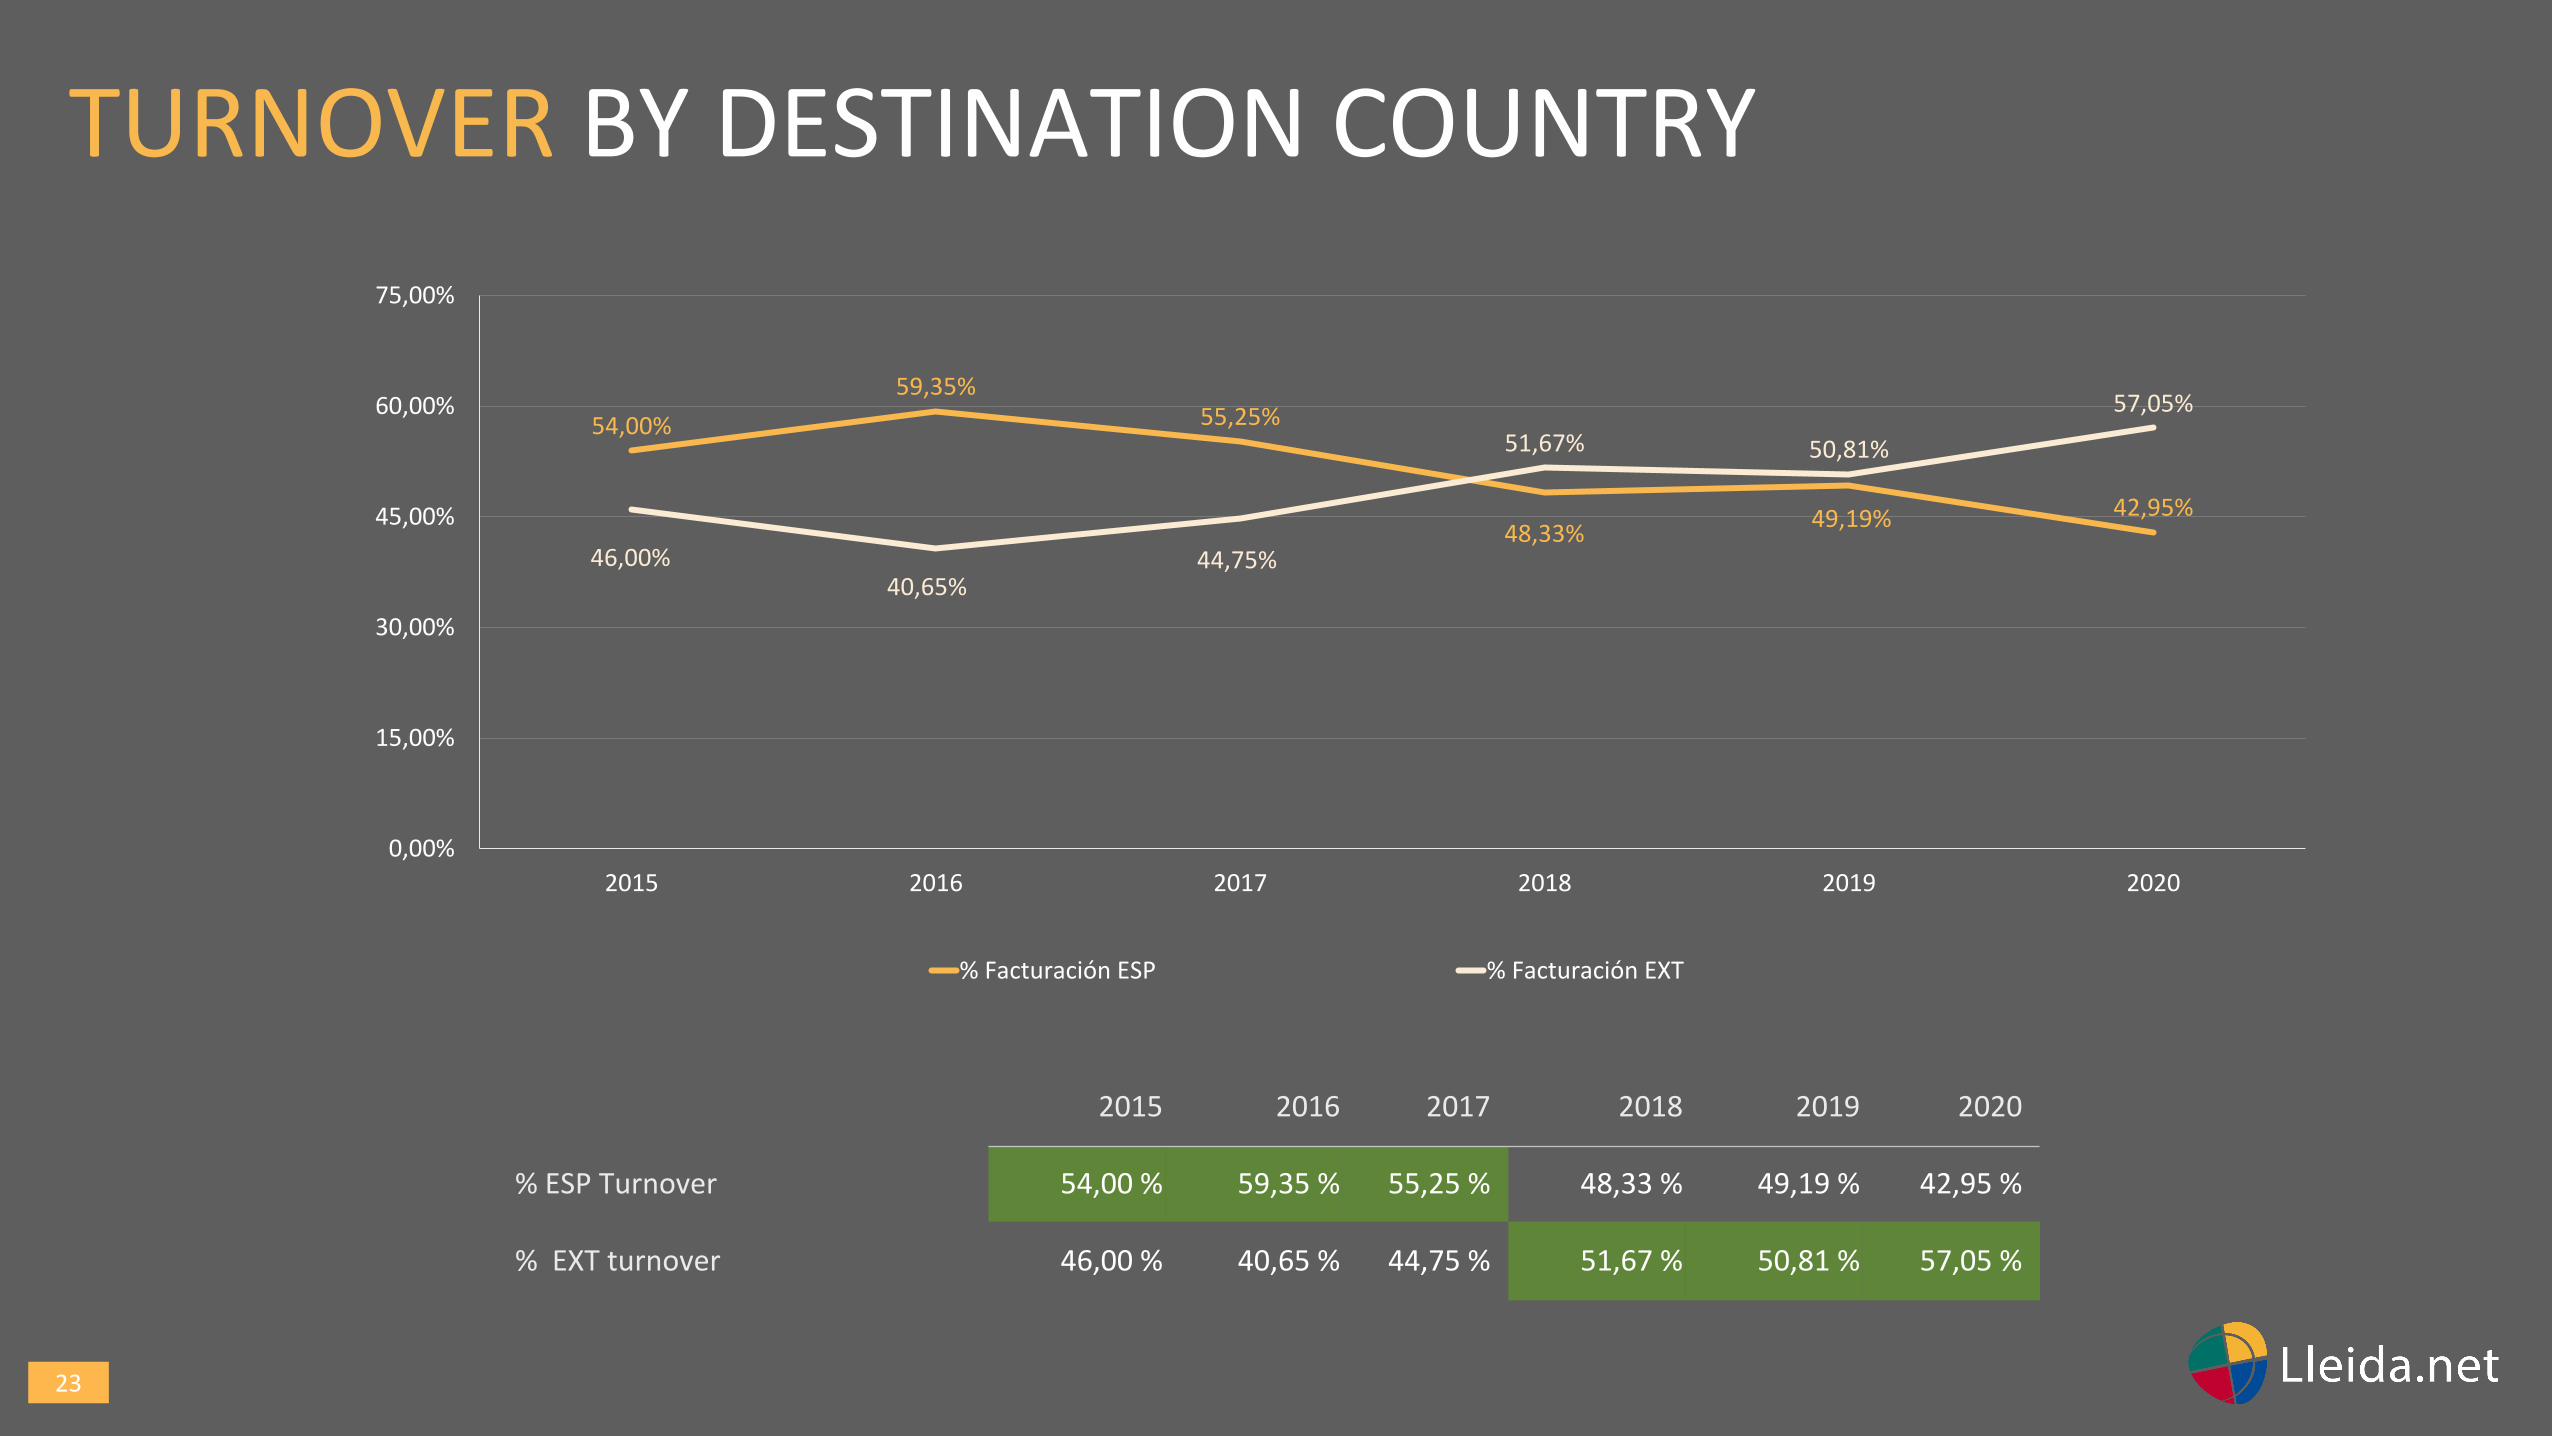
WITH AN INCREASINGLY INTERNATIONAL BUSINESS
23
54,00%
59,35%55,25%
48,33%49,19% 42,95%
46,00%40,65%
44,75%
51,67% 50,81%
57,05%
0,00%
15,00%
30,00%
45,00%
60,00%
75,00%
2015 2016 2017 2018 2019 2020
% Facturación ESP % Facturación EXT
2015 2016 2017 2018 2019 2020
% ESP Turnover 54,00 % 59,35 % 55,25 % 48,33 % 49,19 % 42,95 %
% EXT turnover 46,00 % 40,65 % 44,75 % 51,67 % 50,81 % 57,05 %
TURNOVER BY DESTINATION COUNTRY
24
IN 2020 OUR SERVICES SKYROCKETED
25
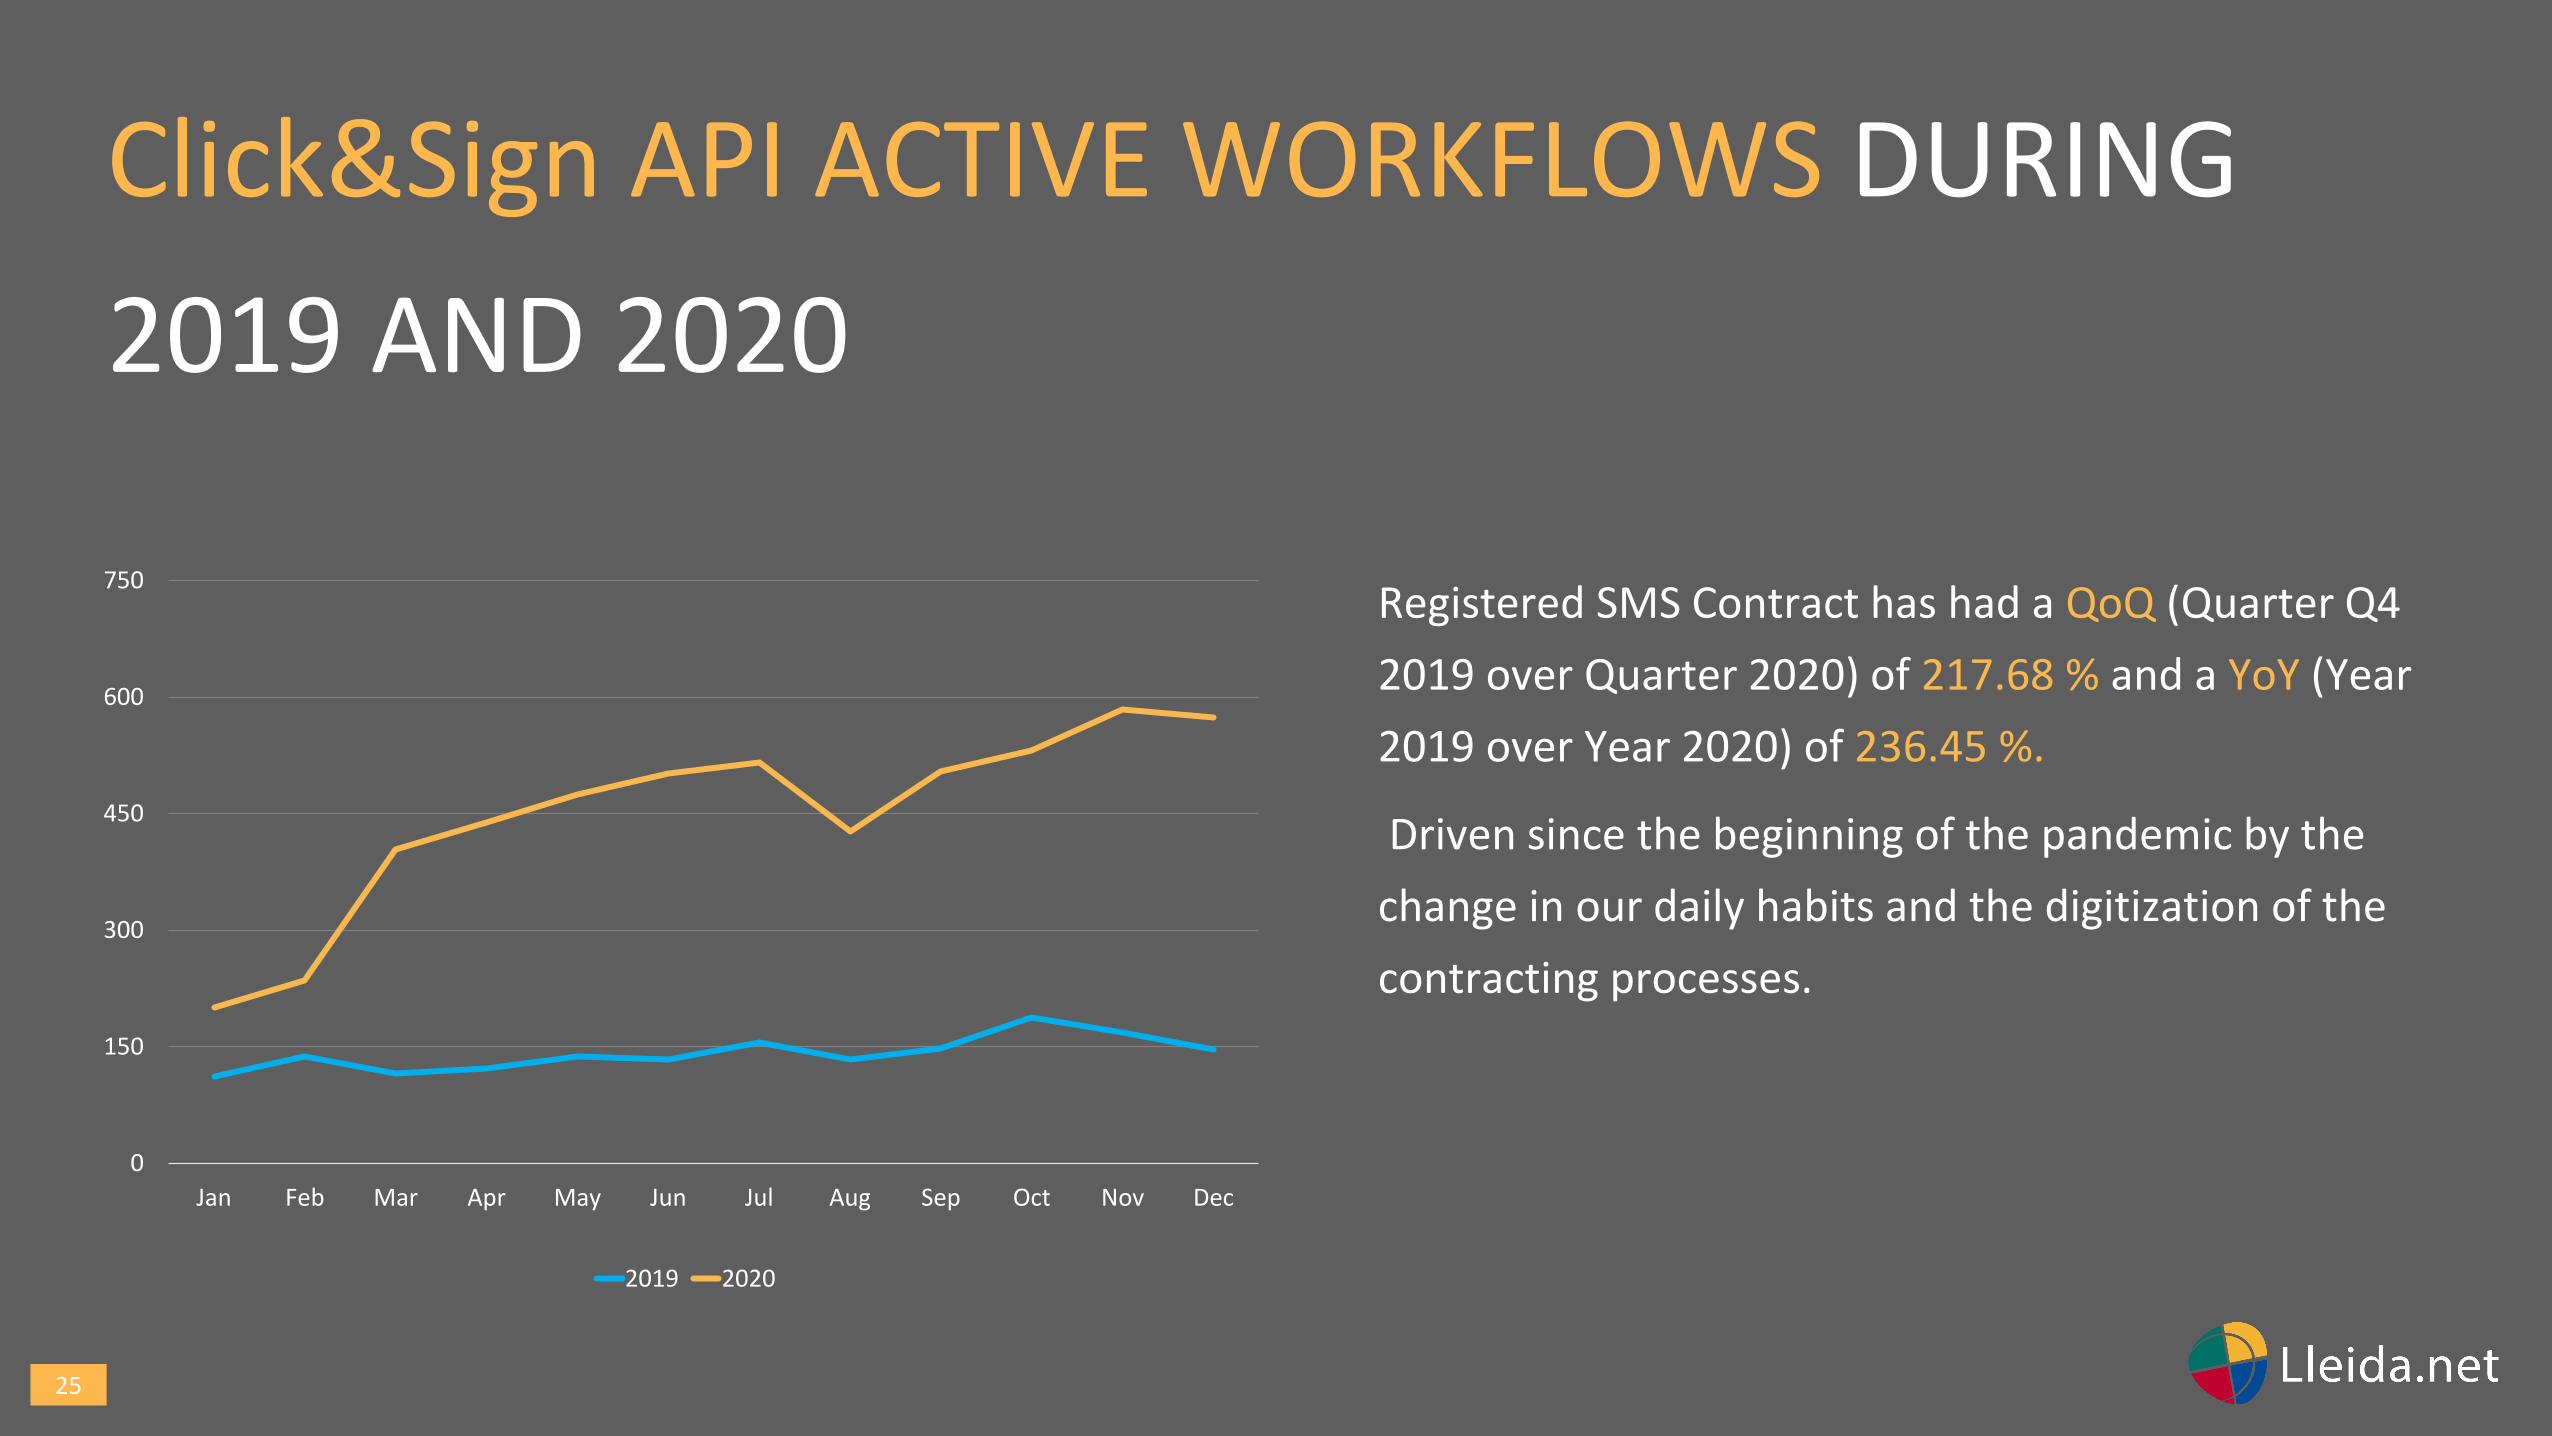
Click&Sign API ACTIVE WORKFLOWS DURING
2019 AND 2020
0
150
300
450
600
750
Jan Feb Mar Apr May Jun Jul Aug Sep Oct Nov Dec
2019 2020
Registered SMS Contract has had a QoQ (Quarter Q4
2019 over Quarter 2020) of 217.68 % and a YoY (Year
2019 over Year 2020) of 236.45 %.
Driven since the beginning of the pandemic by the
change in our daily habits and the digitization of the
contracting processes.
26
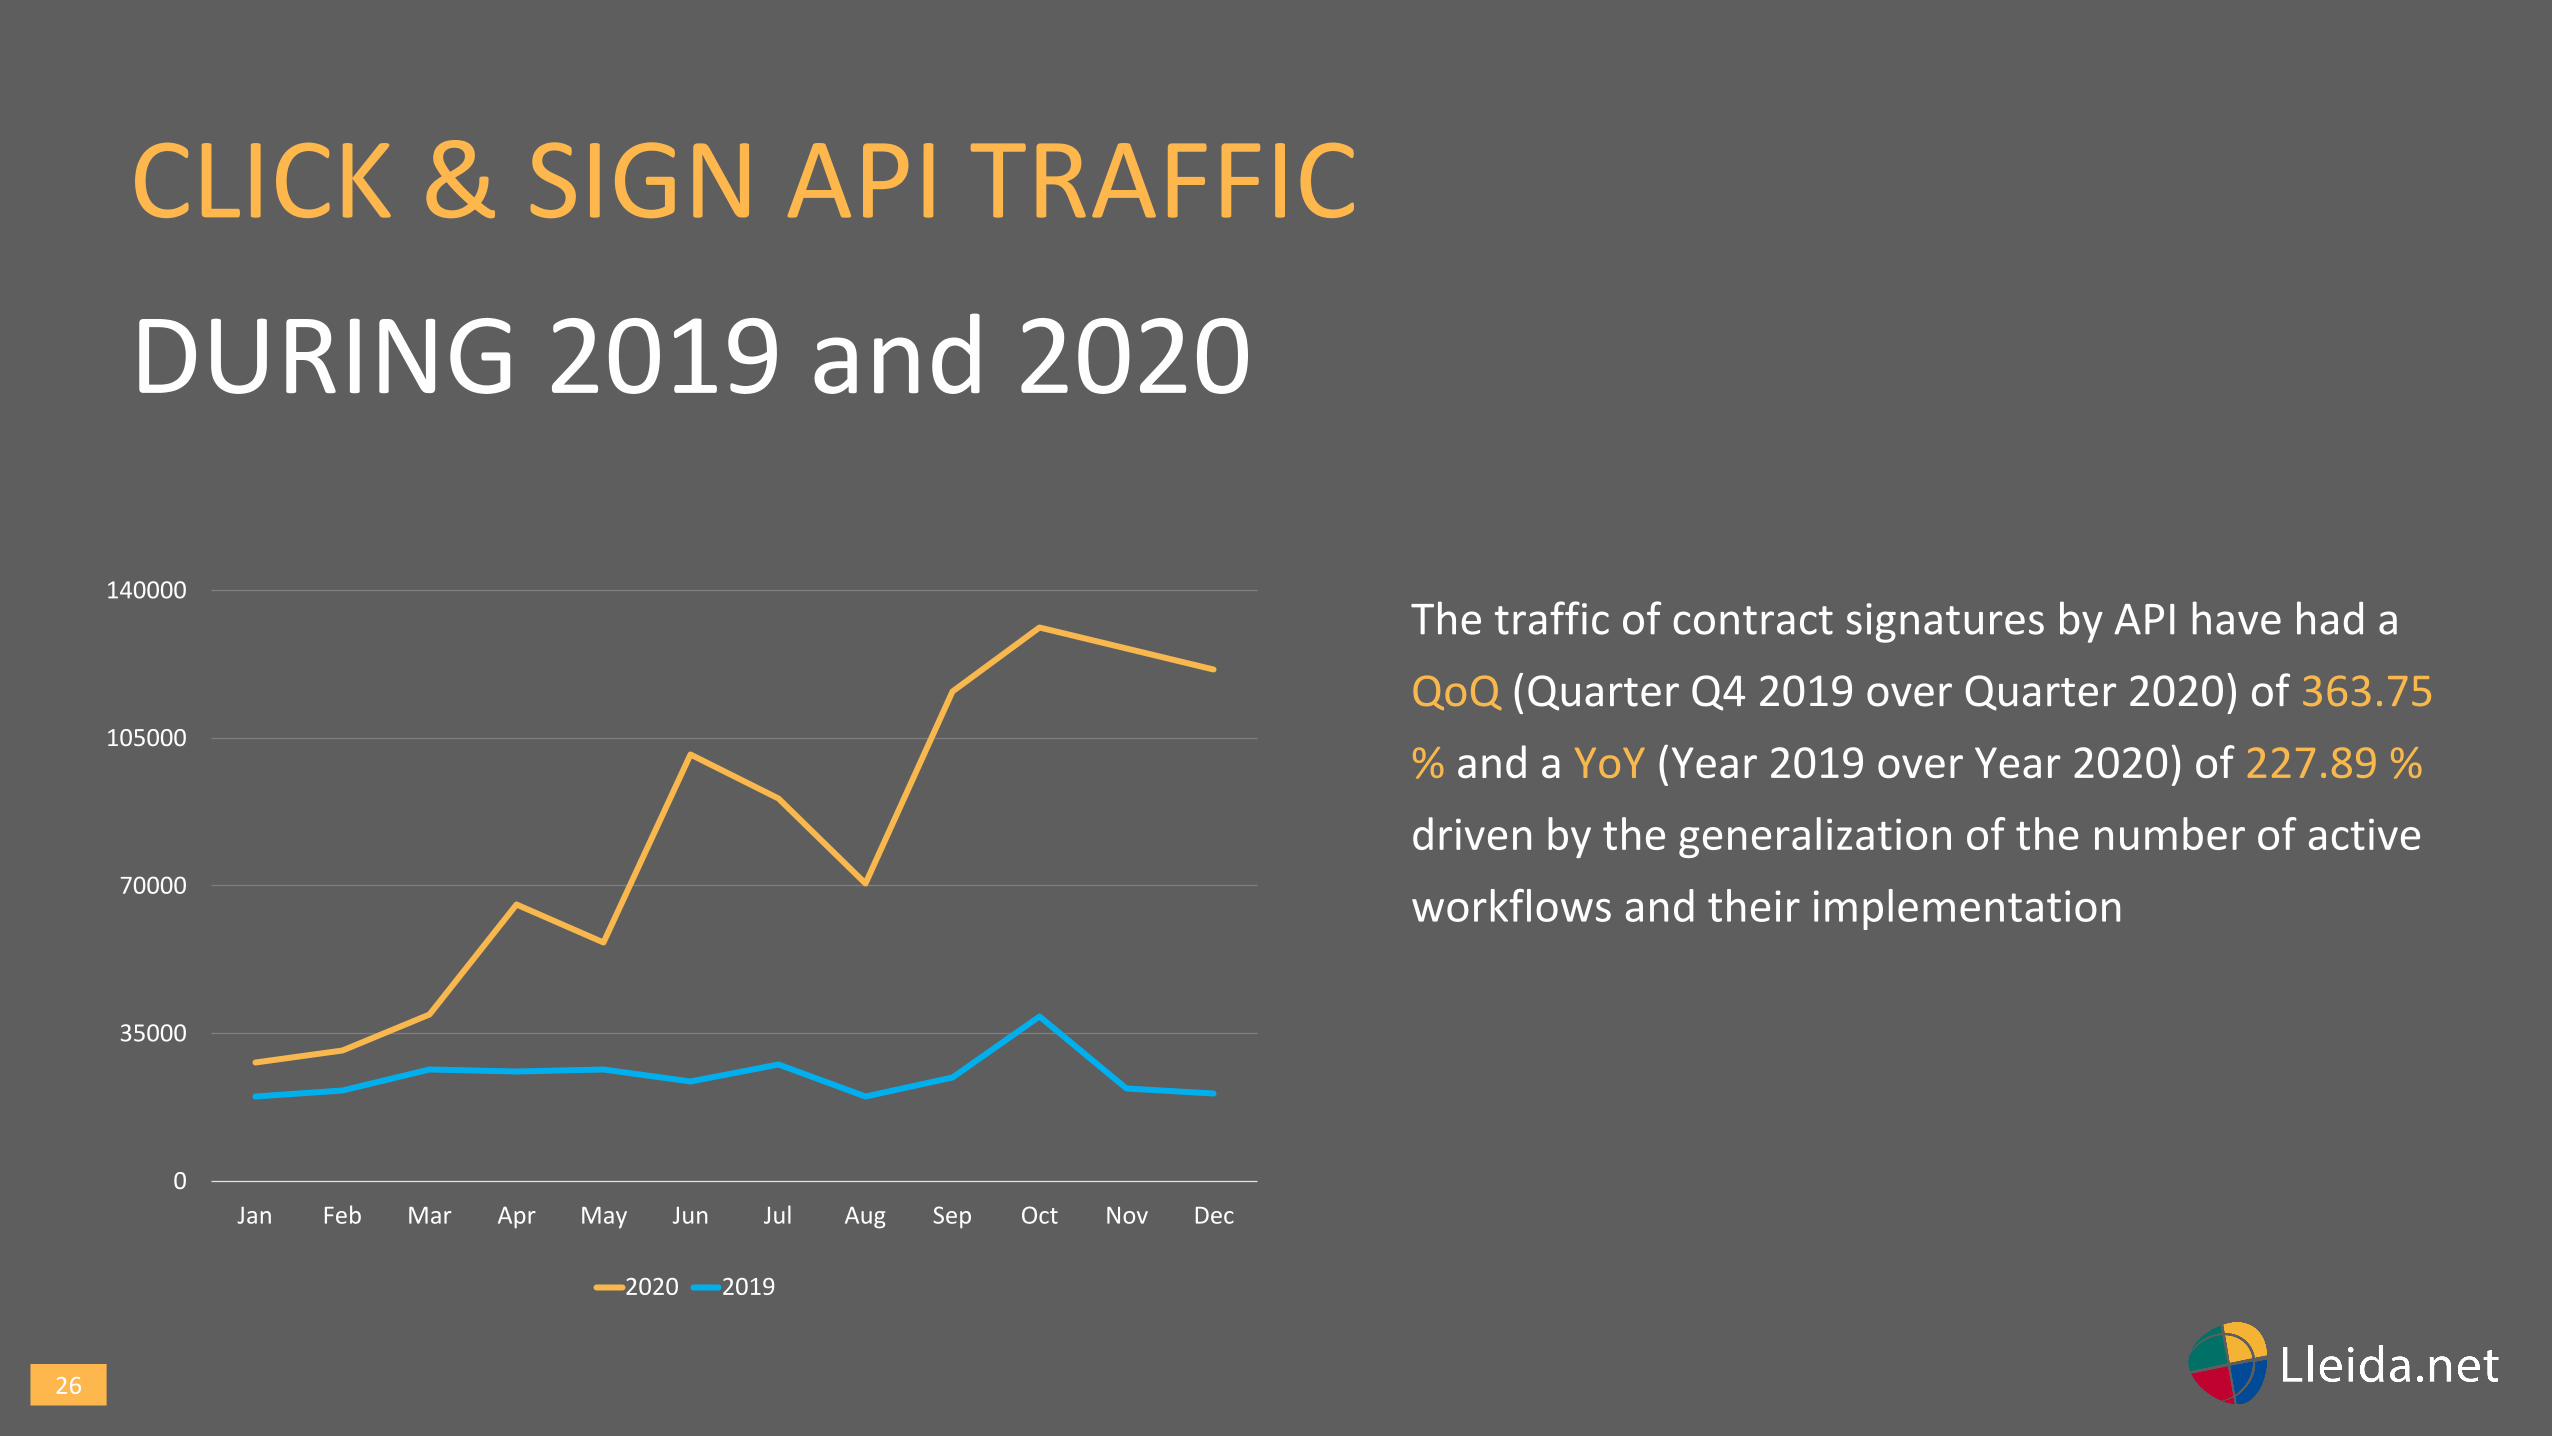
CLICK & SIGN API TRAFFIC
DURING 2019 and 2020
0
35000
70000
105000
140000
Jan Feb Mar Apr May Jun Jul Aug Sep Oct Nov Dec
2020 2019
The traffic of contract signatures by API have had a
QoQ (Quarter Q4 2019 over Quarter 2020) of 363.75
% and a YoY (Year 2019 over Year 2020) of 227.89 %
driven by the generalization of the number of active
workflows and their implementation.
27
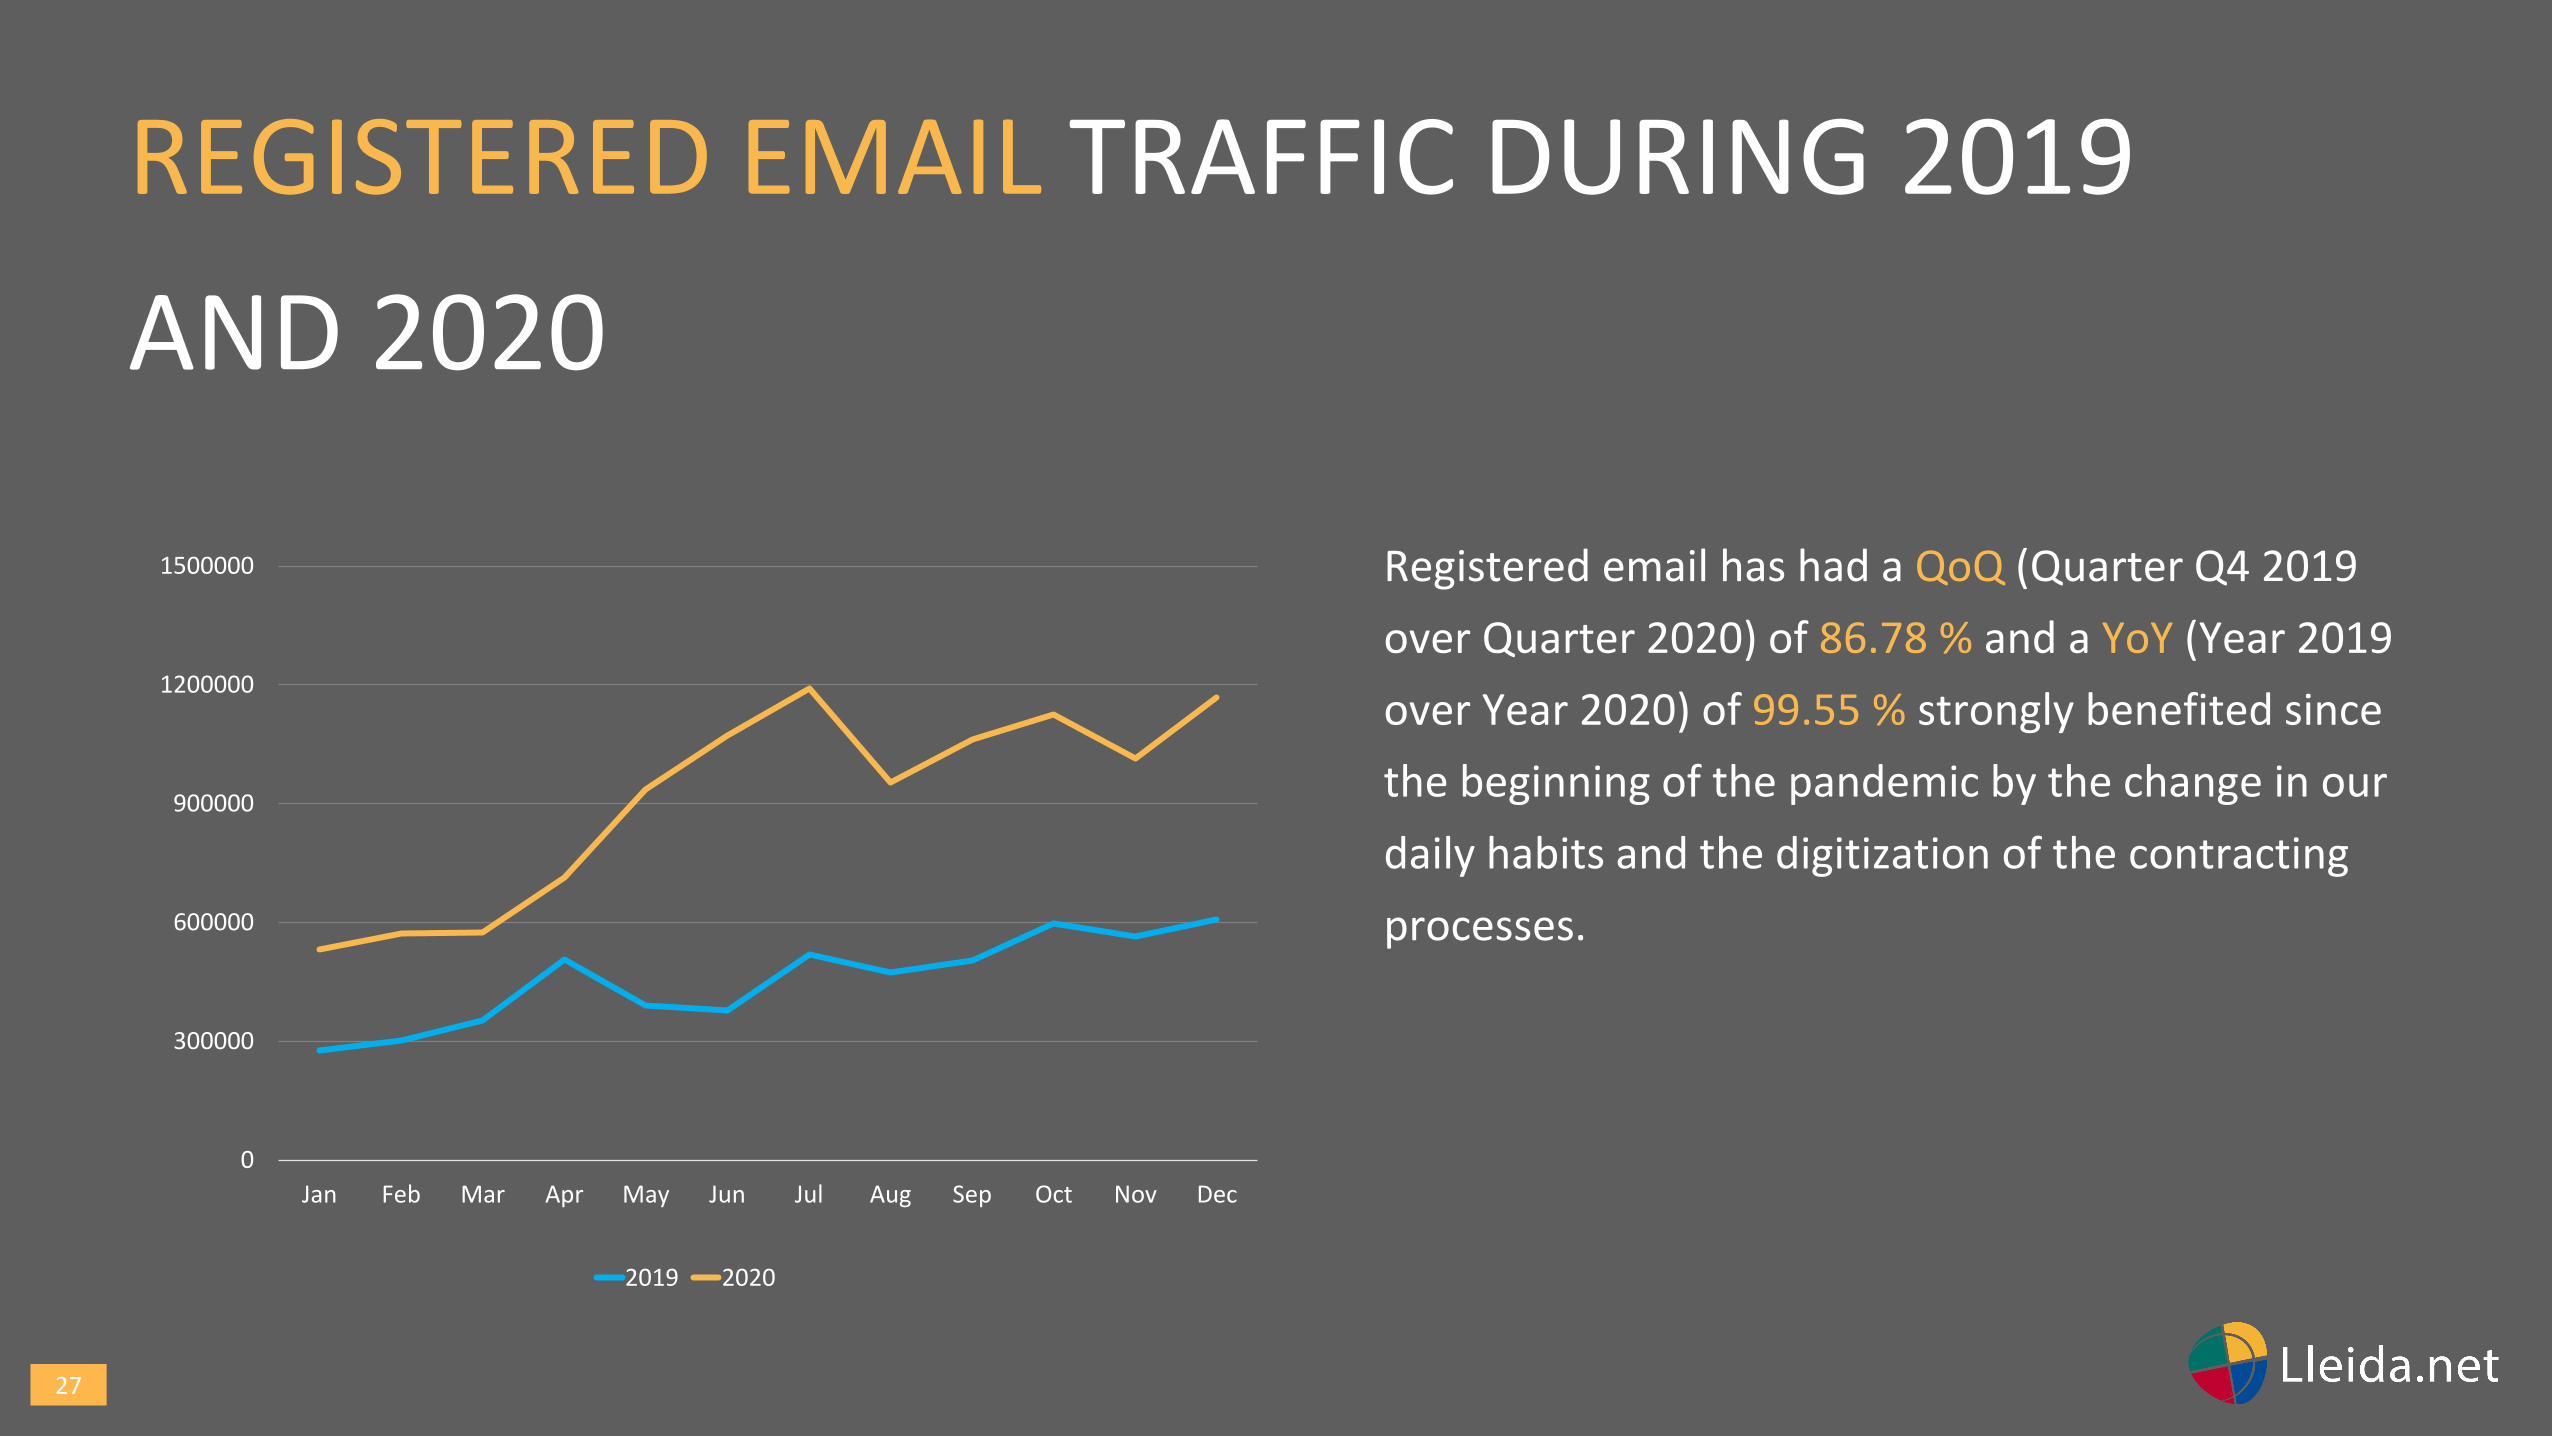
REGISTERED EMAIL TRAFFIC DURING 2019
AND 2020
0
300000
600000
900000
1200000
1500000
Jan Feb Mar Apr May Jun Jul Aug Sep Oct Nov Dec
2019 2020
Registered email has had a QoQ (Quarter Q4 2019
over Quarter 2020) of 86.78 % and a YoY (Year 2019
over Year 2020) of 99.55 % strongly benefited since
the beginning of the pandemic by the change in our
daily habits and the digitization of the contracting
processes.
28
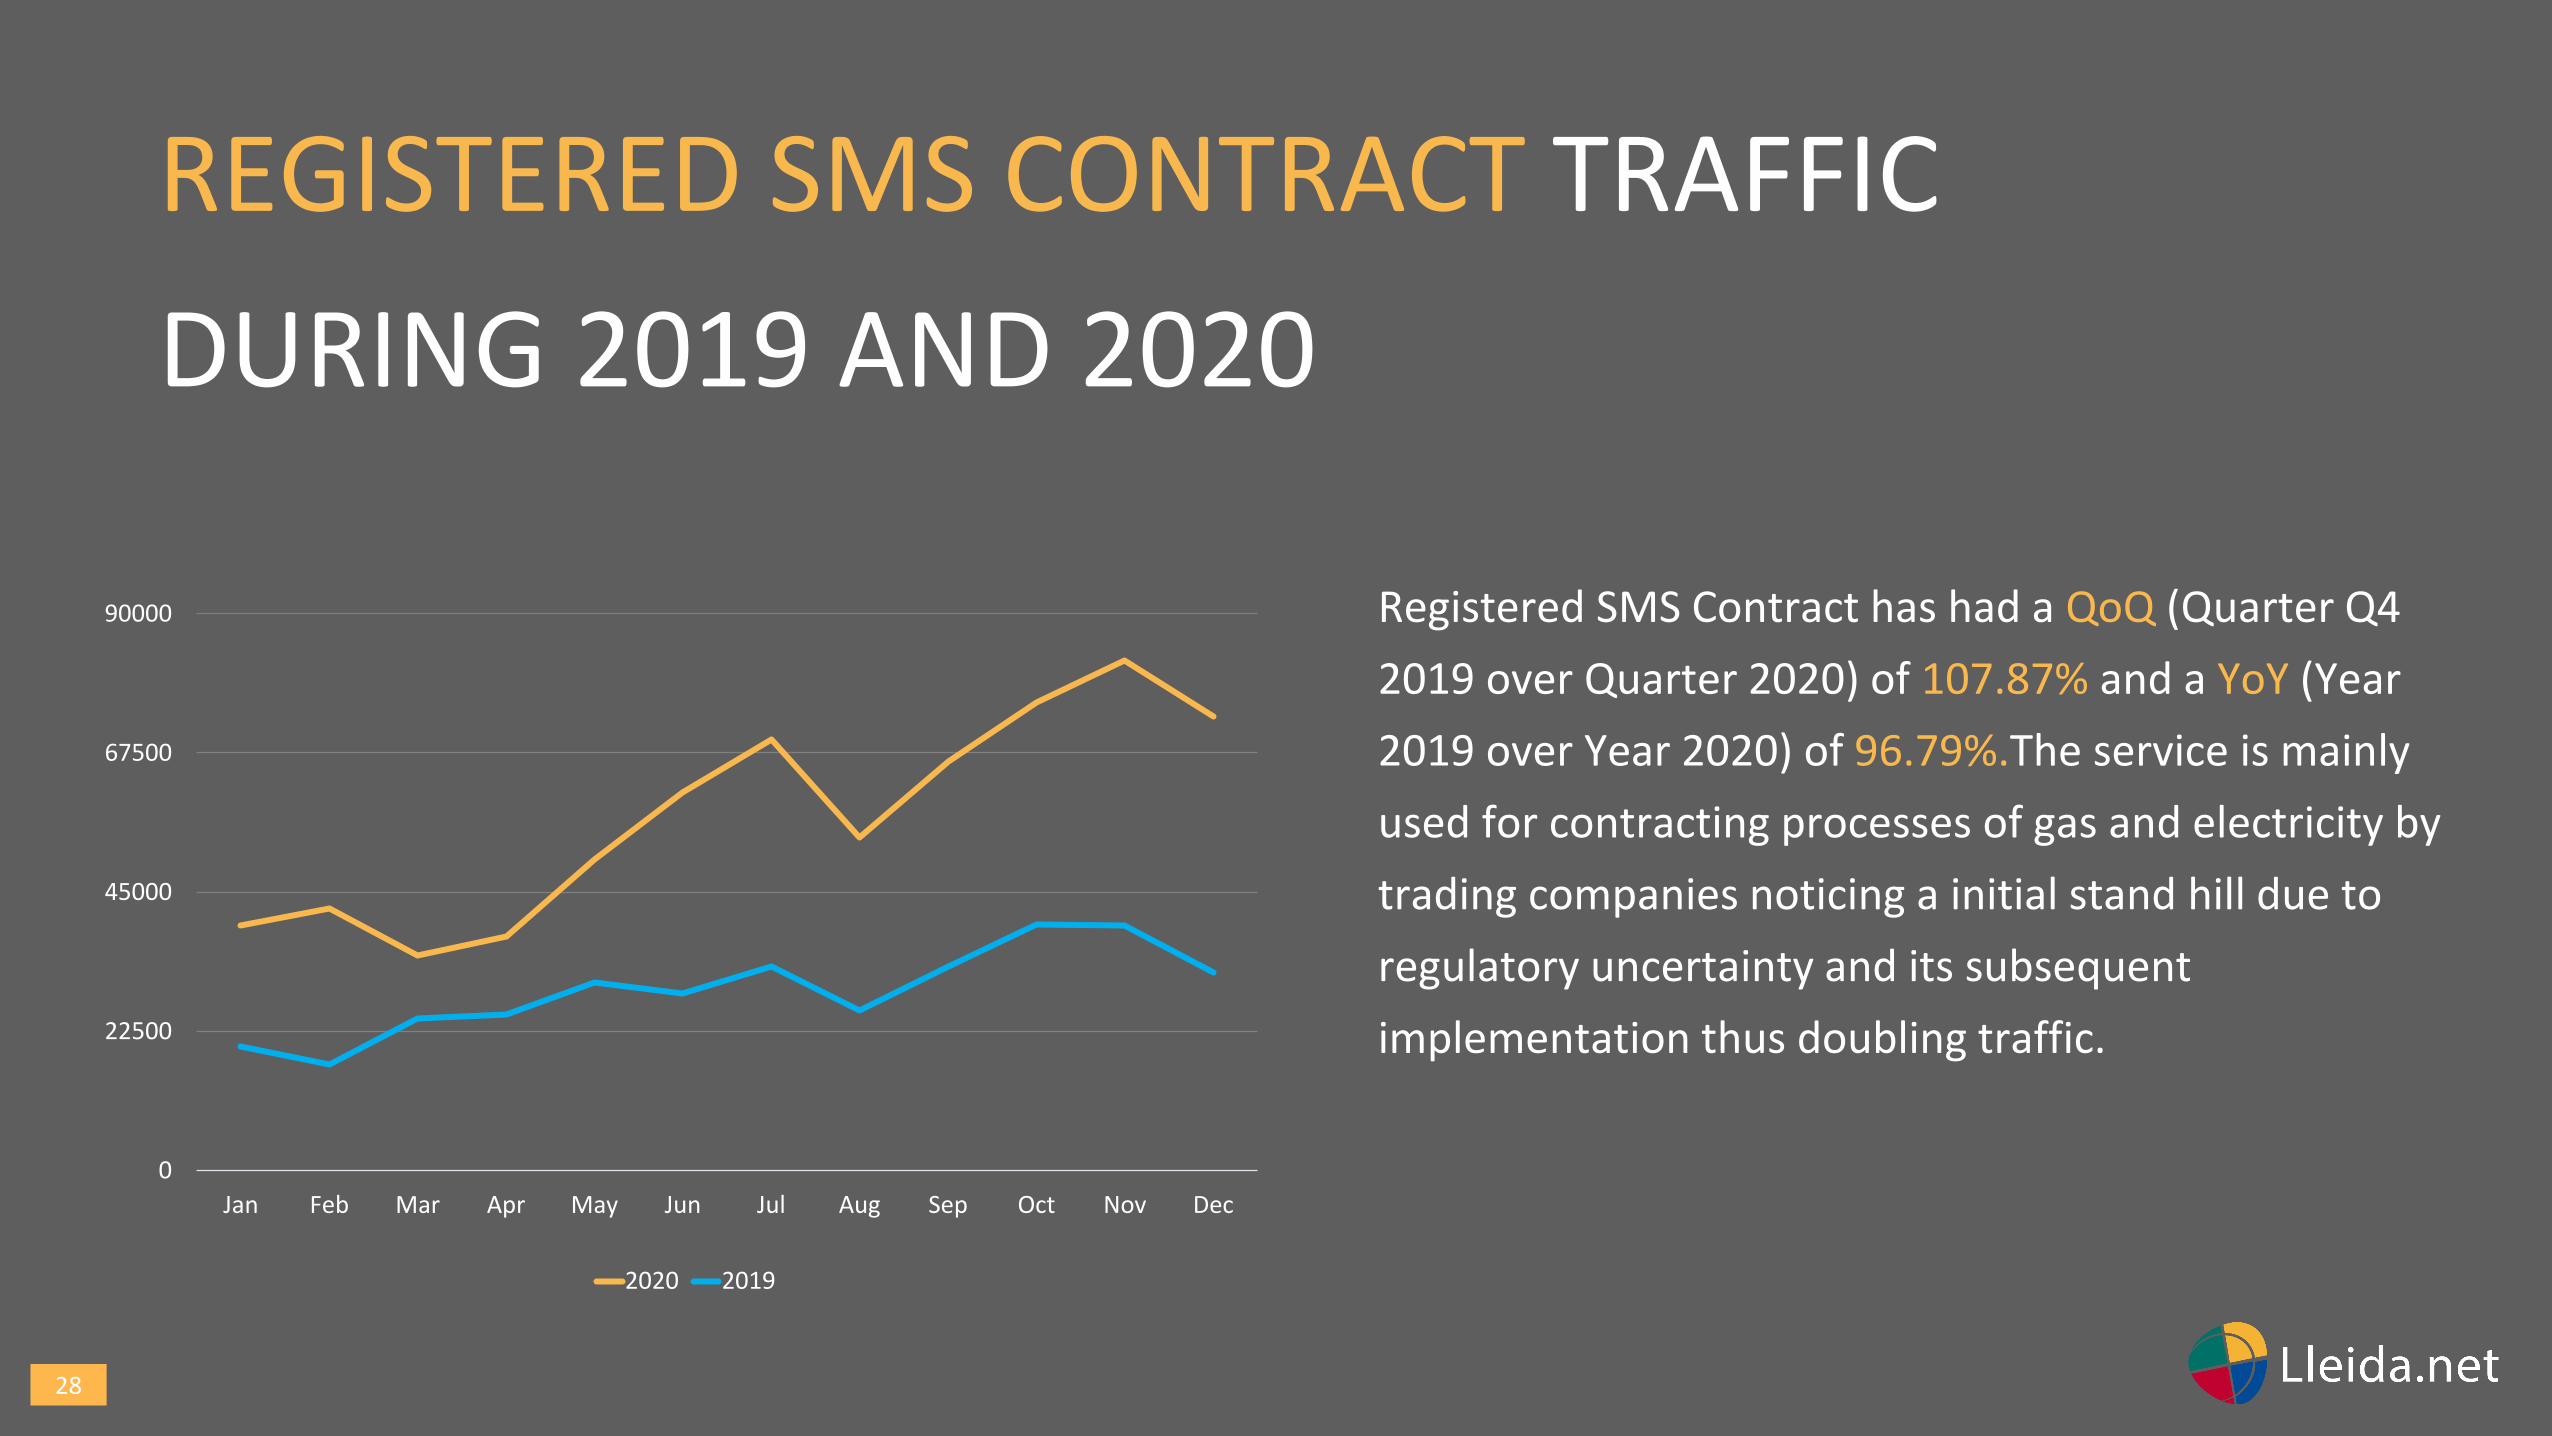
REGISTERED SMS CONTRACT TRAFFIC
DURING 2019 AND 2020
0
22500
45000
67500
90000
Jan Feb Mar Apr May Jun Jul Aug Sep Oct Nov Dec
2020 2019
Registered SMS Contract has had a QoQ (Quarter Q4
2019 over Quarter 2020) of 107.87% and a YoY (Year
2019 over Year 2020) of 96.79%.The service is mainly
used for contracting processes of gas and electricity by
trading companies noticing a initial stand hill due to
regulatory uncertainty and its subsequent
implementation thus doubling traffic.
29
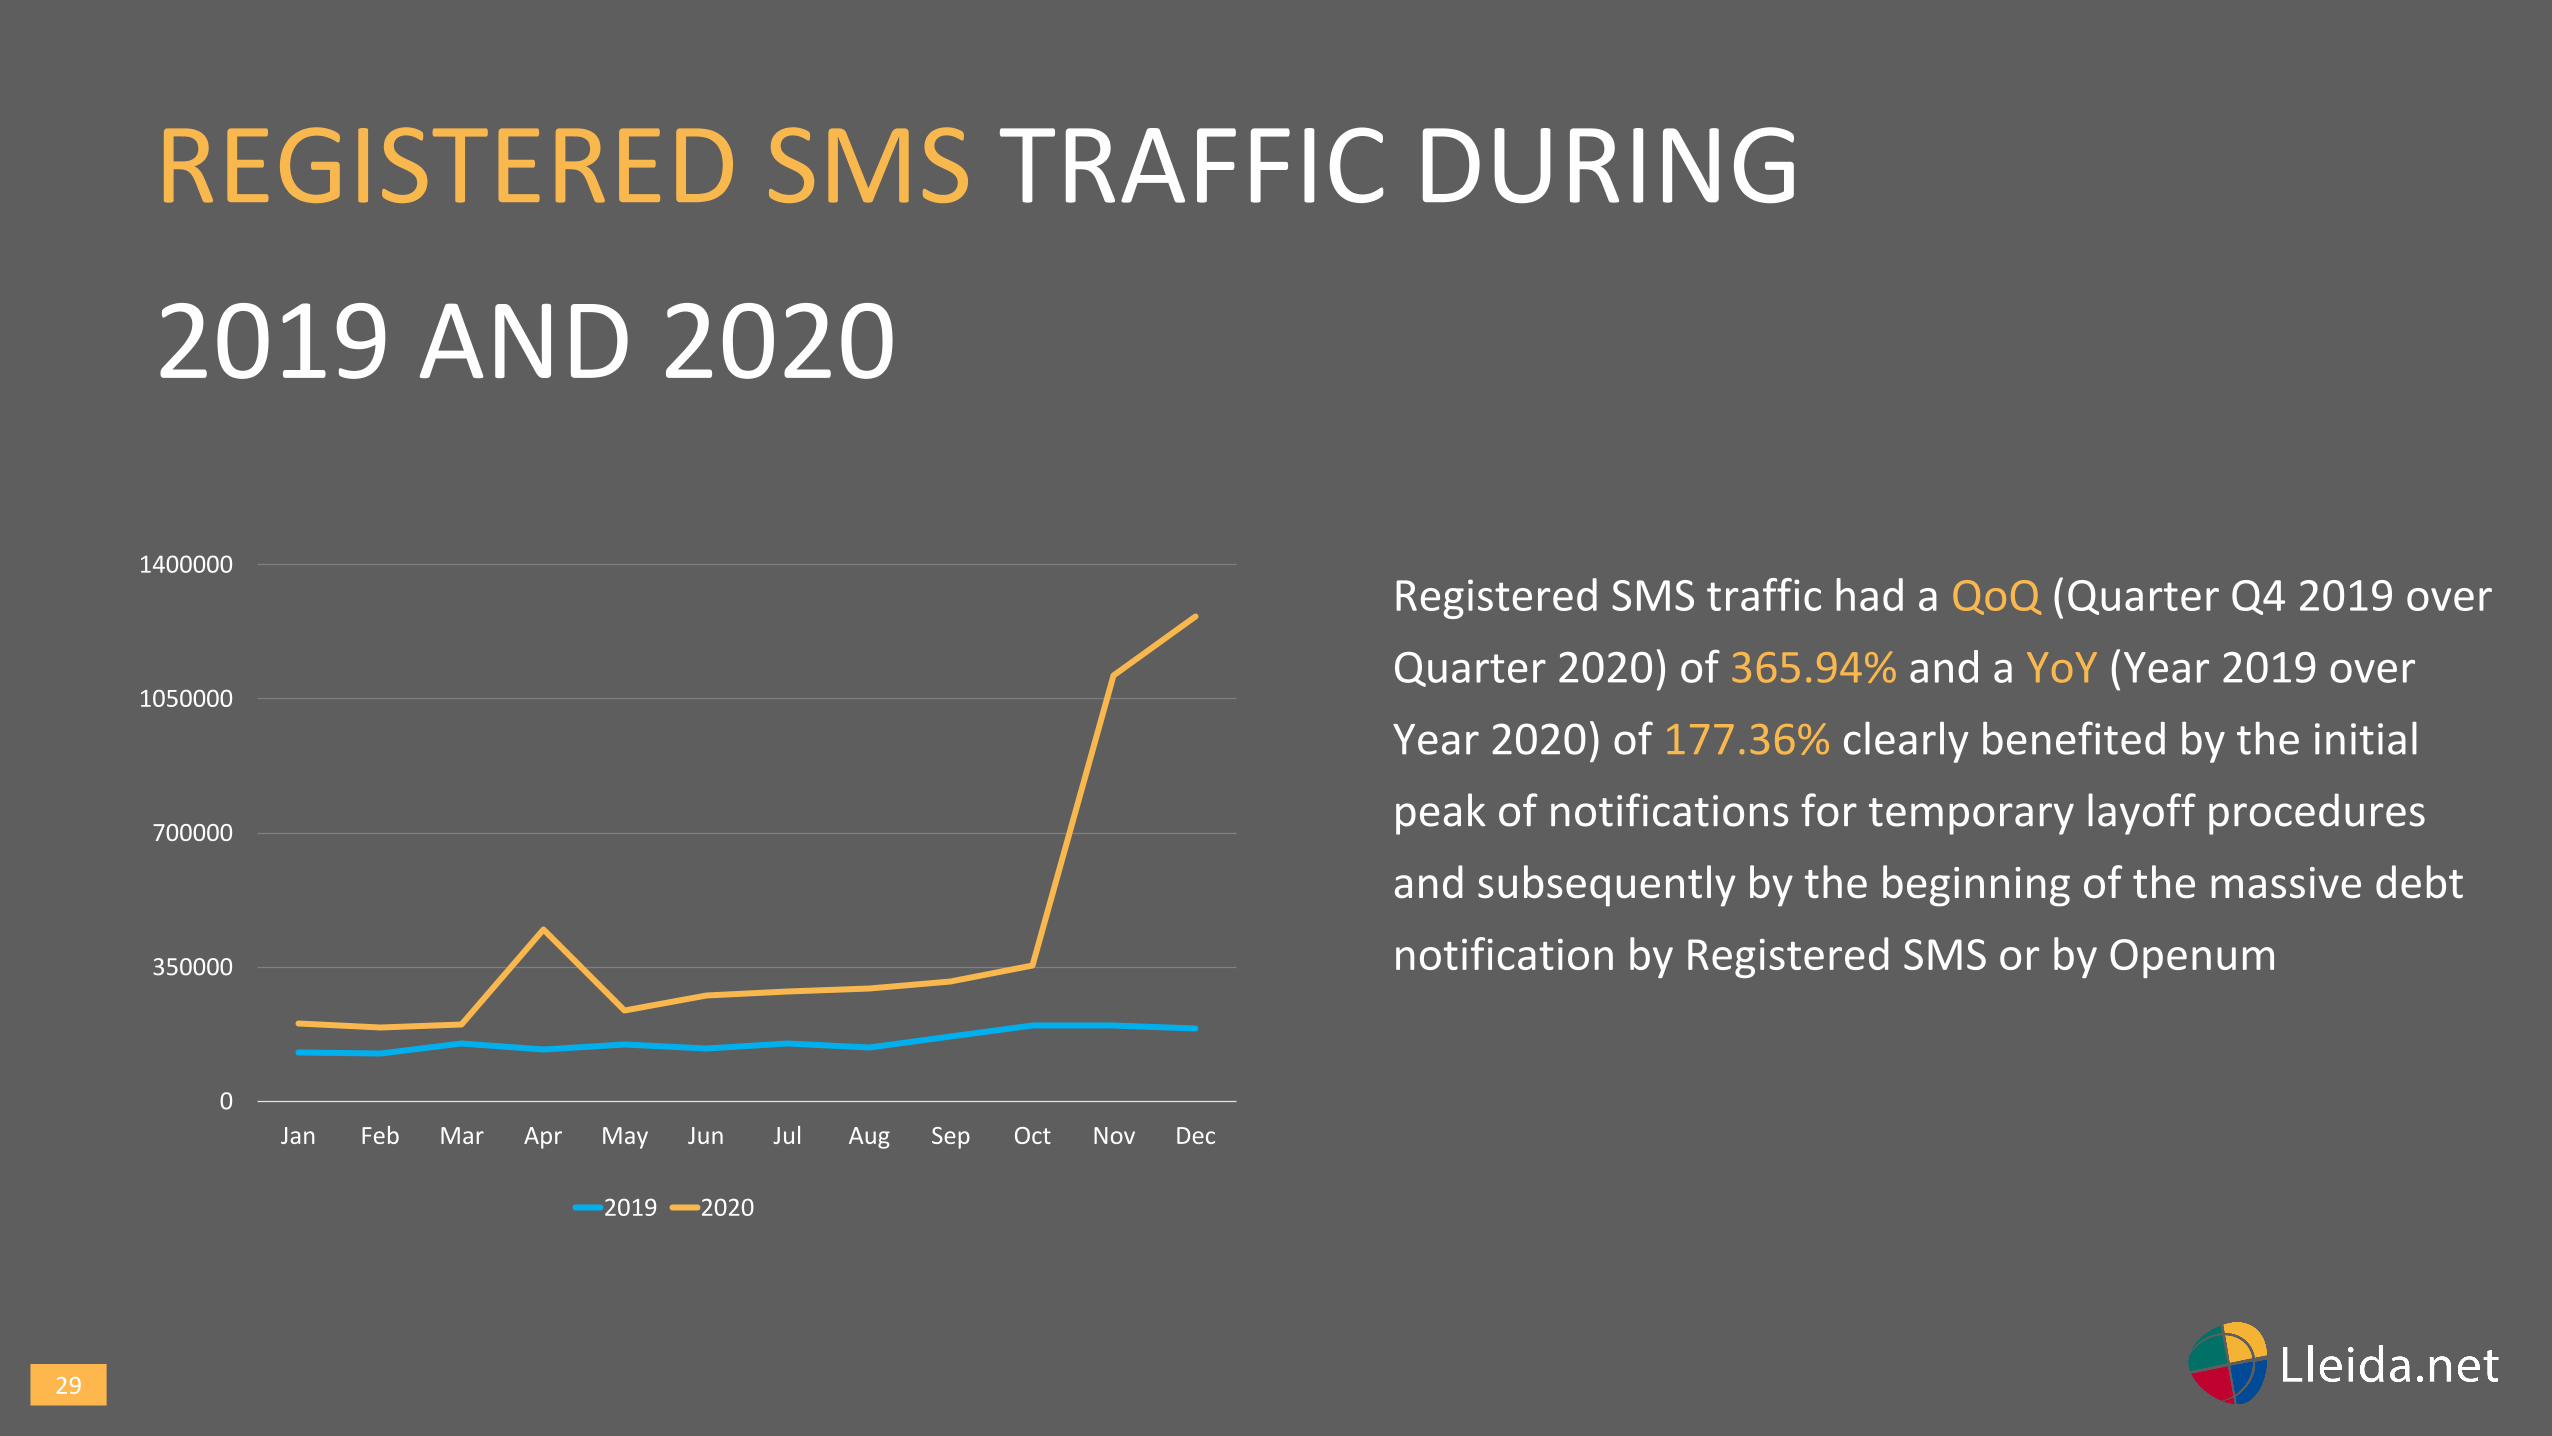
REGISTERED SMS TRAFFIC DURING
2019 AND 2020
0
350000
700000
1050000
1400000
Jan Feb Mar Apr May Jun Jul Aug Sep Oct Nov Dec
2019 2020
Registered SMS traffic had a QoQ (Quarter Q4 2019 over
Quarter 2020) of 365.94% and a YoY (Year 2019 over
Year 2020) of 177.36% clearly benefited by the initial
peak of notifications for temporary layoff procedures
and subsequently by the beginning of the massive debt
notification by Registered SMS or by Openum.

30
THE PATENTS: OUR INTELLECTUAL
PROPERTY
31
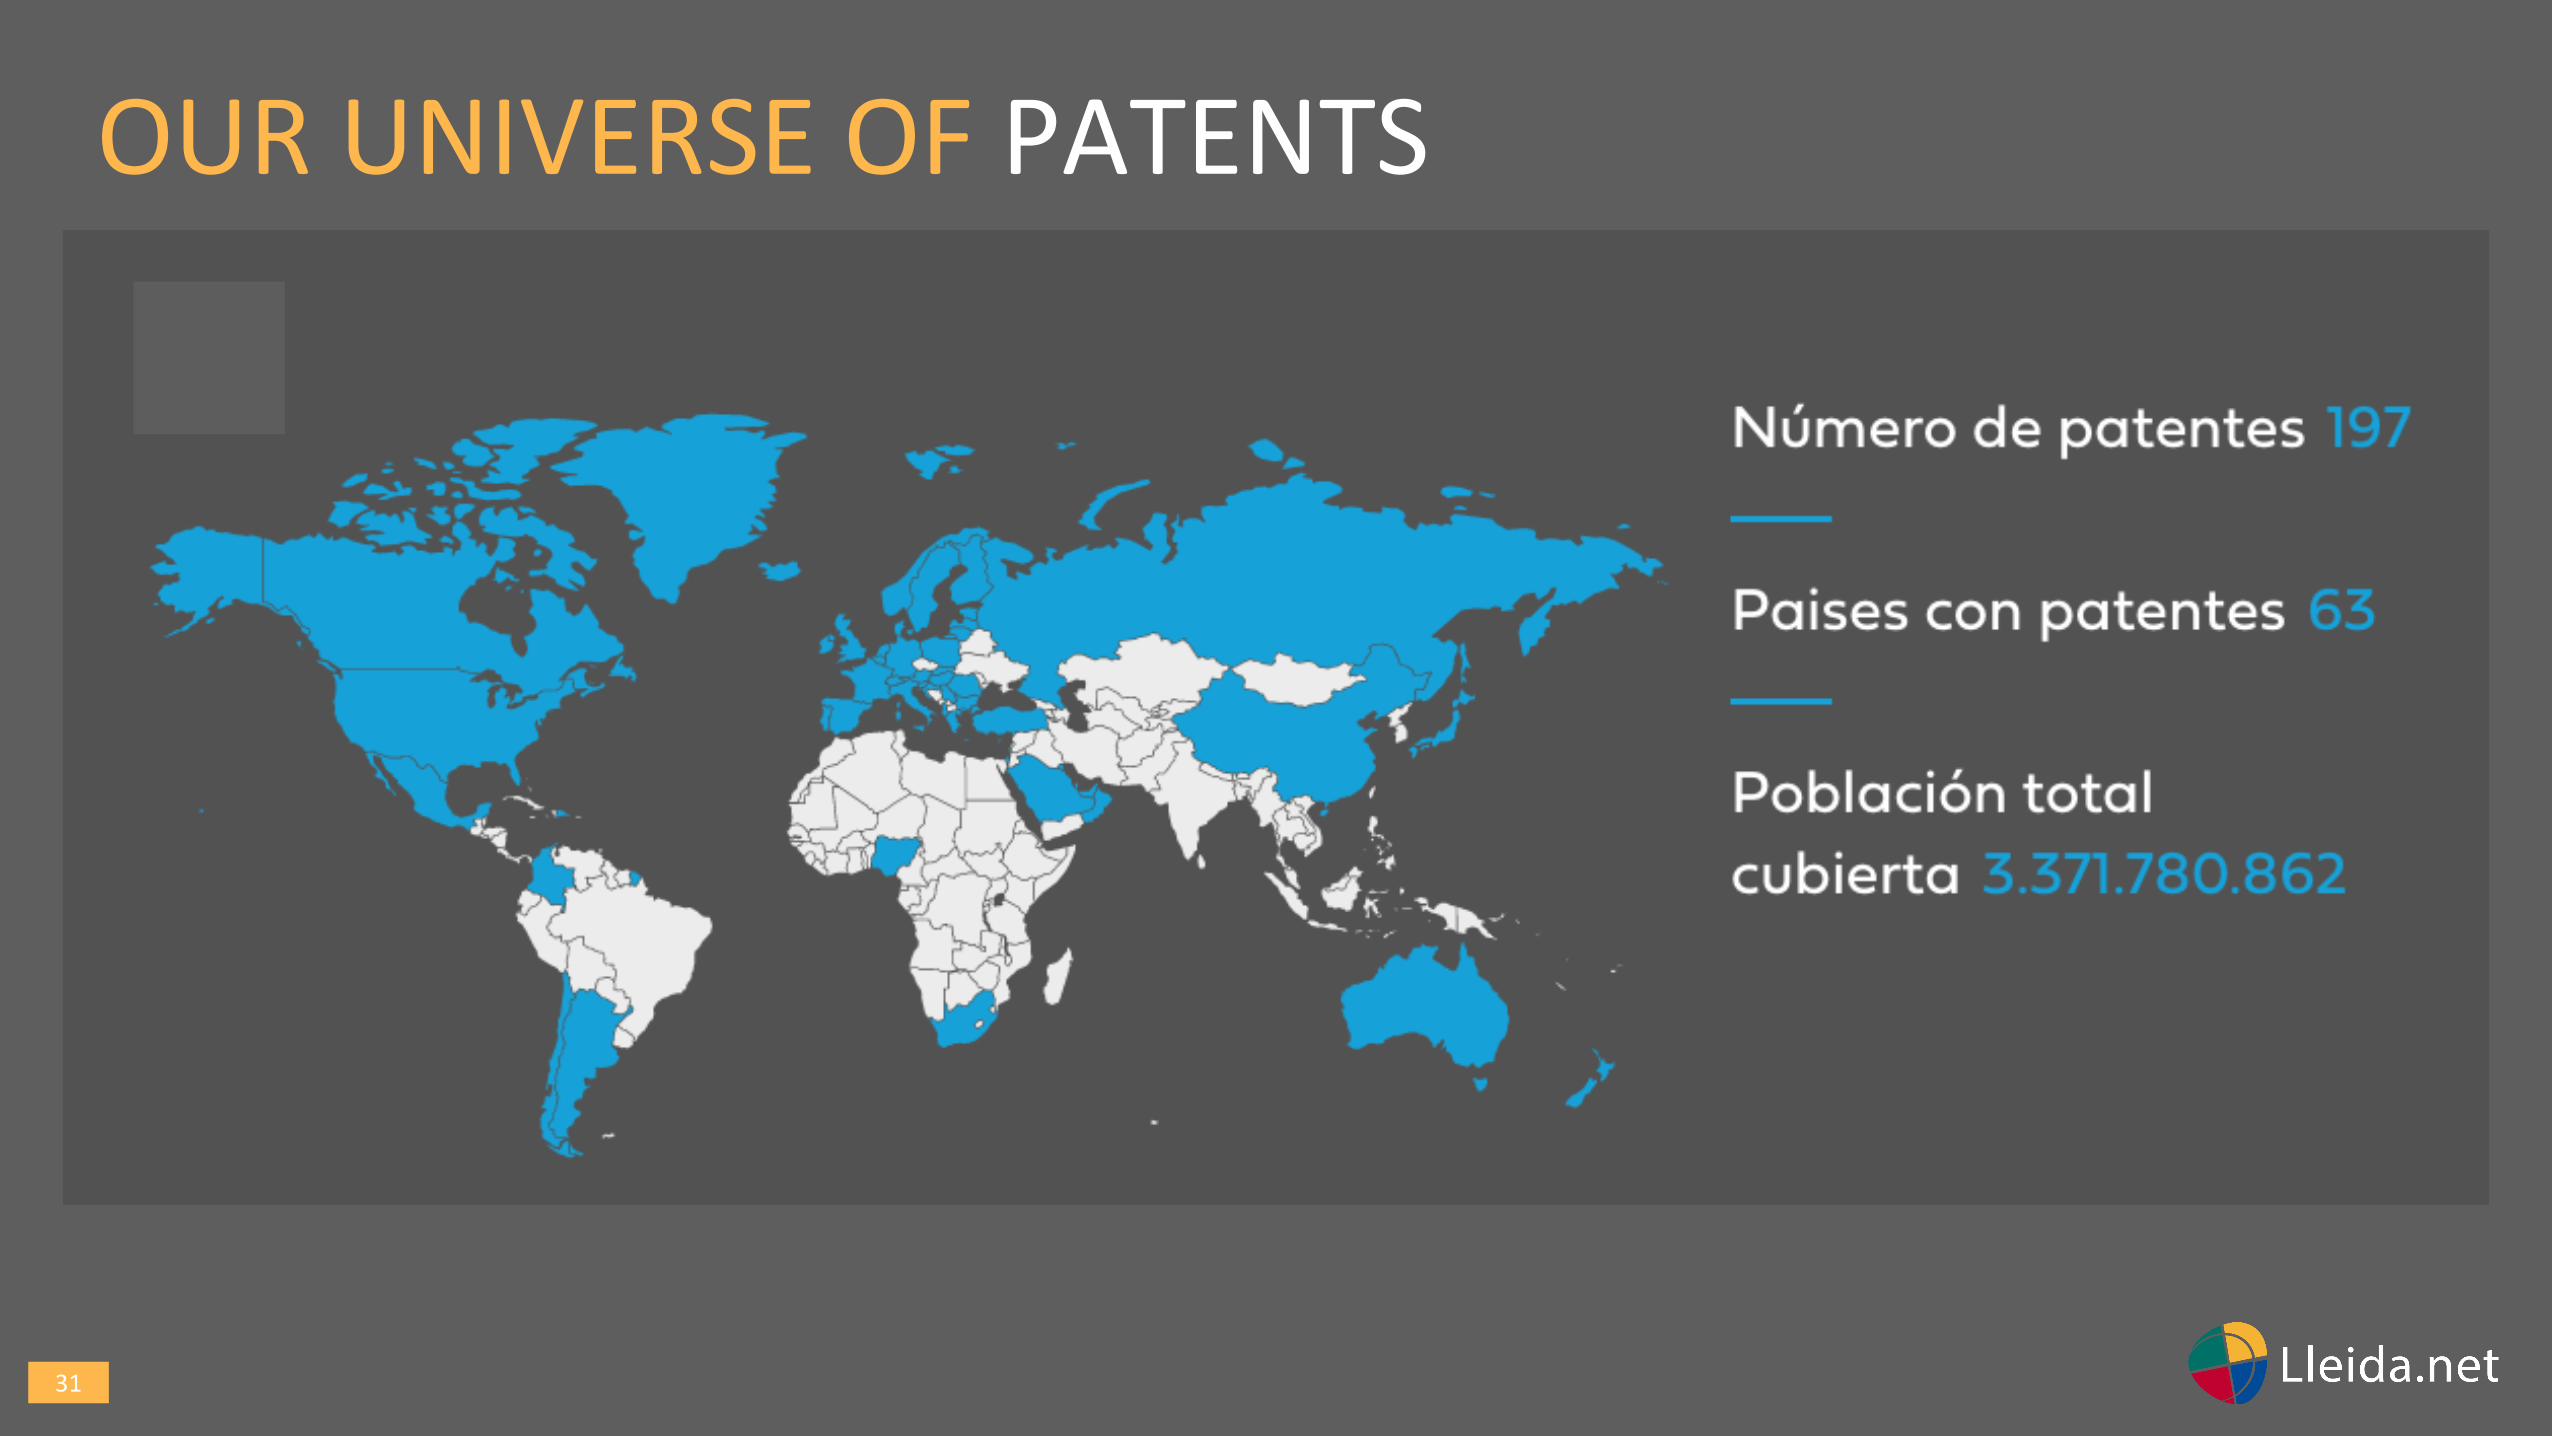
OUR UNIVERSE OF PATENTS
32
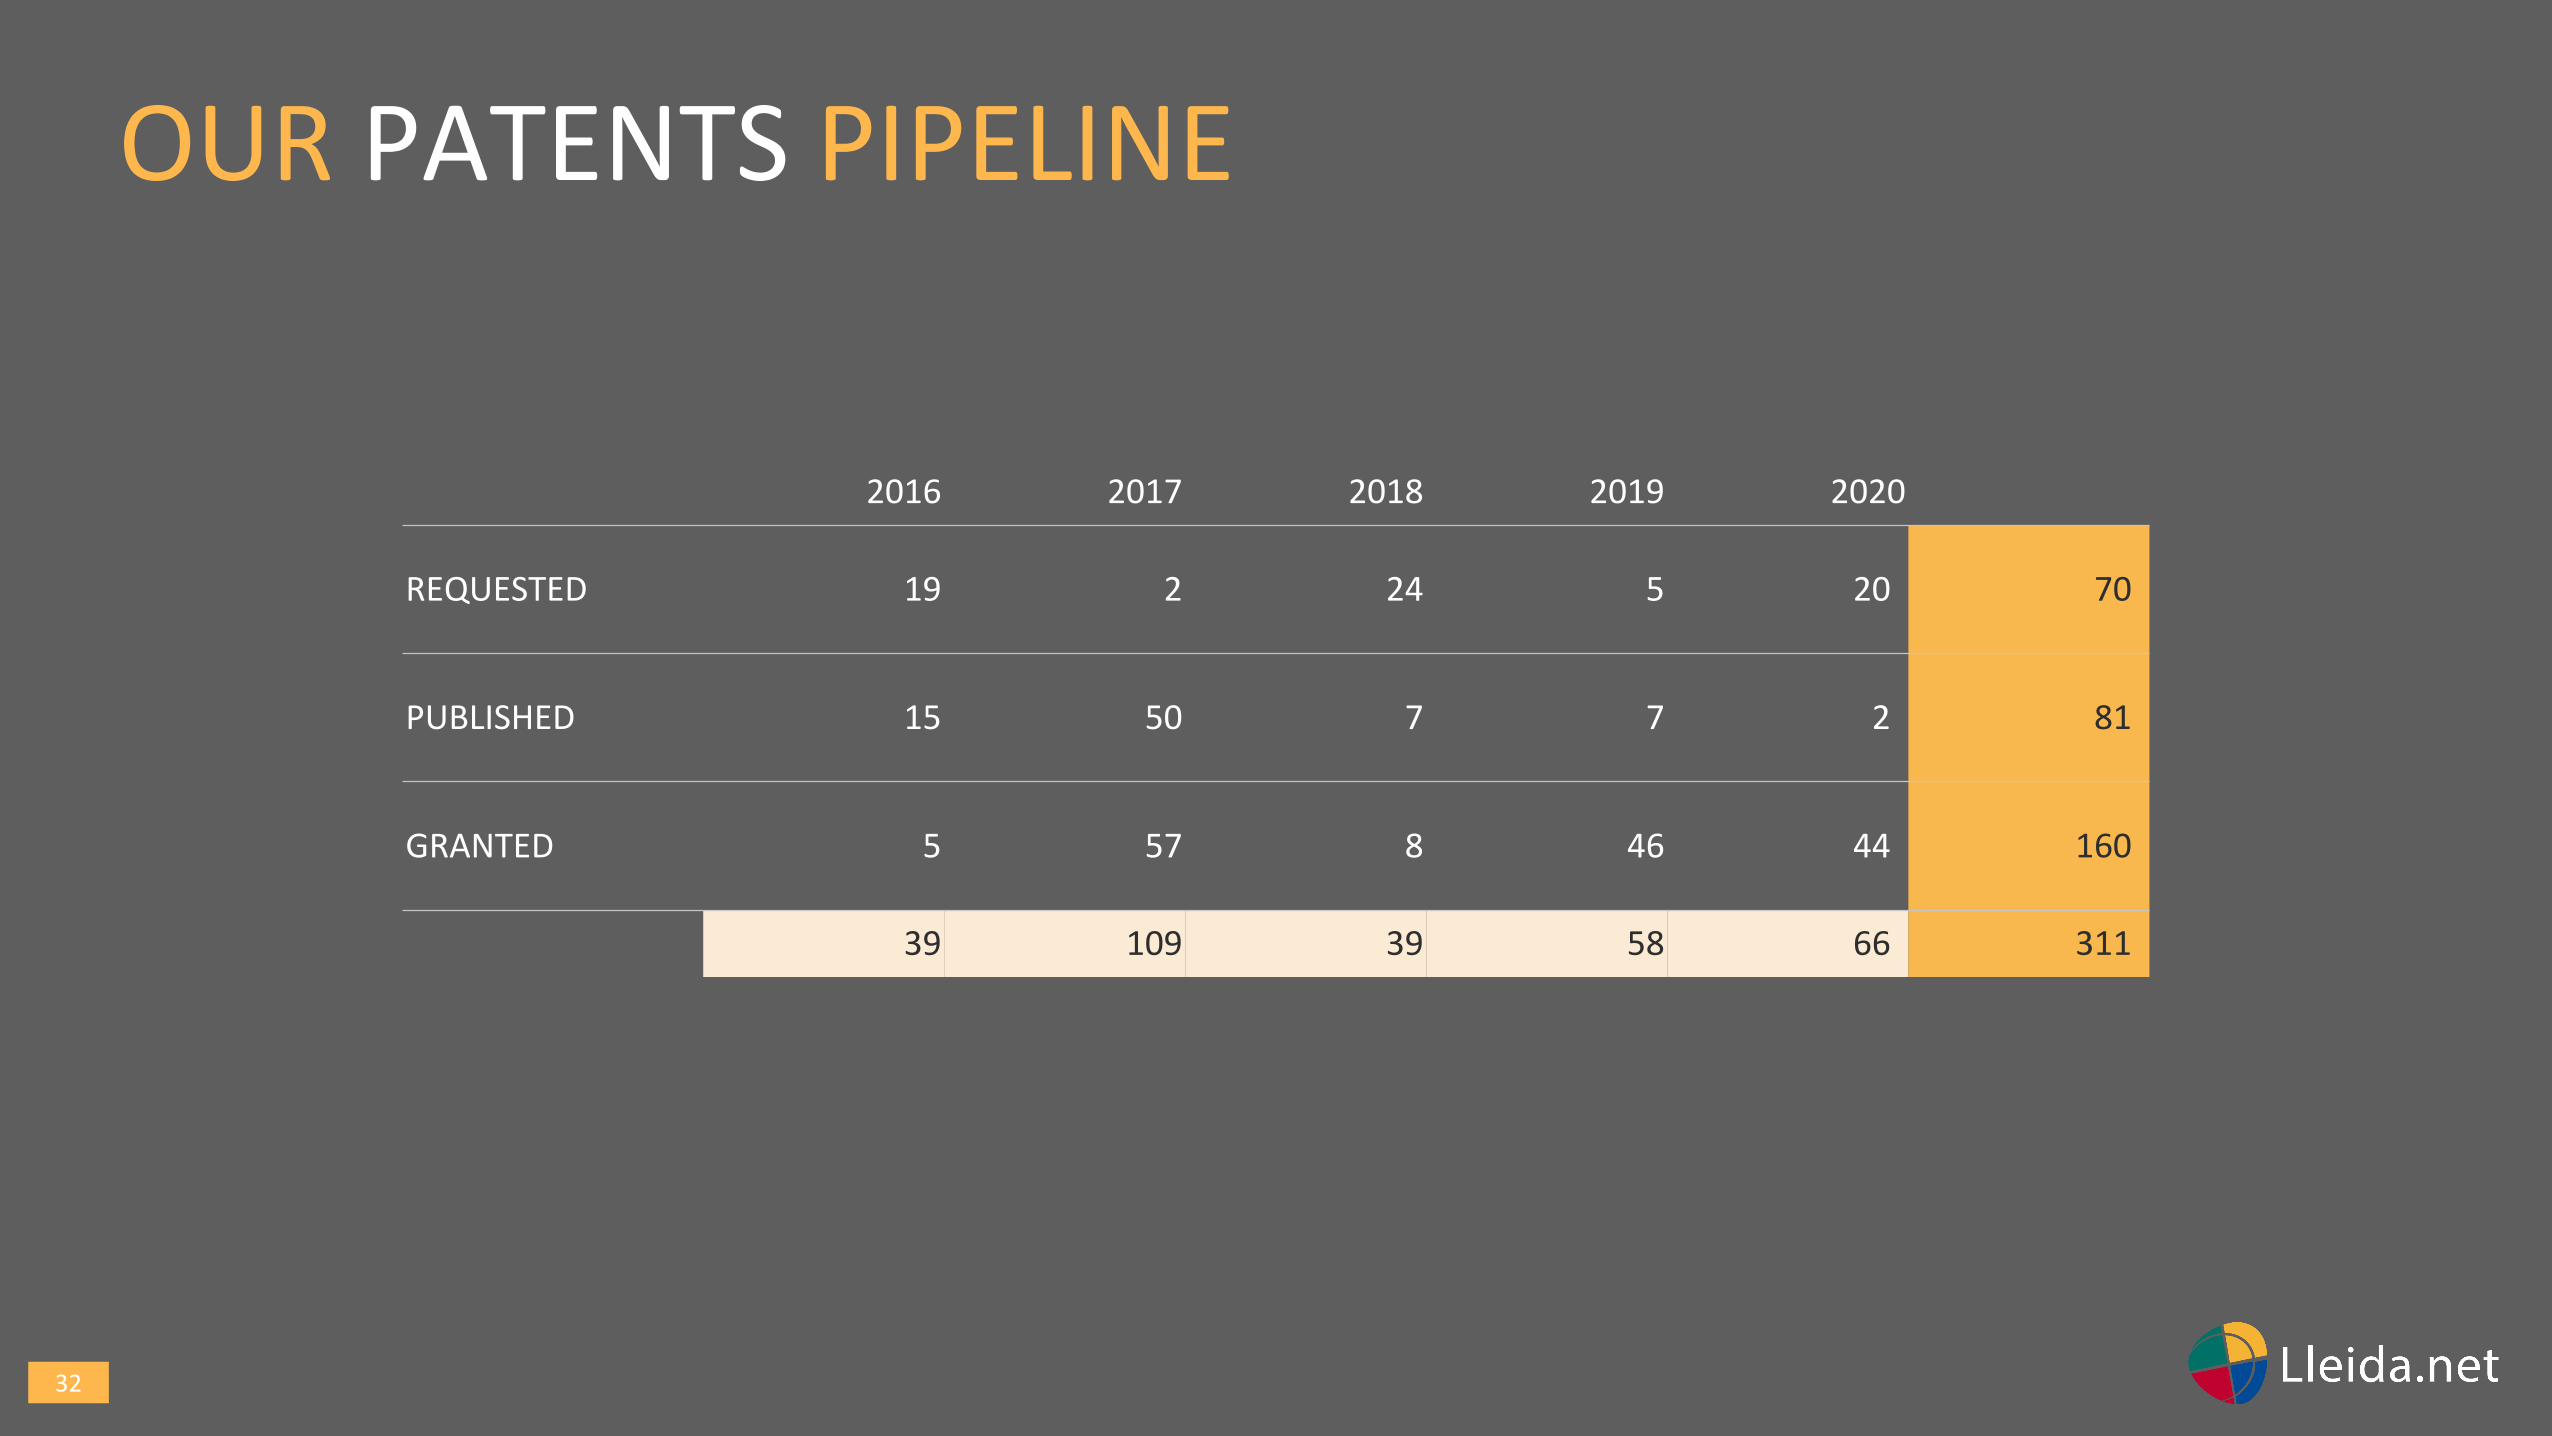
2016 2017 2018 2019 2020
REQUESTED 19 2 24 5 20 70
PUBLISHED 15 50 7 7 2 81
GRANTED 5 57 8 46 44 160
39 109 39 58 66 311
OUR PATENTS PIPELINE
33
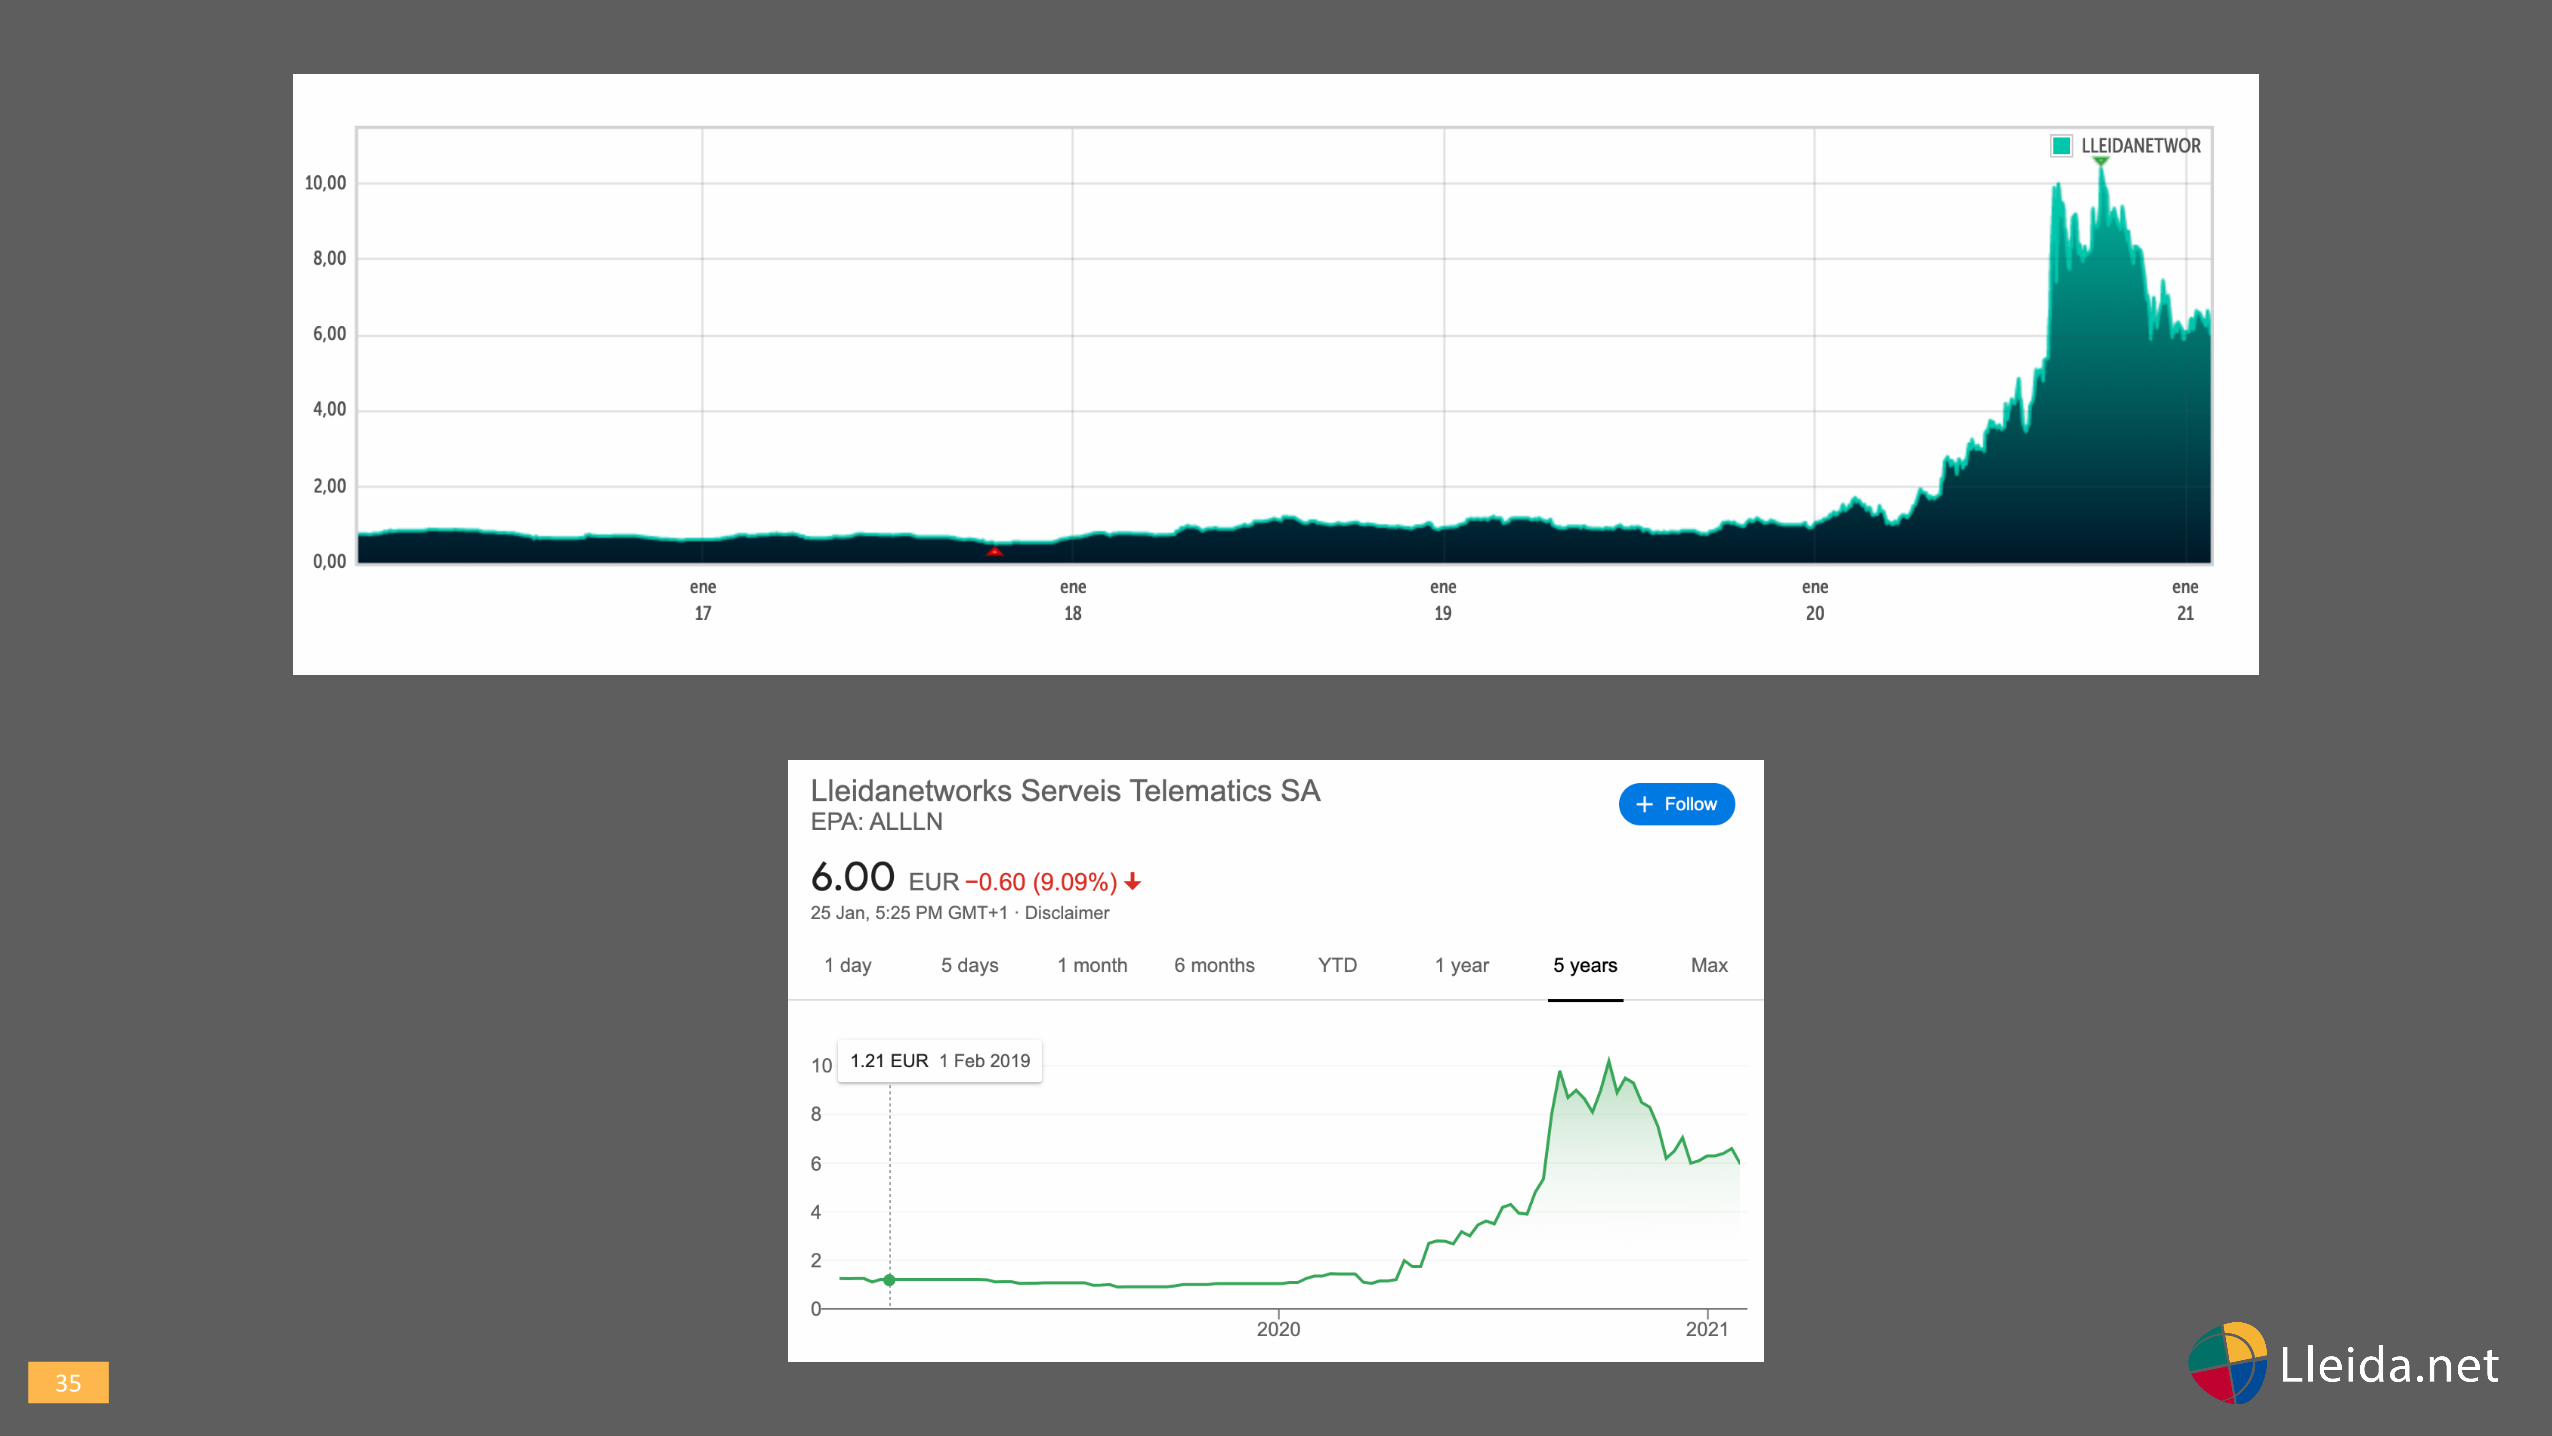
OUR EVOLUTION IN STOCK EXCHANGES
34
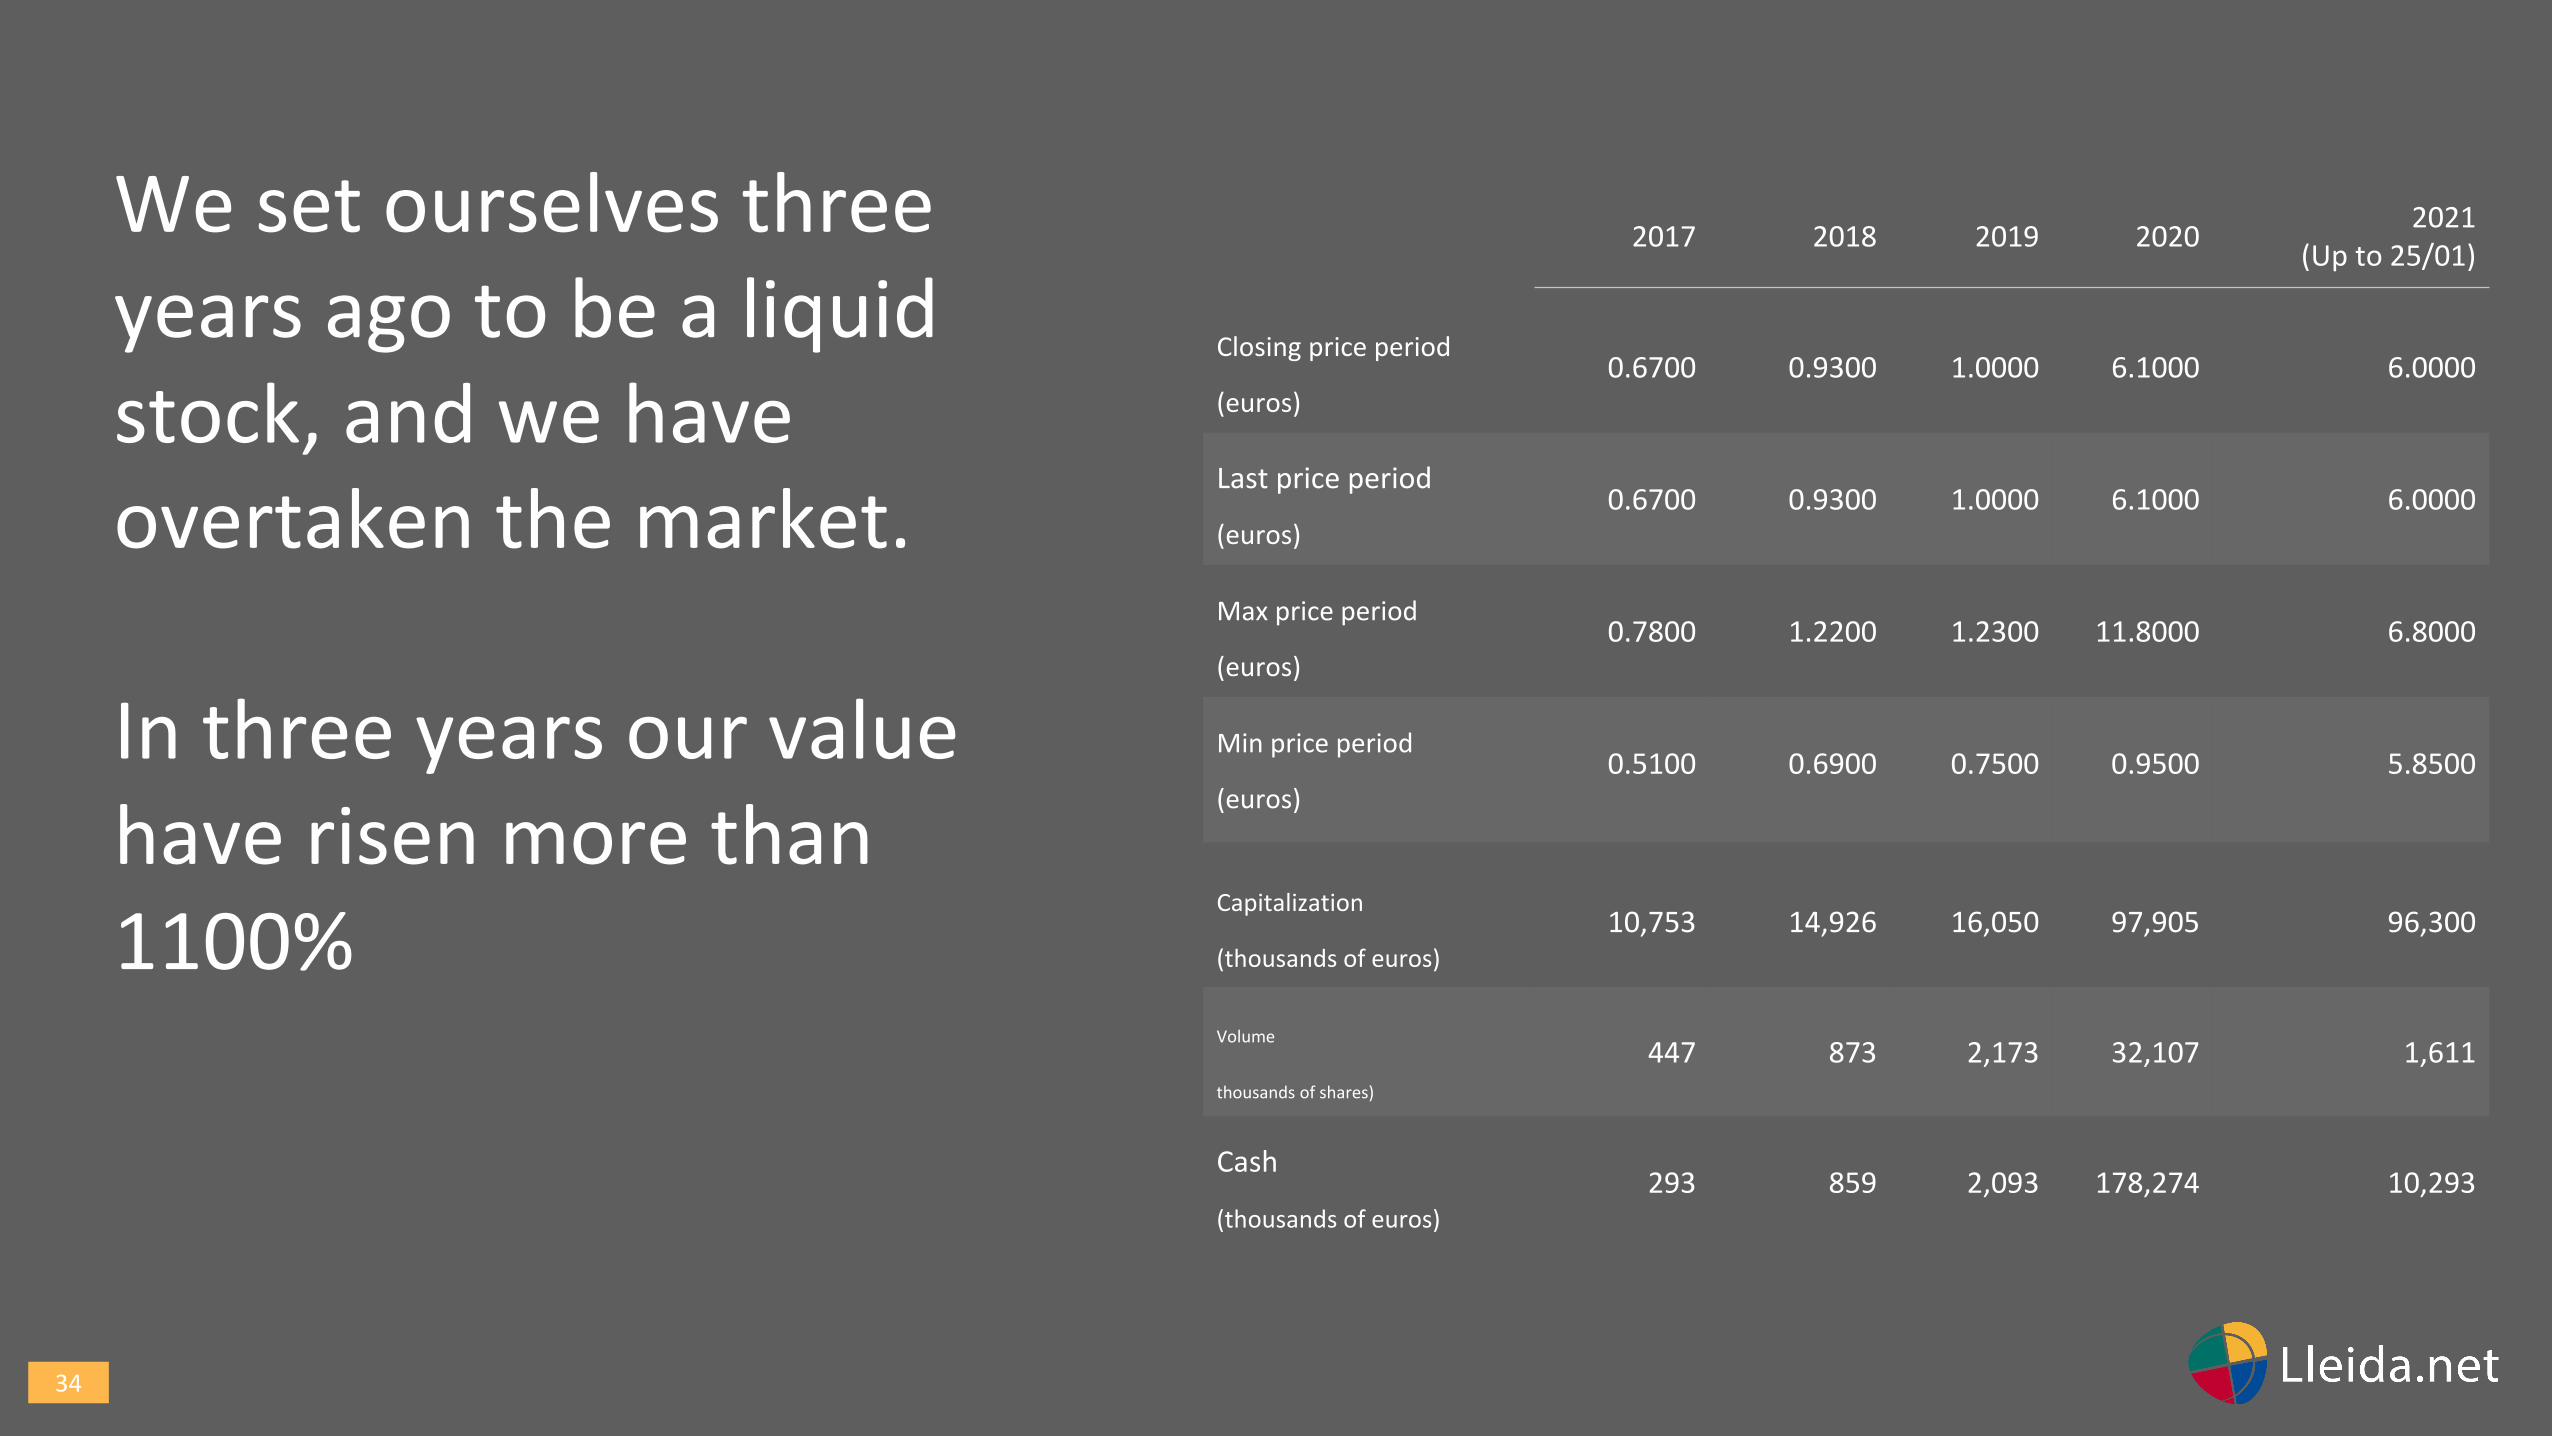
2017 2018 2019 20202021
(Up to 25/01)
Closing price period
(euros)0.6700 0.9300 1.0000 6.1000 6.0000
Last price period
(euros)0.6700 0.9300 1.0000 6.1000 6.0000
Max price period
(euros)0.7800 1.2200 1.2300 11.8000 6.8000
Min price period
(euros)0.5100 0.6900 0.7500 0.9500 5.8500
Capitalization
(thousands of euros)
10,753 14,926 16,050 97,905 96,300
Volume
thousands of shares)
447 873 2,173 32,107 1,611
Cash
(thousands of euros)
293 859 2,093 178,274 10,293
We set ourselves three years ago to be a liquid stock, and we have overtaken the market.
In three years our value have risen more than 1100%
35

36
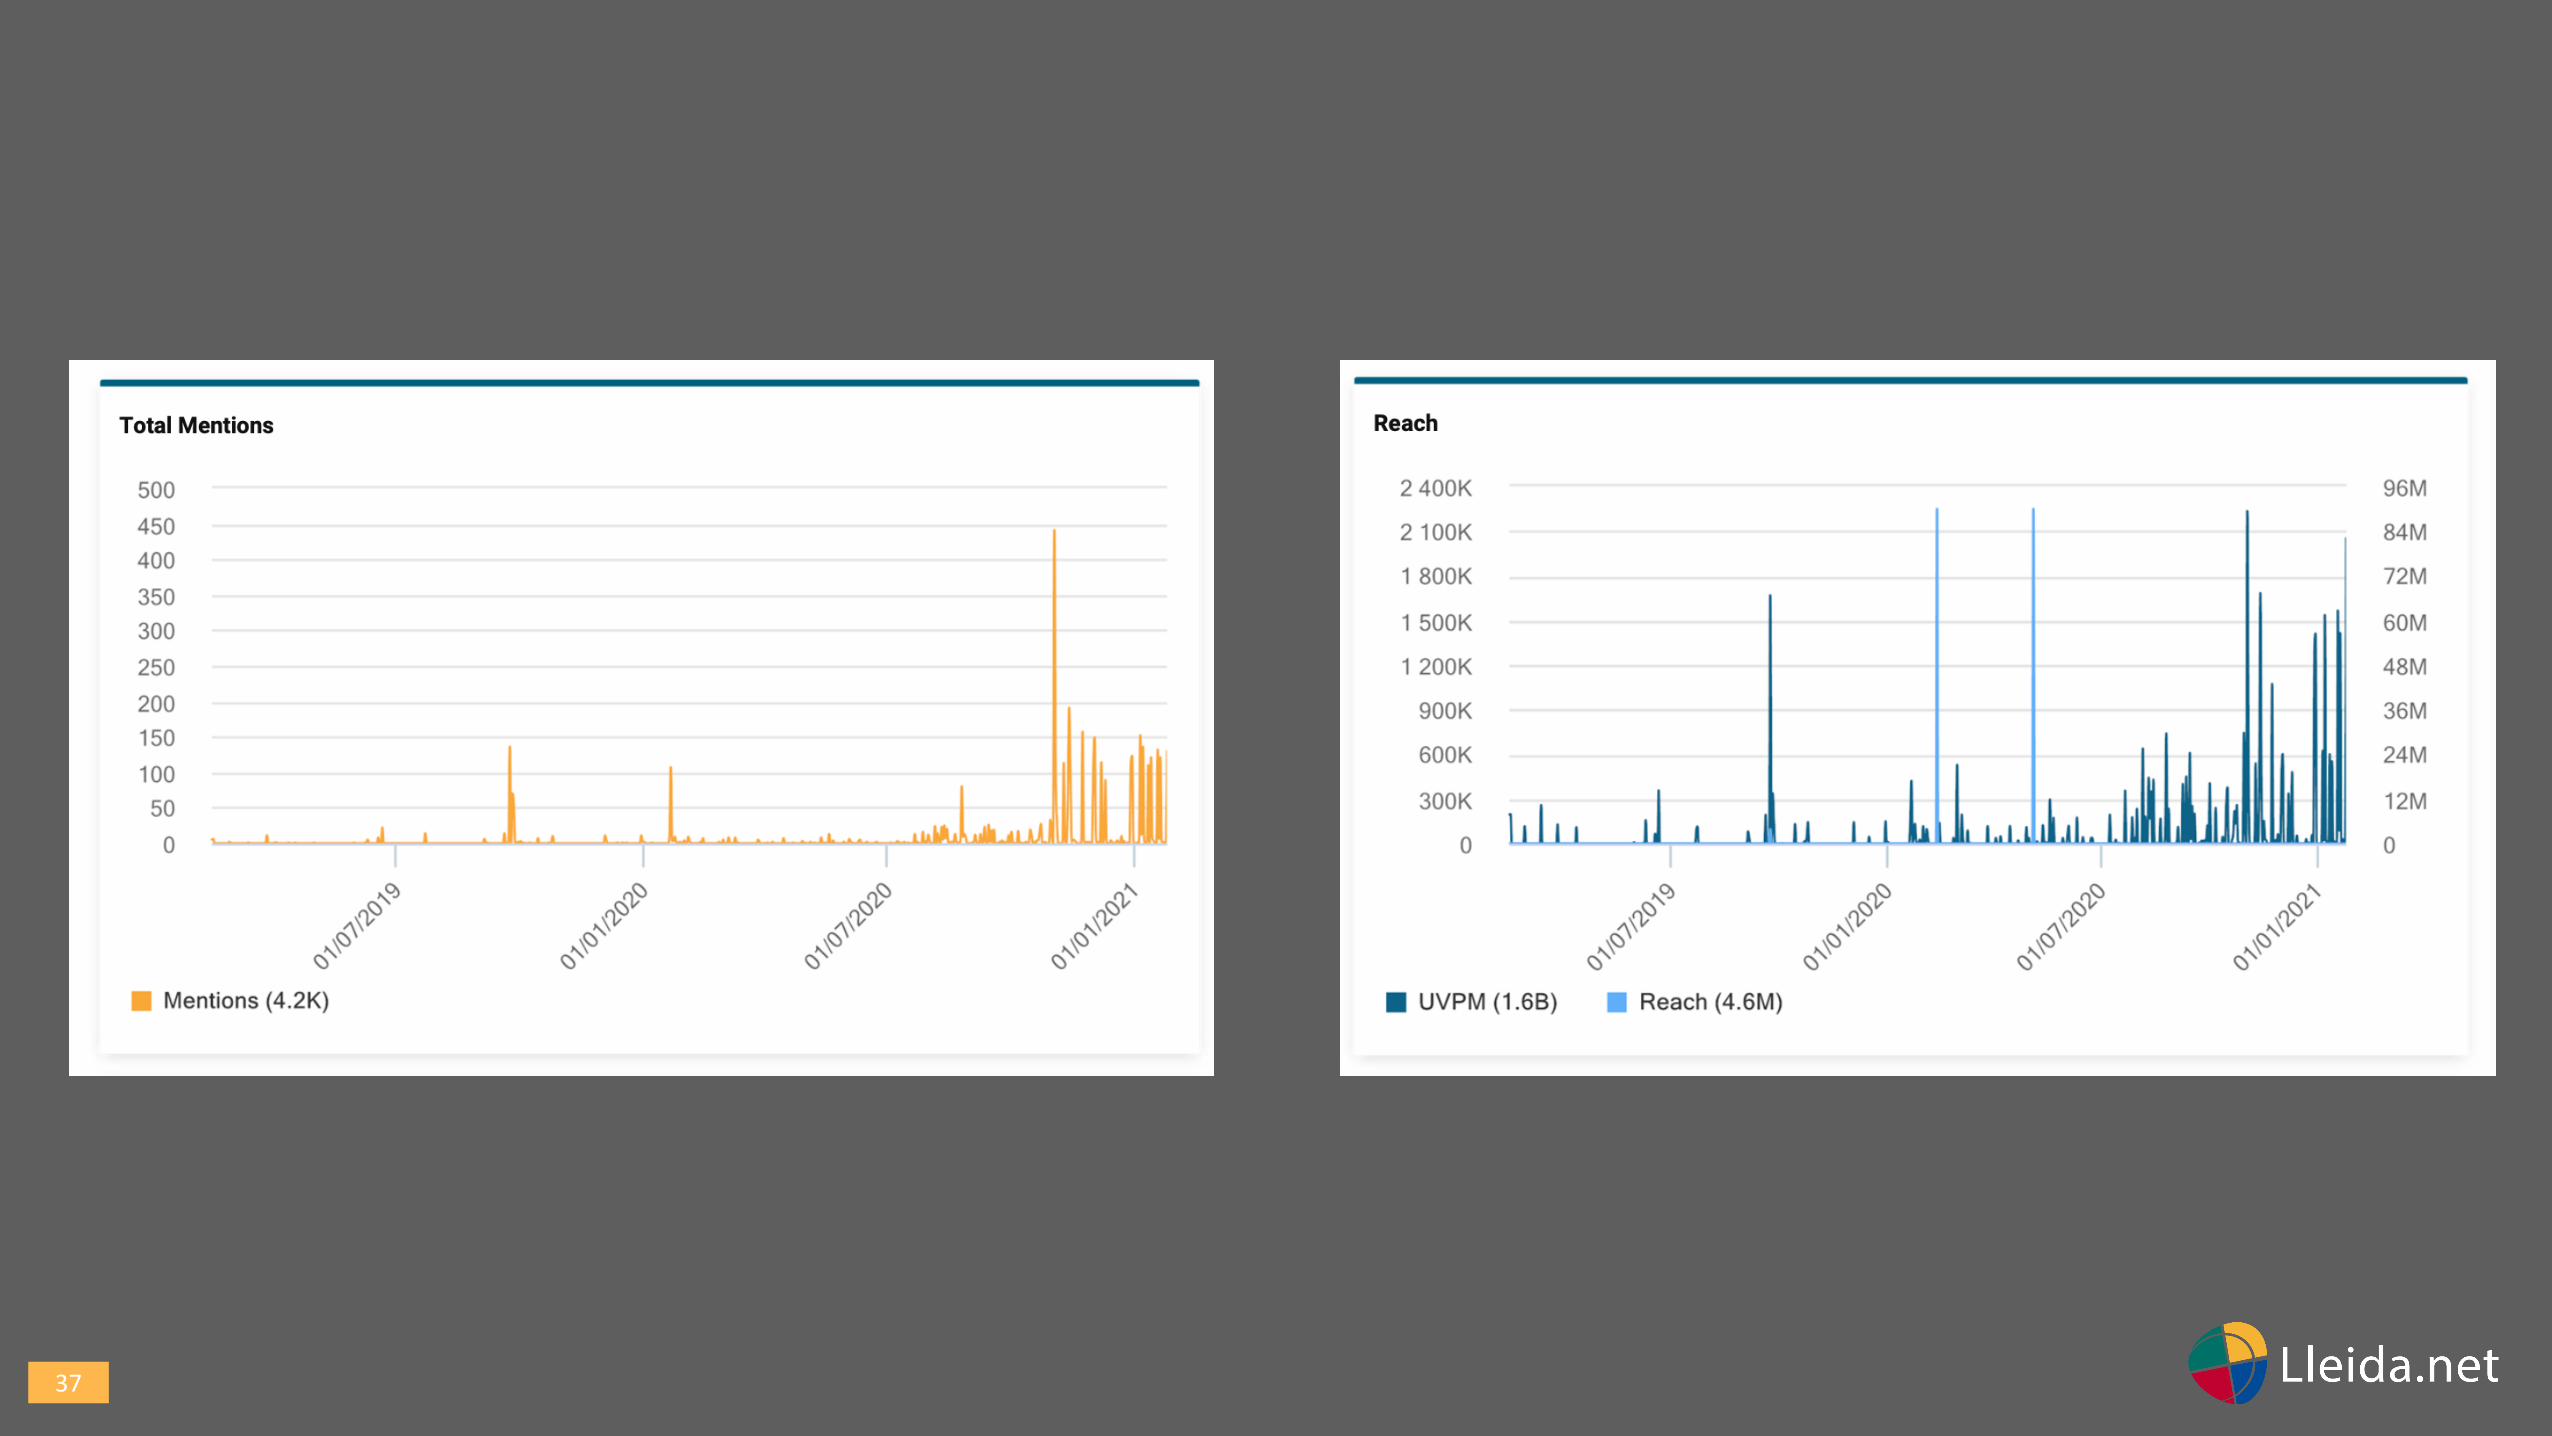
WE ALREADY HAVE A MEDIA PRESENCE AND A
GLOBAL BRAND
37
38
Algeria
Andorra
Argentina
Australia
Austria
Bolivia
Brazil
Canada
Chile
China
Colombia
Costa Rica
Cuba
Dominican Republic
Ecuador
Egypt
El Salvador
France
Germany
Ghana
Guatemala
Honduras
Hong Kong
India
Indonesia
Iran
Israel
Switzerland
Taiwan
Uganda
Ukraine
United Arab Emirates
United Kingdom
United States
Uruguay
Venezuela
Vietnam
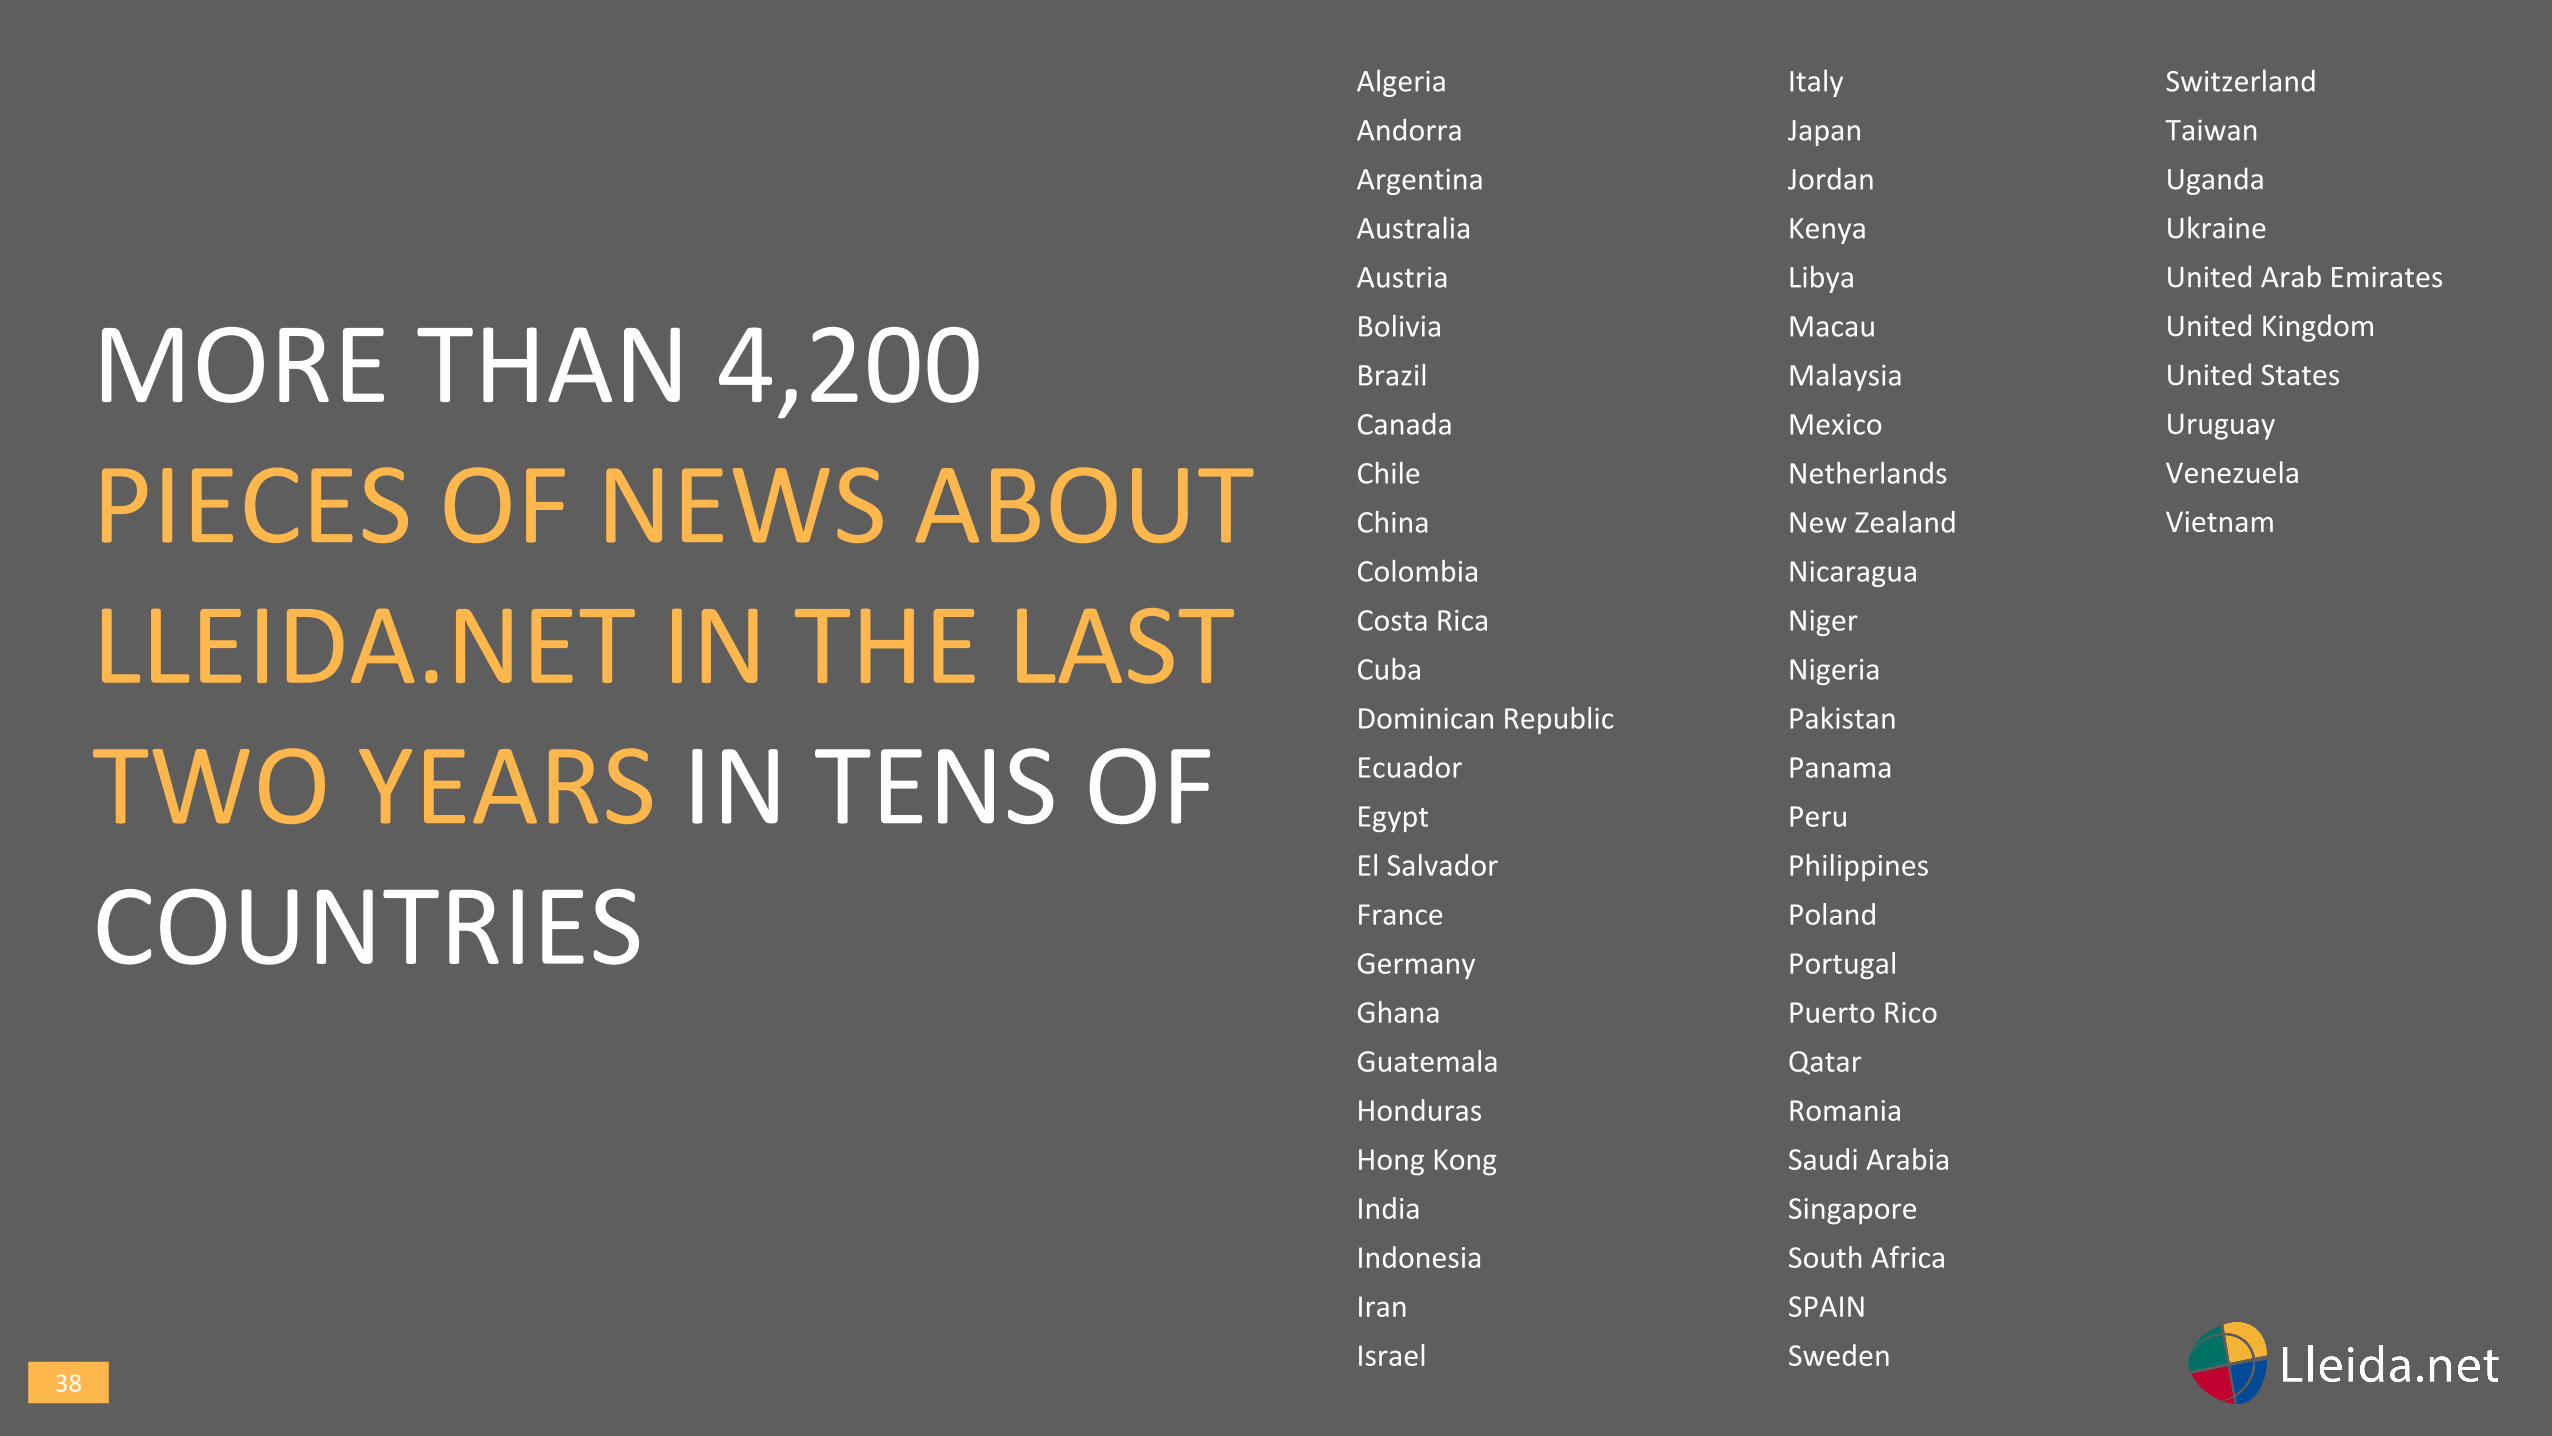
MORE THAN 4,200PIECES OF NEWS ABOUT LLEIDA.NET IN THE LAST TWO YEARS IN TENS OF COUNTRIES
Italy
Japan
Jordan
Kenya
Libya
Macau
Malaysia
Mexico
Netherlands
New Zealand
Nicaragua
Niger
Nigeria
Pakistan
Panama
Peru
Philippines
Poland
Portugal
Puerto Rico
Qatar
Romania
Saudi Arabia
Singapore
South Africa
SPAIN
Sweden
39
THE FUTURE
40
OUR STRATEGY CONSISTS OF CONTINUING WORKING OUR FUNDAMENTALS TO GUARANTEE FUTURE RETURNS TO
SHAREHOLDERS.IT’S THAT SIMPLE .
Lleida · Madrid · London · Miami · Paris · Santiago de Chile · Bogotá · São Paulo · Tokyo · Santo Domingo · Cape Town Montevideo · Johannesburg ·
San José · Lima · Beirut · Dubai · Ciudad de México · Gaborone
investors.lleida.net