5. electronics - ijece - electronic waste concerns of mobiles in jharkhand - umesh kumar (1)
TRANSCRIPT

www.iaset.us edi [email protected]
ELECTRONIC WASTE: CONCERNS OF MOBILES IN JHARKHAND
UMES H KUMAR1 & D N S INGH
2
1Elcetronics & Communication Engineering, Department of Science & Technology, Jharkhand, GWP Ranchi,
Tharpakhana, Ranchi, India
2Joint Secretary, Department of Science & Technology, Bihar, SBTE, Patna, India
ABSTRACT
Technological advancement leads to growth which leads to further expectations and this trend goes unabated till
an optimal / sustainable growth pattern is thought off and achieved. Advancement is a two sided sword which leads to
achievement and pushes to concerns also. Growth of communicat ion and electronic industry is very suitable example for
this. Rapid modernization has lead to environmental degradation which has given birth to multiple threats. As unique
opportunity and threats perception can be visualized in case of mobiles also. It has eased the life but has posed problems
also. Starting from e waste concerns, regulatory measures, depletion of precious & rare materials, increase in toxicity &
harardness, socio economic to cultural evasion can be seen. The instrument hardly weighing 80 to 100 gm has mult iple
aspects. The constituent’s recovery, reuse, recycling provisions and awareness regarding these are major areas which have
to be highlighted and thought about. Strict adherence from user side for preservation of materials , modificat ion, concerns
regarding EPR, take back recycling, reuse and proper disposal mechanism development has to be adequately addressed by
the producers. The role of regulatory agencies is very important, enactment and enforcement of available legislative and
regulatory measures can result in better environment & sustained development.
In all one can say that recovery of around 90 % material can be achieved from ext raction from the wastes
resulting in lessening in use of virgin materials for production. Lessening of e waste generation is the best policy for
reduction of e waste and this can be achieved by awareness. Best tool for effective and sustained e waste management is to
create awareness, frame requisite policy, sustainable model development and proper implementation of this model.
The creation of awareness may need to include topics in the curricula of professions courses.
KEYWORDS: Coverage, Extraction, Hazards, Mobiles, Residuals, Technology, Tele Density, Waste Generation
INTRODUCTION
The recent past has witnessed revolutionary growth and upsurge in technology in the arena of Electrical
Electronic Equipments (EEE) in general and computer and communicat ion in part icular. After the globalization effect in
India, India has emerged as global leader in the In formation Communication Technology (ICT). Growth of communicat ion
and players involved has been unprecedented to mark country as telecom leader in the world. Population, increase in
purchasing power, reach to technology, technological advancement and requirement has lead to revolutionize the masses.
Indian governmental approach, init iatives, policies, dedication, efforts to match and provide best to its natives has lead to
the communication revolution. The fastest growing and least life of p roduct with launch of everyday new features and
provision has lead to situation where mobile has particularly become the fastest growing concerns of the contributors of the
electronic wastes (e waste). “E-waste” is attributed to generic term which encompasses the diversified forms of EEE ,
International Journal of Electronics and
Communication Engineering (IJECE)
ISSN(P): 2278-9901; ISSN(E): 2278-991X
Vol. 3, Issue 3, May 2014, 39-54 © IAS ET

40 Umesh Kumar & D N Singh
Impact Factor (JCC): 3.2029 Index Copernicus Value (ICV): 3.0
electronic appliances which has attained to a situation where these are no longer useful and have lost their value and are old
attaining end-of life (EoL) to be classified to have ceased to be of any value to their owners (UNEP Report, 2007). The
diverse composition of e waste attracting numerous products and more than 1000 hazardous and non hazardous substances
(wath et al 2010) makes it more vurnable. The hazardous and non hazardous substances range from elemental to metals to
manmade substances.
Collection and treatment i.e. proper d isposal of e waste is really a problem and as a solution the extended
producers responsibility where they themselves take back or get it collected by authorized agencies come in ro le.
This approach awareness and availability has to be verified and it effect iveness has to be judged. The depletion of materials
or constituents is another burning issue. Materials present on/in earth have limited volumes and its preservation in terms of
reuse and extraction from disposable items is also a challenge.
In case of large number o f mobiles which have very little amounts in individuals, amounts to large volumes and
weight when we see it in terms of millions available in and around us. Thus the stock of situation and experimentally
verify ing the easy means of extraction of valuables from wastes is of utmost importance. Keeping these factors in mind the
present work of ext raction and field study becomes important and valuable.
E-WASTE IN INDIA
Global statistics of waste put by MAIT, UNEP, Greenpeace reports and other articles states that India produces
380000 tons of e wash 800000 tones by 2012. The UNEP 2010 report mentions that it will grow 500 % by 2020. E waste
constitutes 1-2 % of total waste being generated. As per Govt. of India (GOI) “E-Waste (Management & Handling Rules),
2011, E waste means waste coming out of electrical and electronic equipment, whole or in part or rejects from their
manufacturing and repair process, which are intended to be discarded. MAIT Executive Director in his report fo recasted
that in the same period e waste from mobile will grow 18 times in India because of availability, accessibility, demographic
advantages and increased use.
DETAILS OF MOBILES AND ITS CONTRIBUTION IN E WASTE
It is clear that the mobile / cell phone is one of the major contributors for the changes EEE and as a victim of
rapidly changing technology is the prime contributor of the most volatile product popularly getting its reach to and all in
the countries, state, cities and rural areas.
The penetration is major but the penetration in rural areas is also no lesser. The teledensity in the overall, in rural
and urban sector tells the story of the development. The states had their own pace of modernizat ion and increase in
teledensity.
The relatively backward states which showed low teledensity continued to remain so but the development is static
and even by increasing at no less speed than the so called forward or so called developed states. The details of mobile as
per its metallic constituents, which ranger over 50 metals, can be viewed as in figure 1. Percentage wise major materials
used in mobiles has been depicted in figure 2 and the compositional d ifference between materials with considerations of
toxicity of materials and its hazardness from the early mobile inception to current use of technology has been shown in
figure 3.

Electronic Waste: Concerns of Mobiles in Jharkhand 41
www.iaset.us edi [email protected]
Figure 1: A Typical Nokia Model Sketch
Figure shows a typical mobile set sketch. It displays possible substances constituents in it. The items can be put in
various ranges i.e. some of the substances are valuables ones, some are of concern and some are highly toxic in nature and
while disposal they need to be cared a lot. The valuables are to be extracted and preserved.
Figure 2
Figure 2 shows typical views of disassembled mobile sets in different conditions. These are of commonly
available mobile sets in market.
Table 1
Mobile Material Constituents Mobile % of Materials
Plastic 45
Metals 35
glass & ceramics 10
Batteries & electrodes 9
precious metals 0.11
Others 0.9
Table 1 shows a composition wise breakup (Nokia 2011a) of general mobile sets. The use of plastic, glass,
ceramics, batteries are of great concern when these become e waste. Metals are one which needs to be segregated or
extracted when these are to be disposed off. Batteries are the major sources of hazardness and EPR is highly applicable
area in h is case

42 Umesh Kumar & D N Singh
Impact Factor (JCC): 3.2029 Index Copernicus Value (ICV): 3.0
Figure 3
The above figure 3 shows a graphical reprsentation of different materials used in a common mobiles
Table 2
Material Difference in Composition
from 1999 to 2003 (in % )
% of Total Material
in Mobile
Glass 100 10.59
Plastic 113.8 59.6
Liquid crystal 133.3 0.2
Ag 40.9 0.24
Al 48.2 2.9
As 100 0.001
Au 74.3 0.038
Be 66.4 0.003
Bi 15.9 0.03
Br 100 0.94
Cd 200
Cl 200.2 0.006
Cr 181.7 0.035
Cu 69 14.24
Fe 106.2 8.04
Ni 77.9 1.12
Pb 116 0.31
Pd 78 0.02
Pt/Ta 149.7 0.01
Sb 91.5 0.1
Sn 77.3 0.69
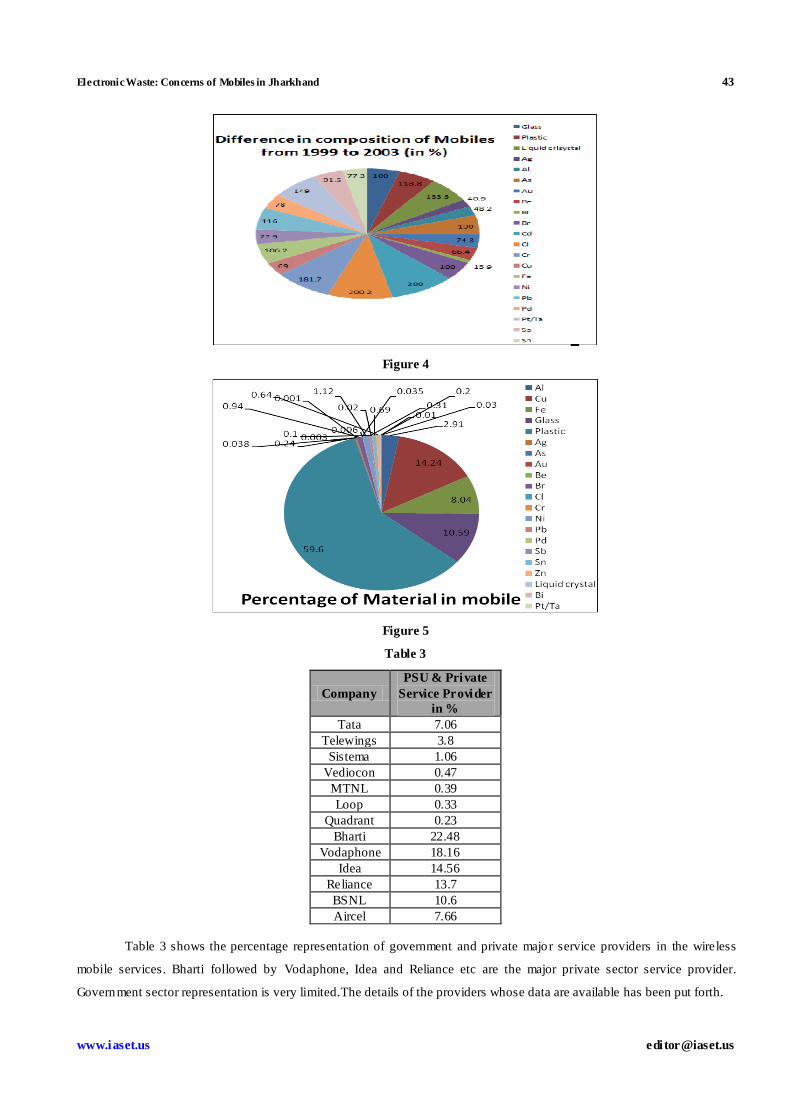
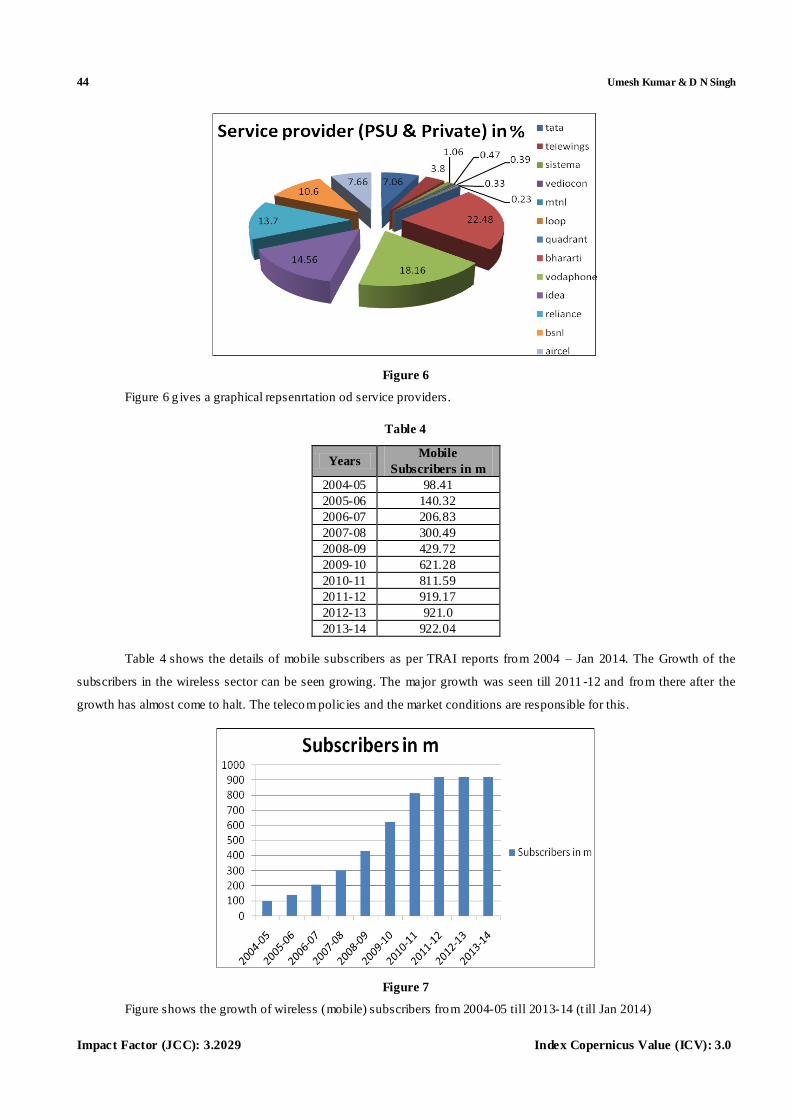
Table 2 shows details of different materials used pre 1999 to post 2003 (TUDelft, 2004) with advancement in
technology and concerns about the disposals and toxicity vis -a-vis hazadness of the residues which is left out in the formal
or informal d isposal. The constituents in terms of substances used in manufacturing of mobile sets are also outlined here.
Figure 4 and 5 shows the pie chart representation of these. One can clearly see that to the extent of 70 % plastic and glass
are used where as the copper and iron as metals constitutes 22.28 % i.e. the major share in substances. The rare, hazardous
and precious metals are present in very small amount and volume in the mobiles
Electronic Waste: Concerns of Mobiles in Jharkhand 43
www.iaset.us edi [email protected]
Figure 4
Figure 5
Table 3
Company
PSU & Private
Service Provider
in %
Tata 7.06
Telewings 3.8
Sistema 1.06
Vediocon 0.47
MTNL 0.39
Loop 0.33
Quadrant 0.23
Bharti 22.48
Vodaphone 18.16
Idea 14.56
Reliance 13.7
BSNL 10.6
Aircel 7.66
Table 3 shows the percentage representation of government and private major service providers in the wireless
mobile services. Bharti followed by Vodaphone, Idea and Reliance etc are the major private sector service provider.
Government sector representation is very limited.The details of the providers whose data are available has been put forth.
44 Umesh Kumar & D N Singh
Impact Factor (JCC): 3.2029 Index Copernicus Value (ICV): 3.0
Figure 6
Figure 6 g ives a graphical repsenrtation od service providers.
Table 4
Years Mobile
Subscribers in m
2004-05 98.41
2005-06 140.32
2006-07 206.83
2007-08 300.49
2008-09 429.72
2009-10 621.28
2010-11 811.59
2011-12 919.17
2012-13 921.0
2013-14 922.04
Table 4 shows the details of mobile subscribers as per TRAI reports from 2004 – Jan 2014. The Growth of the
subscribers in the wireless sector can be seen growing. The major growth was seen till 2011 -12 and from there after the
growth has almost come to halt. The telecom policies and the market conditions are responsible for this.
Figure 7
Figure shows the growth of wireless (mobile) subscribers from 2004-05 till 2013-14 (t ill Jan 2014)

Electronic Waste: Concerns of Mobiles in Jharkhand 45
www.iaset.us edi [email protected]
Table 5
Years Teledensity Teledensity Bihar
& Jharkhand
2004-05 9.08
2005-06 12.86
2006-07 18.23
2007-08 26.22
2008-09 36.98
2009-10 52.74
2010-11 70.89
2011-12 78.66 46.53
2012-13 76
2013-14 74.5 45.06
As per TRAI (Telecom Regulatory Authority of India) Growth of overall (i.e. wireless and wired) telecom
services and availability can be well shown in terms of teledensity. The steady increase in teledensity can be witnessed till
2011-12. The figures from 2011-12 till 2013-14 till Jan 2014 can be seen as decreasing. This is main ly because o f
surrendering/returning of landlines due to dissatisfaction and saturation of subscriber’s mood in wireless sector.
The subscribers which had multip le connections became causes and surrendered the sets. The tariffs are saw some rise and
users decreased.
Figure 8
Figure 8 shows the representation of over all teledensity in India as per TRAI reports
Table 6
Year GS M Million
Subscriber
CDMA Million
Subscriber
Total Million
Subscriber
2004-05 41.07 11.15 62.22
2005-06 69.19 20.95 90.14
2006-07 120.47 44.64 165.11
2007-08 192.7 88.37 261.07
2008-09 297.26 94.5 391.76
2009-10 498.68 106.64 584.32
The wireless communicat ion mainly comprises of the GSM or CDMA technologies. The popularity of GSM over
CDMA is well evident from the figures available from the data of TRAI reports. The growth rate of subscribers are almost
same for the two despite of the fact that the CDMA is bit costlier compared to GSM. The steady growth and details for all
facts have been graphically represented in figure 9.
46 Umesh Kumar & D N Singh
Impact Factor (JCC): 3.2029 Index Copernicus Value (ICV): 3.0
Figure 9
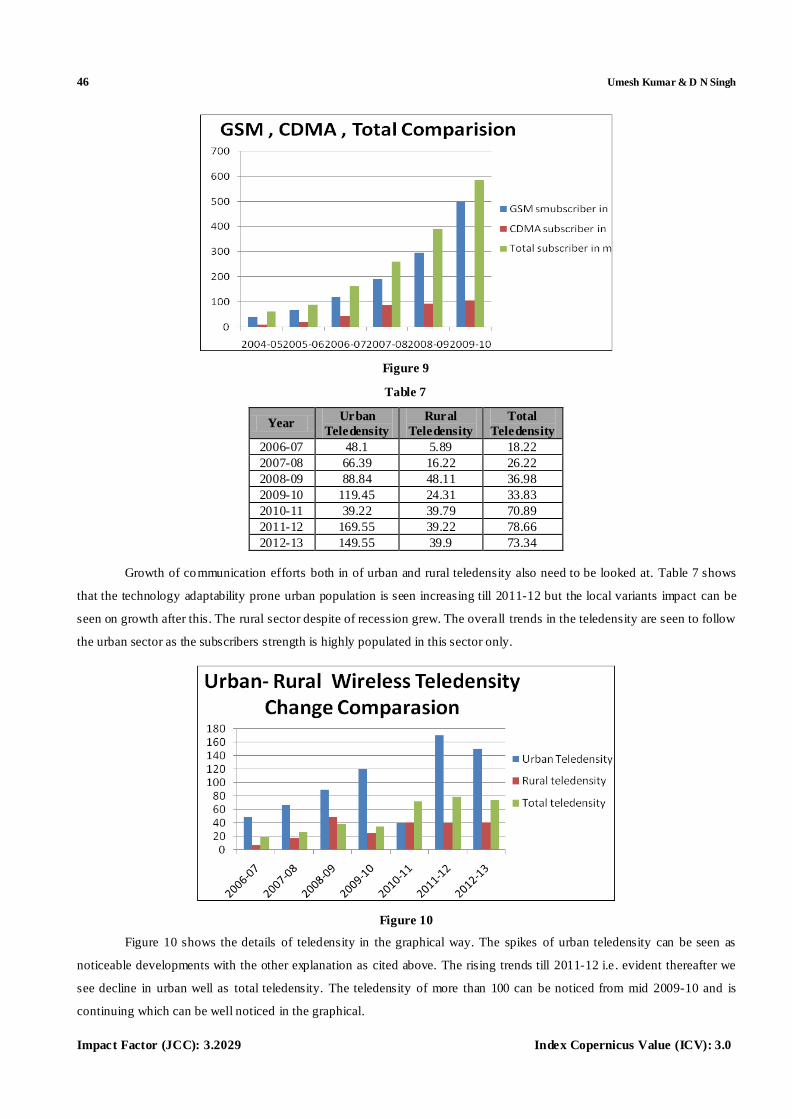
Table 7
Year Urban
Teledensity
Rural
Teledensity
Total
Teledensity
2006-07 48.1 5.89 18.22
2007-08 66.39 16.22 26.22
2008-09 88.84 48.11 36.98
2009-10 119.45 24.31 33.83
2010-11 39.22 39.79 70.89
2011-12 169.55 39.22 78.66
2012-13 149.55 39.9 73.34
Growth of communication efforts both in of urban and rural teledensity also need to be looked at. Table 7 shows
that the technology adaptability prone urban population is seen increasing till 2011-12 but the local variants impact can be
seen on growth after this. The rural sector despite of recession grew. The overall trends in the teledensity are seen to follow
the urban sector as the subscribers strength is highly populated in this sector only.
Figure 10
Figure 10 shows the details of teledensity in the graphical way. The spikes of urban teledensity can be seen as
noticeable developments with the other explanation as cited above. The rising trends till 2011-12 i.e . evident thereafter we
see decline in urban well as total teledensity. The teledensity of more than 100 can be noticed from mid 2009-10 and is
continuing which can be well noticed in the graphical.

Electronic Waste: Concerns of Mobiles in Jharkhand 47
www.iaset.us edi [email protected]
STUDY OF MOBILE SCENARIO
The TRAI reports does not have exclusive authentic report on Jharkhand state. In addition with Bihar it is reported
to have relatively low teledensity. The state of Bihar and Jharkhand are well known for their backwardness and poverty
which results in ill remaining communicated i.e. having lesser teledensity. With time variation it has grown and with the
rate declin ing trend of decrease in this case also can be witnessed. Thus we see that the survey for mobile services in all
aspects are to be determined. Other major concern is the extract ion of metals and materials also. To meet both ends we
have gone for detailed study of both types.
These are once the mobiles are to be disposed these need to be dismantled and after dis mantling of mobiles the
recovery of metals is evaluated.
Field survey cum door to door approach for collection of data regarding various aspects on the developed
questioners were taken up.
Study on Extraction of Materials
In order to get the preposition of major valuable metals in mobiles of different types were collected and batteries
were removed. Disassembly and seperation of movable parts were done followed by dis mantling, crushing of the Printed
Circuit Board (PCB). The flow chart in the figure 11 shows the total process carried out for extraction of metals. The
processing carried out mainly consisted of acid leaching followed by purificat ion of leached solution for removal of
impurities. By electro refin ing process and chemical reduction the metals were extracted from the solution. The findings
were obtained and results thus obtained were compared to the reported results . It was observed that the extract ion
confirmed to the reported results with slight variat ion.
Figure 11: Flow Chart for Extraction of Metals from PCBs of Mobile Phones
Door to Door Survey Study
In order to get the details of survey for the EPR and conditionality of the Mobiles questioner was prepared and
circulated in the major cities namely Ranchi, Jamshedpur, Dhanbad, Dumka, Bokaro, Daltongang, Hazaribagh and
Chaibasa of Jharkhand state. The questioners were mailed to certain known persons also for collection of data.
Total of 100 questioners equally making four groups distributing among demographical and economical background were
distributed in the eight cities and 200 questioners were dispatched by post and e mail. The total sample size thus was
800+200 making total of 1000. The various statistical methods were employed to get the desired observations which have
been summarized in the following sections.

48 Umesh Kumar & D N Singh
Impact Factor (JCC): 3.2029 Index Copernicus Value (ICV): 3.0
DATA AND ANALYSIS
Extraction of Materials
From the determination of extract ion of metals three trials were done and the results obtained were as follows:
Table 8
Sl Metals Recovered in Trial I Trial II Trial III Average
1 Copper in mg 8492 8476 8412 8460
2 Aluminum in mg 7316 7125 6971 7137.33
3 Cobalt in mg 3623 3912 3487 3674
4 Silver in mg 238 219 248 235
5 Gold in mg 21 19 22 20.67
6 Lead in mg 2374 2164 2271 2269.67
7 Pd in mg 7.4 7.8 6.9 7.367
Figure 12
Results show the high content of copper, aluminum, cobalt, lead, silver gold and Pd are in conformity of the
results obtained by the other research papers published in this area which mentions in the per 1000 kg of PCB of the
mobiles which when converted comes to the figures nearer. Log scale has been preferred to get a better view of variation.
Absolute values would not show results of silver, gold and Pd in linear scales as the amounts is very small.
Field Survey
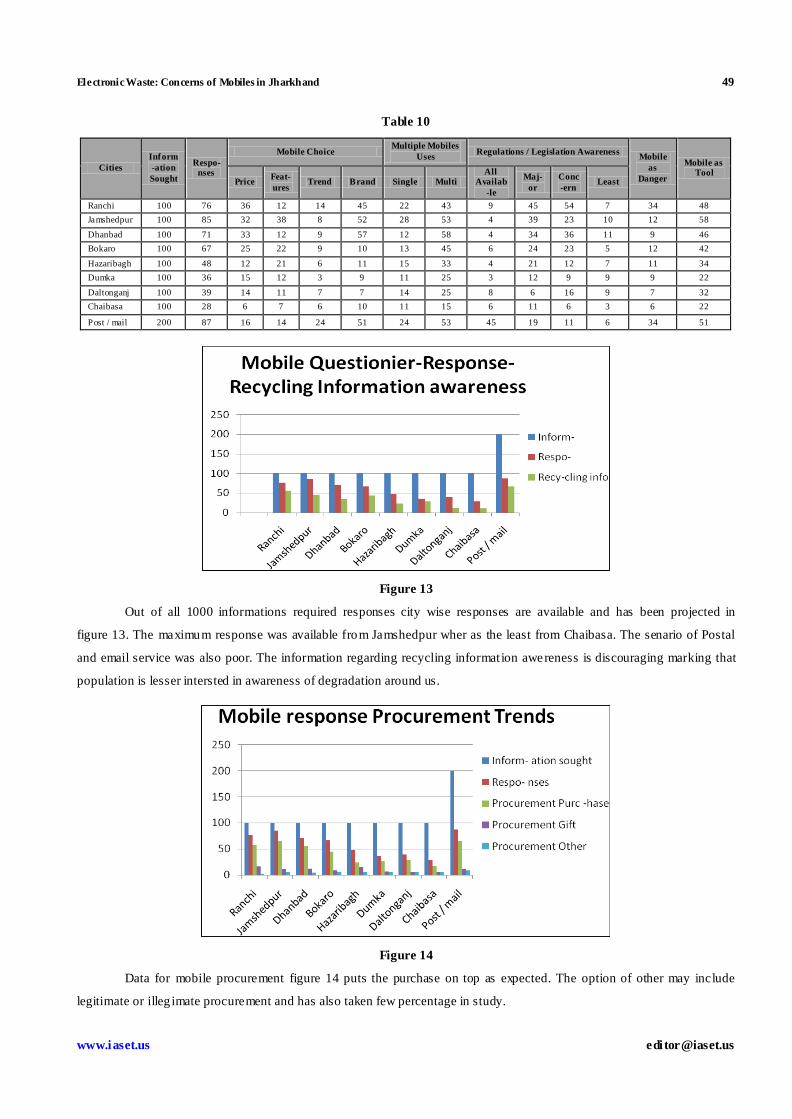
Data for the survey of the various aspects regarding mobiles are placed in table 9 and table 10 which are as
follows
Table 9
Cities Inform-
ation
Sought
Respo-
Nses
Procurement Recy-cling
Info
Disposal Trend Mobile Awareness Mobile Change
Purc -hase
Gif t Other 1 2 3 4 EPR Back
Aware e Waste
Toxicity Aware
A B C
Ranchi 100 76 58 16 2 56 34 26 10 6 19 28 3 25 32 12
Jamshedpur 100 85 65 11 6 45 45 21 5 3 23 56 7 21 19 29
Dhanbad 100 71 56 12 4 34 45 9 4 6 16 45 11 45 11 16
Bokaro 100 67 45 9 6 43 34 21 6 2 18 47 8 45 6 12
Hazaribagh 100 48 24 15 6 23 34 6 2 4 8 11 10 19 12 16
Dumka 100 36 26 7 5 29 21 9 1 4 4 11 2 15 11 17
Daltonganj 100 39 28 5 5 12 25 12 1 5 3 21 11 21 5 12
Chaibasa 100 28 17 6 5 11 21 4 1 2 4 12 16 14 8 6
Post / mail 200 87 65 11 9 67 34 23 11 7 45 41 47 43 16 23
Dis posal Trend: 1.Throw, 2. Leave in house, 3. to collection centre, 4. Gift to some one
Mobile Change: A in year, B when becomes non working, C Frequent
Electronic Waste: Concerns of Mobiles in Jharkhand 49
www.iaset.us edi [email protected]
Table 10
Cities
Inform
-ation
Sought
Respo-nses
Mobile Choice Multiple Mobiles
Uses Regulations / Legislation Awareness
Mobile
as
Danger
Mobile as Tool
Price Feat-
ures Trend Brand Single Multi
All Availab
-le
Maj-
or
Conc
-ern Least
Ranchi 100 76 36 12 14 45 22 43 9 45 54 7 34 48
Jamshedpur 100 85 32 38 8 52 28 53 4 39 23 10 12 58
Dhanbad 100 71 33 12 9 57 12 58 4 34 36 11 9 46
Bokaro 100 67 25 22 9 10 13 45 6 24 23 5 12 42
Hazaribagh 100 48 12 21 6 11 15 33 4 21 12 7 11 34
Dumka 100 36 15 12 3 9 11 25 3 12 9 9 9 22
Daltonganj 100 39 14 11 7 7 14 25 8 6 16 9 7 32
Chaibasa 100 28 6 7 6 10 11 15 6 11 6 3 6 22
Post / mail 200 87 16 14 24 51 24 53 45 19 11 6 34 51
Figure 13
Out of all 1000 informations required responses city wise responses are available and has been projected in
figure 13. The maximum response was available from Jamshedpur wher as the least from Chaibasa. The senario of Postal
and email service was also poor. The information regarding recycling informat ion awereness is discouraging marking that
population is lesser intersted in awareness of degradation around us.
Figure 14
Data for mobile procurement figure 14 puts the purchase on top as expected. The option of other may include
legitimate or illeg imate procurement and has also taken few percentage in study.

50 Umesh Kumar & D N Singh
Impact Factor (JCC): 3.2029 Index Copernicus Value (ICV): 3.0
Figure 15
Figure 15 shows the disposal trend after EOL of mobile set or otherwise. Population is not aware of collection
centres hence a larger section is left with no other option than to discard the mobile in house itself. Some persons are smart
to pass on it to others as gift also.
Figure 16
Figure 16 shows the mndset of users regarding EPR, e waste generation and threats. Awareness regarding waste is
high but in relatively high industrial cities less knowledge about hazards is noticable. The elite class of email is
understandbly alert and aware of all the options. Awareness regarding EPR and buy back options is required for proper
disposal and handling ill effects of hazards arising out of this.
Figure 17

Electronic Waste: Concerns of Mobiles in Jharkhand 51
www.iaset.us edi [email protected]
Purchasing capacity, industrial mind set of use and throw is well observed in a noticeable section. Maintaining
mobiles for year of more is evident in relatively less industrial developed cities. The industrial growth reflects in the
changes of gadgets also. These facts are observed from the depictions in the figure 17 which relates the mobile change
trend. It testifies and justifies the industrial psychology and management theories.
Figure 18
Throughout as per figure 18 it is evident that brand plays important role in purchase of any item. It is the goodwill
which creates market. Features and prices are secondary to this. Observed data shows that the importance to some
regarding money, to some regarding getting maximum in features can be witnes sed.
Figure 19
Newer trend of having multip le SIM or mobile as evident in figure 19 is popular these days. Affordability and
trust breach are the two opposing factors mainly play ro le in this. The increase in per capita income is mainly responsible
for this.

52 Umesh Kumar & D N Singh
Impact Factor (JCC): 3.2029 Index Copernicus Value (ICV): 3.0
Figure 20
Users perception regarding mobile as a danger or tool was also surveied. Anger here is of becoming vict im and
tool is for relief from situation. General mind set is for the tool option. Hoever a section , though smaller maintains that it is
a danger also. He trend is well seen in figure 20.
Figure 21
Figure 21 give brief of how users are aware of the rgulatory and legislative measures. Majority has less to do with
these. Use and throw is the general tendency. Sizable users in elite cities only are aware of these levaing rest ignorant of
these. The major EPR or buy back in itiat ive battries act is known to users.
CONCLUSIONS
The paper gives a stock of impact of communicat ion leader of world i.e . India, its growing and expanding
impacts. The increasing size and growth of population of mobiles and tendency of frequently changing and doing away
with the existing mobiles gives rise to waste mobiles. The tiny set has full valuable resource at one end and hazardness and
toxicity at other end. The content and valuation of the extractable materials when amounted for the millions and billions of
sets comes to several thousand tones en case of gold, silver etc valuable materials. The disposable waste if properly
collected and recycled, reused and dismantled and segregation / extraction of valuable substances will lead to resource
preservation and resource generation. In all one can say that recovery of around 90 % material can be achieved from
Electronic Waste: Concerns of Mobiles in Jharkhand 53
www.iaset.us edi [email protected]
extraction from the wastes resulting in lessening in use of v irgin materials for production. The properly technological
disposal will ease out the alarming situation of hazardness and toxicity which otherwise will pollute the environment.
Lessening of e waste generation is the best policy for reduction of e waste and this can be achieved by awareness. The
situation of creation of awareness and knowhow of the regulations and legislative measures can further make human kind
friendlier to environment. Opening of collection centre and making these known to commoners with provision of take-back
and EPR aims will help in combating the menace. Best tool for effective and sustained e waste management is to create
awareness, frame requisite policy, sustainable model development and proper implementation of this model. The tendency
of having multip le mobiles may increase teledensity on papers but reach to connecting population will be left behind.
Strictness to managing population to retain mobiles for longer with the existing mobiles can also lead to lessening of waste
contribution from this end.
Last but not least creation of awareness and effective e waste management in general may need to include topics
in the curricu la of professions courses for saving mankind and provide the coming generation a sustained place to live in
with resources and dignity in safer world.
REFERENCES
1. UNEP (2007): United Nations Environment Programme E-Waste Assessment Manual Voilet Pinto, “E-waste
Hazard: The impending challenge”, Review art icle availab le http://www,oejm.com, November 7,2008
2. UNEP (2007), Vol II E Waste management Manual available atwww.UNEP.or.jp/ietc/Publicat ions/ SPC/ Ewaste
Manual_ Vol II pdf.
3. Wath, et al “A Roadmap for Development of Sustainable E-waste Management System In India”, ELSEVIER
Journal, 2010
4. UNEP report (2010) available on net.
5. Nokia, (2011), Materials and substances, available at:http://www.nokia.com/environment/
devices-and-services/creating-ourproducts/ materials-and-substances
6. TRAI 2007-8 to 2012 -13, Jan 2014 reports available on net though its site.
7. Toxics Link. (2004) “E-waste in Chennai: Time is Running Out.” www.toxicslink.org
8. Khetriwal et al (2005) ” A Comparison of electronic Waste recycling in Switzerland and in India”, Journal of
Environmental Impact Assessment Review, 25,492-504
9. India together: UN report spotlights India’s e-waste pile up -31March 2010. Available at
www.indiatogether.org /2010/ mar /env-unewaste.
10. WEEE Recycle India Available at www.weeerecycle.in
11. Raghupathy, L (2007), E-waste management in India. Availab le at www.env.go.jp / recycle/ 38/ en /
asia/02 – 4/11.
12. Umesh Kr et al (2013)“E Waste Management Through Regulations”Int. Jour of Engg Inv, Vol 3(2), 6-14

54 Umesh Kumar & D N Singh
Impact Factor (JCC): 3.2029 Index Copernicus Value (ICV): 3.0
13. Baba A et al (2010), Study of metals dissolution from a brand of mobile phone waste. Metalurgija, Journal of Met
16(4), pp 269-277.
14. Notification in the Official Gazette of India, The E-Waste (Management & Handling) Rules, 2011, MOEF
available on net.
15. Green peace (2008). An Assessment of E-waste Take back in India, Take back Blues, Bangalore available at net.
16. WEEE recycling report (2013) availab le on website.
17. Umicore “Metal recovery from e scrap in global envt…..”Hagelukin , Basel convention Sept 2007 on net.
18. The Batteries (Management and Handling) Ru les
19. Bare Acts of the Rules and Acts in India
20. The Hazardous Wastes (Management, Handling and Transboundary Movement) Rules, 2008
21. The Plastics (Manufacture, Usage and Waste Management) Rules, 2009
22. The Hazardous Waste (Management and Handling) Rules
23. Various other materials from Internet from various web sites.