5 – 1 copyright © 2010 pearson education, inc. publishing as prentice hall. quality and...
TRANSCRIPT
5 – 1Copyright © 2010 Pearson Education, Inc. Publishing as Prentice Hall.
Quality And PerformanceQuality And Performance5

5 – 2Copyright © 2010 Pearson Education, Inc. Publishing as Prentice Hall.
Total Quality ManagementTotal Quality Management
Figure 5.1 – TQM Wheel
Customer satisfaction

5 – 3Copyright © 2010 Pearson Education, Inc. Publishing as Prentice Hall.
The Deming WheelThe Deming Wheel
Plan
Do
Study
Act
Figure 5.2 – Plan-Do-Study-Act Cycle

5 – 4Copyright © 2010 Pearson Education, Inc. Publishing as Prentice Hall.
Six Sigma: average and varianceSix Sigma: average and variance
X X
X X
XX
XX X
XXXXX XXX
Process average OK;too much variation
Process variability OK;process off target
Processon target withlow variabilityReduce
spreadCenter
process
X
X
X
X
X
X X
X
X
Figure 5.3 – Six-Sigma Approach Focuses on Reducing Spread and Centering the Process

5 – 5Copyright © 2010 Pearson Education, Inc. Publishing as Prentice Hall.
Six Sigma Improvement ModelSix Sigma Improvement Model
Control
Improve
Analyze
Measure
Define
Figure 5.4 – Six Sigma Improvement Model

5 – 6Copyright © 2010 Pearson Education, Inc. Publishing as Prentice Hall.
Sample and Process DistributionsSample and Process Distributions
Distribution ofsample means
25 Time
Mean
Process distribution
Figure 5.6 – Relationship Between the Distribution of Sample Means and the Process Distribution

5 – 7Copyright © 2010 Pearson Education, Inc. Publishing as Prentice Hall.
Assignable CausesAssignable Causes
(a) LocationTime
Average
Figure 5.7 – Effects of Assignable Causes on the Process Distribution for the Lab Analysis Process
5 – 8Copyright © 2010 Pearson Education, Inc. Publishing as Prentice Hall.
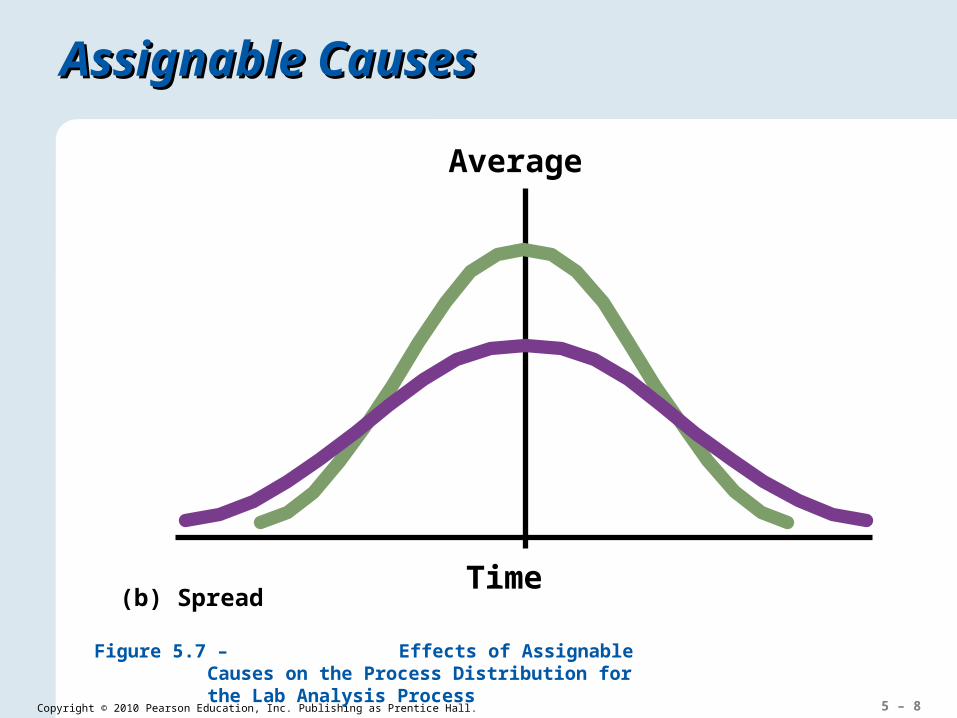
Assignable CausesAssignable Causes
(b) SpreadTime
Average
Figure 5.7 – Effects of Assignable Causes on the Process Distribution for the Lab Analysis Process
5 – 9Copyright © 2010 Pearson Education, Inc. Publishing as Prentice Hall.
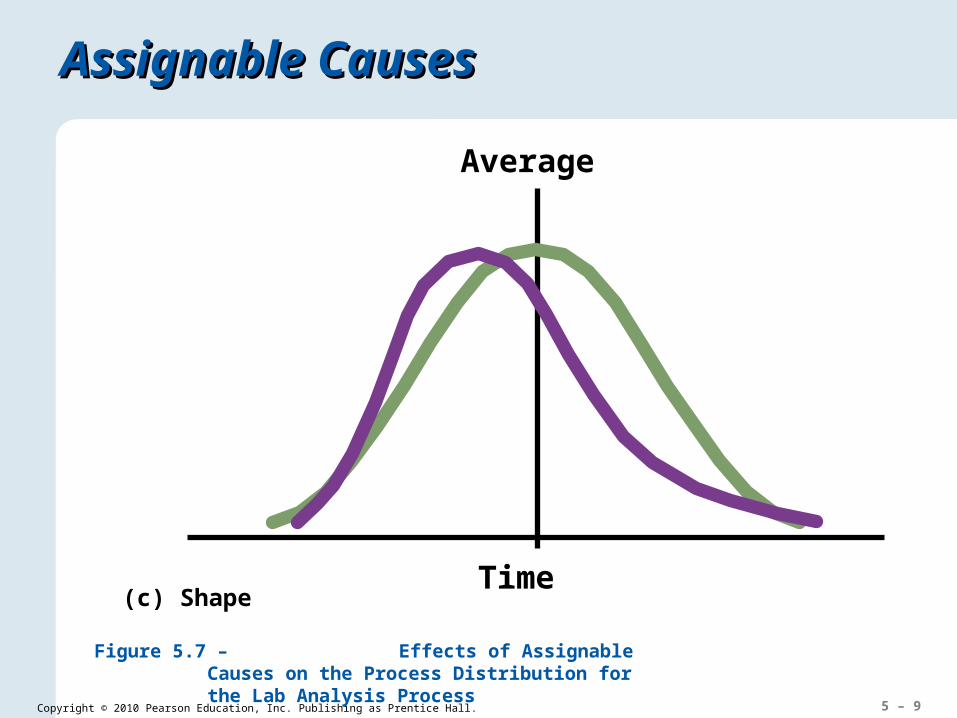
Assignable CausesAssignable Causes
(c) ShapeTime
Average
Figure 5.7 – Effects of Assignable Causes on the Process Distribution for the Lab Analysis Process

5 – 10Copyright © 2010 Pearson Education, Inc. Publishing as Prentice Hall.
Control ChartsControl Charts
Samples
Assignable causes likely
1 2 3
Figure 5.8 – How Control Limits Relate to the Sampling Distribution: Observations from Three Samples
UCL
Nominal
LCL

5 – 11Copyright © 2010 Pearson Education, Inc. Publishing as Prentice Hall.
Nominal
UCL
LCL
Var
iati
on
s
Sample number
Control ChartsControl Charts
Figure 5.9 – Control Chart Examples
(a) Normal – No action

5 – 12Copyright © 2010 Pearson Education, Inc. Publishing as Prentice Hall.
Nominal
UCL
LCL
Var
iati
on
s
Sample number
Control ChartsControl Charts
Figure 5.9 – Control Chart Examples
(b) Run – Take action

5 – 13Copyright © 2010 Pearson Education, Inc. Publishing as Prentice Hall.
Nominal
UCL
LCL
Var
iati
on
s
Sample number
Control ChartsControl Charts
Figure 5.9 – Control Chart Examples
(c) Sudden change – Monitor

5 – 14Copyright © 2010 Pearson Education, Inc. Publishing as Prentice Hall.
Nominal
UCL
LCL
Var
iati
on
s
Sample number
Control ChartsControl Charts
Figure 5.9 – Control Chart Examples
(d) Exceeds control limits – Take action
5 – 15Copyright © 2010 Pearson Education, Inc. Publishing as Prentice Hall.
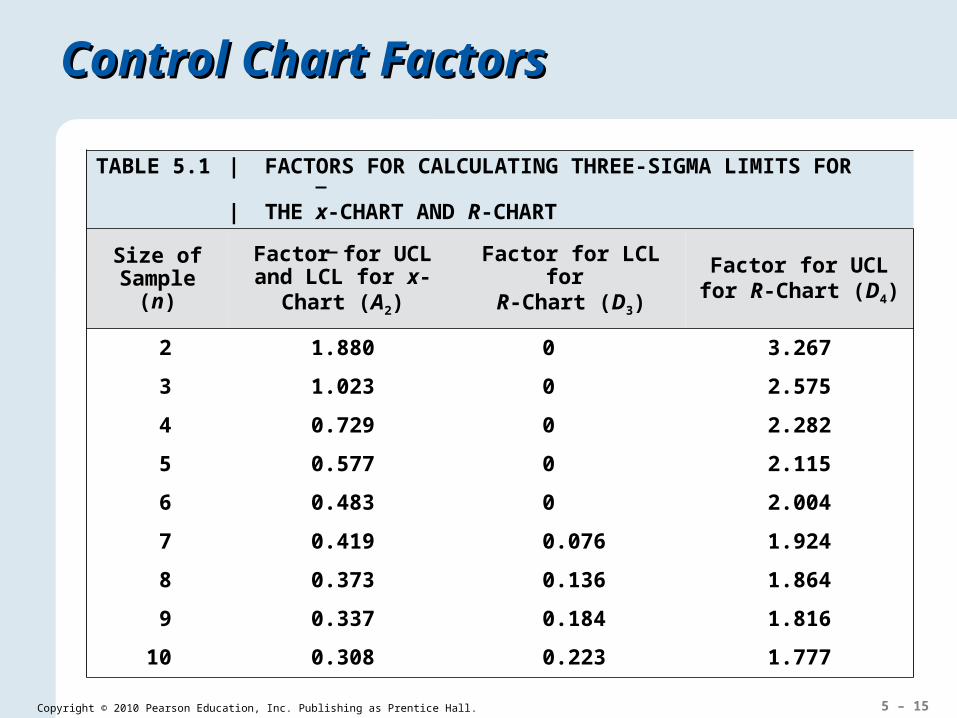
Control Chart FactorsControl Chart Factors
TABLE 5.1 | FACTORS FOR CALCULATING THREE-SIGMA LIMITS FOR
| THE x-CHART AND R-CHART
Size of Sample (n)
Factor for UCL and LCL for x-Chart (A2)
Factor for LCL for R-Chart (D3)
Factor for UCL for R-Chart (D4)
2 1.880 0 3.267
3 1.023 0 2.575
4 0.729 0 2.282
5 0.577 0 2.115
6 0.483 0 2.004
7 0.419 0.076 1.924
8 0.373 0.136 1.864
9 0.337 0.184 1.816
10 0.308 0.223 1.777
5 – 16Copyright © 2010 Pearson Education, Inc. Publishing as Prentice Hall.
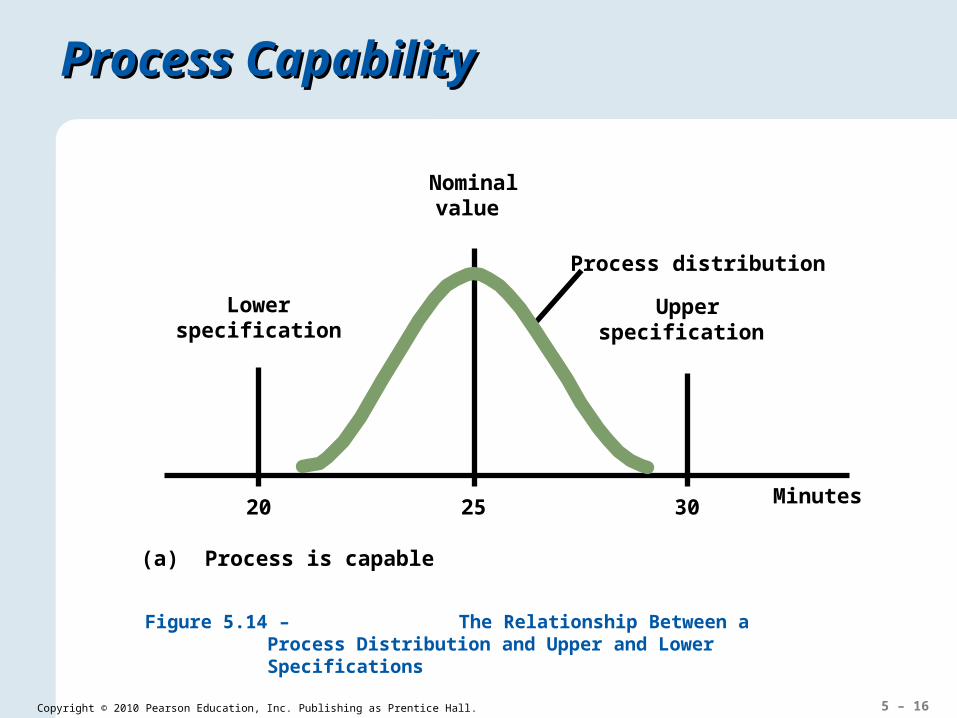
Process CapabilityProcess Capability
20 25 30 Minutes
Upperspecification
Lowerspecification
Nominalvalue
(a) Process is capable
Process distribution
Figure 5.14 – The Relationship Between a Process Distribution and Upper and Lower Specifications

5 – 17Copyright © 2010 Pearson Education, Inc. Publishing as Prentice Hall.
Process CapabilityProcess Capability
20 25 30 Minutes
Upperspecification
Lowerspecification
Nominalvalue
(b) Process is not capable
Figure 5.14 – The Relationship Between a Process Distribution and Upper and Lower Specifications
Process distribution

5 – 18Copyright © 2010 Pearson Education, Inc. Publishing as Prentice Hall.
Process CapabilityProcess Capability
Figure 5.15 – Effects of Reducing Variability on Process Capability
Lowerspecification
Mean
Upperspecification
Nominal value
Six sigma
Four sigma
Two sigma
•Two-sigma quality: 4.56% defects (45,600 defects/million)•Three-sigma quality: 0.26% defects (2,600 defects/million)•Four-sigma: 0.0063% defects (63 defects/million)•Six-sigma : 0.0000002% defects (0.002 defects/million)

5 – 19Copyright © 2010 Pearson Education, Inc. Publishing as Prentice Hall.
Quality EngineeringQuality Engineering
Lo
ss (
do
llars
)
Lower Nominal Upperspecification value specification
Figure 5.16 – Taguchi’s Quality Loss Function
5 – 20Copyright © 2010 Pearson Education, Inc. Publishing as Prentice Hall.
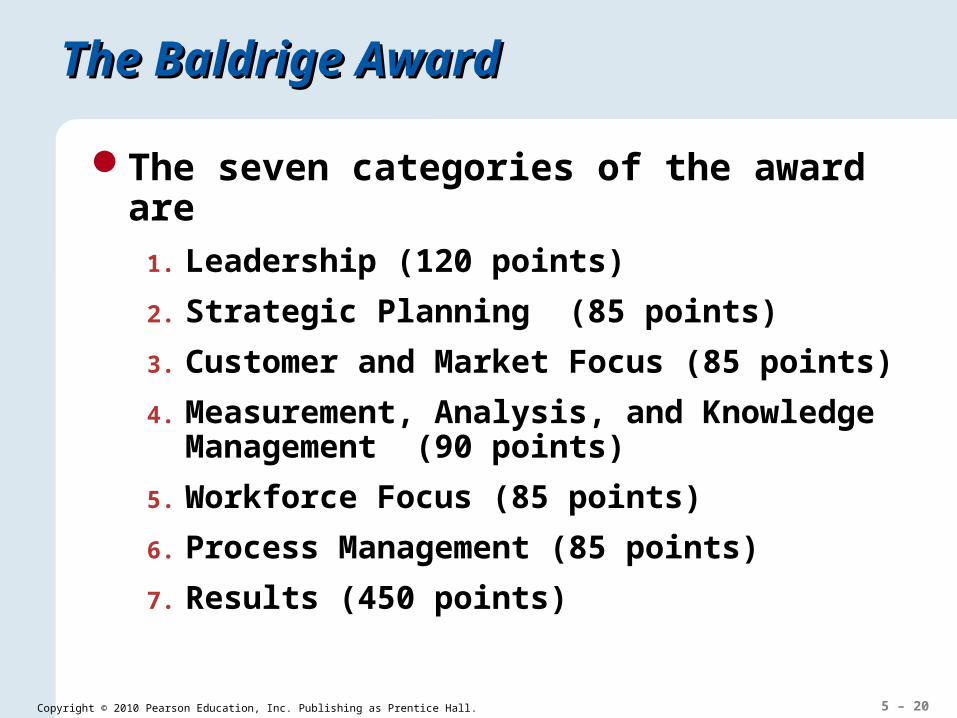
The Baldrige AwardThe Baldrige Award
The seven categories of the award are1. Leadership (120 points)
2. Strategic Planning (85 points)
3. Customer and Market Focus (85 points)
4. Measurement, Analysis, and Knowledge Management (90 points)
5. Workforce Focus (85 points)
6. Process Management (85 points)
7. Results (450 points)
5 – 21Copyright © 2010 Pearson Education, Inc. Publishing as Prentice Hall.