3.2 existing port facilities 3.2.1 pekanbaru (1)...
TRANSCRIPT

3-29
3.2 Existing Port Facilities 3.2.1 Pekanbaru (1) General The port area of Pekanbaru extends from the existing port to the river mouth including public wharves and private wharves. Many factories of the pulp and plywood industry are operating alongside the Siak River and they have their own wharves. For that reason, private wharves are handling more cargo than public wharves. These private wharves need to be taken into account when evaluating the port capacity. (2) Public Wharves Public wharves are located in two areas, Pekanbaru (Figure 3.2.1) and Perawang (Figure 3.2.2). Wharves in front of the city center handle general cargo, while Perawang terminal handles containers. Draft limitation, sharp bends in the access channel, and poor access roads are the major problems of Pekanbaru port. Perawang port has certain advantages over Pekanbaru port as it can accommodate larger vessels and its terminal can be extended and/or expanded. On the other hand, access roads of Perawang are also in a poor condition.
Table 3.2.1 Public Wharves in Pekanbaru Port
Quay Length(m) Depth (m) Yard area (m2)
Year of completion
Pekanbaru Concrete pier 1-3
Sheet pile quay
136 210
6
3.5
1,280 2,120
1978-1994
1994 Perawang
Concrete pier
88
5-7
1,760
1997-1998 Source: IPC 1 branch office
Table 3.2.2 Public Storage Facilities in Pekanbaru Port Facility Unit Area (m2) Year of completion Pekanbaru
Sheds Open storage
Perawang Open storage
3
1,920 3,447
5,000
1953-1982
Source: IPC 1 branch office

3-30
Table 3.2.3 Equipment in Pekanbaru Port Equipment Unit Capacity
Floating equipment Pilot Boat
3
82 HP
Shore equipment Mobile Crane
Fork Lift
1 1 1 1
5 ton
2.5ton 3 ton 5 ton
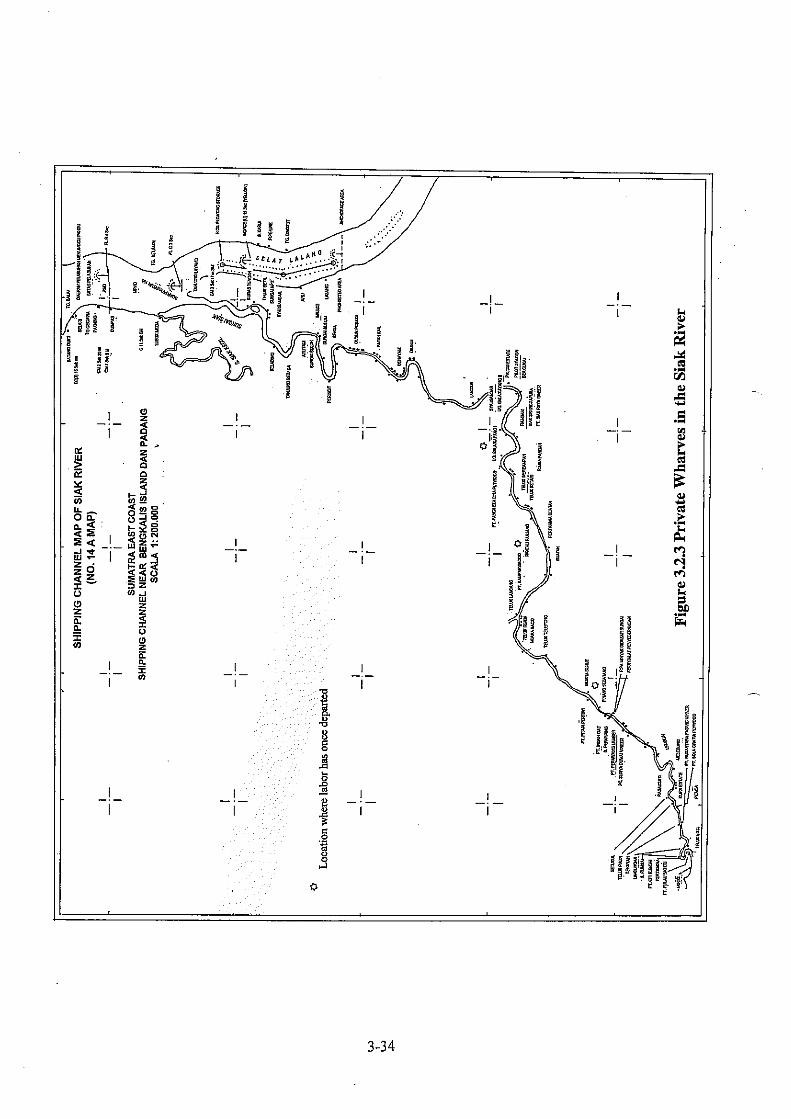
Source: IPC 1 branch office (3) Private Wharves Numerous wharves are operated along the Siak River to support the local industries (Table 3.2.4, Figure 3.2.3). Private wharves handle plywood and pulp in a large amount and larger than public wharves in size. Most of them are dedicated to the use of their owners, but Siak Haska Container Terminal is an exception, handling container cargo of common users (Table 3.2.5). Its holding company, PACC Container Line, provides Jakarta service three times a month and Singapore service six times a month. The proportion of empty container to the total throughput is 98% (import), 1% (export), 3% (discharging), and 35% (loading). Most of the import containers are empty since transportation cost is higher than that through Medan, which has frequent services for Singapore.
Table 3.2.5 Siak Haska Container Terminal Facility Berth length Alongside depth Maximum vessel size Container yard
CFS
Equipment
50m 6-7m LOA 60m, 126TEU Upper CY 2,281 m2 (266 TEU) Lower CY 1,680 m2 (246 TEU) CFS A 648 m2 CFS B 1,680 m2
2 mobile cranes 1 top loader 3 forklifts 1 yard truck
Throughput (TEU in Year 2000) Import Export Sub-total Discharging (domestic) Loading (domestic) Sub-total Total
6,883 7,138 14,021 2,822 2,684 5,506 19,527

12
38
9
1D
.PT
.SIA
K R
AY
A T
IMB
ER
Ply
woo
d&B
lock
Boa
rd In
dust
ry60
M10
.0M
25.0
x5.
0M
6.50
M L
WS
Con
cret
e, W
oode
n flo
or19
9250
00D
WT
2D
.PT
.PE
RA
WA
NG
PE
RK
AS
AF
orm
alde
hyde
Res
in In
dust
ry20
M6.
0M
31.0
x7.
0M
9.00
M L
WS
Con
cret
e19
9115
00D
WT
3D
.PT
.CA
LTE
X P
AC
IF IN
DO
NE
SIA
Raw
Mat
eria
l/Pro
duct
ion&
Pro
duct
ion
supp
ort u
nloa
d/lo
ad62
.3M
17.5
MM
3.00
M L
WS
Con
cret
e15
00D
WT
4D
.PT
.MU
SIM
MA
SR
aw M
ater
ial/P
rodu
ctio
n&P
alm
Oil
unlo
ad/lo
ad36
M5.
0M
32.5
x1.
5M
6.00
M L
WS
Con
cret
e19
9880
00D
WT
5D
.PT
.IND
AH
KIA
T P
ULP
&P
AP
ER
Raw
Mat
eria
l/Pro
duct
ion&
Pro
duct
ion
supp
ort P
ulp&
Pap
er55
M22
.0M
22.0
x9.
5M
7.00
M L
WS
Woo
den/
Con
cret
e80
00D
WT
281.
5M
22.0
M22
.0x
9.5
M7.
00M
LW
SC
oncr
ete
6000
DW
T
350
M10
.0M
7.00
M L
WS
Cou
lom
b S
teel
, Con
cret
e F
loor
60
00D
WT
170
M15
.0M
21.5
x15
.0M
5.00
M L
WS
Con
cret
e
6D
.PT
.PE
RT
AM
INA
/BU
AT
AN
Ref
ined
Oil
Pro
duct
ion
Sup
port
7D
.PT
.PE
RT
AM
INA
/TG
.RH
UR
efin
ed O
il un
load
Fac
ility
8D
.PT
.PA
NC
A E
KA
BIN
A P
LYW
OO
D IN
DU
ST
RI
Woo
d P
roce
ssin
g In
dust
ry80
M20
.0x
10.0
M7.
00M
LW
SW
oode
n19
84
9D
.PT
.RIA
U A
ND
ALA
N P
ULP
&P
AP
ER
Pul
p&P
aper
150
M20
.5M
28.4
x20
.0M
5.00
M L
WS
Ste
el C
oulo
mb
, Con
cret
e F
loor
19
9580
00D
WT
136.
5M
20.5
M32
.8x
15.0
M6.
00M
LW
SC
oulo
mb
Ste
el, C
oncr
ete
Flo
or
1998
8000
DW
T
102(
15x1
5)M
100.
0M
3.50
M L
WS
Con
cret
e/S
oil f
illin
g19
96
11D
.PT
.AS
IA F
OR
ES
TA
MA
RA
YA
Raw
Mat
eria
l/Ply
woo
d P
rodu
ctio
n30
M8.
0M
5.0
x6
M4.
00M
LW
SW
oode
n C
oulo
mb,
Woo
den
Flo
or
1987
1000
DW
T
12D
.PT
.KA
MP
AR
IWO
OD
IND
US
TR
IR
aw M
ater
ial/R
esul
t Ind
ustr
y un
load
/load
24M
10.0
MM
3.60
M L
WS
Woo
den
1991
13D
.PT
.KE
AW
OO
D IN
DU
ST
RI
Raw
Mat
eria
l/saw
mill
unl
oad/
load
60M
10.0
M12
.0x
10.0
M7.
00M
LW
SW
oode
n19
9160
00D
WT
14D
.PT
.PE
RT
IWI P
RIM
A P
LYW
OO
DR
aw M
ater
ial/P
lyw
ood&
saw
mill
Pro
duct
ion
unlo
ad/lo
ad12
M6.
0M
7.5
x6.
0M
4.00
M L
WS
Woo
den
1989
15D
.PT
.NU
SA
NT
AR
A P
AC
IFIC
VE
NE
ER
Raw
Mat
eria
l/Ply
woo
d&B
lock
boar
d P
rodu
ctio
n un
load
/load
28M
6.0
M14
.0x
5.0
M3.
00M
LW
SW
oode
n19
82
14M
5.0
MJe
tty
16D
.H.B
ISM
AR
Ref
ined
Oil
Load
ing
12M
8.8
M7.
0x
3.0
M3.
00M
LW
SC
oncr
ete
Flo
or19
85
17D
.PT
.SO
LA G
RA
TIA
PLY
WO
OD
Raw
Mat
eria
l/Ply
woo
d&S
awm
ill P
rodu
ctio
n un
load
/load
90M
12.0
M3.
25M
LW
SW
oode
n/C
oncr
ete
1985
2000
DW
T
18D
.PT
.PE
RA
WA
NG
LU
MB
ER
IND
US
TR
IR
aw M
ater
ial/P
lyw
ood&
Saw
mill
Pro
duct
ion
unlo
ad/lo
ad70
M20
.0M
12.0
x8.
0M
7.00
M L
WS
Woo
den
Cou
lom
b, W
oode
n F
loor
19
88
19D
.PT
.SU
RY
A D
UM
AI I
ND
US
TR
I R
aw M
ater
ial/P
lyw
ood
Pro
duct
ion
unlo
ad/lo
ad58
M8.
0M
34.0
x6.
0M
5.50
M L
WS
Woo
den
Cou
lom
b, W
oode
n F
loor
19
82
Raw
Mat
eria
lSaw
mill
and
Pro
cese
d W
ood
unlo
ad/lo
ad40
M8.
0M
M5.
50M
LW
SW
oode
n C
oulo
mb,
Woo
den
Flo
or
20D
.PT
.PE
RK
EB
UN
AN
IIR
aw M
ater
ial/P
alm
Oil
Pro
duct
ion
unlo
ad/lo
ad50
M8.
0M
25.0
x4.
0M
6.00
M L
WS
Ste
el C
oulo
mb
, Con
cret
e F
loor
19
9250
00D
WT
21D
.PT
.EK
AD
UR
A IN
DO
NE
SIA
Raw
Mat
eria
l res
ult C
PO
Pro
duct
ion
unlo
ad/lo
ad40
M4.
0M
36.0
x4.
0M
7.50
M L
WS
Ste
el C
oulo
mb
, Con
cret
e F
loor
19
9620
00D
WT
22D
.UM
UM
PE
TI K
EM
AS
Con
tain
er u
nloa
d/lo
ad50
M15
.0M
50.0
x27
.0M
Con
cret
e19
97
3-31
Tab
le 3
.2.4
Pri
vate
Wh
arve
s (D
UK
S)
in P
ort
Pek
anb
aru
2(18
x2)
2(15
x10)
stac
king
yar
d
76
NO
.L
OC
AT
ION
NA
ME
/WA
RF
BU
SIN
ES
S A
RE
AW
AR
F S
IZE
LEN
GTH
WID
ET
RE
ST
LE
10
D.P
T.R
IAU
AN
DA
LAN
PU
LP&
PA
PE
RM
ER
ED
AN
/FA
SIL
ITA
S T
AM
BA
T
CO
NS
TR
UC
TIO
NM
AD
EY
EA
RU
SIN
GC
AP
AC
ITY
shee
t pile
45
CH
AN
NE
L D
EP
TH


3-35
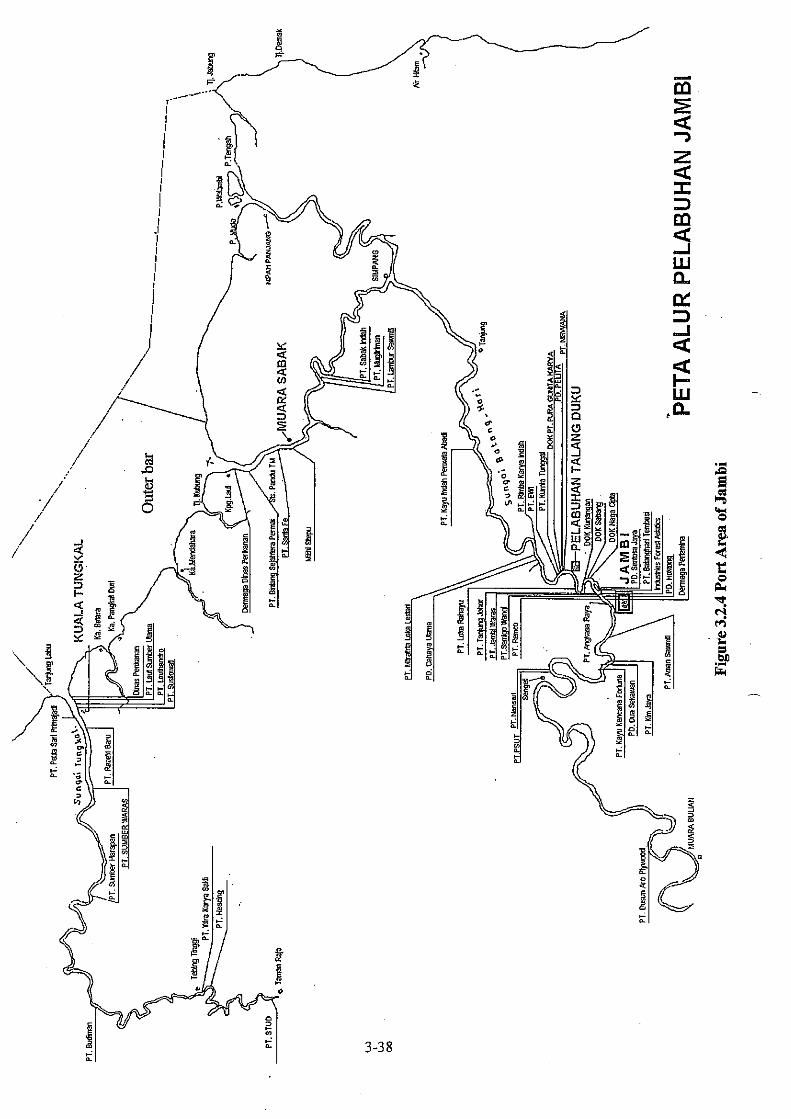
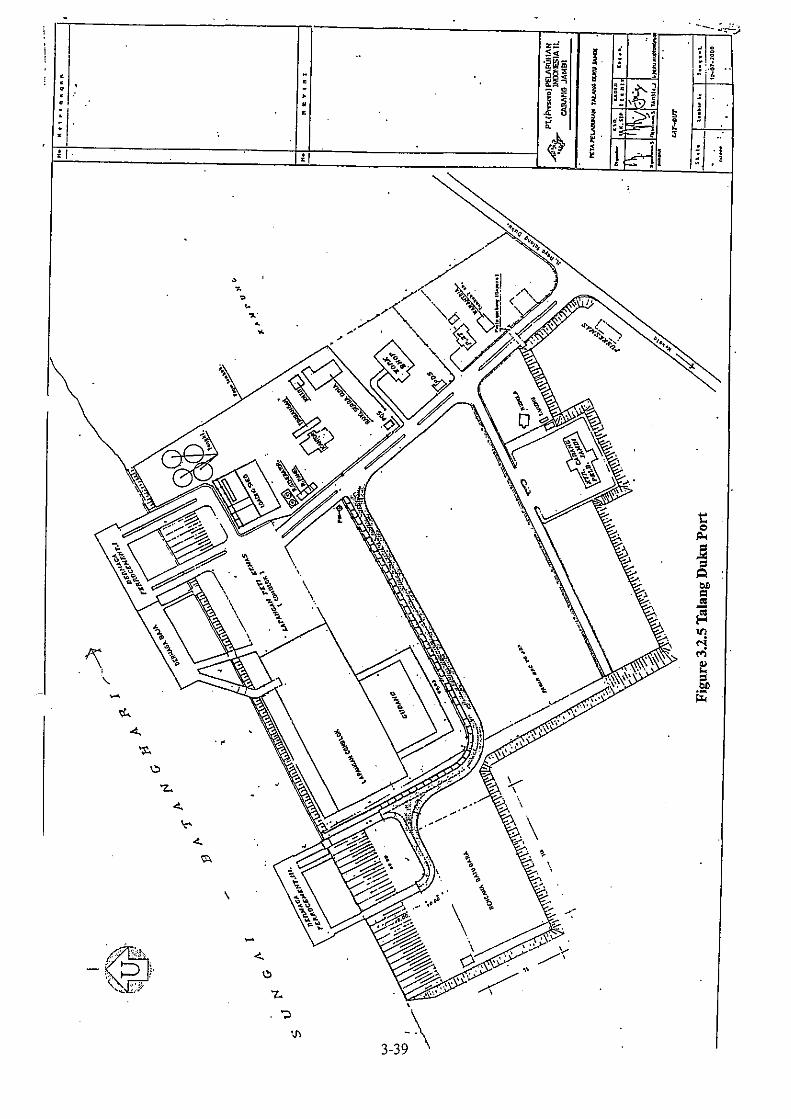
3.2.2 Jambi (1) General The port area of Jambi is quite extensive, including the Batanghari River and Tungkal River (Figure 3.2.4). Many factories of the sawmill and plywood industry are operating alongside the Batanghari River and they have their own wharves. For that reason, private wharves are handling more cargo than public wharves. These private wharves need to be taken into account when evaluating the port capacity. (2) Public Wharves Public wharves are located in three areas, Talang Duku (Figure 3.2.5), Muara Sabak (Figure 3.2.6), and Kuala Tungkal. Talang Duku terminal can accommodate vessels up to 1,000-1,500 DWT and currently caters for general cargo, bag cargo, and container cargo for the areas behind the port (Table 3.2.6). Old Jambi Port located in front of the city was closed in 1997 after Talang Duku became operational. Draft limitation and sharp bends in the access channel are the major problems of Talang Duku terminal. Talang Duku provide Singapore service four times a week. Muara Sabak port has certain advantages over Talang Duku as it can accommodate larger vessels (up to 5,000-6,000 DWT) and it can dramatically reduce the navigation time from the river mouth. On the other hand, access roads of Muara Sabak are in a poor condition. Out of 115km between Jambi City and Muara Sabak, 50 km is not paved and becomes muddy in rainy season. It is about three hours’ drive. In order to take advantage of the strategic location, a new wharf was constructed in 1999-2000 with the financial assistance from Japan. It is a concrete pier of 80m in length with two mooring dolphins. It is not yet utilized partly because of the poor condition of the access road. The provincial government started to improve the road this year with a support from the central government. The improvement is expected to complete in 2004. The Study Team learned that the provincial government was planning to create an alternative access road to Muara Sabak which will reduce the distance to 70 km. This plan is also targeted at 2004. In order to realize this plan, a new bridge across the Batanghari River should be constructed by the central government. Kuala Tungkal can accommodate vessels up to 1,000-1,500 DWT and mainly serves as a passenger terminal because of its proximity to Batam.

3-36
Table 3.2.6 Public Wharves in Jambi
Quay Length(m) Depth (m) Storage area (m2) Talang Duku Steel-concrete Wharf 1 Steel-concrete Wharf 3 Steel floating Wharf Paved Yard Unpaved Yard Warehouse
17 × 67 17 × 67 17 × 67
5-6 5-6 5-6
12,300 21,500 60 × 34
Muara Sabak Wooden Wharf New Wharf
21 × 8
80
5-6
Kuala Tungkal New Wharf Old Wharf Passenger Wharf Warehouse
75 × 15 21 × 8 6 × 4
2-3
40 × 15 Source: IPC 2 branch office
Table 3.2.7 Handling Equipment of Talang Duku Facility Unit Year of Procurement
Forklift Mobile Crane Head Truck Chassis
5 2 2 5
1994-1999 1995-1996 1994-1997 1994-1997
Source: IPC 2 branch office
(3) Private Wharves Numerous private wharves are operated along the Batang Hari River to support the local industries (Table 3.2.8, Figure 3.2.4). Their main cargo items are forest products. Private wharves handled 3 million tons of cargo in 2000, equivalent to 19 times the throughput in public wharves (161 thousand tons). It is noteworthy that five shipyards are located along the river.

3-37
Table 3.2.8 Private Wharves in Jambi Cargo Wharves
Sawmill 12 Rubber 3 Plywood 7 Coconuts Oil 2 Cooking Oil 6 Petroleum 1 Ship Yard 5 Log 2 Paper 1 Glue 1 Natural Gas 1
Total 41 Source: IPC 2 branch office

3-41
3.2.3 Palembang (1) General Port of Palembang has served the regional economy since 1924 at the present location. The port area of Palembang extends from the existing port, Boom Baru, to the new site, Sungai Lais (Figure 3.2.7). This is a marked difference from Pekanbaru and Jambi, whose port area extends to the sea. Many factories of the petroleum, fertilizer, and plywood industry are operating alongside the Musi River and they have their own wharves. For that reason, private wharves are handling more cargo than public wharves. These private wharves need to be taken into account when evaluating the port capacity. (2) Public Wharves Public wharves are located in two areas, Boom Baru (Figure 3.2.8) and Sungai Lais. Among them, Boom Baru is the main facility handling both container and bulk cargo. About a half of the quay length in front of the container yard is equipped with rails for a gantry. Consequently, a half of the wharf is dedicated to container vessels, while the remaining half is used as a multi-purpose terminal. This half is waiting for structural reinforcement to be equipped with crane rails. The reinforcement works have been delayed due to the economic crisis. Boom Baru has another quay for conventional cargo. IPC 2 has 200 ha of land behind Sungai Lais, some 8km downstream from Boom Baru. Currently, there are only dilapidated seawalls in Sungai Lais. Log handling at this seawall has been stopped since its inland transportation changed from water transport to trucking. IPC 2 is planning to develop this area as CPO farms counting on the private sector participation (Figure 3.2.9).
Table 3.2.9 Public Wharves in Palembang Port Quay Length(m) Depth (m) Width of
Apron (m) Load
capacity(t/m2) Boom Baru Conventional Wharf Container Wharf Multi-purpose Wharf
375 160 106
6 - 7
9 – 9.2 9 – 9.2
10.5 28
19.5
3
3.2 6.5
Sungai Lais
280
1 - 3
15
1
Source: IPC 2 branch office

3-42
Table 3.2.10 Public Storage Facilities in Palembang Port Facility Area (m2)
Boom Baru Closed Sheds Open Storage Container Yard
8,812 8,173 47,100
Sungai Lais Closed Sheds Open Storage
-
4,373 Source: IPC 2 branch office IPC2 owns handling equipment for conventional cargo and container cargo (Table 3.2.11). It also owns seven pilot boats.
Table 3.2.11 Handling Equipment in Palembang Port Equipment Unit Capacity (t) Production Condition (%)
Mobile Crane 2 25-35 1975-1984 65-70 Gantry Crane 1 30.5 1973 70 Forklift 11 2-15 1973-1999 60-90 Top Loader 1 30.5 1990 65 Side Loader 2 15 1979-1990 60-65 Head Truck 5 40 1983-1999 60-95 Chassis 6 40 1983-1990 60
Source: IPC 2 branch office (3) Private Wharves Private wharves are developed in Palembang Port to support the local industries (Table 3.2.12). Private wharves handle petroleum, fertilizer, and coal in a large amount and they are dedicated to the use of their owners. In addition to these wharves, a lot of wharves are operating along the Musi River handling wood products.
Table 3.2.12 Private Wharves in Palembang Port User Length(m) Depth (m) Cargo Supporting facilities
PT. Pusri 680 5-8.5 Fertilizer
Warehouse, silo
Pertamina Plaju Sungai Gerong
291 301
4.5-6.5 6.5-7
Petroleum
Warehouse, storage tank, gantry crane
PT.Taba Kertapati 250 5-6 PT. Semen Baturaja 17 6-7 Coal PN. Garam 80 5 Salt
Source: IPC 2 branch office


3-46
3.3 Access Channels 3.3.1 Pekanbaru (1) General Pekanbaru is located 96 miles from the river mouth (Figure 3.3.1). Tidal range is 3m at Pekanbaru as well as at the river mouth. Tidal movement in the river is delayed from that at the mouth, 6 hours’ delay at Pekanbaru and 5 hours’ delay at Perawang. The access channel is relatively deep except at the mouth. Five buoys are deployed around the island at the mouth, but only one of them is working.
Table 3.3.1 Access Channel of Pekanbaru Port area (ha) 9,975
Channel length (mile) 96 Channel width (m) 60-100 Channel depth (m, LWS) 10-15
Source: MOC local office (2) Navigation Rules DGSC regulates navigation in the Siak River by Decree of Regional Head Officer 2 (Nov. 1984) (Table 3.3.2). Pilot is required for vessels over 150 GRT. Night navigation (6 PM - sunrise) is not allowed from Pertiwi upward. Latest arrival time at Pekanbaru is 6 PM, while latest departure time is 4 PM. Accordingly, incoming vessels should adjust their arrival time at Siak Sri Indrapura Port. Vessel traffic is two ways throughout the channel.
Table 3.3.2 Navigation Rules in the Siak River Area Maximum LOA (m) Maximum draft (m)
At the port entrance 130 6.5 Up to Kuala Mandau 110 6.5 Up to Perawang 90 6 Up to Pekanbaru 50 5
Source: MOC local office (3) Traffic Constraints Sharp bends from Perawang upward seem to pose serious navigational difficulty. The Study Team also learned that the bend at Muara Sago – Teluk Rimba is difficult to negotiate.


3-48
3.3.2 Jambi (1) General Jambi is located around 90 miles from the river mouth (Figure 3.3.2). The distance between the anchorage area and the pilot station (Teluk Majelis) is around 10 miles. In order to maintain the water depth of 5 m around the river mouth, maintenance dredging is required in 5 –6 miles of the channel from the estuary. Maintenance dredging is carried out every two years and costs Rp. 2.6 billion.
Table 3.3.3 Access Channel of Jambi (Batang Hari River) Anchorage area – Pilot station (Teluk Majekis) Distance Width Depth Buoy
10 miles
80 m 4.5 m (LWS), 7.5 m (High tide)
6 Pilot station – Jambi Distance Width Depth
83 miles
50 m (at narrow points) LWS 2.5 – 3.3 m (at shallow areas)
Source: MOC local office (2) Navigation Rules The Jambi Port Administrator issued a decree on navigation in February 2001 determining the maximum vessel size navigable in the Batang Hari River in (Table 3.3.4). Vessels are requested to ask the pilot station at Teluk Majelis about the channel situation. Pilot is required for vessels over 105 GRT. 10 pilots are currently available and three more pilots are employed in April 2001. Night navigation and two-way traffic is allowed throughout the channel.
Table 3.3.4 Maximum Vessel Allowed in the Batang Hari River
Area Maximum LOA (m) Maximum Draft (m) Clearance
Draft (m) Anchorage area – Muara Sabak 115 6.5 0.7 Muara Sabak – Jambi
Rainy season/highest water Dry season/lowest water
75 75
5.0
3.5 – 4.5 (Kumingking) 2.8 –3.5 (Talang Duku)
0.5
Source: MOC local office According to the above decree, vessels of over three meter in draft, when passing the Kelemak Channel, are requested to wait until about three hours after the high tide at the following places: 1) Vessels going to Talang Duku should berth at Muara Sabak/Sabak Indah 2) Vessels going out of Talang Duku should berth at Simpang Tua/Keramat Orang Kayo

3-49
Itam. (3) Traffic Constraints ADPEL in Jambi identified several problem areas along the Batang Hari River (Table 3.3.5). Sharp bends, shallow depth, and narrow points are found in many areas along the river. Among them, Kelemak Channel poses the biggest constraint for vessel navigation.
Table 3.3.5 Problem Points along the Batang Hari River Problem Points Navigation Constraints
Tanjung Pasir Shallow Sungai Dendang Shallow Tanjung Balam Loran Sharp Bend Teluk Keladi Sharp Bend, Shallow, Narrow Sungai Kelemak Sharp Bend, Shallow (2.5 m LWS), Narrow Tanjung Puding Sharp Bend Air Hitam Shallow Simpang Tua Bend, Shallow, Narrow Tanjung Olak Badar Sharp Bend, Rotating Currents Muara Jambi Shallow (2.8 m LWS) Tanjung Johor Bend, Shallow (2.8 m LWS)
Source: MOC local office


3-51
3.3.3 Palembang (1) General Palembang is located some 80 km from the river mouth (Figure 3.3.3). Maximum tidal range at the river mouth is 3.75m. Tidal movement at Palembang is delayed from that at the mouth by 4 hours. The access channel is relatively deep except at the mouth. Thirty-five navigational aids are deployed between Boom Baru and the outer bar (Figure 3.3.4, Table 3.3.6). One of the aids placed at the outer bar is out of order due to a collision by a vessel. Maximum stream is 0.6 knot (northward) and 2.3 knot (southward). Highest wave of 1-2 m is experienced at the bar between November and February.
Table 3.3.6 Navigational Aids in the Musi River Navigational Aids Units
Lighted Buoy 10 Leading Light 10 Lighted Beacon 15
Table 3.3.7 Access Channel of Palembang
Port Working Area (ha) 1,006 Channel Length (km) 11.1 (within the port area)
100 (from the outer bar to Boom Baru) Minimum Channel Width (m) 120 Minimum Channel Depth (m, LWS) 4.9 Sea Tide (m, LWS) HHWS MHWS MSL MLWS
4.1 3.7 2.1 0.5
Source: MOC local office, DGSC pilot guide (2) Navigation Rules According to a sea pilot in Palembang, maximum LOA allowed to call is 185m. A pilot station is established at Tg. Buyut staffed with 20 sea pilots and 10 harbor pilots. Sea pilots are responsible for the navigation between the outer bar and Sungai Lais. Vessel traffic is allowed 24 hours. Two-way traffic is allowed throughout the channel except for foggy days, which occurred once every 4-5 years. In that occasion, the channel traffic is one-way alternating the direction every 24 hours.
(3) Traffic Constraints Sharp bends at Sedumara, to the south of Pulau Singgis, and Tg. Kramat, to the east of Pulau Kramat pose navigational difficulty. The channel becomes narrower at the two bends as well.


3-54
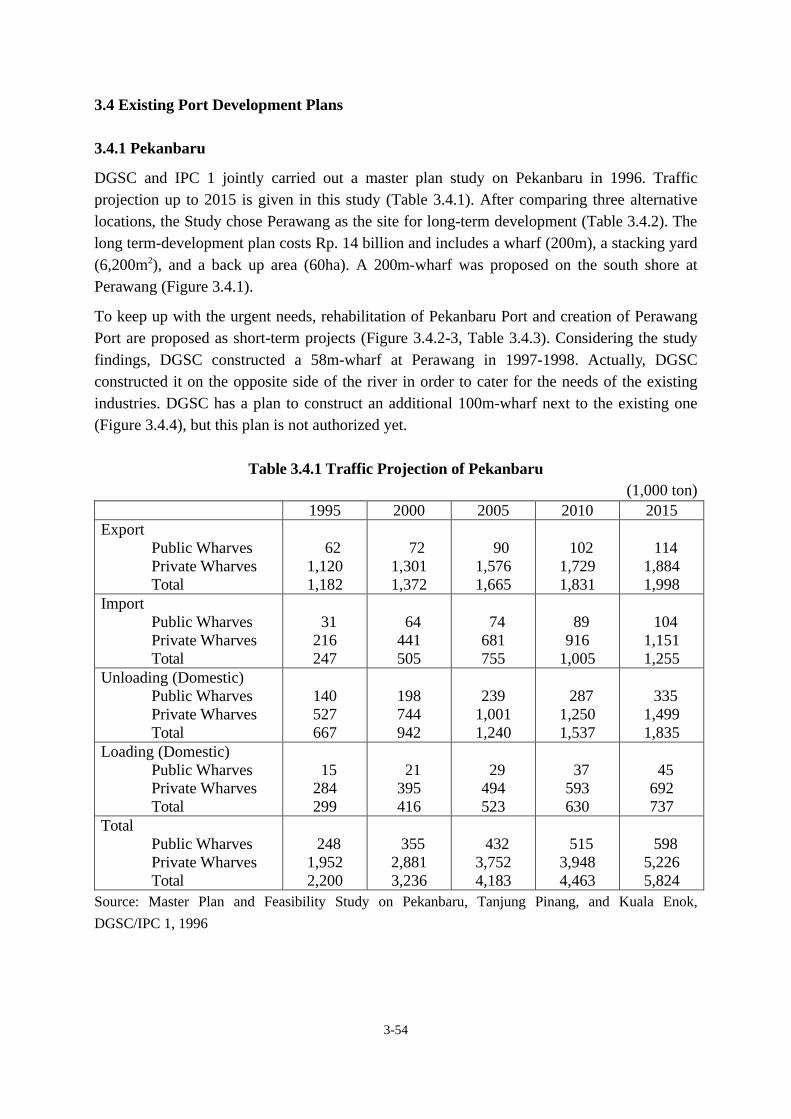
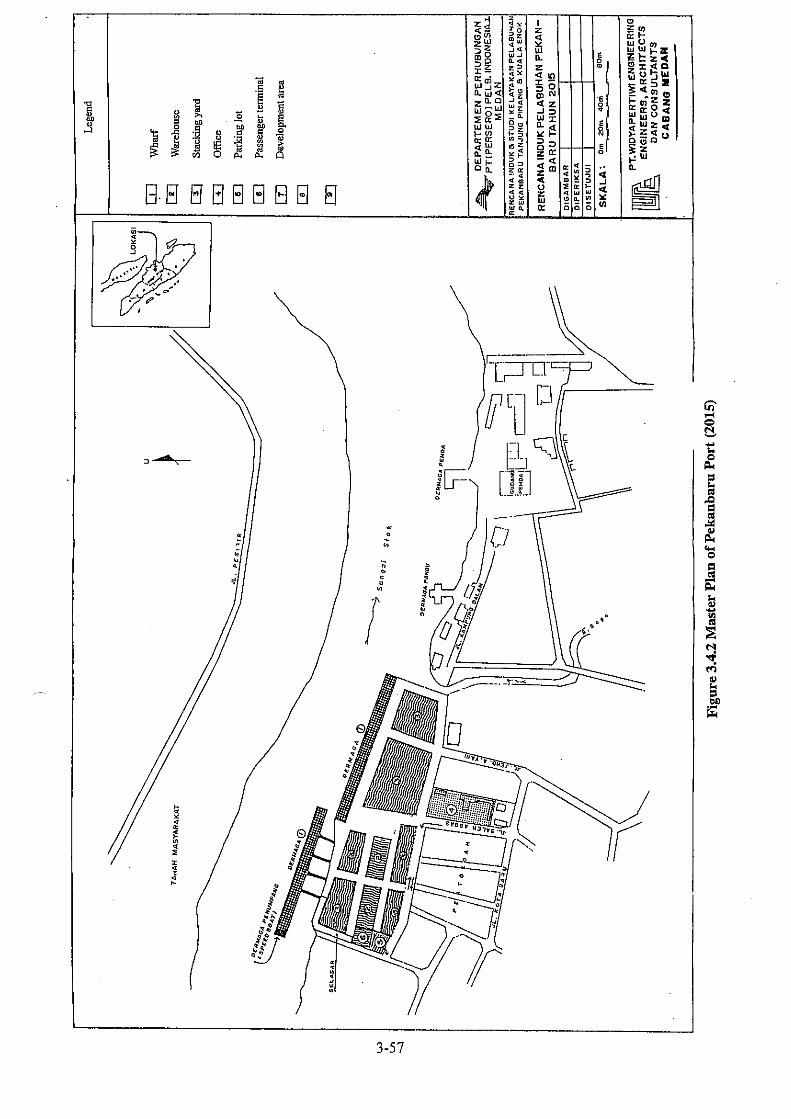
3.4 Existing Port Development Plans 3.4.1 Pekanbaru DGSC and IPC 1 jointly carried out a master plan study on Pekanbaru in 1996. Traffic projection up to 2015 is given in this study (Table 3.4.1). After comparing three alternative locations, the Study chose Perawang as the site for long-term development (Table 3.4.2). The long term-development plan costs Rp. 14 billion and includes a wharf (200m), a stacking yard (6,200m2), and a back up area (60ha). A 200m-wharf was proposed on the south shore at Perawang (Figure 3.4.1). To keep up with the urgent needs, rehabilitation of Pekanbaru Port and creation of Perawang Port are proposed as short-term projects (Figure 3.4.2-3, Table 3.4.3). Considering the study findings, DGSC constructed a 58m-wharf at Perawang in 1997-1998. Actually, DGSC constructed it on the opposite side of the river in order to cater for the needs of the existing industries. DGSC has a plan to construct an additional 100m-wharf next to the existing one (Figure 3.4.4), but this plan is not authorized yet.
Table 3.4.1 Traffic Projection of Pekanbaru (1,000 ton)
1995 2000 2005 2010 2015 Export Public Wharves Private Wharves Total
62 1,120 1,182
72 1,301 1,372
90 1,576 1,665
102 1,729 1,831
114 1,884 1,998
Import Public Wharves Private Wharves Total
31 216 247
64 441 505
74 681 755
89 916
1,005
104 1,151 1,255
Unloading (Domestic) Public Wharves Private Wharves Total
140 527 667
198 744 942
239
1,001 1,240
287 1,250 1,537
335 1,499 1,835
Loading (Domestic) Public Wharves Private Wharves Total
15 284 299
21 395 416
29 494 523
37 593 630
45 692 737
Total Public Wharves Private Wharves Total
248 1,952 2,200
355 2,881 3,236
432 3,752 4,183
515 3,948 4,463
598 5,226 5,824
Source: Master Plan and Feasibility Study on Pekanbaru, Tanjung Pinang, and Kuala Enok, DGSC/IPC 1, 1996

3-55
Table 3.4.2 Comparison of Alternative Sites
Melubung Perawang Muara Sungai Siak Aspects Coefficient Value Score Value Score Value Score
River (Navigation)
40 3 120 5 200 5 200
Land 30 4 120 5 150 3 90 Access 20 5 100 4 80 3 60
Labor 10 5 50 5 50 4 40 Total 100 390 480 390
Source: Master Plan and Feasibility Study on Pekanbaru, Tanjung Pinang, and Kuala Enok, DGSC/IPC 1, 1996
Table 3.4.3 Projects for Short-term Port Projects Costs
(Rp. million) Pekanbaru Rehabilitation of Wharf Floor
Rehabilitation of Roads Arrangement of Passenger Terminal Improvement of Utility Improvement and Replacement of Handling Equipment Installment of Navigational infrastructure Total
200 450 250 200 100 250 1,450
Perawang Preparation of Infrastructure (Reclamation, Slope, Warehouse, Container Yard, Road, Utility, Office) Construction of Wharf (50m×15m) Total
3,903 3,000 6,903
Source: Master Plan and Feasibility Study on Pekanbaru, Tanjung Pinang, and Kuala Enok, DGSC/IPC 1, 1996


3-60
3.4.2 Jambi (Muara Sabak) (1) IPC II Study IPC 2 carried out a master plan study on Muara Sabak in 2000. Traffic projection up to 2025 is given in this study (Table 3.4.4). Distribution of cargo among the ports is projected as well (Table 3.4.5).
Table 3.4.4 Traffic Projection of Muara Sabak Scenario 2000 2005 2010 2015 2020 2025
General Cargo (,000t) 54 563 1,248 2,026 2,591 3,416
Optimistic Container (,000TEU) - 9 52 128 216 365
General Cargo (,000t) 53 514 1,060 1,603 1,910 2,347
Moderate Container (,000TEU) - 8 44 101 159 251
General Cargo (,000t) 52 467 899 1,264 1,401 1,604
Pessimistic Container (,000TEU) - 7 37 80 117 172
CPO (,000t) - 469 608 608 508 544 Coal (,000t) - - 450 450 450 450
Source: Master Plan Study on Jambi Muara Sabak, IPC2, 2000
Table 3.4.5 Distribution of Cargo among Neighboring Ports (%)
Year Muara Sabak Talang Duku Kuala Tungkal 1999 5 71 24 2000 5 73 22 2005 49 51 - 2010 69 31 - 2015 73 27 - 2020 75 25 - 2025 77 23 -
Source: Master Plan Study on Jambi Muara Sabak, IPC2, 2000 This report establishes two alternatives according to the distribution of cargo between public wharves and private wharves. For the alternative 2 (increased role of public wharves), this report proposes the creation of 1,100 m-quay, 300m of which is for container (Figure 3.4.5). Total project cost is estimated to be as high as Rp. 900 billion (Table 3.4.6) and FIRR (financial internal rate of return) is found to be low, at 4.5-5.5%.

3-61
Table 3.4.6 Project Costs
Item Costs ( Rp. billion) Main port facilities 492 Equipment 119
Supporting facilities 289 Land 1 Total 901
Source: Master Plan Study on Jambi Muara Sabak, IPC2, 2000
(2) DGSC Study In 1996, DGSC carried out a comprehensive port development study for the Southern Sumatra and West Java Region. Jambi and Muara Sabak are included in the study. This study identified two alternatives for the port development catering for Jambi Province. One is expansion of Talang Duku, a new terminal close to the existing port. The other is creation of a new deep-water port at Muara Sabak, 162 river nautical miles from Jambi and 20km from the outer bar of the Batanghari River. The plan for Phase 1 development of Muara Sabak includes a 500m multi-purpose quay with 10ha of open storage area as well as a CPO tank farm (Figure 3.4.6). Muara Sabak and Tanjung Api-Api are similar in development concept, aiming to provide a deeper draft port catering for the cargo from Jambi Province. Since these two locations are just 100 miles away and Tanjung Api-Api can provide a lot deeper draft than Muara Sabak, the study concluded that the Muara Sabak development would have no justification if Tanjung Api-Api is developed. This study assumed the following: 1) If Api-Api is not developed, rubber and palm oil from Jambi Province will be exported via
Belawan, Singapore, or Jakarta. 2) If Api-Api is developed, these cargoes will be exported via Api-Api. 3) Under either scenario, 50% of the Jambi Province exports will be handled via Muara
Sabak and/or Api-Api. The rest will be transshipped midstream and handled by other ports. 4) Due to the lack of information on the siltation around the project site, dredging costs for
deepening the outer bar from the current depth of 4.5m to the design depth of 6m are excluded from the economic evaluation.
The study concluded that development of Muara Sabak would not be feasible in either scenario (Table 3.4.7).

3-62
Table 3.4.7 Cost and Benefits of Muara Sabak Development
Export/ Import
Containers Rubber Palm Oil Total
Without Api-Api Present Value ($ ,000)
- Hinterland Transport Savings for Jambi Province
- Estimated Costs of Phase 1 - Net Benefits (Losses)
Unit Cost Saving ($/t or $/TEU) - Transport Cost and Handling
4,423
28.0
7,499
3.4
548
0.3
12,470
55,000 - 42,530
With Api-Api Present Value ($ ,000)
- Hinterland Transport Savings for Jambi Province
- Estimated Costs of Phase 1 - Net Benefits (Losses)
Unit Cost Saving ($/t or $/TEU) - Transport Cost and Handling
4,423
28.0
- 482
- 0.2
- 1,579
- 0.7
2,362
55,000 - 52,638
Source: Technical Assistance Services for a Ports Development Strategy for the Southern Sumatra and West Java Region, July 1996


3-65
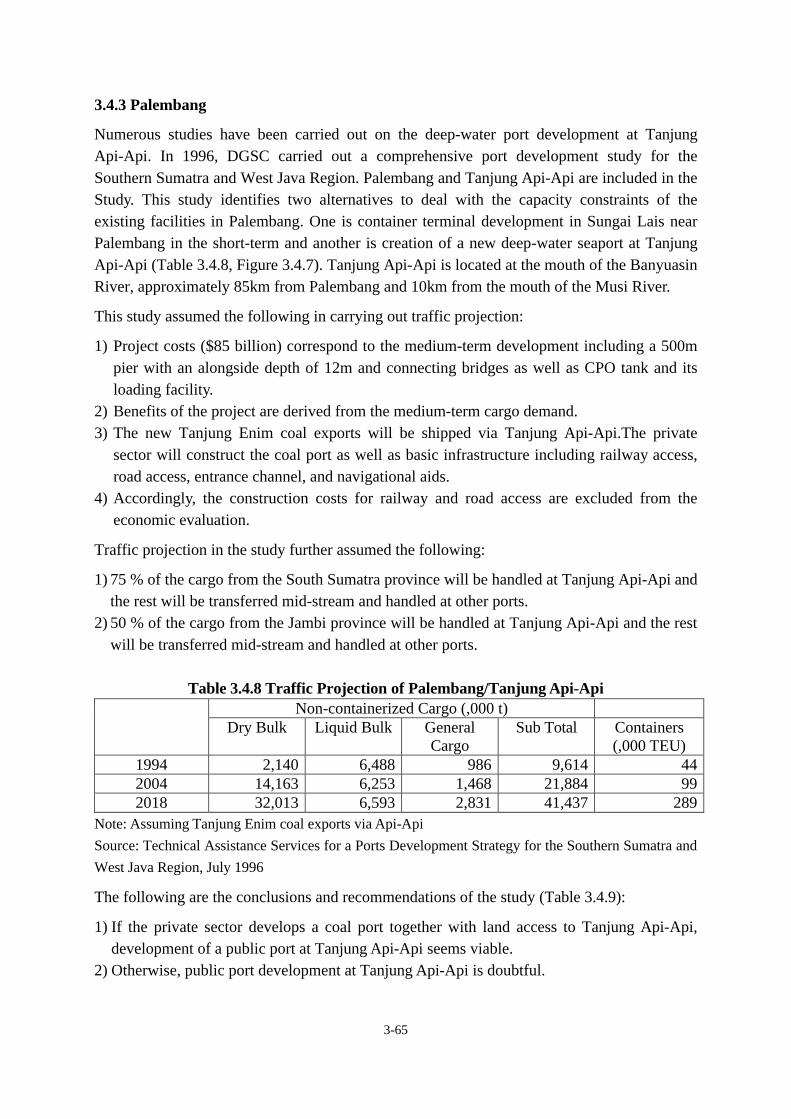
3.4.3 Palembang Numerous studies have been carried out on the deep-water port development at Tanjung Api-Api. In 1996, DGSC carried out a comprehensive port development study for the Southern Sumatra and West Java Region. Palembang and Tanjung Api-Api are included in the Study. This study identifies two alternatives to deal with the capacity constraints of the existing facilities in Palembang. One is container terminal development in Sungai Lais near Palembang in the short-term and another is creation of a new deep-water seaport at Tanjung Api-Api (Table 3.4.8, Figure 3.4.7). Tanjung Api-Api is located at the mouth of the Banyuasin River, approximately 85km from Palembang and 10km from the mouth of the Musi River. This study assumed the following in carrying out traffic projection: 1) Project costs ($85 billion) correspond to the medium-term development including a 500m
pier with an alongside depth of 12m and connecting bridges as well as CPO tank and its loading facility.
2) Benefits of the project are derived from the medium-term cargo demand. 3) The new Tanjung Enim coal exports will be shipped via Tanjung Api-Api.The private
sector will construct the coal port as well as basic infrastructure including railway access, road access, entrance channel, and navigational aids.
4) Accordingly, the construction costs for railway and road access are excluded from the economic evaluation.
Traffic projection in the study further assumed the following: 1) 75 % of the cargo from the South Sumatra province will be handled at Tanjung Api-Api and
the rest will be transferred mid-stream and handled at other ports. 2) 50 % of the cargo from the Jambi province will be handled at Tanjung Api-Api and the rest
will be transferred mid-stream and handled at other ports.
Table 3.4.8 Traffic Projection of Palembang/Tanjung Api-Api Non-containerized Cargo (,000 t)
Dry Bulk Liquid Bulk General Cargo
Sub Total Containers (,000 TEU)
1994 2,140 6,488 986 9,614 44 2004 14,163 6,253 1,468 21,884 99 2018 32,013 6,593 2,831 41,437 289
Note: Assuming Tanjung Enim coal exports via Api-Api Source: Technical Assistance Services for a Ports Development Strategy for the Southern Sumatra and West Java Region, July 1996 The following are the conclusions and recommendations of the study (Table 3.4.9): 1) If the private sector develops a coal port together with land access to Tanjung Api-Api,
development of a public port at Tanjung Api-Api seems viable. 2) Otherwise, public port development at Tanjung Api-Api is doubtful.
3-66
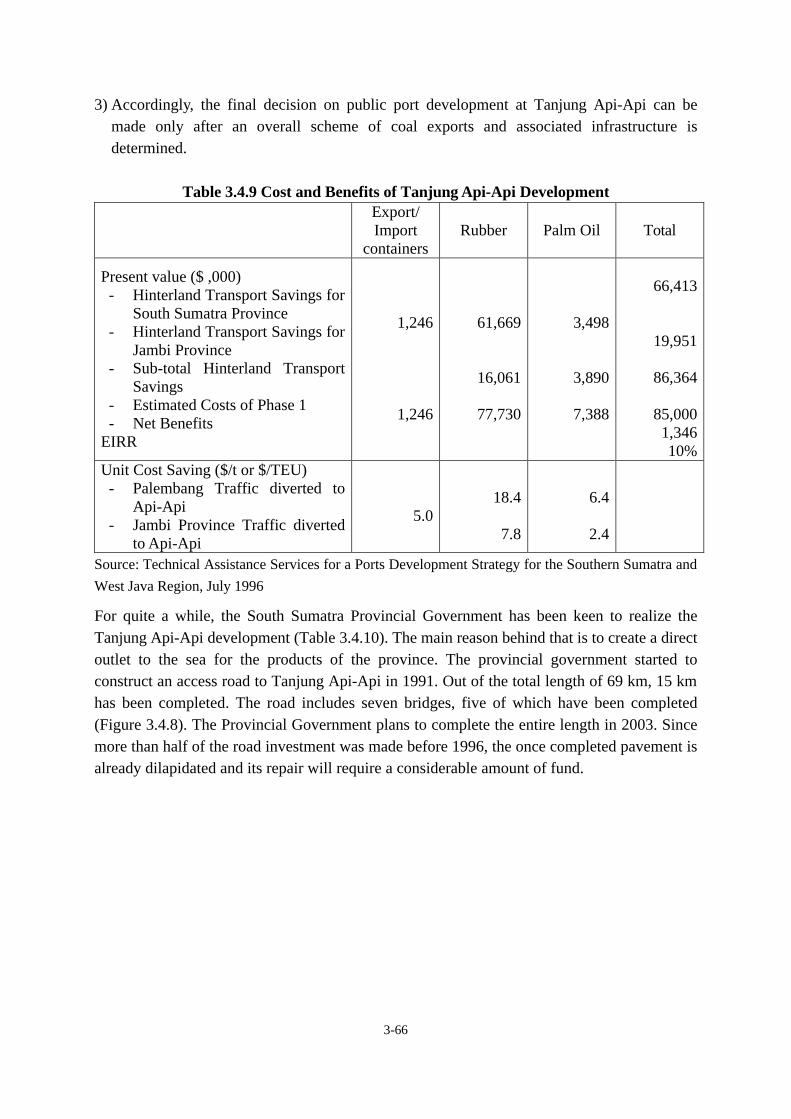
3) Accordingly, the final decision on public port development at Tanjung Api-Api can be made only after an overall scheme of coal exports and associated infrastructure is determined.
Table 3.4.9 Cost and Benefits of Tanjung Api-Api Development
Export/ Import
containers Rubber Palm Oil Total
Present value ($ ,000) - Hinterland Transport Savings for
South Sumatra Province - Hinterland Transport Savings for
Jambi Province - Sub-total Hinterland Transport
Savings - Estimated Costs of Phase 1 - Net Benefits
EIRR
1,246
1,246
61,669
16,061
77,730
3,498
3,890
7,388
66,413
19,951
86,364
85,000 1,346 10%
Unit Cost Saving ($/t or $/TEU) - Palembang Traffic diverted to
Api-Api - Jambi Province Traffic diverted
to Api-Api
5.0
18.4
7.8
6.4
2.4
Source: Technical Assistance Services for a Ports Development Strategy for the Southern Sumatra and West Java Region, July 1996 For quite a while, the South Sumatra Provincial Government has been keen to realize the Tanjung Api-Api development (Table 3.4.10). The main reason behind that is to create a direct outlet to the sea for the products of the province. The provincial government started to construct an access road to Tanjung Api-Api in 1991. Out of the total length of 69 km, 15 km has been completed. The road includes seven bridges, five of which have been completed (Figure 3.4.8). The Provincial Government plans to complete the entire length in 2003. Since more than half of the road investment was made before 1996, the once completed pavement is already dilapidated and its repair will require a considerable amount of fund.


3-70
Table 3.4.11 Access Road to Tanjung Api-Api (works completed up to 2000)
Item Works completed Filling by Local Soil (Swamp Soil) 68.6 km Filling by Soil from other Area 26.6 km Coating by Asphalt 15.5 km Bridge 5 (560 m) Investment National budget Provincial budget Total
Rp.20,530 million Rp.6,277 million Rp.26,807 million
Additional Investment needed for completion Street (4 Lanes) (Stage 1: 2 Lanes) Bridge (280m) Total
Rp.411,684 million
(Rp.152,538 million) Rp.11,200 million Rp.422,884 million
Source: South Sumatra Provincial Government It also allocated 5,500 ha of area around Tanjung Api-Api as a development area. The Provincial Government contemplates two alternative ways for the port development. One is a development as a public port and the other is as a special port. The South Sumatra Province is in negotiation with an Australian investor for the development. In short, the future of the Tanjung Api-Api development is still unclear.

