3.1 introduction to fbg sensors -...
TRANSCRIPT

Fiber Bragg Grating Chemical Sensor
81
3.1 Introduction to FBG Sensors
The need for technologically advanced sensors capable of providing rapid and
robust results are expected to lead to the increasing use of fiber optic sensors in
various fields. In the very beginning, the research on fiber optic sensors was taken up
merely as curiosity. Increased R&D activities brought many newer high performing
fiber optic devices which strengthened flying wings of fiber optic sensor field. FBG is
one such device that solved many problems of optical networking and fiber optic
sensors. Now research on FBG sensors is one of the hottest topics that may replace
the conventional sensors mainly because mass of the sensor is reduced many a times.
Fiber Bragg gratings are excellent fiber-optic sensing elements and have attracted
considerable interest in various fiber optic sensor implementations in the past years.
FBGs behave as filters by reflecting a narrow band of incoming spectrum [1, 2] and
have found applications in optical telecommunication networks and in sensing
parameters like temperature, pressure, displacement etc [3-6]. They are integrated into
the light guiding core of the fiber and are wavelength encoded, eliminating the
problems of amplitude or intensity variations suffered by many other types of fiber
sensors. In addition to the well-known advantages of fiber-optic sensors such as
electrically passive operation, immunity to RFI and EMI, high sensitivity, compact
size and potentially low cost; FBG based sensors have an inherent self-referencing
capability and can be easily multiplexed in a serial fashion along a single fiber
forming quasi distributed sensor [1, 2]. FBG sensors can be produced in glass or
plastic optical fibers to meet harsh environmental conditions and structural demands
for a variety of applications. Due to their narrow-band wavelength reflection, they are
also conveniently multiplexed in fiber optic networks [7]. Because of the wavelength-
encoded nature, FBG based sensors offer several advantages over competing

Fiber Bragg Grating Chemical Sensor
82
conventional methods. They can perform the functions of virtually any conventional
sensor; often faster and with greater sensitivity and they can perform measurement
tasks that would be impractical with conventional sensors. They are real-time,
repeatable and reusable and have the ability to perform quasi-distributed (multipoint)
sensing through the use of multiplexing [8]. They also allow remote operation.
Compared to other variations of the fiber optic sensors, spectrally based sensors such
as FBGs are inherently resistant to errors induced by intensity variations. Potential
error sources include variable losses due to connectors and splices, microbending loss,
mechanical creep and misalignment of light sources and detectors [9, 10]. In the race
with conventional sensors, fiber Bragg grating sensors have created a special position.
Fiber gratings have been embedded in composite materials for smart structures
monitoring and tested with civil structures to monitor load levels. They have also been
successfully tested as acoustic sensing arrays. Fiber Bragg grating sensors have
gained wide acceptance for structural health monitoring applications for the
measurement of strain, stress, vibration, acoustics, acceleration, pressure and
temperature in various fields like defense, aviation, automobile, civil structures,
petrochemical industries, etc. It can be easily cast, embedded or surface mounted on a
structure or packaged in strong, rugged materials to withstand harsh environments.
Central Glass and Ceramic Research Institute (CGCRI), Kolkata has
demonstrated on-line monitoring of temperature of overhead high voltage power
conductors with fiber Bragg-grating based sensors at the Kolkata power grid [11].
Many commercial companies in Europe have developed sensors based on fiber
Bragg gratings that include temperature sensors, strain sensors and extensometers
ready to be embedded or retrofitted on the structure to be monitored. SCAIME is a
company that released FBG based temperature sensors in the range -30OC to +50OC

Fiber Bragg Grating Chemical Sensor
83
and -30OC to +80
OC with precession 0.5
OC and 1
OC respectively. With AdvOptics,
SCAIME has developed and installed fiber optic extensometers on the new fleet of
the Monaco harbor, both under sea level and in the structure surface [12]. O/E Land
INC, UK is another company that has developed temperature sensor in the range
-50OC to 120OC with resolution of 1OC and they are commercially available in
market. These new fiber grating temperature sensors can be widely used in
construction, aerospace, electrical, petrochemical, biomedical, nuclear power station
and other industry applications. Depending on the packaging material they can be
used for different applications. The company has come up with FBG sensors having
stainless steel jacket for harsh environment; also with Teflon material and with
ceramic material suitable for non metal applications like high voltage transformer,
micro wave and strong electromagnetic field, as well as high temperature applications
[13].
The variables measured by a FBG sensor can be expanded using an additional
sensitive material or a transducer, which strains the Bragg grating under an external
influence. Several examples of chemical detection with FBGs such as hydrogen gas
sensing using a palladium-coated FBG, measuring salinity using hydrogels and
detecting hydrocarbon leaks using polymers [14, 15] have been demonstrated. A fiber
optic based humidity sensor has been fabricated using FBG coated with polymide to
assess moisture levels in 200 year old limestone walls around Worcester College,
Oxford [16]. This humidity sensor was based on the strain effect induced in the Bragg
grating through the swelling of the moisture sensitive polymer coating. A direct
indication of the humidity level is given by the shift of the Bragg wavelength caused
by the expansion of the sensing material. FBG chemical sensors are in developing
stage; even though some FBG chemical sensors are demonstrated, lot of research is

Fiber Bragg Grating Chemical Sensor
84
still needed in aspect such as packaging, repeatability, reliability to commercialize
them.
3.1.1 FBG Chemical Sensors
Refractive index of a compound depends upon its chemical composition. Hence,
in biological and chemical sensing area refractive index (RI) is an important
parameter. Fiber gratings have provided good solutions in this area, because FBG
chemical sensors and biosensors are based on RI induced detection. Normal FBG is
intrinsically insensitive to external refractive index. The existing FBG RI sensors are
based on the interaction between the evanescent field of the core mode and
surrounding material. Therefore either cladding should be removed [17, 18] or
special kind of fibers like D-fiber [19] or side polished fiber [20] can be used to
design FBG chemical sensors. Wei Liang et al. proposed fiber Fabry-Perot
interferometer where, interferometer sensor is fabricated by removing cladding of the
fiber between two identical FBGs. The sensor is used to measure refractive index of
isopropyl alcohol of different concentrations [17, 21]. Although the interferometric
sensor is sensitive even for low concentration, it cannot act as point sensor. Fiber
Bragg Gratings have also proved promising candidates in the field of chemical
sensors as RI sensors and solution concentration sensors using many designs [22-24].
The principle of operation of FBG sensor relies on the dependence of the Bragg
resonance on effective refractive index and the grating pitch. In FBG chemical
sensors, pitch of the grating is unaltered as chemicals at room temperature cannot
change the pitch. Hence, effective refractive index of core mode has fundamental role
to play in FBG chemical sensors. Since the effective refractive index is not influenced
by the external medium for standard optical fibers, no sensitivity to external refractive
index is expected. However, if the fiber cladding diameter is reduced along the

Fiber Bragg Grating Chemical Sensor
85
grating region, the effective refractive index of the core mode is significantly affected
by external refractive index. As a consequence, shifts in the Bragg wavelength
combined with a modulation of the reflected amplitude are expected [25]. We apply
the wet chemical etching process to reduce the cladding diameter over Bragg grating
region to design FBG based chemical sensor.
3.2. Theory of FBG Chemical Sensor
In optical fibers, the effective refractive index (neff) of the fundamental mode is
practically independent of the refractive index of the medium surrounding the
cladding. However, if the cladding diameter is reduced, neff shows dependence on the
external refractive index, leading to a shift in the reflected wavelength (λB). Unlike
the FBG sensors for temperature and strain measurements, in this case, only the
refractive index is affected by measurand, neff changes while the grating pitch is
practically unchanged. As external refractive index increases, higher sensitivity is
observed, since the fundamental mode is less confined in the core region leading to an
increased interaction with the external medium. In addition, such interaction increases
the sensor sensitivity as cladding diameter is reduced.
The FBG works on the principle of Bragg reflection by reflecting Bragg
wavelength (λB) given by [1, 2, 26]
λB = 2 neff Λ (3.1)
where neff is the effective refractive index of the core and Λ is grating period. The
reflected wavelength mainly depends on grating pitch and effective refractive index.
The change of Bragg wavelength due to the changes in measurand is used in FBG
sensing applications. As such FBG is unaffected by surrounding RI, since the
reflected spectrum is result of coupling of core bound mode with backward

Fiber Bragg Grating Chemical Sensor
86
propagating modes. In FBG chemical sensors, the change of Bragg wavelength is due
to change in RI induced by change in the chemical composition around the sensor. In
order to measure small changes in composition, it is important for the optical mode to
penetrate evanescently into the surrounding solution. To design the FBG chemical
sensor, the cladding above the grating region should be etched so that core mode
interacts with external medium immediately surrounding the core. This can be done
by etching the fiber cladding above the grating region to a diameter such that core
mode interacts with the surrounding environment. With this configuration the value of
effective refractive index of the waveguide mode is directly affected by the RI of the
medium where the fiber is immersed. When the optical fiber is etched to a point
where the fundamental waveguide mode is affected, the modified propagation
constant of the mode can be written as [27-29]
(3.2)
where effn)/2(0 λπβ = is propagation constant of core mode under normal
conditions, surn is RI of surrounding medium, cln is RI of cladding, k is wave vector,
pη is the fraction of the total power of unperturbed fundamental mode that flows in
the etched region and therefore lost to the surrounding medium. If pA is area of the
cross section of the etched region, then pη is given by [29],
∫
∫
∞
=
A
A
pdA
dA
p
2
2
ψ
ψ
η (3.3)
where ∞A is area of cross section of unetched fiber and ψ is wave function of
fundamental mode in weakly guiding circular fiber with step index profile, defined
as[29]
)(0 clsurp nnk −+= ηββ

Fiber Bragg Grating Chemical Sensor
87
,)(
)(
0
0
UJ
URJ=ψ 0 ≤ R ≤ 1 (3.4)
,
)(
)(
0
0
WK
WRK=ψ 0<R<∞ (3.5)
Here, R=r/ρ where ‘r’ is the fiber radius and ρ is the core radius, J0 is the Bessel
function of first kind and K0 is modified Bessel function of second kind. U and W are
the scalar mode parameters for the fiber core and cladding respectively.
Due to the power loss that occurs in the etched region of the fiber, the reflected
power of the FBG decreases when the fiber radius becomes smaller. After certain
stage, decrease of fiber radius due to etching will also have consequences on the value
of Bragg wavelength because the effective refractive index of the core mode begins to
change. If 1pη and 2pη are two values of pη at two different diameters of etched fiber,
from equation 3.2 the associated variation of the modified propagation constant of the
fundamental mode would be
(3.6)
From definition of propagation constant, this equation indicates that there is a
variation in the effective RI of the waveguide mode is given by
η∂∂=∂ nneff (3.7)
where clsur nnn −=∂ and 21 pp ηηη −=∂
Combining equations 3.1 and 3.7
ηλ ∂∂Λ=∂Λ=∂ nneffB 22 (3.8)
The above equation indicates that the etching process is associated with variation of
Bragg wavelength of the FBG given by
))(( 2112 clsurpp nnk −−=− ηηββ

Fiber Bragg Grating Chemical Sensor
88
effB n∂Λ=∂ 2λ (3.9)
When etching process is stopped, pη becomes constant value and equation (3.9)
becomes
)(2 clsurpoB nn −Λ=∂ ηλ (3.10)
In this stage, the variation of the Bragg wavelength of FBG depends only on the
variation of the refractive index of the surrounding medium. Unlike in pressure,
temperature or strain sensor, in FBG chemical sensor only the effective RI is affected
while the gratings pitch is practically unchanged. It is considered that temperature of
the medium surrounding FBG is maintained at constant room temperature (25OC).
This constitutes the principle of chemical sensing by FBG.
3.3 FBG Chemical Sensor Fabrication
Fiber Bragg grating fabricated in boron-germanium co-doped single mode fiber
with Bragg wavelength (λB) centered at 1546.96nm was used to design chemical
sensor. As mentioned before, FBG as such is insensitive to the surrounding RI with
cladding above the grating region. To fabricate chemical sensor, cladding above the
FBG region was etched. Cladding was etched by dipping the segment of FBG in 40%
HF solution for 55minutes. In order to etch the cladding, a groove was made in candle
that holds the FBG. The groove was filled with 40% HF solution. In the beginning no
shift of the Bragg wavelength was observed, because there was no interaction of the
core mode with outer surrounding medium. After some time, when cladding diameter
is decreased to certain extent, the evanescent wave of core mode starts reacting with
the external medium leading to shift in the Bragg wavelength. At regular intervals
Bragg reflected spectrum was recorded. During etching, blue shift in Bragg
wavelength was observed. This is related to monotonic decrease in the effective
Fiber Bragg Grating Chemical Sensor
89
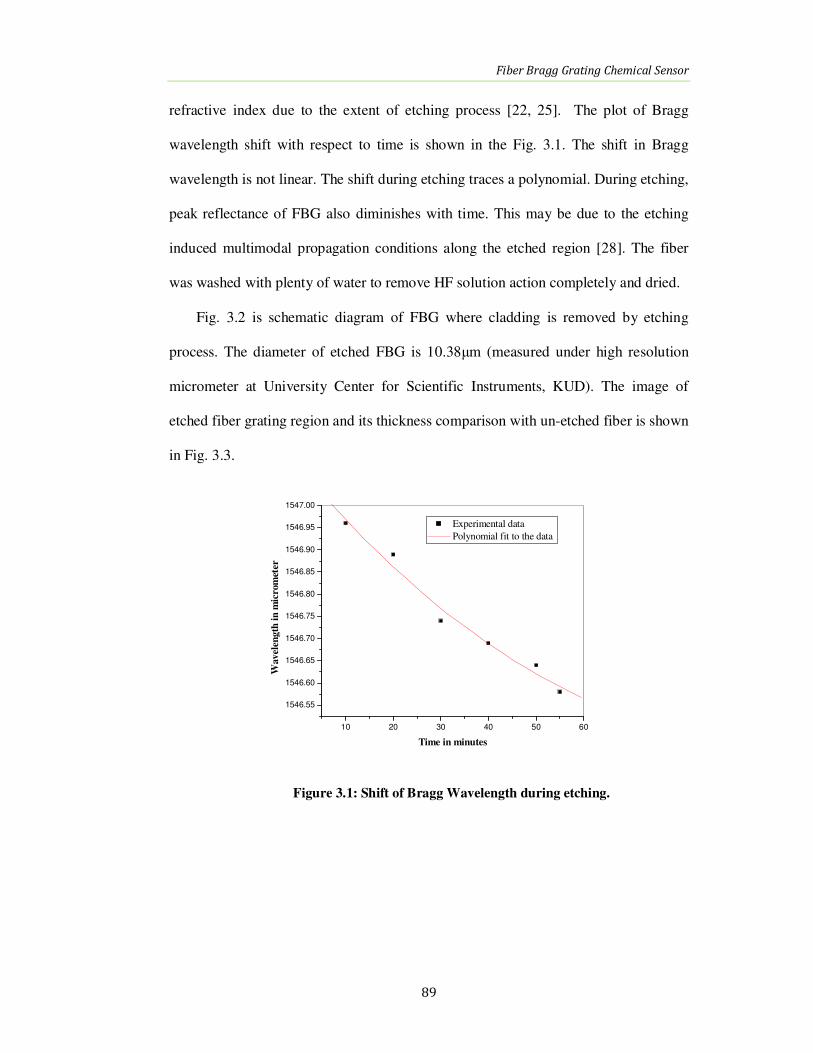
refractive index due to the extent of etching process [22, 25]. The plot of Bragg
wavelength shift with respect to time is shown in the Fig. 3.1. The shift in Bragg
wavelength is not linear. The shift during etching traces a polynomial. During etching,
peak reflectance of FBG also diminishes with time. This may be due to the etching
induced multimodal propagation conditions along the etched region [28]. The fiber
was washed with plenty of water to remove HF solution action completely and dried.
Fig. 3.2 is schematic diagram of FBG where cladding is removed by etching
process. The diameter of etched FBG is 10.38µm (measured under high resolution
micrometer at University Center for Scientific Instruments, KUD). The image of
etched fiber grating region and its thickness comparison with un-etched fiber is shown
in Fig. 3.3.
10 20 30 40 50 60
1546.55
1546.60
1546.65
1546.70
1546.75
1546.80
1546.85
1546.90
1546.95
1547.00
Wav
elen
gth
in
mic
rom
eter
Time in minutes
Experimental data
Polynomial fit to the data
Figure 3.1: Shift of Bragg Wavelength during etching.

Fiber Bragg Grating Chemical Sensor
90
Fig. 3.2: Schematic of cladding etched above the grating region.
Cladding etched FBG Comparison of cladding etched FBG with optical fiber
Figure 3.3: FBG etched in 40% HF solution.
3.4 Design of FBG Chemical Sensor
Now in cladding removed FBG, the evanescent field of core mode interacts with
surrounding medium. Hence, this cladding etched FBG is directly employed for
chemical sensing – alcohol sensor and manganese sensor.
3.4.1 Alcohol sensor
3.4.1.1 Alcohols
Alcohols are compounds in which one or more hydrogen atoms in an alkane have
been replaced by an -OH group. Alcohols with less number of carbon atoms (<5) are
used as common laboratory solvents and also solvents in paints, markers and
cosmetics such as perfume and deodorant. Most of the alcohols are used as additives
for petrol.
Cladding etched
grating region
Core Cladding
Fiber Bragg Grating Chemical Sensor
91
Methanol as common laboratory solvent is especially useful for High
Performance Liquid chromatography (HPLC) and UV/VIS spectroscopy. Methanol is
used as starting compound in the synthesis of other chemicals such as formaldehyde
and from there into products like plastics, plywood, paints, explosives and permanent
press textiles. Other chemical derivatives of methanol include dimethyl ether, which
has replaced chlorofluorocarbons as an aerosol spray propellant; dimethyl ether that
can be mixed with liquefied petroleum gas for cooking and can be used as a diesel
replacement for transportation fuel. One of the potential drawbacks of using high
concentrations of methanol in fuel is the corrosive to some metals. It is poisonous and
causes death in humans if consumed in high quantity. Methanol is also used as a
solvent and as antifreeze in pipelines and windshield washer fluid. Methanol is mixed
with water and injected into high performance diesel and petrol engines for an
increase of power and a decrease in intake air temperature in a process known as
water methanol injection [30].
In many countries like Brazil and Australia ethanol is directly used as motor fuel.
Ethanol as fuel reduces emission of harmful products such as carbon monoxide,
oxides of nitrogen and other ozone forming pollutants emitted by petroleum products
as petrol and diesel. Major application of ethanol is in beverage industry. Ethanol is
also used as antiseptic as it kills bacteria, fungi and viruses by denaturing its proteins
and dissolving lipids. Ethanol has many industrial applications [31].
Propanol is used as a solvent for waxes, vegetable oils, resins, cellulose esters
and ethers. It is found in inks, brake fluids and polishing compounds those have been
used as degreasing agent, antiseptic and a chemical intermediate for synthesis of
organic compounds. More recently, it is being used as a hand disinfectant by health
care workers [32].
Fiber Bragg Grating Chemical Sensor
92
Butanol is used as an ingredient in perfumes and as a solvent for the extraction of
antibiotics, hormones and vitamins during the manufacture; as solvent for paints,
coatings, natural resins, gums, synthetic resins, dyes, alkaloids and camphor. Other
miscellaneous applications of butanol are as a swelling agent in textiles, as a
component of hydraulic brake fluids, cleaning formulations, degreasers and
repellents; and as a component of ore floation agents and of wood-treating systems.
Butanol has been proposed as a substitute for diesel fuel and petrol. Used as starting
chemical, butanol is transformed into a variety of other chemicals, such as butyl
acrylate, butyl methacrylate, butyl glycol ethers and butyl acetate which have further
industrial applications [33].
Octanol is manufactured for the synthesis of esters those used in perfumes and
flavorings. It is used to model the partitioning of pharmaceutical products between
water and the cytosol. Other uses include experimental medical procedures for
controlling nervous disorder known as Essential Tremor and other types of
involuntary neurological tremors [34, 35].
3.4.1.2 Experiment
In this experiment we chose first members of homologous alcohol series -
methanol, ethanol, propanol, butanol and octanol. The refractive index of these
alcohols increases with increase in carbon atoms in the compound.
The experimental setup of FBG alcohol sensor is shown in Fig.3.4. The broad
band light from JDS Uniphase source is launched into FBG through 2X2 coupler
(3dB coupler). FBG sensor was inserted in test tube containing different alcohols
carefully one after the other. During experiment care was taken so that FBG sensor
head was freely and completely dipped in alcohol without touching the wall of the
container. FBG sensor was dipped in the alcohol for a minute to stabilize the spectrum

Fiber Bragg Grating Chemical Sensor
93
before recording. Grating spectra measurement have been carried out by recording
reflected spectrum from the sensing grating for each alcohol sample. The reflected
spectrum of FBG sensor was observed and recorded using Anritsu OSA (MS90A) for
every alcohol solvent. Fig. 3.5 shows reflected spectra of FBG sensor for different
alcohols.
Figure 3.4: Experimental setup of FBG alcohol sensor.
Figure 3.5: FBG reflected spectra for different alcohols.
FBG sensor
immersed
in alcohol

Fiber Bragg Grating Chemical Sensor
94
3.4.1.3 Results and Discussion
When we put FBG sensor in different alcohols i.e. methanol (n=1.328), ethanol
(n=1.361), propanol (n=1.385), butanol (n=1.398) and octanol (n=1.429), the reflected
spectra is shown in the Fig.3.5. The reflected spectra show the red shift as the ambient
refractive index increases. When ambient liquid changed from methanol to octanol,
ambient refractive index changed from 1.328 to 1.429 resulting into Bragg
wavelength shift from 1546.41nm to 1546.49nm. Refractive index of ethanol,
propanol and butanol vary between1.328 to 1.429. Bragg wavelength shift is linear
with refractive index in our experimental verification. Fig. 3.6 shows the Bragg
wavelength (λB) shift as function of refractive index of alcohol. λB is almost linear
with standard deviation of 0.0056 and correlation factor 0.987 for least square linear
fit to the experimental data. The slope is 0.8156. Hence, the sensitivity of the alcohol
sensor is 0.8156nm/RIU.
1.32 1.34 1.36 1.38 1.40 1.42 1.44
1546.40
1546.42
1546.44
1546.46
1546.48
1546.50
Octanol
Butanol
Propanol
Ethanol
Methanol
Bra
gg W
ave
leng
th (
nm
)
Refractive index
Alcohols
Linear Fit
Figure 3.6: Bragg wavelength shift in alcohol series.

Fiber Bragg Grating Chemical Sensor
95
3.4.2 Manganese Sensor
3.4.2.1 Manganese in Water
Manganese is a component of several enzyme systems and is essential for normal
bone structure. Intake varies greatly depending mainly on the consumption of rich
sources, such as unrefined cereals, green leafy vegetables and tea. The usual intake of
this mineral is 2–5mg/day and absorption is 5–10%. Different techniques have been
proposed for the determination of manganese concentration.
Manganese is present in ground waters primarily as the divalent ion (Mn2+
), due to
the lack of subsurface oxygen. Surface waters may contain combinations of
manganese in various oxidation states as soluble complexes or as suspended particles.
The occurrence of manganese in public water supplies presents more of an aesthetic
problem than a potential health hazard. Mn is an element essential to humans, animals
and plants for proper functioning of some enzymes and hormones. Although most
amounts of Mn supplied to the body is through food, it also enters the body through
water. Even though ground has excellent mechanism of filtering out dissolved
chemicals and gases, they can still occur in large enough concentrations to cause
problems. In low concentrations it produces extremely objectionable stains due to
oxidation on everything with which it comes in contact. Deposits collect in pipelines
and tap water may contain black sediment and turbidity due to precipitated manganese
[36]. Higher concentration of Mn in water may bring about various health related
problems in both animals and plants. Adverse neurological effects (decreased
performance in school and in neurobehavioral examinations of the WHO core test
battery) were reported in 11 to 13year-old children who were exposed to excess
manganese through ingestion of contaminated water and from wheat fertilized with
sewage water [36-40]. Long term studies concluded that progressive increases in the

Fiber Bragg Grating Chemical Sensor
96
manganese concentration in drinking-water are associated with a progressively higher
prevalence of neurological problems of chronic manganese poisoning [41]. Contrary
to the above study, another long-term drinking-water study found no neurological
effects were found in older people consuming well water containing at least 0.3 mg of
manganese per liter for 10–40 years [42]. It is found from research on animals that the
higher concentration of manganese input (via food or water) brings about many
complications such as neurotoxicity, reproductive problems. Manganese causes dark
stains in laundry and on plumbing fixtures, tends to deposit in water lines and imparts
an objectionable taste to beverages such as coffee and tea. Manganese levels in
natural waters rarely exceed 1ppm, but levels of 0.1ppm are sufficient to cause the
taste and staining problems. World Health Organization recommends a limit of
0.05ppm manganese in consumer usable water, although this may vary with local
circumstances.
3.4.2.2 Instruments used for Comparison
We designed chemical sensors to determine the concentration of dissolved
chemical species in water present at ppm level. Our results were compared with well
established sophisticated spectroscopic instruments - atomic absorption spectrometer
and inductively coupled plasma spectrometer.
Atomic Absorption Spectrometer
Atomic absorption spectroscopy (AAS) is the measurement of absorption of
optical radiation by atoms in the gaseous state. The original equipment was developed
by Walsh. Majority of free atoms in the commonly used flames are in ground state.
The flames also not have enough energy to excite these atoms (except for Group I
elements of the periodic table). A light source emitting a narrow spectral line of the
characteristic energy is used to excite the free atoms formed in the flame. The

Fiber Bragg Grating Chemical Sensor
97
decrease in energy (absorption) is then measured. The absorption is proportional to
concentration of free atoms in the flame. Atomic absorption spectroscopy is similar to
UV-VIS spectroscopy and Lambert-Beer’s law is applicable. Photograph of AAS in
our University Center for Scientific Instruments (USIC) is shown in Fig. 3.7.
There are three basic components for every AA spectrophotometer:
1. Light source - It is designed to emit the atomic spectrum of a particular element.
Specific lamps are selected according to the element to be determined. The hollow
cathode lamp (HCL) or electrodeless lamps (EDL) are widely used.
2. Sample cell - Where an atomic sample vapor is generated in the light beam from
the source. This is usually done by introducing the sample into a burner system
(flame) or electrically heated furnace or platform, aligned in the optical path of the
spectrophotometer.
3. Specific light measurement - Includes several components:
a) A monochromator to disperse several wavelengths of lights that are emitted
from the light source to isolate a particular line of interest.
b) A detector to produce an electrical current that is dependent on the light
intensity. This electrical current is amplified and processed by the
instrument electronics to produce a signal, which is a measure of the light
attenuation occurring in the sample cell.
c) The signal is further processed to generate instrument readout in
concentration units.

Fiber Bragg Grating Chemical Sensor
98
Figure. 3.7: Atomic absorption spectrometer.
Inductively Coupled Plasma Spectrometer
Inductively coupled plasma spectrometry (ICPS) is a powerful tool for the
determination of metals in a variety of different sample matrices. With this technique,
liquid samples are injected into a radiofrequency (RF)-induced argon plasma using
one of a variety of nebulizers or sample introduction techniques. The sample mist
reaching the plasma is quickly dried vaporized and energized through collisional
excitation at high temperature. The atomic emission emanating from the plasma is
viewed in either a radial or axial configuration, collected with a lens or mirror and
imaged onto the entrance slit of a wavelength selection device. Single element
measurements can be performed cost effectively with a simple
monochromator/photomultiplier tube (PMT) combination and simultaneous
multielement determinations are performed for up to 70 elements with the
combination of a polychromator and an array detector. The analytical performance of
such systems is competitive with most other inorganic analysis techniques, especially
with regards to sample throughput and sensitivity. We made ICP measurements at
Met-Chem Laboratories, Bangalore. ICP spectrometer is shown in Fig. 7.8.

Fiber Bragg Grating Chemical Sensor
99
Inductively Coupled Plasma Spectrometer (ICPS) has components such as the
nebulizer, spray chamber, plasma torch, interface and detector.
Figure 3.8: Inductively coupled plasma spectrometer
3.4.2.3 Experiment
Standard solutions of manganese concentrations varying from zero to 0.09ppm
(0.02, 0.04, 0.06, 0.09ppm) were prepared by dissolving manganese chloride in
distilled water. To 8ml of each standard solution and test sample (collected ground
water) pinch of ascorbic acid was added and swirled vigorously until ascorbic acid
dissolves completely. Then 2ml of ammonium hydroxide was added and mixed
vigorously. Then to each solution, three drops of potassium cyanide (KCN) and N,N
dimethylformamide were added one after the other. Later 0.25ml of 1-(2-pyridylazo)-
2-napthol (PAN) indicator was added swiftly with pipette and mixed immediately and
left for 10minutes to complete the reaction. Light orange solution will form if Mn2+
is
present.
Ascorbic acid reduces all oxidized forms of manganese into Mn2+. Ammonium
hydroxide is added to maintain the alkaline pH of the solution. Iron, cadmium, zinc,
cobalt and nickel present in the test sample can be effectively masked with potassium

Fiber Bragg Grating Chemical Sensor
100
cyanide. N,N dimethylformamide is added to catalyze the reaction. PAN combines
with Mn2+
to form orange colour complex compound. If PAN indicator is added
slowly, turbidity will be formed. The chemical reaction of formation of complex is
given below [43].
Orange complex compound (soluble in water)
All standard and test samples along with reagents were allowed for
measurements. Optoelectronics setup for concentration measurement comprises of
17mW broad band source of wavelength range 1530-1600nm, 3dB coupler to collect
reflected signal form sensor head, OSA (Wistom with Proximion software). Fig. 3.9
shows the experimental setup. FBG sensor head connected to broad band source was
immersed in a test tube containing solution for the measurement and allowed for a
minute to stabilize the spectrum. Reflected spectrum was recorded on OSA for all
samples one after the other. Each time, the grating region was cleaned properly with
isopropyl alcohol before inserting in a manganese solution of different concentrations
to avoid contamination. When the FBG sensor is dipped in manganese solutions of
different concentrations, the medium surrounding sensor is head changed. Hence, the

Fiber Bragg Grating Chemical Sensor
101
effective refractive index of FBG core mode changes, resulting in shift in Bragg
wavelength (λB). Fig. 3.10 shows the combined reflected spectra of FBG for different
concentrations of manganese with reagents. The experiment was carried out at room
temperature.
Figure 3.9: Experimental setup for FBG manganese concentration sensor.
1545.50 1545.75 1546.00 1546.25 1546.50 1546.75 1547.00
0
2
4
6
8
10
12
14
16
18
Reflecte
d P
ow
er
(mic
row
att)
Wavelength (nm)
Water
0.02ppm
0.04ppm
0.06ppm
0.09ppm
Test sample
Figure 3.10: Reflected spectra overlap for different Manganese concentrations.
Fiber Bragg Grating Chemical Sensor
102
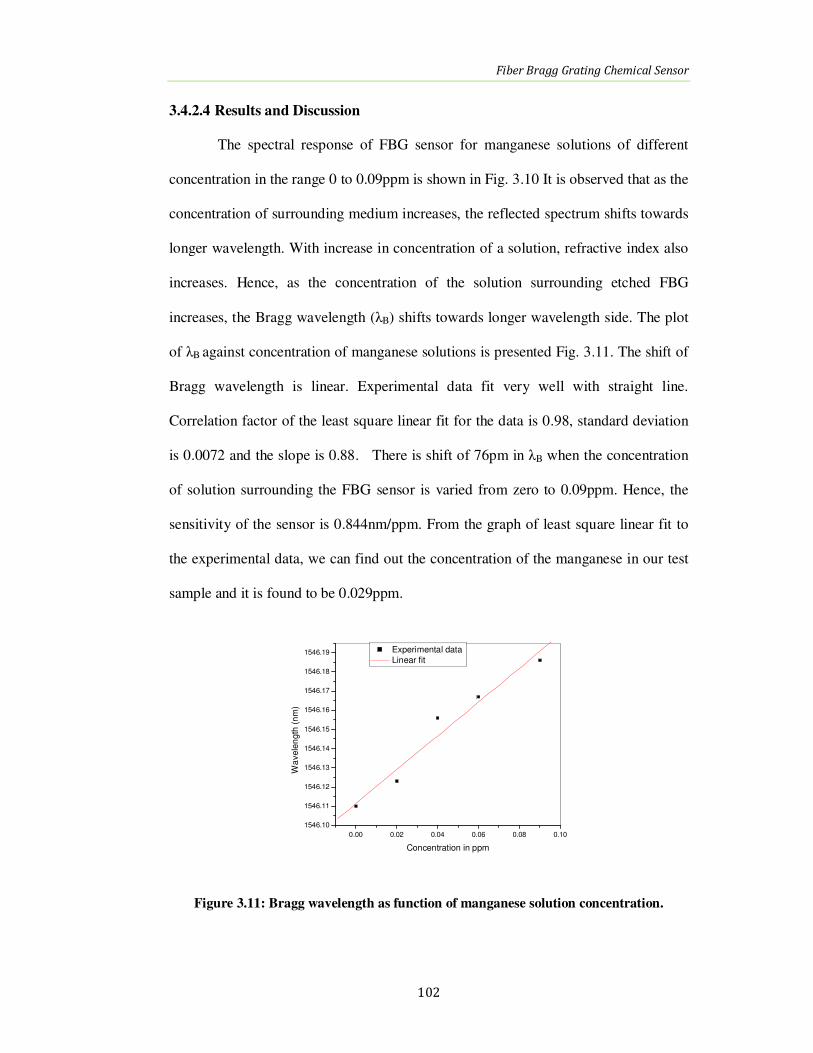
3.4.2.4 Results and Discussion
The spectral response of FBG sensor for manganese solutions of different
concentration in the range 0 to 0.09ppm is shown in Fig. 3.10 It is observed that as the
concentration of surrounding medium increases, the reflected spectrum shifts towards
longer wavelength. With increase in concentration of a solution, refractive index also
increases. Hence, as the concentration of the solution surrounding etched FBG
increases, the Bragg wavelength (λB) shifts towards longer wavelength side. The plot
of λB against concentration of manganese solutions is presented Fig. 3.11. The shift of
Bragg wavelength is linear. Experimental data fit very well with straight line.
Correlation factor of the least square linear fit for the data is 0.98, standard deviation
is 0.0072 and the slope is 0.88. There is shift of 76pm in λB when the concentration
of solution surrounding the FBG sensor is varied from zero to 0.09ppm. Hence, the
sensitivity of the sensor is 0.844nm/ppm. From the graph of least square linear fit to
the experimental data, we can find out the concentration of the manganese in our test
sample and it is found to be 0.029ppm.
0.00 0.02 0.04 0.06 0.08 0.10
1546.10
1546.11
1546.12
1546.13
1546.14
1546.15
1546.16
1546.17
1546.18
1546.19
Wa
vele
ngth
(n
m)
Concentration in ppm
Experimental data
Linear fit
Figure 3.11: Bragg wavelength as function of manganese solution concentration.

Fiber Bragg Grating Chemical Sensor
103
0.00 0.02 0.04 0.06 0.08 0.10
1.3
1.4
1.5
1.6
1.7
1.8
Pea
k P
ow
er
(mic
row
att)
Concentration of Mn Solution (ppm)
Experimental data Linear fit
Figure 3.12: Peak power of λB as function of manganese solution concentration.
On observing spectral response of FBG for different concentrations of manganese
solution (Fig. 3.10), the peak power of Bragg wavelength also shows linear behavior.
As concentration of solution increases, the RI of medium surrounding solution also
increases. Hence, more evanescent field of core mode penetrates into the surrounding
medium and reflected power decrease. With the increase in concentration of
manganese solution, the reflected power for FBG decreases. The graph of peak power
as function of solution concentration is plotted in Fig. 3.12. The peak power at
different concentrations can be fitted to least square linear fit with very high
correlation factor of 0.999 and minimum standard deviation – 0.0074.
3.5. Conclusions
A simple and low cost FBG chemical sensor is presented on the principle of
refractive index variation. We have combined FBG and wet chemical etching
technique of silica to demonstrate FBG as alcohol sensor and manganese
concentration sensor. A simple and low cost procedure involving wet chemical

Fiber Bragg Grating Chemical Sensor
104
etching of cladding in 40% HF solution is carried out for the sensor preparation. The
experimental characterization of the FBG sensor for refractive index change and
solution concentration change has been carried out.
In the investigated refractive index range of 1.328-1.427 for alcohols, the Bragg
wavelength shifts from 1546.41 to 1546.49nm. Thus the refractive index sensitivity of
fabricated FBG sensor is 0.8156nm/RIU.
We have determined the concentration of dissolved manganese in the ground
water (test sample) present at ppm level using our designed FBG chemical sensor
fabricated in boron co-doped single mode optical fiber. The manganese concentration
is found to be 0.029ppm. This result is compared with measurement done using
highly sophisticated and reliable atomic absorption spectrometer in our university and
also with inductively coupled plasma method. The comparison is given in the Table
3.1 and results are in agreement. The sensitivity of chemical sensor is found to be
0.844nm/ppm.
This highly flexible, robust, sensitive FBG chemical sensor is addition to the
already established list of FBG sensors. It can be applied to many fields, including
biochemical sensing and environmental monitoring.
@measurement was made in USIC (University Scientific Instrument Center, Karnatak University
Dharwad, India.)
**Measurement was made at Met – Chem Laboratories, Bangalore. (India Pvt. Ltd.).
Table 3.1: Manganese concentration measured with different methods
Chemical
Species
FBG Sensor
(ppm)
Atomic absorption
Spectrometer@
(ppm)
Inductive coupled
plasma**
(ppm)
WHO
Permissible
Limit
(ppm)
Manganese 0.029 0.048 <0.05 0.05

Fiber Bragg Grating Chemical Sensor
105
Reference
1. Andreas Othonos, “Fiber Bragg gratings,” Review of Scientific Instruments,
68, pp. 4309-4341, (1997)
2. Y. J. Rao, “In-fiber Bragg grating sensors,” Measurement Science &
Technology, 8, pp. 322-375, (1997).
3. X. Dong, Y. Liu, Z. Liu and X. Dong, “Simultaneous Displacement and
Temperature Measurement with Cantilever Based Fiber Bragg Grating
Sensor,” Optics Communications, 192, pp.213-217, (2001).
4. T. A. Berkoff and A. D. Kersey, “Experimental Demonstration of Fiber
Bragg Grating Accelerometer,” IEEE Photonics Technology Letters 8 (12),
pp.1677-1679, (1996).
5. M. G. Xu, L. Reekie, Y. T. Chow and J. P. Dakin, “Optical in- Fiber Grating
High Pressure Sensor,” Electron. Letters, 29, pp.398-399, (1993).
6. Nobuaki et al. (1997), “Under Water Acoustic Sensor With fiber Bragg
Grating,” Optics Review, 4(6), pp.691-694,(1993).
7. Xinyong Dong, Xiufeng Yang, Chun-Liu Zhao, Lei Ding, P Shum and N Q
Ngo “A novel temperature-insensitive fiber Bragg grating sensor for
displacement Measurement,” Smart Material Structure, 14, pp.N7-N10,
(2005).
8. D. Viegas, M. Hernandez, J. Goicoechea, J. L. Santos, F. M. Araújo, F.
Arregui and I. R. Matias, “Simultaneous Measurement of Humidity and
Temperature Based on an SiO2-Nanospheres Film Deposited on a Long-Period
Grating In-Line With a Fiber Bragg Grating,” IEEE Sensors Journal, 11,
pp.162-166, (2011).
9. B. Culshaw, “Optical fiber sensor technologies: opportunities and-perhaps
pitfalls,” IEEE J. Lightwave Tech., 22(1), pp. 39–50, (2004).
10. B. Lee, “Review of the present status of optical fiber sensors,” Optical Fiber
Technology, 9, pp. 57–79, (2003)
11. Leif Bjerkan, Tarun Kumar Gangopadhyay, Kamal Dasgupta, Somnath
Bandyopadhyay, Palas Biswas, Shyamal Kumar Bhadra and Himadri Shekar
Maiti, “A device for on-line monitoring of temperature of overhead high
voltage power conductors with fibre-optic (fibre Bragg-grating based)

Fiber Bragg Grating Chemical Sensor
106
sensors,” FOr. 0135NF2009/IN, Filing date: 31/08/2009, Indian Patent Appl.
No. 0891DEL2010, Norwegian Patent Appln. No. 20091450/ dt.15.04.2009.
12. http://www.scaime.com.
13. http://www.OE-land FBGTemp sensor.htm.
14. B. Sutapun, M. Tabib-Azar and A. Kazemi, “Pd-coated elasto optic fiber optic
Bragg grating sensors for multiplexed hydrogen sensing,” Sens. Actuators B
Chem., 60(6), pp. 27–34, (1999).
15. J. Cong, X. Zhang, K. Chen and J. Xu, “Fiber optic Bragg grating sensor
based on hydrogels for measuring salinity,” Sens. Actuators B Chem., 87,pp.
487–490, (2002).
16. T. L. Yeo, T. Sun, K. T. V. Grattan, D. Parry, R. Lade and B. D. Powell,
“Characterisation of a polymer-coated fibre Bragg grating sensor for relative
humidity sensing,” Sens. Actuators B Chem., 110, pp. 148–156, (2005).
17. Agostino Iadicicco, Stefania Campopiano, , Antonello Cutolo, Michele
Giordano and Andrea Cusano “refractive index sensor based on
microstructured fiber Bragg grating” IEEE Photonics Technology Letters, 17,
pp.1250-1252, (2005)
18. Wei Liang, Yanyi Huang, Yong Xu, Reginald K. Lee and Amnon Yariv,
“Highly sensitive fiber Bragg grating refractive index sensors” Applied
Physics Letters, 86, 151122, (2005).
19. K. Zhou, X. Chen and L. Zhang, I. Bennion, “High-sensitivity optical
chemsensor based on etched D-fibre Bragg gratings,” Electron. Letters, 40,
pp.232-234, (2004).
20. Schroeder K, Ecke W, Mueller R, Willsch R and Andreev A “A fibre Bragg
grating refractometer” Meaurement Science and Technology, 12, pp.757–764,
(2001).
21. Gregory B. Tait , Gary C. Tepper, Dmitry Pestov and Patrick M. Boland,
“Fiber Bragg grating multi-functional chemical sensor,” Chemical and
Biological Sensors for Industrial and Environmental Security- SPIE
Proceedings, 5994, ID 599407, (2005).
22. Iadicicco A., Cusano A., Persiano G.V., Cutolo A., Bernini R., Fiordano M.,
“Refractive Index Measurements by Fiber Bragg Grating Sensor,” IEEE
Conference on Sensors, 1, pp.101-105, (2003).

Fiber Bragg Grating Chemical Sensor
107
23. Min Rong and Lian-shui Zhang “Liquid concentration measurement based on
the optoacoustic effect and fiber Bragg grating sensor technology,” Optical
Engineering, 45, 040501, (2006).
24. H. B. Liu, H. Y. Liu, G. D. Peng and P. L. Chu, “Optial chemosensor based on
etched tilted Bragg grating structures in multimode fiber,” IEEE Photonics
Technology Letters, 17, pp.159-161, (2006).
25. A. Iadicicco, A. Cusano, A. Cutolo, R. Bernini and M. Giordano, “Thinned
Fiber Bragg Gratings as High Sensitivity Refractive Index Sensor,” IEEE
Photonics Technology Letters, 16 (4), pp.1149-1151, (2004).
26. K. O. Hill and G. Meltz “Fiber Bragg grating technology fundamental and
overview,” J. Lightwave Technology, 15, pp.1263-1276, (1997).
27. A. Asseh, H. Ahlfetdt, B. Sahlgren and G. Edwall, “Fiber optical Bragg
grating refractometer,” Fiber and Integrated Optics, 17, pp.51-62, (1998).
28. D. A. Pereira, O. Frazzo and J. L. Santos, “Fiber Bragg grating sensing system
for simultaneous measurement of salinity and temperature,” Optical
Engineering, 43, pp.299-304, (2004).
29. A. W. Snyder and J. D. Love, “Optical Waveguide Theory,” Chapmann &
Hall, London, (1983).
30. http://en.wikipedia.org/wiki/Methanol
31. http://en.wikipedia.org/wiki/Methanol
32. http://en.wikipedia.org/wiki/n-ponanol
33. http://en.wikipedia.org/wiki/n-Butanol
34. K. O. Bushara, Goldstein SR, Grimes GJ Jr, A. H. Burstein and M. Hallett,
"Pilot trial of 1-octanol in essential tremor". Neurology, 62 (1), pp 122–124,
(2004).
35. http://en.wikipedia.org/wiki/Octanol
36. FreeDrinkingWater.com
(http://www.freedrinkingwater.com/water_quality/chemical/water-problems-
manganese.html).
37. M. M. Canavan and S. Cobb, C. Srinker, “Chronic Manganese Poisoning,”
Arch. Neurol. & Psy., 32, pp.501–512, (1934).
38. D. G. Cook, S. Fahn and K. A. Brait, “Chronic Manganese Intoxication,”
Archives in Neurology, 30, pp.59–64, (1974).
Fiber Bragg Grating Chemical Sensor
108
39. P. He, Liu DH and G. Q. Zhang, “Effects of High-level Manganese sewage
Irrigation on Children’s Neurobehavior,” Chin. J. Prev. Med. 28, pp.216–218,
(1994).
40. G. Zhang, D. Liu and P. He, “Effects of Manganese on Learning Abilities in
School Children,” Chinese J. Preventive Medicine, 29, pp.156–158, (1995).
41. Kondakis XG et al., “Possible health effects of high manganese concentration
in drinking water,” Arch. Environ. Health, 44, pp.175–178, (1989).
42. Vieregge P et al., “Long term exposure to manganese in rural well water has
no neurological effects,” Canadian J. Neurological Science, 22, pp.286–289,
(1995).
43. Katsumi Goto, Shigeru Taguchi, Yoko Fukue and Keiko Ohta
“Spectrophotometric determination of manganese with 1-(2-pyridylazo)-2-
naphthol and a non-ionic surfactant,” Talanta, 24 (12), pp. 752–753, (1977).